Abstract
Background:
Thymoma is a key risk factor for myasthenia gravis (MG). The purpose of our study was to investigate the potential key genes responsible for MG patients with thymoma.
Methods:
We obtained MG and thymoma dataset from GEO database. Differentially expressed genes (DEGs) were determined and functional enrichment analyses were conducted by R packages. Weighted gene co-expression network analysis (WGCNA) was used to screen out the crucial module genes related to thymoma. Candidate genes were obtained by integrating DEGs of MG and module genes. Subsequently, we identified several candidate key genes by machine learning for diagnosing MG patients with thymoma. The nomogram and receiver operating characteristics (ROC) curves were applied to assess the diagnostic value of candidate key genes. Finally, we investigated the infiltration of immunocytes and analyzed the relationship among key genes and immune cells.
Results:
We obtained 337 DEGs in MG dataset and 2150 DEGs in thymoma dataset. Biological function analyses indicated that DEGs of MG and thymoma were enriched in many common pathways. Black module (containing 207 genes) analyzed by WGCNA was considered as the most correlated with thymoma. Then, 12 candidate genes were identified by intersecting with MG DEGs and thymoma module genes as potential causes of thymoma-associated MG pathogenesis. Furthermore, five candidate key genes (JAM3, MS4A4A, MS4A6A, EGR1, and FOS) were screened out through integrating least absolute shrinkage and selection operator (LASSO) regression and Random forest (RF). The nomogram and ROC curves (area under the curve from 0.833 to 0.929) suggested all five candidate key genes had high diagnostic values. Finally, we found that five key genes and immune cell infiltrations presented varying degrees of correlation.
Conclusions:
Our study identified five key potential pathogenic genes that predisposed thymoma to the development of MG, which provided potential diagnostic biomarkers and promising therapeutic targets for MG patients with thymoma.
Keywords: Myasthenia gravis, thymoma, WGCNA, machine learning, immune infiltration
Introduction
Myasthenia gravis (MG) is an acquired autoimmune disease of neuro–muscle junction transmission disorders caused by autoantibodies. 1 It is primarily characterized by the manifestation of skeletal muscle weakness, as well as fatigue, with symptoms aggravated after activity. 2 About 85% of MG patients have antibodies against acetylcholine receptors (AChRs). 3 Other patients may also present muscle-specific tyrosine kinase (MuSK) antibodies, low-density lipoprotein receptor-associated protein 4 (LRP4) antibodies and Titin and ryanodine receptor antibodies. 4 Epidemiological evidence indicates a noticeable rise in the prevalence of MG, akin to other autoimmune disorders. 5 Although considerable progress and improvement have been made in the treatment of MG, a part of patients remain refractory to treatment and respond poorly to standard treatment. 6 Therefore, MG imposes a lot of burdens on sufferers, not only physically, but also financially and psychologically. Previous studies have shown that the occurrence of MG has a close association with thymomas, thymic hyperplasia, and other thymic abnormalities.7,8 About 10% to 15% MG patients accompany a thymoma. 9
Thymomas are a group of mediastinal tumors derived from different thymic epithelial cells. 10 The great majority of thymomas are located in the thymus site of the anterior superior mediastinum, representing nearly half (47%) of all anterior mediastinal tumors. 11 It is worth noting that thymomas themselves have a unique link to autoimmune diseases. 12 From a histological perspective, it is frequently observed that thymomas exhibit a significant T-cell infiltration.13,14 Upon being released into the bloodstream, these T cells, which have been abnormally conditioned, may be contributed to the occurrence of autoimmune conditions that commonly associated with thymomas including blood disorders, connective tissue diseases, and MG. 15 Around 30% to 40% of thymoma patients experience MG, and these patients are more prone to developing generalized MG. 16 There appears to be a definitive association between MG and thymoma. In recent years, many scholars have studied the impact of thymoma as a risk factor for MG on the treatment and prognosis of MG. Lorenzo Maggi et al found that thymoma-associated MG was deemed to be a more severe disease than non-thymomatous MG in a study of 197 patients. His research confirmed that thymoma-associated MG has a lower complete stable remission rate, a higher frequency of generalized disease and immunosuppressive therapy than non-thymomatous MG. 17 In addition, another study found that thymoma-associated MG had a decreased remission rate and increased mortality. 18 Nevertheless, the genomic characteristics of MG associated with thymoma have yet to be fully understood. Therefore, it is indispensable to explore the potential molecular markers of thymoma-associated MG.
To address the above points, we performed a sequence of bioinformatics analyses to investigate the potential molecular mechanisms of thymoma-associated MG. In this study, the datasets of MG and thymoma were downloaded from the GEO database and their differentially expressed genes (DEGs) were analyzed. Then, important module genes associated with thymomas were identified through weighted gene co-expression network analysis (WGCNA). And functional enrichment analysis and gene–gene co-expression network analysis were further performed for the intersection of module genes and MG DEGs. Next, through comprehensive bioinformatics analysis such as functional annotation, machine learning, nomogram construction, receiver operating characteristics (ROC) curves, the potential diagnostic candidate genes were revealed. Subsequently, the immune infiltration of MG was analyzed and compared, and the correlation of key genes with immune cell infiltration was analyzed. Our study excavated diagnostic markers and analyzed the infiltration of immune cells in thymoma-associated MG. This study provides a new sight for further understanding of the molecular mechanism of thymoma-associated MG and for diagnosis and therapy.
Materials and Methods
Data source
One dataset of MG (GSE103974) and one dataset of thymoma (GSE79978) were obtained from the GEO database through “GEOquery” R package. The MG dataset included seven patients with ectopic germinal centers (GC) in the thymus and six without ectopic GC and was detected using Affymetrix Human Transcriptome Array 2.0 (GPL17586). 19 The profile of thymoma contained 13 thymic neoplasm samples and 3 normal thymus samples and was determined by AB SOLiD 3 Plus system (GPL18723). 20 R software was used to download the annotation information of the corresponding platform. When one probe targets multiple genes, the first gene is taken, while multiple probes are directed toward a single gene, selecting the average expression level of these probes. Limma package 21 was employed to identify DEGs. The P-value < .05, and|log2 fold change (FC)| > 0.25 were used as the threshold.
Weighted gene co-expression network analysis
To identify the important module genes related to thymoma, we constructed a gene co-expression network through WGCNA based on GSE79978 dataset. 22 The variance of gene expression was calculated, and the top 25% genes were intercepted for co-expression analysis. A cluster of all samples was performed to check if any abnormal outlier sample existed. To guarantee the network accorded with scale-free distribution, an optimal soft thresholding power β was selected during network construction processes. Then, the thymoma-related modules were obtained using hierarchical clustering trees. 23 After clustering, modules were displayed together through a dendrogram with colored assignments. Then, the relationships between gene modules and thymoma phenotype were calculated through Pearson’s correlation analysis. The most positive correlated module was considered as the key gene module. And the genes in the module were applied for subsequent analysis.
Functional enrichment analysis
The overlapped genes between key module genes and DEGs from MG were acquired using online Bioinformatics and Evolutionary Genomics to generate a Venn diagram (Draw Venn diagrams, Result [ugent.be]). Then, the overlapped genes, MG DEGs and thymoma DEGs were, respectively, subjected to functional enrichment analysis, including Gene Ontology (GO) and Kyoto Encyclopedia of Genes and Genomes (KEGG), using “clusterProfiler” R package. 24 It was considered as statistically significant when P-value was < .05.
Gene–gene interaction network construction
GeneMANIA (http://genemania.org/) is a flexible, user-friendly website for analyzing and prioritizing the function of genes. By importing a longer gene query list into it, it can expand this list by identifying functionally similar genes through genomics and proteomics data, and thus build gene networks associated with the query genes. 25 In this work, we constructed a gene–gene interaction network based on the overlapped genes of MG DEGs and the thymoma-associated module genes using GeneMANIA database. 26
Machine learning
We adopted two machine learning algorithms to further filter candidate genes for thymoma-associated MG diagnosis. Least absolute shrinkage and selection operator (LASSO) regression was utilized to enhance the accuracy of our predictive model. 27 As a regression analysis method, LASSO regression can precisely compress some regression coefficients to 0, so as to achieve variable selection. This means that LASSO regression can automatically select important predictors and exclude unimportant ones, creating efficient and concise predictive models. 28 Random forest (RF) analysis possesses better sensitivity, accuracy, and specificity, which is an approach with advantages of no restrictions on variable conditions.29,30 It is an ensemble learning algorithm, which consists of several decision trees. Each tree is independently constructed based on a random subset of the dataset. And then each decision tree will conduct random sampling and feature selection of the data, and summarize the results to improve the prediction accuracy of the overall model during the final prediction. 31 Therefore, we conducted “glmnet” 32 and “random Forest” 33 R packages for LASSO regression and RF analysis, respectively. Ultimately, the candidate hub genes were identified by intersecting the results of LASSO and RF for the diagnosis of thymoma-associated MG.
Evaluation of candidate hub genes by nomogram and ROC
We established a nomogram using the “rms” R package 34 to display the roles of these candidate hub genes for thymoma-associated MG diagnosis. “Points” denoted the score of candidate hub genes, and “Total Points” denoted the summation of all the genes scores. To further evaluate the diagnostic value of these candidate hub genes in MG, ROC was established and visualized by R package “p ROC.” The ROC curves were plotted, and the area under the curve (AUC) was calculated. In our study, AUC > 0.7 was considered the ideal diagnostic value. 35
Immune infiltration analysis
We analyzed immune cell infiltration between MG samples containing GC and MG samples without GC using the CIBERSORT algorithm. The algorithm can evaluate the composition of immune cells infiltration of samples based on the normalized gene expression matrix. 36 Twenty-two mature human hematopoietic populations of peripheral blood can be accurately distinguished according to the matrix file of default reference leukocyte gene signature (LM22). 37 A bar plot drawn by “ggplot” package was used to show the proportional distribution of immune cells across the samples. Moreover, the violin diagrams were drawn by the R package “vioplot” to compare the differences of immune cell infiltration between GC-containing and GC-free MG samples. P-value less than .05 was thought as statistically significant.
Correlation analysis between the key gene biomarkers and immune cells
Finally, we analyzed the relationships between the key gene biomarkers and the levels of immune cell infiltrations by Spearman’s rank correlation analysis. We considered |r|> 0.5 as a good correlation, and P-value < .05 was indicated statistical significance. And R package “ggplot2” was applied to display the above results. 38
Results
Identification of DEGs and biological function annotation
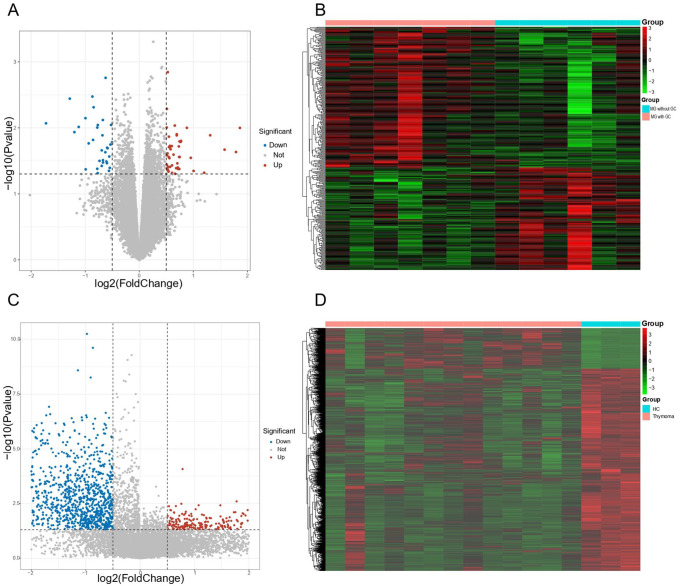
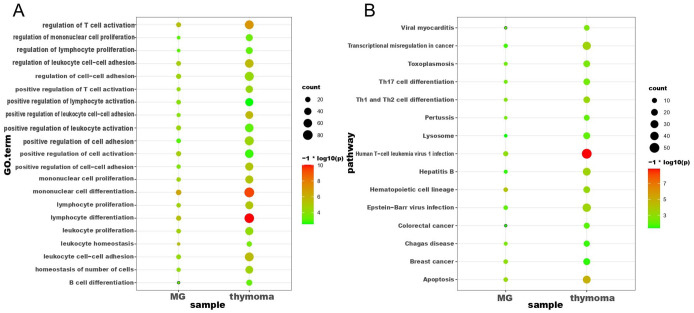
In this study, we first performed differential expression analysis on MG dataset (GSE103974) and thymoma dataset (GSE79978), respectively. As a result, 337 DEGs were found between MG samples containing GC and MG samples without GC, where the expression of 142 genes were decreased, and 195 genes were increased (see Figure 1A and B). Meanwhile, regarding the thymoma dataset (GSE79978), 2150 DEGs were screened out between thymoma samples and healthy control, including 359 upregulated genes and 1751 downregulated genes (see Figure 1 C and D). To further explore the biological functions of these DEGs, enrichment analyses including GO and KEGG were performed. We obtained a total of 64 GO terms and 49 KEGG pathways based on DEGs of MG (see Additional file 1: Table S1). And 684 GO terms and 73 KEGG pathways were observed based on DEGs of thymoma DEGs (see Additional file 2: Table S2). We further analyzed these GO terms and KEGG pathways and found that DEGs of MG and thymoma were enriched in many common biological functions, including 21 GO terms (see Figure 2A) and 15 KEGG pathways (see Figure 2B). Importantly, these common GO terms and pathways were mainly related to immune or inflammation, such as Th17 cell differentiation, lymphocyte differentiation, Human T-cell leukemia virus 1 infection, and mononuclear cell differentiation.
Figure 1.
Identification of the DEGs. (A) Volcano plot for MG. DEGs between MG patients with ectopic germinal centers in the thymus and without ectopic germinal centers. The red dots represented upregulated DEGs and the blue dots represented downregulated DEGs. (B) Heatmap for MG. (C) Volcano plot for thymoma (P-value < .05 and|log2FC| > 0.25). (D) Heatmap for thymoma. DEGs indicate differentially expressed genes; MG, myasthenia gravis.
Figure 2.
Overlapping enrichment analysis of GO and KEGG pathways of DEGs in MG and thymoma. (A) The common GO enrichment analyses of DEGs in MG and thymoma. (B) The common KEGG pathway analysis of DEGs in MG and thymoma. DEGs indicate differentially expressed genes; GO, Gene Ontology; KEGG, Kyoto Encyclopedia of Genes and Genomes; MG, myasthenia gravis.
Screening the key module for thymoma based on WGCNA analysis
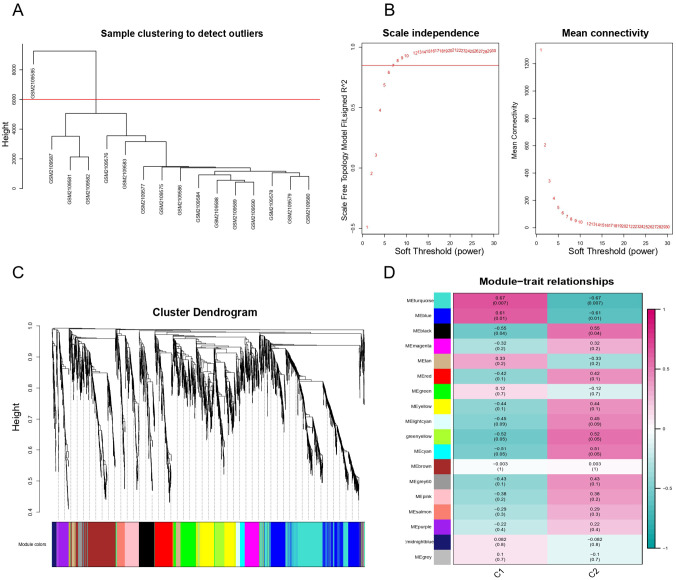
To identify the key module related to thymoma, WGCNA was employed. A total of 4095 genes (top 25% of the variance of gene expression) in thymoma dataset were selected to build co-expression network after eliminating unqualified genes. These unqualified genes mainly refer to (1) genes with low expression levels in multiple samples, (2) genes with a large number of missing values in the dataset, and (3) genes with too small coefficient of variation. The hierarchical clustering dendrogram showed that one outlier of 16 samples was removed and the rest of the samples were divided into two groups (see Figure 3A). The soft threshold β = 7 (R2 = 0.85) was chosen to establish the scale-free network (see Figure 3B). We then obtained 18 gene co-expression modules through the average linkage hierarchical clustering algorithm (see Figure 3C). The correlation among 18 modules and the clinical phenotype of GSE79978 dataset were further portrayed in Figure 3D. Among them, we found that black module (comprising 207 genes) was the most positive correlation with thymoma (r = 0.55, P = .04) and was deemed as the vital module for subsequent analysis.
Figure 3.
WGCNA result overview. (A) Sample clustering. Delete one sample outlier. (B) Soft threshold screening plot. The soft power of β = 7 was selected as the soft threshold for subsequent analyses. (C) Hierarchical clustering tree. The upper part of this figure represents the clustering of genes. The lower part represents the gene modules, which make up 18 modules. Gray represents genes that have not been classified into modules. (D) Heatmap of the correlation between the module eigengenes and clinical traits of MG. Each row represents a different gene module, and each column is a representative trait. C1 represents normal tissue and C2 represents thymoma. The value in the box represents the correlation and the P-value. Pink represents positive correlation, and green represents negative correlation. DEGs indicate differentially expressed genes; GO, Gene Ontology; MG indicates myasthenia gravis; WGCNA, weighted gene co-expression network analysis.
Analysis of candidate genes for thymoma-associated MG
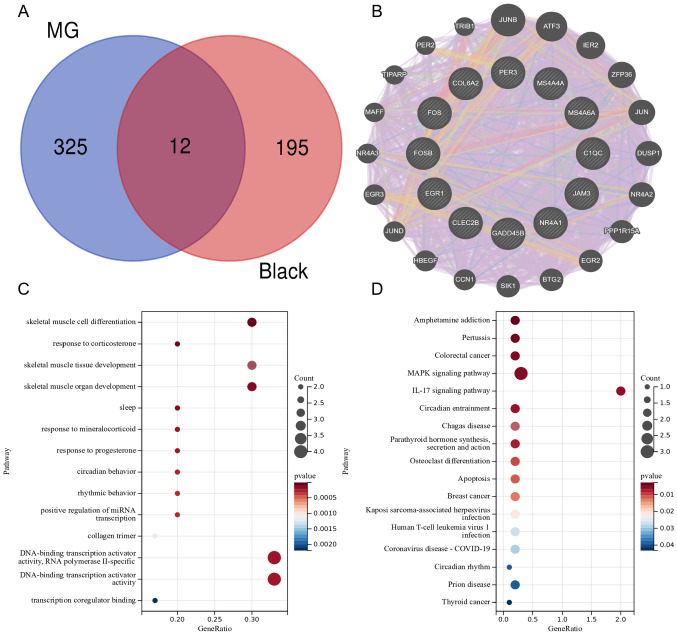
As known, thymoma is closely correlated with the occurrence, treatment, and prognosis of MG.39,40 Hence, we investigated the potential gene signatures that thymoma influenced MG from transcriptome level. We obtained candidate genes of thymoma-associated MG by intersecting DEGs of MG (337 DEGs) with thymoma-related key module (black module). A total of 12 candidate genes were screened out, including C1QC, JAM3, MS4A4A, NR4A1, FOS, CLEC2B, EGR1, MS4A6A, COL6A2, FOSB, PER3, GADD45B (see Figure 4A). To further figure out the link of these candidate genes, we established a gene–gene interaction network based on 12 genes by GeneMANIA. A total of 20 genes encircling the 12 genes were significantly correlated with each other in co-expression, co-localization, physical interactions, shared protein domains, prediction, and genetic interactions parameters. Figure 4B showed that co-expression accounted for 86.23%, co-localization accounted for 4.51%, physical interactions accounted for 4.47%, shared protein domains accounted for 3.02%, predicted accounted for 1.61%, and genetic interactions accounted for 0.16% in the network. This result suggested that 12 genes were extensive interplays with different common genes. To further understand the function of these 12 genes, we performed a functional annotation analysis. GO analyses revealed that candidate genes were significantly enriched for skeletal muscle cell differentiation and response to corticosterone (see Figure 4C). KEGG enrichment analysis found candidate genes were mainly enriched in amphetamine addiction, Pertussis and MAPK signaling pathway (see Figure 4D).
Figure 4.
Gene–gene interaction network and Enrichment Analysis of GO and KEGG Pathways of gene intersection. (A) Venn diagram showing the overlapping genes of the black module genes (most associated with thymoma) in WGCNA with DEGs in MG. (B) The network of 12 genes and their co-expression genes were constructed and analyzed by GeneMANIA. (C) The GO enrichment analyses of the candidate genes. (D) KEGG pathway analysis of the candidate genes. KEGG, Kyoto Encyclopedia of Genes; MG, myasthenia gravis; WGCNA, weighted gene co-expression network analysis.
Screening candidate key genes through LASSO regression and RF
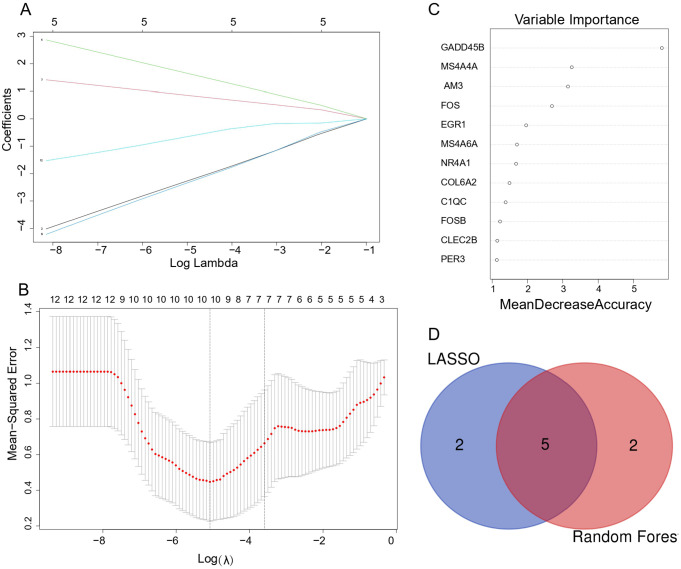
To screen the key gene biomarkers for thymoma-associated MG, we conducted machine learning algorithm analysis. In LASSO regression, regression coefficients of some genes were reduced to zero and only genes with non-zero regression coefficients were kept as the key indicators. We finally identified seven candidate genes by LASSO regression (see Figure 5A and B) In RF algorithm, the mean decrease accuracy (MDA) was selected as an importance measure to rank the candidate genes. And we obtained genes with MDA greater than 1.5 as the important genes (see Figure 5C). The overlapped genes of seven potential key indicators from LASSO and seven important genes from RF were considered as the candidate key genes. Ultimately, five genes (JAM3, MS4A6A, MS4A4A, FOS, EGR1) were obtained (see Figure 5D)
Figure 5.
Machine learning in screening candidate diagnostic biomarkers for thymoma-MG. (A and B) LASSO model. The number of genes (n = 7) corresponding to the lowest point of the curve is the most suitable for thymoma-MG diagnosis. (C) Random forests rank genes based on the importance of precision. (D) Venn diagram shows that five candidate diagnostic genes are identified via the above two algorithms. LASSO indicates least absolute shrinkage and selection operator; MG, myasthenia gravis.
Evaluating the diagnostic value of the candidate key genes
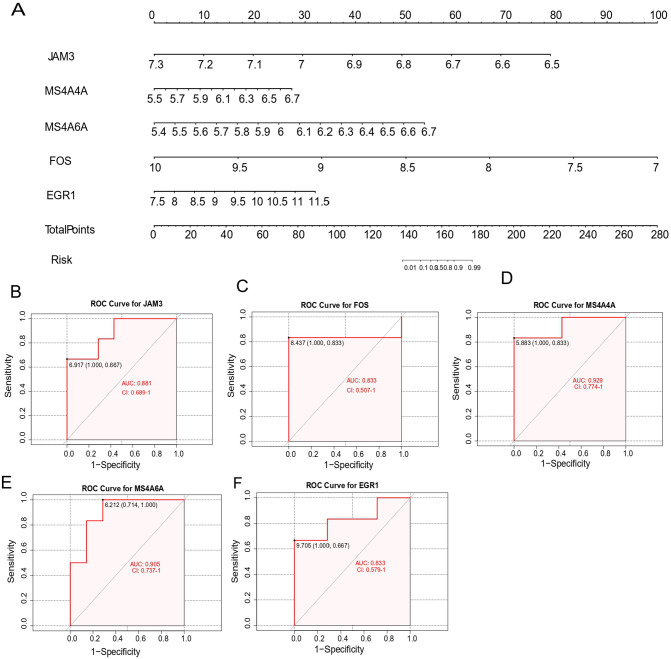
Based on these five key genes, we constructed a nomogram (see Figure 6A). To further evaluate the diagnostic specificity and sensitivity of each candidate key gene, ROC curves were created. Meanwhile, the AUC and 95% confidence interval (CI) were calculated. The results were as follows (see Figure 6B to F): JAM3 (AUC = 0.881, CI = 0.689-1), FOS (AUC = 0.833, CI = 0.507-1), MS4A4A (AUC = 0.929, CI = 0.774-1), MS4A6A (AUC = 0.905, CI = 0.707-1), EGR1 (AUC = 0.833, CI = 0.579-1). These five key genes all possess high diagnostic value for identifying MG coexisting with thymoma.
Figure 6.
Nomogram construction and the diagnostic value evaluation. (A) The visible nomogram for diagnosing MG with thymoma. (B to F) The ROC curve of each candidate gene (JAM3, FOS, MS4A4A, MS4A6A, and EGR1) shows the significant thymoma–MG diagnostic value. AUC indicates area under the curve; EGR1, early growth response 1; FOS, Proto-Oncogene C-Fos; JAM3, junctional adhesion molecule 3; MG, myasthenia gravis; MS4A4A, membrane-spanning 4 Domains subfamily A member 4A; MS4A6A, membrane-spanning 4 Domains subfamily A member 6A.
Immune cell infiltration analysis
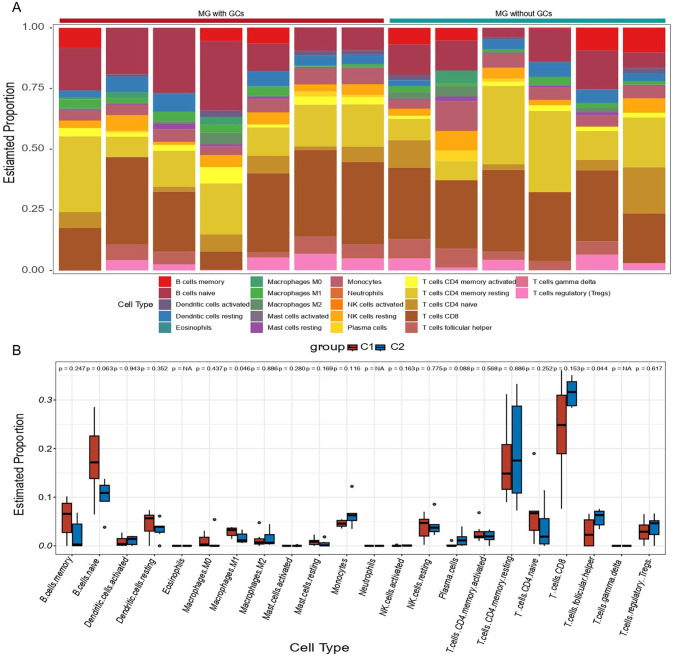
Immune dysregulation is an important characteristic in the pathogenesis of MG. 41 Hence, the infiltration of immune cells was analyzed by CIBERSORT. First, we calculated the relative abundance of 22 immune cell subtypes in each sample (see Figure 7A). Notably, the results exhibited a higher proportion of naïve CD4T cells, memory resting CD4T cells, and CD8T cells, along with a lower level of M1 macrophages and resting mast cells in MG patients. Furthermore, we compared the differences of immune cells infiltration between MG patients with ectopic GC and control samples. Only two types of immune cells were observed to have significantly different proportions (see Figure 7B). Compared with control samples, MG patients with ectopic GC had decreased follicular helper T cells and increased M1 macrophages.
Figure 7.
Immune infiltration analysis in MG. (A) Bar plot for the relative abundance of 22 immune cell types in each sample. (B) Infiltration differences of immune cells in C1 and C2. C1 represents MG patients with ectopic germinal centers and C2 represents MG patients without ectopic germinal centers. MG indicates myasthenia gravis.
Correlation analysis between key genes and immune cells in MG
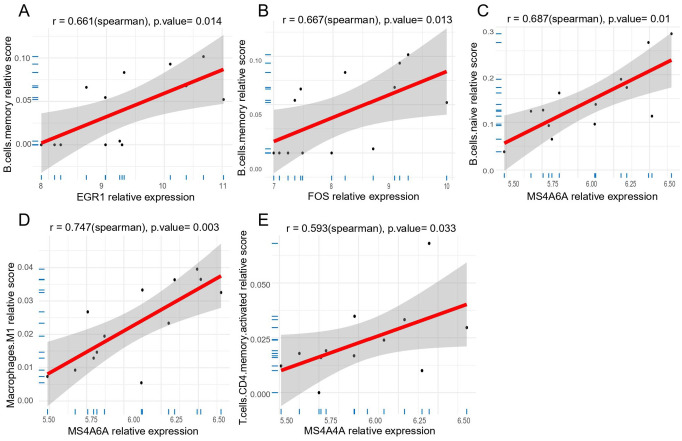
To characterize the correlation among candidate key genes (JAM3, MS4A6A, MS4A4A, FOS, EGR1) and differential immune cells (follicular helper T cells and M1 macrophage), correlation analysis were performed in MG samples. The results of correlation were presented in Figure 8. Biomarkers with significant correlation with immune cells were screened when P-value < .05. These results were presented in the following figure (see Additional file 3: Figure S1). The results showed that both EGR1 (r = 0.661, P = .014) and FOS (r = 0.667, P = .013) exhibited a positive correlation with memory B cells, MS4A6A was proved to be positively correlated with naïve B cells (r = 0.687, P = .01) and M1 macrophages (r = 0.747, P = .003), and MS4A4A showed a positive correlation with activated memory CD4+ T cells (r = 0.593, P = .033; see Figure 8A to E).
Figure 8.
Correlation between five key genes and specific immune cells in MG. (A) The correlation between EGR1 and memory B cells. (B) The correlation between FOS and memory B cells. (C) The correlation between MS4A6A and naive B cells. (D) The correlation between MS4A6A and M1 macrophages. (E) The correlation between MS4A4A and memory CD4T cells. EGR1 indicates early growth response 1; FOS, Proto-Oncogene C-Fos; MG, myasthenia gravis; MS4A4A, membrane-spanning 4 Domains subfamily A member 4A; MS4A6A, membrane-spanning 4 Domains subfamily A member 6A.
Discussion
Myasthenia gravis is an acquired autoimmune disease caused by autoantibodies. Previous studies have shown that abnormalities of thymus play an important role in MG pathogensis.42,43 The thymus ectopic GC may be a key risk factor in the development of thymoma into MG. It has been reported that GC can cause disease by driving high mutations in B-cell receptor genes and promoting the production of high-affinity myasthenic anti-ACHR antibodies in the thymus. 44 Several studies have suggested that MG patients with thymoma presented a worse prognosis.45,46 As such, elucidation of the molecular mechanisms of thymoma-associated MG is crucial to understand the disease progression and also to develop novel therapeutic targets.
In this study, we first performed differentially expressed analysis and found that there were a large number of DEGs in both MG and thymoma, which may exert a crucial role in the development of the diseases. To further understand the biological function of these DEGs, a functional annotation analysis was employed. We found that MG DEGs and thymoma DEGs shared many common GO terms and KEGG pathways. The results of enrichment analysis indicated that there were many similar related immune signaling pathways and inflammation-related processes between the two diseases. A total of 21 common GO terms and 15 common KEGG pathways were observed. For example, GO terms included lymphocyte differentiation and mononuclear cell differentiation, and KEGG included Th17 cell differentiation and Human T-cell leukemia virus 1 infection. In a previous study, the DNA sequences of Human T-cell lymphotropic virus type I (HTLV-I) was detected in the thymic tissue of 11 patients with thymoma, which indicated that HTLV-I infection might be related to thymoma–MG and was consistent with our results. 47 Then, WGCNA analysis was conducted to screen out the genes that exhibit the strongest association with thymoma for the first time. We found that the genes in the black module were the most positive correlation, which represented this module genes might be closely linked to the pathogenesis of thymoma. In recent years, many studies have indicated that thymoma has a high affinity with MG; more importantly, it may affect the prognosis of MG. 48 Therefore, we then explored the potential molecular mechanism of MG induced by thymoma at the transcriptome level. We obtained 12 candidate genes by intersecting the black module genes with the MG DEGs and constructed gene–gene interaction network based on them. Through the gene interaction network, we found that a total of 20 genes interacted with these 12 candidate genes, and they were significantly associated with each other in terms of gene co-expression, physical interactions, co-localization, shared protein domains, prediction, and genetic interactions parameters. To further investigate the role of these candidate genes in the pathogenesis of thymoma-associated MG, functional enrichment analysis was also performed. The results indicated these genes were mainly related to skeletal muscle cell differentiation, response to corticosterone, and MAPK signaling pathway. It has been found that the proliferation and differentiation of myoblasts from MG muscles were more active than that from control muscles. 49 Therefore, our findings indicated that these genes might be a key factor in the susceptibility of thymoma to be associated with MG.
To further screen the key genes for thymoma-associated MG, we performed machine learning analyses. First, we identified seven important genes (CIQC, JAM3, MS4A4A, MS4A6A, FOS, EGR1, COL6A2) by LASSO regression. Moreover, seven genes (GADD45B, MS4A4A, JAM3, FOS, EGR1, MS4A6A, NR4A1) were found to be significant by RF. Finally, we obtained five candidate key genes (JAM3, MS4A6A, MS4A4A, FOS, EGR1) by intersecting the results of LASSO regression and RF. Subsequently, we built a nomogram in terms of the five genes, and we also draw ROC curve for each gene to assess the diagnostic specificity and sensitivity of each gene. The results suggested all candidate genes possessed a high diagnostic value for thymoma-associated MG.
JAM3, a member of the junctional adhesion molecule family, plays a significant role through interacting molecules including tight junctions, adhesion junctions, and desmosomes. 50 MS4A4A and MS4A6A belong to the membrane-spanning, 4 domain family, subfamily A (MS4A).51-53 The MS4A4A protein has been found to potentially participate in signaling by binding ligands to promote calcium conduction. 54 This feature indicates that it may be involved in the release of acetylcholine from nerve endings in patients with thymoma-associated MG. Evidence illustrated that member of the MS4A family played key roles in various pathological conditions, such as infectious diseases, cancer, and neurodegeneration, 55 which may be potential candidate biomarkers and therapeutic targets for many diseases. For example, targeting MS4A4A could selectively deplete the plasma cells, 56 which indicated that MS4A4A may be a probable candidate for the development of therapeutic monoclonal antibodies. Although plasma cells lack proliferative potential, they contributed to most of the autoantibody production in MG. Therefore, MS4A4A was highly likely to be a promising diagnostic and therapeutic factor for thymoma-associated MG. EGR1 can participate in multiple important biological processes, such as growth, differentiation, apoptosis, neurite outgrowth, and immune cell activation. 57 Studies in recent years have illustrated that EGR1 is involved in the occurrence and development of cancer by influencing the invasion, metastasis and tumor angiogenesis of tumor cells. 58 Study has reported that EGR1 could exert tumor suppressor in many cancer. 59 EGR1 was downregulated in our work, so we can hypothesis that downregulation of EGR1 may promote the development of concomitant MG in thymoma patients. FOS is a reliable biomarker of neural activity, 60 which is rapidly induced upon increasing neural activity. FOS can actuate a second transcription of delayed genes that generally encode products localizing or acting at synapses. 61 The role of FOS in neural activity and synapses prompts us to speculate on its potential contribution in MG. There is high probability that FOS plays a role in the release of acetylcholine. Taken together, these candidate genes may become potential biomarkers for predicting the occurrence of thymoma-associated MG.
Immune dysregulation is an important pathological feature of MG, which is closely related to abnormality of the number and function of immune cells. Immunotherapy is not effective in MG patients with thymoma, which may be caused by the coexistence of autoimmune status and tumor immune tolerance. 62 Therefore, it is of great significance to understand the immune microenvironment status for the progress of thymoma-associated MG. So immune cell infiltration analysis was conducted based on the gene expression matrix file of MG. Notably, we found that all MG samples have a higher proportion of naïve CD4T cells, memory resting CD4T cells, and CD8T cells, along with a lower level of M1 macrophages and resting mast cells. According to a previous study, an increasing naïve CD4T cells in MG patients was found, 63 which supported our results. Next, we also compared the difference of the proportion of immune cells between GC-containing and GC-free MG samples and found a decreasing follicular helper T cells and an increasing M1 macrophages in MG patients with ectopic GC. A previous study observed elevated levels of follicular helper T cells in MG patients, and the frequency of circulating follicular helper T cells was correlated with disease severity. 64 Follicular helper T cells can migrate to GC by expressing the chemokine receptor CXCR5, which plays an important role in promoting the maturation of B cells, the differentiation of plasma cells, the maturation of antibody affinity, and the formation of follicles in GC. 65 Therefore, we speculated that the relative decrease of follicular helper T cell proportion in MG with GC might be related to the migration of follicular helper T cells compared with GC-free MG samples. In order to portray the immune characteristics of candidate genes, we analyzed the relationships between candidate genes and immune cells. We found several significantly important gene-immune cell pairs, including EGR1-memory B cells, FOS-memory B cells, MS4A6A-naïve B cells, MS4A6A-M1 macrophages, and MS4A4A-activated memory CD4+ T cells. However, this work has some limitations. First, our results are theoretically valid because the whole study is implemented using bioinformatics technology, and molecular biology experiments are necessary to validate our findings. Another limitation is that MG dataset lacks healthy controls and has a small sample, which may cause us to miss some important information. Nevertheless, our study did identify five candidate key genes and abnormal immune cells for thymoma-associated MG and provide a new respective to understand the molecular mechanisms of thymoma-associated MG.
Conclusions
In summary, our study first used WGCNA to screen out the genes that exhibit the strongest association with thymoma, and then a series of bioinformatics analysis techniques were employed to discern the key genes linked to thymoma-associated MG. Finally, we identified five key candidate genes and two immune cells for thymoma-associated MG. Our findings provide a more detailed molecular mechanism for thymoma-associated MG, unraveling the potential biomarkers and therapeutic targets. However, follow-up experiments are necessary to validate the interaction mechanism and functionality of these genes.
Supplemental Material
Supplemental material, sj-docx-1-bbi-10.1177_11779322241281652 for Identification of Potential Key Genes for the Comorbidity of Myasthenia Gravis With Thymoma by Integrated Bioinformatics Analysis and Machine Learning by Hui Liu, Geyu Liu, Rongjing Guo, Shuang Li and Ting Chang in Bioinformatics and Biology Insights
Acknowledgments
We would like to thank the research groups of GSE103974, GSE79978 as well as the GEO database for providing their platforms.
Footnotes
Funding: The author(s) disclosed receipt of the following financial support for the research, authorship, and/or publication of this article: This work was supported by National Natural Science Foundation of China (82271378); the discipline innovation and development plan of Tangdu Hospital-major program of clinical research (grant no. 2021LCYJ002), Key R&D plan of Shaanxi Province (grant no. 2021ZDLSF02-01).
The author(s) declared no potential conflicts of interest with respect to the research, authorship, and/or publication of this article.
Author Contributions: TC and SL designed the study and HL wrote the article. HL and GL participated in bioinformatics and statistical analyses. SL revised the article, made significant revisions to the draft, and supervised and completed this work. RG was responsible for suggesting changes to articles. All authors have read and agreed to the published version of the article.
Availability of Data and Materials: The original contributions presented in the study are included in the article/Supplementary Material. Further inquiries can be directed to the corresponding authors.
ORCID iD: Hui Liu  https://orcid.org/0009-0002-8070-9054
Supplemental Material: Supplemental material for this article is available online.
References
- 1. Binks S, Vincent A, Palace J. Myasthenia gravis: a clinical-immunological update. J Neurol. 2016;263:826-834. [DOI] [PMC free article] [PubMed] [Google Scholar]
- 2. Gilhus NE. Myasthenia gravis. N Engl J Med. 2016;375:2570-2581. [DOI] [PubMed] [Google Scholar]
- 3. Álvarez-Velasco R, Gutiérrez-Gutiérrez G, Trujillo JC, et al. Clinical characteristics and outcomes of thymoma-associated myasthenia gravis. Eur J Neurol. 2021;28:2083-2091. [DOI] [PubMed] [Google Scholar]
- 4. Mantegazza R, Bernasconi P, Cavalcante P. Myasthenia gravis: from autoantibodies to therapy. Curr Opin Neurol. 2018;31:517-525. [DOI] [PubMed] [Google Scholar]
- 5. Hehir MK, Silvestri NJ. Generalized myasthenia gravis: classification, clinical presentation, natural history, and epidemiology. Neurol Clin. 2018;36:253-260. [DOI] [PubMed] [Google Scholar]
- 6. Santos E, Bettencourt A, Duarte S, et al. Refractory myasthenia gravis: characteristics of a Portuguese cohort. Muscle Nerve. 2019;60:188-191. [DOI] [PubMed] [Google Scholar]
- 7. Tong T, Zhang J, Jia L, Liang P, Wang N. Integrated proteomics and metabolomics analysis reveals hubs protein and network alterations in myasthenia gravis. Aging. 2022;14:5417-5426. [DOI] [PMC free article] [PubMed] [Google Scholar]
- 8. Ströbel P, Helmreich M, Menioudakis G, et al. Paraneoplastic myasthenia gravis correlates with generation of mature naive CD4(+) T cells in thymomas. Blood. 2002;100:159-166. [DOI] [PubMed] [Google Scholar]
- 9. Cheng B, Xue Y, Gu S, Yang H, Liu P, Qi G. Developing and validating a nomogram to predict myasthenia gravis exacerbation in patients with postoperative thymoma recurrence. Gland Surg. 2022;11:1712-1721. [DOI] [PMC free article] [PubMed] [Google Scholar]
- 10. Müller-Hermelink HK, Marx A., Thymoma. Curr Opin Oncol. 2000;12:426-433. [DOI] [PubMed] [Google Scholar]
- 11. Bernard C, Frih H, Pasquet F, et al. Thymoma associated with autoimmune diseases: 85 cases and literature review. Autoimmun Rev. 2016;15:82-92. [DOI] [PubMed] [Google Scholar]
- 12. Ruan X, Lu X, Gao J, et al. Multiomics data reveals the influences of myasthenia gravis on thymoma and its precision treatment. J Cell Physiol. 2021;236:1214-1227. [DOI] [PubMed] [Google Scholar]
- 13. Jamilloux Y, Frih H, Bernard C, et al. Thymoma and autoimmune diseases. Rev Med Interne. 2018;39:17-26. [DOI] [PubMed] [Google Scholar]
- 14. Nakajima J, Matsumoto J, Takeuchi E, Fukami T, Takamoto S. Rearrangement of T-cell receptor beta and gamma genes in thymoma. Asian Cardiovasc Thorac Ann. 2005;13:149-152. [DOI] [PubMed] [Google Scholar]
- 15. Engels EA. Epidemiology of thymoma and associated malignancies. J Thorac Oncol. 2010;5:S260-S265. [DOI] [PMC free article] [PubMed] [Google Scholar]
- 16. Radovich M, Pickering CR, Felau I, et al. The integrated genomic landscape of thymic epithelial tumors. Cancer Cell. 2018;33:244-258.e10. [DOI] [PMC free article] [PubMed] [Google Scholar]
- 17. Maggi L, Andreetta F, Antozzi C, et al. Thymoma-associated myasthenia gravis: outcome, clinical and pathological correlations in 197 patients on a 20-year experience. J Neuroimmunol. 2008;201-202:237-244. [DOI] [PubMed] [Google Scholar]
- 18. Jaretzki A, 3rd, Penn AS, Younger DS, et al. “Maximal” thymectomy for myasthenia gravis. Results. J Thorac Cardiovasc Surg. 1988;95:747-757. [PubMed] [Google Scholar]
- 19. Sengupta M, Wang BD, Lee NH, Marx A, Kusner LL, Kaminski HJ. MicroRNA and mRNA expression associated with ectopic germinal centers in thymus of myasthenia gravis. PLoS ONE. 2018;13:e0205464. [DOI] [PMC free article] [PubMed] [Google Scholar]
- 20. Radovich M, Solzak JP, Hancock BA, et al. A large microRNA cluster on chromosome 19 is a transcriptional hallmark of WHO type A and AB thymomas. Br J Cancer. 2016;114:477-484. [DOI] [PMC free article] [PubMed] [Google Scholar]
- 21. Ritchie ME, Phipson B, Wu D, et al. Limma powers differential expression analyses for RNA-sequencing and microarray studies. Nucleic Acids Res. 2015;43:e47. [DOI] [PMC free article] [PubMed] [Google Scholar]
- 22. Langfelder P, Horvath S. WGCNA: an R package for weighted correlation network analysis. BMC Bioinformat. 2008;9:559. [DOI] [PMC free article] [PubMed] [Google Scholar]
- 23. Langfelder P, Horvath S. Fast R functions for robust correlations and hierarchical clustering. J Stat Softw. 2012;46:i11. [PMC free article] [PubMed] [Google Scholar]
- 24. Yu G, Wang LG, Han Y, He QY. ClusterProfiler: an R package for comparing biological themes among gene clusters. OMICS. 2012;16:284-287. [DOI] [PMC free article] [PubMed] [Google Scholar]
- 25. Franz M, Rodriguez H, Lopes C, et al. GeneMANIA update 2018. Nucleic Acids Res. 2018;46:W60-W64. [DOI] [PMC free article] [PubMed] [Google Scholar]
- 26. Warde-Farley D, Donaldson SL, Comes O, et al. The GeneMANIA prediction server: biological network integration for gene prioritization and predicting gene function. Nucleic Acids Res. 2010;38:W214-220. [DOI] [PMC free article] [PubMed] [Google Scholar]
- 27. Dai P, Chang W, Xin Z, Cheng H, Ouyang W, Luo A. Retrospective study on the influencing factors and prediction of hospitalization expenses for chronic renal failure in China based on random forest and LASSO regression. Front Public Health. 2021;9:678276. [DOI] [PMC free article] [PubMed] [Google Scholar]
- 28. Amaador K, Vos JMI, Pals ST, et al. Discriminating between Waldenström macroglobulinemia and marginal zone lymphoma using logistic LASSO regression. Leuk Lymphoma. 2022;63:1070-1079. [DOI] [PubMed] [Google Scholar]
- 29. Esmaily H, Tayefi M, Doosti H, Ghayour-Mobarhan M, Nezami H, Amirabadizadeh A. A comparison between decision tree and random forest in determining the risk factors associated with type 2 diabetes. J Res Health Sci. 2018;18:e00412. [PubMed] [Google Scholar]
- 30. Ellis K, Kerr J, Godbole S, Lanckriet G, Wing D, Marshall S. A random forest classifier for the prediction of energy expenditure and type of physical activity from wrist and hip accelerometers. Physiol Meas. 2014;35:2191-2203. [DOI] [PMC free article] [PubMed] [Google Scholar]
- 31. Hu J, Szymczak S. A review on longitudinal data analysis with random forest. Brief Bioinform. 2023;24:bbad002. [DOI] [PMC free article] [PubMed] [Google Scholar]
- 32. McEligot AJ, Poynor V, Sharma R, Panangadan A. Logistic LASSO regression for dietary intakes and breast cancer. Nutrients. 2020;12:2652. [DOI] [PMC free article] [PubMed] [Google Scholar]
- 33. Alderden J, Pepper GA, Wilson A, et al. Predicting pressure injury in critical care patients: a machine-learning model. Am J Crit Care. 2018;27:461-468. [DOI] [PMC free article] [PubMed] [Google Scholar]
- 34. Liu TT, Li R, Huo C, et al. Identification of CDK2-related immune forecast model and ceRNA in lung adenocarcinoma, a pan-cancer analysis. Front Cell Dev Biol. 2021;9:682002. [DOI] [PMC free article] [PubMed] [Google Scholar]
- 35. Mandrekar JN. Receiver operating characteristic curve in diagnostic test assessment. J Thorac Oncol. 2010;5:1315-1316. [DOI] [PubMed] [Google Scholar]
- 36. Newman AM, Liu CL, Green MR, et al. Robust enumeration of cell subsets from tissue expression profiles. Nat Methods. 2015;12:453-457. [DOI] [PMC free article] [PubMed] [Google Scholar]
- 37. Chen B, Khodadoust MS, Liu CL, Newman AM, Alizadeh AA. Profiling tumor infiltrating immune cells with CIBERSORT. Methods Mol Biol. 2018;1711:243-259. [DOI] [PMC free article] [PubMed] [Google Scholar]
- 38. Zhou S, Lu H, Xiong M. Identifying immune cell infiltration and effective diagnostic biomarkers in rheumatoid arthritis by bioinformatics analysis. Front Immunol. 2021;12:726747. [DOI] [PMC free article] [PubMed] [Google Scholar]
- 39. Chen P, Wang YP, Mou DL, et al. Pathological findings in myasthenia gravis patients with thymic hyperplasia and thymoma. Pathol Oncol Res. 2018;24:67-74. [DOI] [PubMed] [Google Scholar]
- 40. Vachlas K, Zisis C, Rontogianni D, Tavernarakis A, Psevdi A, Bellenis I. Thymoma and myasthenia gravis: clinical aspects and prognosis. Asian Cardiovasc Thorac Ann. 2012;20:48-52. [DOI] [PubMed] [Google Scholar]
- 41. Berrih-Aknin S, Le Panse R. Myasthenia gravis: a comprehensive review of immune dysregulation and etiological mechanisms. J Autoimmun. 2014;52:90-100. [DOI] [PubMed] [Google Scholar]
- 42. Melms A, Luther C, Stoeckle C, et al. Thymus and myasthenia gravis: antigen processing in the human thymus and the consequences for the generation of autoreactive T cells. Acta Neurol Scand Suppl. 2006;183:12-13. [DOI] [PubMed] [Google Scholar]
- 43. Goldstein G. Myasthenia gravis and the thymus. Annu Rev Med. 1971;22:119-124. [DOI] [PubMed] [Google Scholar]
- 44. Marx A, Pfister F, Schalke B, Saruhan-Direskeneli G, Melms A, Ströbel P. The different roles of the thymus in the pathogenesis of the various myasthenia gravis subtypes. Autoimmun Rev. 2013;12:875-884. [DOI] [PubMed] [Google Scholar]
- 45. Na KJ, Hyun K, Kang CH, et al. Predictors of post-thymectomy long-term neurological remission in thymomatous myasthenia gravis: an analysis from a multi-institutional database. Eur J Cardiothorac Surg. 2020;57:867-873. [DOI] [PubMed] [Google Scholar]
- 46. Budde JM, Morris CD, Gal AA, Mansour KA, Miller JI., Jr. Predictors of outcome in thymectomy for myasthenia gravis. Ann Thorac Surg. 2001;72:197-202. [DOI] [PubMed] [Google Scholar]
- 47. Li H, Loehrer PJ, Sr, Hisada M, Henley J, Whitby D, Engels EA. Absence of human T-cell lymphotropic virus type I and human foamy virus in thymoma. Br J Cancer. 2004;90:2181-2185. [DOI] [PMC free article] [PubMed] [Google Scholar]
- 48. Okumura M, Fujii Y, Shiono H, et al. Immunological function of thymoma and pathogenesis of paraneoplastic myasthenia gravis. Gen Thorac Cardiovasc Surg. 2008;56:143-150. [DOI] [PubMed] [Google Scholar]
- 49. Attia M, Maurer M, Robinet M, et al. Muscle satellite cells are functionally impaired in myasthenia gravis: consequences on muscle regeneration. Acta Neuropathol. 2017;134:869-888. [DOI] [PubMed] [Google Scholar]
- 50. Garcia MA, Nelson WJ, Chavez N. Cell-cell junctions organize structural and signaling networks. Cold Spring Harb Perspect Biol. 2018;10:a029181. [DOI] [PMC free article] [PubMed] [Google Scholar]
- 51. Tedder TF, Streuli M, Schlossman SF, Saito H. Isolation and structure of a cDNA encoding the B1 (CD20) cell-surface antigen of human B lymphocytes. Proc Natl Acad Sci U S A. 1988;85:208-212. [DOI] [PMC free article] [PubMed] [Google Scholar]
- 52. Hulett MD, Pagler E, Hornby JR. Cloning and characterization of a mouse homologue of the human haematopoietic cell-specific four-transmembrane gene HTm4. Immunol Cell Biol. 2001;79:345-349. [DOI] [PubMed] [Google Scholar]
- 53. Kinet JP, Blank U, Ra C, White K, Metzger H, Kochan J. Isolation and characterization of cDNAs coding for the beta subunit of the high-affinity receptor for immunoglobulin E. Proc Natl Acad Sci U S A. 1988;85:6483-6487. [DOI] [PMC free article] [PubMed] [Google Scholar]
- 54. Arthur GK, Ehrhardt-Humbert LC, Snider DB, et al. The FcεRIβ homologue, MS4A4A, promotes FcεRI signal transduction and store-operated Ca(2+) entry in human mast cells. Cell Signal. 2020;71:109617. [DOI] [PMC free article] [PubMed] [Google Scholar]
- 55. Mattiola I, Mantovani A, Locati M. The tetraspan MS4A family in homeostasis, immunity, and disease. Trends Immunol. 2021;42:764-781. [DOI] [PubMed] [Google Scholar]
- 56. Sanyal R, Polyak MJ, Zuccolo J, et al. MS4A4A: a novel cell surface marker for M2 macrophages and plasma cells. Immunol Cell Biol. 2017;95:611-619. [DOI] [PubMed] [Google Scholar]
- 57. Li L, Ameri AH, Wang S, et al. EGR1 regulates angiogenic and osteoclastogenic factors in prostate cancer and promotes metastasis. Oncogene. 2019;38:6241-6255. [DOI] [PMC free article] [PubMed] [Google Scholar]
- 58. Wang B, Guo H, Yu H, Chen Y, Xu H, Zhao G. The role of the transcription factor EGR1 in cancer. Front Oncol. 2021;11:642547. [DOI] [PMC free article] [PubMed] [Google Scholar]
- 59. Kimpara S, Lu L, Hoang NM, et al. EGR1 addiction in diffuse large B-cell lymphoma. Mol Cancer Res. 2021;19:1258-1269. [DOI] [PMC free article] [PubMed] [Google Scholar]
- 60. Velazquez FN, Caputto BL, Boussin FD. C-Fos importance for brain development. Aging. 2015;7:1028-1029. [DOI] [PMC free article] [PubMed] [Google Scholar]
- 61. Joo JY, Schaukowitch K, Farbiak L, Kilaru G, Kim TK. Stimulus-specific combinatorial functionality of neuronal c-fos enhancers. Nat Neurosci. 2016;19:75-83. [DOI] [PMC free article] [PubMed] [Google Scholar]
- 62. Tao Z, Lu C, Gao S, et al. Two types of immune infiltrating cells and six hub genes can predict the occurrence of myasthenia gravis in patients with thymoma. Bioengineered. 2021;12:5004-5016. [DOI] [PMC free article] [PubMed] [Google Scholar]
- 63. Kohler S, Keil T, Alexander T, et al. Altered naive CD4(+) T cell homeostasis in myasthenia gravis and thymoma patients. J Neuroimmunol. 2019;327:10-14. [DOI] [PubMed] [Google Scholar]
- 64. Ashida S, Ochi H, Hamatani M, et al. Immune skew of circulating follicular helper T cells associates with myasthenia gravis severity. Neurol Neuroimmunol Neuroinflamm. 2021;8:e945. [DOI] [PMC free article] [PubMed] [Google Scholar]
- 65. Wu N, Tüzün E, Cheng Y, et al. Central role of T follicular helper cells in myasthenia gravis. Noro Psikiyatr Ars. 2021;58:68-72. [DOI] [PMC free article] [PubMed] [Google Scholar]
Associated Data
This section collects any data citations, data availability statements, or supplementary materials included in this article.
Supplementary Materials
Supplemental material, sj-docx-1-bbi-10.1177_11779322241281652 for Identification of Potential Key Genes for the Comorbidity of Myasthenia Gravis With Thymoma by Integrated Bioinformatics Analysis and Machine Learning by Hui Liu, Geyu Liu, Rongjing Guo, Shuang Li and Ting Chang in Bioinformatics and Biology Insights


