

Abstract
This study aims to (1) compare the kinetics of pulmonary oxygen uptake (VO2p), skeletal muscle deoxygenation ([HHb]), and microvascular O2 delivery (QO2mv) between heart failure (HF) patients with reduced ejection fraction (HFrEF) and those with preserved ejection fraction (HFpEF), and (2) explore the correlation between body composition, kinetic parameters, and exercise performance. Twenty-one patients (10 HFpEF and 11 HFrEF) underwent cardiopulmonary exercise testing to assess VO2 kinetics, with near-infrared spectroscopy (NIRS) employed to measure [HHb]. Microvascular O2 delivery (QO2mv) was calculated using the Fick principle. Dual-energy X-ray absorptiometry (DEXA) was performed to evaluate body composition. HFrEF patients exhibited significantly slower VO2 kinetics (time constant [t]: 63 ± 10.8 s vs. 45.4 ± 7.9 s; P < 0.05) and quicker [HHb] response (t: 12.4 ± 9.9 s vs. 25 ± 11.6 s; P < 0.05). Microvascular O2 delivery (QO2mv) was higher in HFrEF patients (3.6 ± 1.2 vs. 1.7 ± 0.8; P < 0.05), who also experienced shorter time to exercise intolerance (281.6 ± 84 s vs. 405.3 ± 96 s; P < 0.05). Correlation analyses revealed a significant negative relationship between time to exercise and both QO2mv (ρ= -0.51; P < 0.05) and VO2 kinetics (ρ= -0.63). Body adiposity was negatively correlated with [HHb] amplitude (ρ= -0.78) and peak VO2 (ρ= -0.54), while a positive correlation was observed between lean muscle percentage, [HHb] amplitude, and tau (ρ= 0.74 and 0.57; P < 0.05), respectively. HFrEF patients demonstrate more severely impaired VO2p kinetics, skeletal muscle deoxygenation, and microvascular O2 delivery compared to HFpEF patients, indicating compromised peripheral function. Additionally, increased adiposity and reduced lean mass are linked to decreased oxygen diffusion capacity and impaired oxygen uptake kinetics in HFrEF patients.
Keywords: Heart failure [Mesh], Exercise Tolerance [Mesh], Exercise Test [Mesh], Oxygen consumption [Mesh], Tissue oxygenation index [All fields], Oxygen uptake kinetics [All fields]
Subject terms: Cardiology, Risk factors
Introduction
Impairments in oxygen delivery and decreased peripheral extraction are among the pathophysiological determinants of decreased exercise capacity in patients with heart failure (HF)1. Microvascular oxygen delivery-utilization dynamics to the working muscles is a contributing mechanism to exercise intolerance2,3. Reduced microvascular capacity in the lower limbs could be related to disturbances in the diffusive or convective transport of O2 to skeletal muscle mitochondria4 or intramyocyte metabolic machinery5, possibly explaining the V’O2 kinetics slowing in HF patients1,3. Furthermore, the overall oxygen kinetics are heavily influenced by systemic cardiac functions like ventricular compliance, stroke volume, heart rate response, and afterload, each playing critical roles in the cardiovascular system’s adaptation to exercise in HF patients6.
Endothelium and microvascular dysfunction7, reduced metabolic activity8, obesity-related neurohumoral activation9, the pattern of regional adipose deposition10, and body composition-related changes such as decreased type-I muscle fibers and lower capillary-to-fiber ratio11 are proposed as peripheral abnormalities related to exercise limitation in HF with preserved ejection fraction (HFpEF, left ventricular ejection fraction (LVEF) > 50%).
Prolonged oxygen uptake (VO2) mean response time (MRT), obtained during the kinetic analysis, represents the time required for the O2 transport - O2 utilization system to reach 63% of the metabolic demand for a load4. Beyond the prognostically validated peak V’O212, prolonged (> 60s) V’O2 mean response time [MRT-V′O2] from non-incremental tests has been associated with a worse prognosis13,14 and heightened risk hospitalization and death in HFrEF (LVEF < 40%)15.
Possible differences in the oxygen supply and the dynamics between HFrEF and HFpEF have been described16, which may impact the exercise’s response. A previous study compared the kinetics response in HFpEF with healthy subjects17 and found slower V′O2 kinetics in HFpEF.
Studies have shown that the underlying reasons for reduced peak V̇O2 differ between HFrEF and HFpEF. Possible differences in the oxygen supply and dynamics between HFrEF and HFpEF have been described16, which may impact the exercise’s response. Additionally, research comparing HFpEF patients with healthy controls has highlighted slower V̇O2 kinetics in HFpEF (17, suggesting potential differences in oxygen supply and dynamics during exercise.
Moreover, the exact dynamics of oxygen kinetics and muscle QO2mv-to-V′O2 matching at exercise onset in HFpEF, compared to HFrEF patients with similar body composition and exercise capacity, are poorly understood. This knowledge gap led to our study’s design, which aimed to determine these kinetics in HFpEF, which may help us understand the phenotype and stimulate future investigations.
The present study aimed to evaluate the kinetics of V’O2, HHb, and QO2 and their implications for exercise tolerance in patients with HFrEF and HFpEF and assess the possible influence of body composition on kinetic and exercise performance variables. We hypothesize that our results may lead to a better understanding of the peripheral mechanisms of exercise intolerance associated with the HFpEF and HFrEF oxygen transport pathways.
Methods
Participants
This case-control study was designed following the STROBE statement18, including men (n = 13) and women (n = 8) with HF aged ≥ 50 years from affiliated cardiology clinics. Patients were optimally treated for HF for at least two years. They had the clinical diagnoses according to the ESC Guidelines, where HFrEF was defined as a clinical diagnosis (HF Symptoms and Signs presence) plus echocardiography with left ventricular ejection fraction (LVEF) ≤ 40%. HFpEF was defined as clinical diagnosis (HF Symptoms and Signs presence) plus echocardiography with LVEF ≥ 50%, plus elevated NT-ProBNP (BNP ≥ 35 pg/mL or NT-proBNP ≥ 125 pg/mL) or echocardiography with structural and functional alterations19.
Study exclusion criteria were as follows: patients could not have performed surgical or invasive procedures six months prior to evaluation nor be participating in an exercise rehabilitation program. The Ethics Review Board approved the University of Brasilia’s study under register number CAAE 81309417.7.0000.8093/2.554.560, and the clinical registered at www.ensaiosclinicos.gov.br under the registration number: RBR-668c8v. All experiments were performed in accordance with relevant guidelines and regulations. Research involving human research participants was performed in accordance with the Declaration of Helsinki.
Study procedures
Patients underwent a baseline screening assessment, which included a clinical medical interview, transthoracic echocardiography (Echo), dual-energy X-ray absorptiometry (DEXA), blood NT-proBNP, and Ramp-incremental exercise test (Fig. 1), followed by Constant work rate exercise test. Exercise tests included breath-by-breath gas analysis and near-infrared spectroscopy assessment.
Fig. 1.
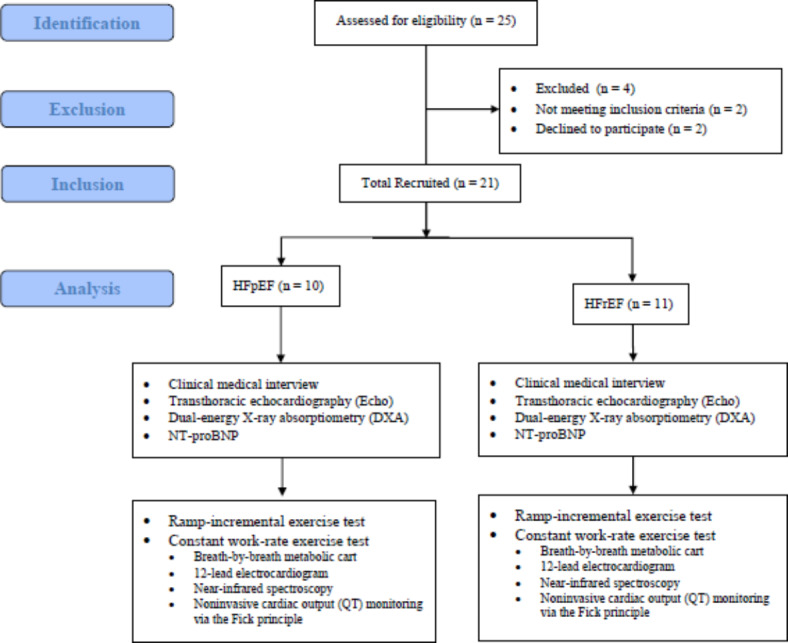
Flowchart of patients.
Transthoracic echocardiography
Complete two-dimensional, M-mode, Doppler, and tissue Doppler echocardiography were performed at rest according to guidelines by qualified sonographers. First (E) transmitral filling velocities were measured at the mitral leaflet tips by pulse wave Doppler. Tissue Doppler echocardiography was conducted to measure early (e’) diastolic tissue velocities at the septal and lateral mitral annulus. All measures represent the mean of measurements from 3 beats for subjects in sinus rhythm and 5 beats for atrial fibrillation subjects.
Dual-energy X-ray absorptiometry
DEXA was performed at rest in a supine position using the LUNAR Prodigy DXA-Scanner (GE Medical Systems, Version 6.70.021; Prodigy enCore2002, 726 Heartland Trail, USA) at 38 keV and 70 keV to determine the total mass, lean mass percentage (LMP) and fat percentage (FP) by the EnCore2002 software according to the manufacturer’s instructions.
NT-proBNP
Serum NT-proBNP was measured before exercise using test strips (CARDIAC proBNP+), which contain monoclonal and polyclonal antibodies against the NT-proBNP molecule’s epitopes on a point-of-care device Cobas h232 (Roche Diagnostics, Basel, Switzerland).
Cardiopulmonary exercise testing
Ramp-incremental exercise test
After familiarization, on the first laboratory visit, tests were performed on an electronically braked cycle ergometer (Corival 400, Lode, The Netherlands) on a maximum ramp-incremental exercise test (10–15 W/min) at 60 rpm, preceded by unloaded baseline pedaling at 0 W for 2 min. Pulmonary oxygen uptake and carbon dioxide production (V′O2, and V′CO2, mL/min), minute ventilation (V′E, L/min), and end-tidal partial pressures (PET) for O2 and CO2 (mmHg) were measured by a breath-by-breath metabolic cart (Quark CPET, Cosmed, Italy) with a 12-lead electrocardiogram for heart rate (HR, bpm). The gas exchange threshold (GET) was estimated by visually inspecting the inflection point on the V′CO2 versus V′O2 relationship (i.e., V-slope method) and confirmed by the increase in both V′E/V′O2 and PETO2 while V′E/V′CO2 and PETCO2 remained unchanged (i.e., ventilatory method)20. The criteria utilized to identify maximal effort were1 highest O2 uptake obtained during exercise (30-s average) and2 a Peak RER of 1.1 or above21.
Constant work rate exercise test
On the second laboratory visit (at least one week apart), subjects were submitted to a constant work rate exercise test to the limit of tolerance (Tlim, s) at a V′O2 equivalent to 60% of the (∆Peak V′O2 peak - Peak V′O2GET [~ 70–80% peak work rate]). Tlim was defined as the time point at which subjects signaled to stop exercising or could not maintain the required pedaling rate for 10 s despite being encouraged by the investigators. Subjects were asked to avoid caffeine, alcohol, or high-fat meals before testing.
Near-infrared spectroscopy
Skeletal muscle microvascular oxygenation profiles of the right vastus lateralis were evaluated with a wireless continuous-wave (CW) near-infrared spectroscopy (NIRS) system (Portamon, Artinis Medical System, Netherlands). The probe was secured to the skin over the vastus lateralis muscle (~ 12 cm above the patella) with adhesive tape and an elastic bandage after careful shaving and drying of the area. NIRS provides measurements of oxygenated and deoxygenated hemoglobin/myoglobin concentration (oxy-[Hb/Mb] and deoxy-[Hb/Mb], respectively). Total heme concentration (total-[Hb/Mb] = oxy-[Hb/Mb] + deoxy-[Hb/Mb]) and tissue oxygen saturation (StO2 = oxy-[Hb/Mb]/total - [Hb/Mb]) were also calculated. Among these NIRS variables, the deoxy-[Hb/Mb] signal has been considered a proxy of fractional O2 extraction in the microcirculation, reflecting the balance between O2 delivery and utilization22, and was recorded from resting baseline to exhaustion.
Kinetics analysis procedure
The V′O2 and Δdeoxy-[Hb/Mb] data were time-aligned to the start of the exercise and interpolated second-by-second23. Non-linear regression techniques were used to describe V’O2 kinetics from rest to the initial 180 s of exercise. The model was constrained to the V’O2 baseline and estimated key kinetics parameters as follows:
 |
1 |
Where b refers to baseline unloaded cycling and A, TD, and τ are the amplitude, time delay, and time constant of the exponential response, respectively. For V′O2 analysis, we deleted the initial 20 s data relative to the cardio dynamic phase152. Therefore, τ V′O2 represents the primary component-time course, a proxy of muscle V′O2 kinetics5. We opted to fit V′O2 data from 30 s of baseline pedaling to 180s after exercise onset3,23 and used this approach and Eq. (1) (see below); we ensured that the same amount of data was included in the kinetic analysis of VO2p for each subject, minimizing model-dependent effects on our results23.
Deoxy-[Hb/Mb] kinetics analyses were conducted on data from 30 s of baseline cycling to the 60s of the steady-state responses to minimize distortion of the curve-fitting. Theoretical and empirical studies5,23 suggest that the primary phase of the Δdeoxy-[Hb/Mb] response is complete within 60 s-time windows. The overall kinetics of Δdeoxy-[Hb/Mb] (~ time to reach 63% of the response following the onset of exercise) were determined by the mean response time (MRT = τ + TD).
To relate the kinetics of O2 utilization to the dynamics of (estimated) fractional O2 extraction, we calculated the ratio τV′O2/MRT Δdeoxy-[Hb/Mb]. Therefore, the higher this ratio, the faster the Δ[deoxy-Hb + Mb] kinetics concerning V′O2 dynamics, suggesting a slower adaptation of QO2mv23. The MRT determined the overall kinetics of [HHb]. The ratio τV′O2/MRT deoxy-[Hb/Mb] was used as a qualitative index of microvascular O2 delivery kinetics with higher values indicating slower oxygen delivery23.
Statistical analysis
Results were summarized as means ± SD. We tested the normality of the distribution using the Shapiro-Wilk test (n < 50). Nonpaired t-tests or Mann-Whitney tests were used as appropriate. Pearson’s and Spearman correlations were used to assess the level of association between continuous variables; 0.6 to 0.8 was considered moderate to good, and the statistical significance at P < 0.05. Data were processed in SigmaPlot software (Chicago, USA), and statistical analysis was completed using IBM - Statistical Package for the Social Sciences 24.0 for Windows (https://www.ibm.com/spss).
A priori sample size estimation was performed using MRT V′O2 as the primary outcome (G*power version 3.1.4, Franz, Universitat Kiel, Germany). Based on 3a previous VO’2 kinetics study involving HFpEF patients17, we estimated a difference of MRT of 65.4 vs. 40.1 s with an SD within each group of 14.7. Considering a study power of 80%, a significance level of 95%, and a sample size ratio of 1:1 (HFrEF and HFpEF group), we reached the estimated seven subjects per group. Post-hoc power analysis for the study’s primary outcomes reveals the following power for V′O2 τ (time constant) = 81.88% and V′O2 MRT (mean response time) = V′O2: 80.2%.
Results
Study population
From a total of 25 patients assessed for eligibility, 23 met the inclusion criteria, but two declined to participate in the study. Twenty-one (84%) non-smoking patients with HFpEF (n = 10) and HFrEF (n = 11) signed informed consent and were included in this case-control study (Fig. 1).
The HFpEF and HFrEF groups were similar for most baseline characteristics (Table 1). HFrEF had higher NT-proBNP than HFpEF. Echocardiographic systolic and diastolic function measurements were more impaired in HFrEF patients. V′E/V′CO2 slope was higher during incremental exercise, and the time to exercise intolerance was lower during constant exercise in HFrEF, while other exercise variables were similar between groups.
Table 1.
Baseline and exercise characteristics in heart failure patients with preserved (HFpEF) and reduced ejection fraction (HFrEF).
| Variables | HFpEF (n = 10) | HFrEF (n = 11) | P values |
|---|---|---|---|
| Anthropometrics/demographics | |||
| Age (years) | 63.7 ± 8.0 | 55.4 ± 10.8 | 0.06 |
| Height (cm) | 156.3 ± 28.9 | 164.8 ± 9.7 | 0.37 |
| Body weight (kg) | 90.5 ± 26.3 | 70.5 ± 18.0 | 0.51 |
| BMI (kg/m2) | 30.5 ± 3.2 | 25.7 ± 5.2 | 0.02 |
| Men/women | 7/4 | 7/3 | 0.75 |
| NT-proBNP (pg/mL) | 462.1 ± 622 | 1217.7 ± 828 | 0.04* |
| PETCO2 rest (mmHg) | 34.83 ± 10.3 | 37.55 ± 4.3 | 0.45 |
| NYHA Class, (I/II/III) | 5/3/2 | 2/6/3 | |
| Weber Class (A, B, C, D) | 2/6/2/0 | 4/3/2/2 | |
| Dual-energy X-ray absorptiometry (DEXA) | |||
| Total body mass (kg) | 83.5 ± 8.0 | 72.5 ± 21.1 | 0.2 |
| Nonbone lean body mass (kg) | 53.0 ± 7.4 | 44.7 ± 12.4 | 0.16 |
| Percentage of nonbone lean body mass (%) | 63.5 ± 6.1 | 62.0 ± 4.4 | 0.60 |
| Fat mass (kg) | 27.7 ± 5.3 | 25.3 ± 8.9 | 0.54 |
| Percentage of fat mass (%) | 34.4 ± 6.4 | 36.4 ± 4.8 | 0.51 |
| T-Score | 0.2 ± 1.3 | 0.1 ± 1.9 | 0.80 |
| Z-Score | 0.3 ± 1.3 | 0.3 ± 1.1 | 0.98 |
| Echocardiogram | |||
| LVEF (%) | 61.3 ± 6.0 | 30.4 ± 5.6 | < 0.01* |
| Left atrial volume index (LAVI) (mL/m2) | 32.5 ± 14.5 | 41.6 ± 12.6 | 0.15 |
| Left ventricular mass index (LVMI) (g/m2) | 92.6 ± 24.3 | 125.5 ± 26.8 | < 0.01* |
| E/A | 0.93 ± 0.28 | 1.30 ± 0.51 | 0.08 |
| E/e′ | 8.1 ± 1.7 | 14.5 ± 5.8 | < 0.01* |
| Mean e’ septal wall (cm/s) | 7.2 ± 1.3 | 5.0 ± 1.7 | < 0.01* |
| Mean e’ lateral wall (cm/s) | 10.1 ± 2.5 | 6.4 ± 1.8 | < 0.01* |
| Incremental exercise | |||
| Peak power (W) | 109.4 ± 26.5 | 91.0 ± 38.7 | 0.24 |
| Peak V′O2 (L/min) | 1.50 ± 0.37 | 1.21 ± 0.47 | 0.42 |
| Peak V′O2 (mL/min/kg) | 18.1 ± 2.8 | 16.4 ± 6.0 | 0.14 |
| V′O2GET (L/min) | 0.91 ± 0.15 | 0.88 ± 0.38 | 0.84 |
| Peak HR (bpm) | 158.5 ± 22.9 | 152.5 ± 22.30 | 0.56 |
| V′E/V′CO2 slope | 27.3 ± 4.6 | 32.8 ± 4.4 | < 0.01* |
| Peak RER | 1.16 ± 0.15 | 1.22 ± 0.07 | 0.41 |
| Constant work rate exercise at Tlim | |||
| Peak power (W) | 79.2 ± 20.2 | 73.0 ± 32.5 | 0.61 |
| Time to exercise intolerance (s) | 405.3 ± 96.4 | 281.6 ± 84.0 | < 0.01* |
| Peak V′O2 (L/min) | 1.44 ± 0.30 | 1.21 ± 0.48 | 0.21 |
| Peak HR (bpm) | 126.8 ± 23.3 | 122.00 ± 22.3 | 0.69 |
| Cardiovascular medications | |||
| Beta-blocker | 9 (90%) | 11 (100%) | 0.47 |
| ACE-inhibitors | 6 (60%) | 9 (82%) | 0.36 |
| AR-blockers | 4 (40%) | 2 (18%) | 0.36 |
| Digitalis | 0 (0%) | 5 (45%) | 0.03 |
| Loop diuretics | 5 (50%) | 9 (82%) | 0.18 |
| Aspirin | 7 (70%) | 6 (54%) | 0.65 |
| Statins | 6 (60%) | 5 (45%) | 0.66 |
| Aldosterone inhibitor | 2 (20%) | 7 (63%) | 0.08 |
Data is expressed as an absolute number and relative percentage [n(%)] for categorical variables as well as mean and standard deviation (mean ± SD) for continuous variables. Comparisons between groups were analyzed using a student’s test for differences between groups.
*P < 0.05 (nonpaired t-test).
NT-proBNP, N-terminal pro-b-type natriuretic peptide, PetCO2 rest, resting end-tidal carbon dioxide partial pressure, NYHA, New York Heart Association Functional Classification, BMI, Body mass index, T-Score and Z-Score, bone mineral density scores, LVEF, Left ventricular ejection fraction, LAVI, left atrial volume index, LVMI, left ventricular mass index, E/e’, early mitral inflow velocity and mitral annular early diastolic velocity ratio, E/A, peak early filling (E) and late diastolic filling (A) velocities ratio, V′O2, pulmonary oxygen uptake; GET, gas-exchange threshold; HR, heart rate; ACE, angiotensin-converting enzyme; AR, angiotensin-receptor.
Kinetics parameters
The dynamics of V′O2 were slower in HFrEF compared to HFpEF (τ = 63 ± 10.8 vs. 45.4 ± 7.9 s, respectively, P < 0.05) (Table 2). In contrast, the dynamics of [HHb] were faster in HFrEF compared to HFpEF (τ = 12.4 ± 9.9 vs. 25 ± 11.6 s, P < 0.05) (Table 2).
Table 2.
Kinetic parameters for V′O2 and [HHb] in heart failure patients with preserved and reduced ejection fraction.
| Parameters | V′O2 (mL/min) | [HHb] | ||
|---|---|---|---|---|
| HFpEF | HFrEF | HFpEF | HFrEF | |
| Baseline | 625.0 ± 148.7 | 549.6 ± 137.6 | 4.9 ± 5.2 | 6.4 ± 5.4 |
| A | 834.1 ± 220.0 | 663.6 ± 324.4 | 6.6 ± 3.9 | 7.2 ± 6.6 |
| τ, s | 45.4 ± 7.9 | 63.0 ± 10.8* | 25.0 ± 11.6 | 12.4 ± 9.9* |
| TD | 8.2 ± 6.4 | 8.6 ± 7.9 | 5.6 ± 2.6 | 7.2 ± 1.6 |
Data expressed as mean and standard deviation (mean ± SD) for continuous variable. Comparisons between groups were analyzed using a student`s test for differences between groups. *P < 0.05 (nonpaired t-test). Baseline and A = Amplitude (V′O2, mL/min; HHb, %) τ = tau (s); TD = Time delay (s); V′O2, pulmonary oxygen uptake; [HHb], deoxyhemoglobin.
HFrEF patients had greater τ of V′O2 uptake (P < 0.05, Fig. 2a) and shorter time of MRT of HHb (P < 0.05, Fig. 2b) when compared with HFpEF patients.
Fig. 2.
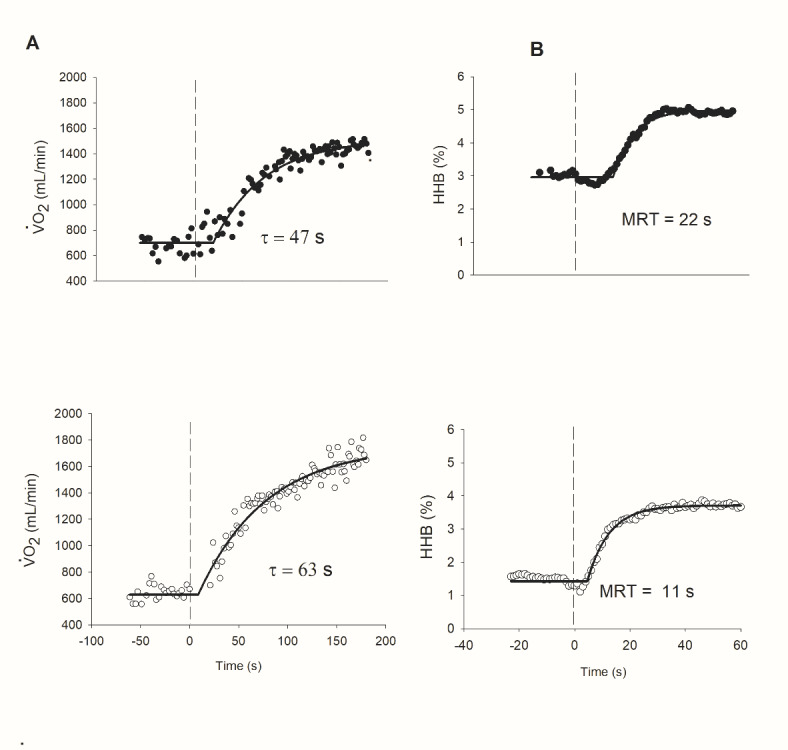
Representative responses of (A) O2 uptake (V′O2) and (B) skeletal muscle deoxygenation [HHb] kinetics at the onset of high-intensity exercise in HFrEF (white-circle) and HFpEF (black-circle). (a) note that V′O2 kinetics was slower in HFrEF patients (τ, time constant of the primary component). (b) note that [HHb] kinetics was slower in HFrEF patients ([HHb] values are expressed relative to the amplitude of variation from baseline to the steady-state). TD, time delay; τ, the time constant and MRT (in s) [MRT= =τ + TD). This figure was previously published in abstract format (39).
Time to exercise tolerance correlated to MRT-QT (rho= -0.51; P < 0.05) and tV′O2 (rho= -0.63) combining both groups (Fig. 3) when combining both groups.
Fig. 3.
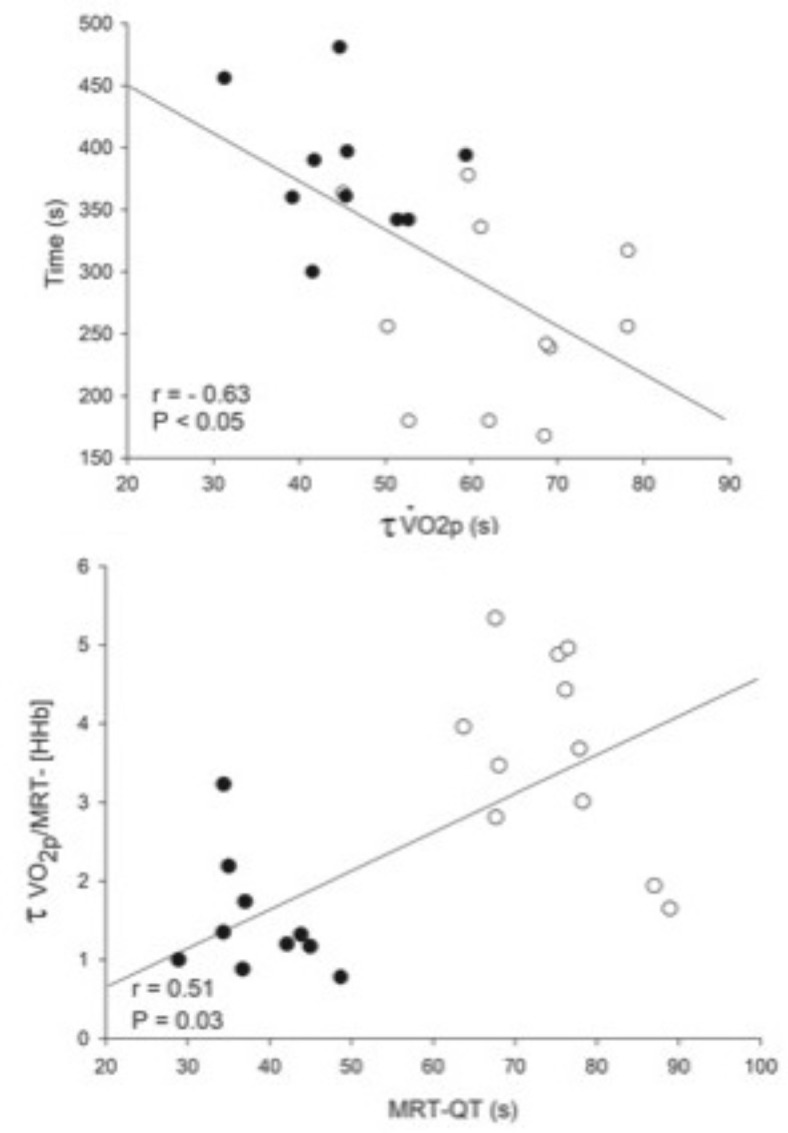
Group correlation analysis among HFrEF (white circle) and HFpEF (black circle) patients. (a) A significantly inverse relationship between time to intolerance in response to high-intensity exercise and the τ of the primary component of the on-transient V′O2. (b) A significant positive relationship between an index of the kinetics of microvascular O2 delivery (τ of the primary component of the on-transient V′O2/MRT of the changes in [HHb] and the kinetics of systemic O2 delivery, as estimated by the dynamics of QT (MRT-QT), at the onset of high-intensity exercise. Group correlation analysis among HFrEF (white circle) and HFpEF (black circle) patients. (a) A significant positive relationship between a lean mass percentage (%) and the τ of the primary component of the on-transient V′O2. (b) A significant positive relationship between fat percentage (%) and the τ of the primary component of the on-transient V′O2.
Body adiposity was negatively correlated with [HHb] amplitude (rho =-0.79) and peak V’O2 (rho =-0.54), while lean muscle percentage was positively correlated with [HHb] amplitude and tau (Rho= +0.74 and + 0.57; P < 0.05) (Fig. 4) when combining both groups.
Fig. 4.
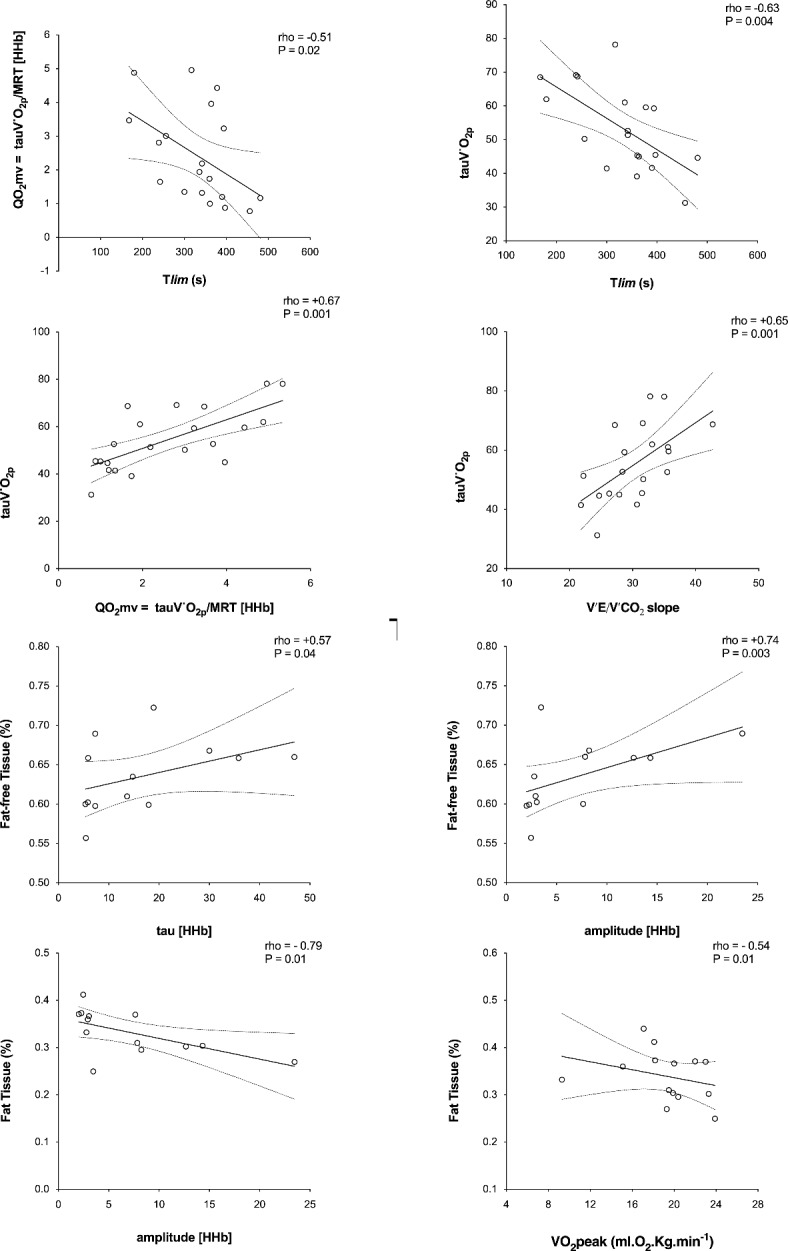
Mean response time (MRT, sec) of V′O2 and [HHb] measured by near-infrared spectroscopy at the onset of heavy-intensity exercise and index of the kinetics of microvascular O2 delivery (QO2mv) in HFrEF (open bars) and HFpEF (solid bars). MRT = τ + TD, V′O2/MRT- [HHb] (τ of the primary component of the on-transient V′O2/MRT of the changes in [HHb]). V′O2 = O2 uptake, [HHb] = deoxy-hemoglobin concentration. Note that the dynamics of V′O2 were slower in HFrEF; in contrast, they presented with faster [HHb] kinetics than the HFpEF. Values are means (SD). *P < 0.05 for between-group comparisons.
Discussion
This study compares the dynamics of V′O2 and tissue oxygenation kinetics simultaneously at the onset of a constant work rate protocol in patients with HFrEF and HFpEF. We found that along with the impairment (slowing) of pulmonary oxygen uptake (V’O2p) kinetics during exercise, deoxy-hemoglobin kinetics and microvascular O2 delivery are also more severely affected in HFrEF than HFpEF. Besides that, in agreement with a previous study10 describing the association between the regional adipose distribution and skeletal muscle abnormalities to exercise intolerance, we demonstrated the body composition association with muscle microvascular fractional O2 extraction kinetics during exercise.
Studies have demonstrated that the V′O2 kinetics are slowed in HFrEF24–26, evidenced by a prolonged time constant14. Poole et al.1 have suggested that derangements of convective and diffusive O2 delivery (O2 transport) or impaired muscle utilization (mitochondrial respiration abnormalities) may account for the higher τV′O2 in HFrEF15. Other potential mechanisms associated with a larger time constant of V′O2 include central hemodynamic impairments (Fig. 5)27,28, heightened neurohumoral activation29, impaired nitric oxide and endothelium-dependent vasodilation30, or impaired blood flow redistribution from the non-exercising tissues to the exercising muscles31.
Fig. 5.
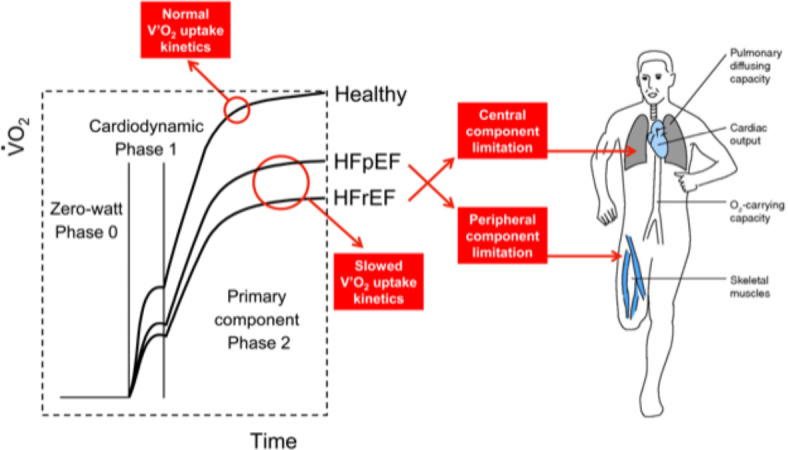
Central illustration kinetics. Oxygen uptake (V′O2), heart failure (HF) patients with reduced ejection fraction (HFrEF) and preserved ejection fraction (HFpEF).
Contrary to our initial hypothesis, although in line with oxygen uptake (V’O2p) kinetics, faster deoxy-hemoglobin [HHb] kinetics were observed in HFrEF, which might be related to a greater peripheral oxygen demand in this group. This finding has been demonstrated in patients with chronic obstructive pulmonary disease23, HFrEF3, and HFpEF17, but none of the previous studies compared HFrEF to HFpEF patients. Our study shows that [HHb] kinetics are more severely affected in HFrEF patients than HFpEF, suggesting an important delivery-utilization O2 mismatch. These results are clinically relevant because the reduced O2 availability may be related to impaired muscle microvascular function in response to exercise32.
Regional adipose distribution and muscle abnormalities have been associated with exercise intolerance in HFpEF patients10. Consistent with the latter, the percentage of body adiposity tissue negatively was correlated with [HHb] amplitude and peak V’O2. Additionally, lean muscle percentage was also positively correlated with [HHb] amplitude and tau, thereby highlighting the clinical relevance of muscle strength in this population33.
Although we observed no significant difference in the prevalence of beta-blocker usage between the HFpEF and HFrEF groups, it is crucial to acknowledge the potential impact of beta-blockers on peripheral oxygen extraction. Earlier research, such as the study by Hughson and Kowalchuk (1991), indicated that beta-blockade might impair O2 transport, with the extent of impairment influenced by total muscle mass and metabolic demand34. However, more recent studies with larger samples of cardiovascular disease patients, similar to our cohort, have suggested that beta-blockade does not significantly affect exercise capacity or oxygen uptake recovery kinetics in patients with chronic heart failure35. While our findings support that beta-blockers suppress sympathetic drive, they also align with evidence that long-term beta-blocker therapy can improve exercise duration without significantly altering peak oxygen consumption, reduce peak carbon dioxide production, and decrease symptoms during exercise36. This underscores the complex and nuanced effects of beta-blockers on exercise physiology and highlights the relevance of these mechanisms to clinical practice.
These findings suggest that exercise training in HF patients should primarily target peripheral adaptations to improve exercise capacity. Given the more significant impairment in oxygen delivery and utilization in HFrEF patients, peripheral training focusing on improving muscle oxygenation and microvascular function is crucial. Enhancing these peripheral factors can contribute to better overall exercise tolerance and performance. Therefore, to achieve optimal gains in exercise capacity, HF patients should prioritize training emphasizing peripheral conditioning, such as resistance and aerobic exercises that enhance muscle perfusion and oxygen extraction.
Study limitations
First, only 32% of the patients were in WEBER Class C and D, probably due to medical resistance in referring more severe patients to perform high-intensity exercise evaluations. However, patients did not present any complications during assessments. Second, the limited sample size for some secondary outcomes of kinetics analysis, such as the [HHb] time delay; however, we demonstrated relevant differences within both [HHb] and V′O2 tau in HFpEF and HFrEF.
Third, patients were centrally treated for HF but came from multiple origins so that the optimal therapy strategy might be somewhat diverse among the patients. However, the drug records indicate a similar distribution among the groups. Although the use of a single exercise transition may limit the accurate resolution of kinetic responses (particularly for the analysis of VO2 kinetics), the differences in the main variables of interest between the studied groups were large enough to be statistically detected, as indicated by Puente-Maestu et al.37.
Fourth, although the study results are considered clinically valuable, and most baseline characteristic variables were matched between the groups, there are differences in a few important indicators (weight, BMI, age, BNP, NYHA) between the two groups primarily due to pathophysiological variations among these phenotypes. Therefore, our results might also be influenced by other physical characteristics.
Fifth, while estimating cardiac output from VO2 is not considered a gold-standard method, our laboratory lacked access to right heart catheterization data.
Conclusion
We discovered that impairments in pulmonary oxygen uptake (VO2p) kinetics and deoxy-hemoglobin ([HHb]) kinetics are more pronounced in HFrEF patients than in HFpEF patients. Furthermore, aligning with previous research linking regional adipose distribution and skeletal muscle abnormalities with exercise intolerance, our findings also show that increased adiposity and reduced lean mass correlate with diminished oxygen diffusion capacity and impaired oxygen uptake kinetics.
Acknowledgements
The authors thank all Cardiorespiratory Rehabilitation Research Group (GPRC) colleagues for their collaboration and our patients for their effort and enthusiastic cooperation throughout the study.
Author contributions
Gerson Cipriano Jr, Cássia L Goulart, and Gaspar R. Chiappa participated in the article design, analysis, and interpretation of the results and manuscript writing. Marianne Lucena da Silva, Natália Turri Silva, Amanda Oliveira do Vale Lira, Edson Marcio Negrão, Luciana Bartolomei Orru DÁvila, Sergio Henrique Rodolpho Ramalho, and Fausto Stauffer Junqueira de Souza, participate in the study design, collecting data and reviewing the manuscript. Graziella França Bernardelli Cipriano, Dominique Hansen, and Lawrence Patrick Cahalin participated in the statistical analysis of the results, revision, and approval of the final version of the text.
Funding
Brazilian Government agencies supported this research: Conselho Nacional de Desenvolvimento Científico e Tecnológico (CNPq; 439313/2018-0), Coordenação de Aperfeiçoamento de Pessoal de Nível Superior (CAPES; 88881.170492/2018-01), and Fundação de Apoio a Pesquisa do Distrito Federal (FAPDF) Edital 06/2016.
Data availability
The datasets used and/or analysed during the current study available from the corresponding author on reasonable request.
Declarations
Competing interests
The authors declare no competing interests.
Competency in medical knowledge
The kinetics of muscle microvascular deoxygenation are intricately associated with body composition, playing a pivotal role in exercise intolerance observed in HFpEF patients. Conversely, the central cardiovascular component predominates in determining exercise intolerance in HFrEF, indicating distinct pathophysiological mechanisms within heart failure subtypes.
Translational outlook
For patients with HFpEF, the interplay between skeletal muscle deoxygenation kinetics and body composition significantly influences exercise capacity. Interventions aimed at optimizing body composition—specifically reducing adipose tissue and enhancing lean muscle mass—hold promise for improving exercise tolerance in this population. Further research is needed to develop and evaluate targeted strategies that address these modifiable factors, potentially offering a novel therapeutic avenue to mitigate exercise intolerance in HFpEF.
Footnotes
Publisher’s note
Springer Nature remains neutral with regard to jurisdictional claims in published maps and institutional affiliations.
References
- 1.Poole, D. C., Richardson, R. S., Haykowsky, M. J., Hirai, D. M. & Musch, T. I. Exercise limitations in heart failure with reduced and preserved ejection fraction. J. Appl. Physiol. 124, 208–224. (1985). [DOI] [PMC free article] [PubMed]
- 2.Whipp, B. J., Davis, J. A., Torres, F. & Wasserman, K. A test to determine parameters of aerobic function during exercise. J. Appl. Physiol. Respir Environ. Exerc. Physiol. 50, 217–221 (1981). [DOI] [PubMed] [Google Scholar]
- 3.Sperandio, P. A. et al. Microvascular oxygen delivery-to-utilization mismatch at the onset of heavy-intensity exercise in optimally treated patients with CHF. Am. J. Physiol. Heart Circ. Physiol. 297, H1720–H1728 (2009). [DOI] [PubMed] [Google Scholar]
- 4.Hughson, R. L. Kinetics of VO(2) with very high intensity exercise. Am. J. Physiol. Regul. Integr. Comp. Physiol. 281, R681–R682 (2001). [DOI] [PubMed] [Google Scholar]
- 5.Grassi, B. et al. Muscle oxygenation and pulmonary gas exchange kinetics during cycling exercise on-transitions in humans. J. Appl. Physiol. (1985). 95, 149–158 (2003). [DOI] [PubMed] [Google Scholar]
- 6.Fonarow, G. C. et al. Characteristics, treatments, and outcomes of patients with preserved systolic function hospitalized for heart failure: A report from the OPTIMIZE-HF Registry. J. Am. Coll. Cardiol. 50, 768–777 (2007). [DOI] [PubMed] [Google Scholar]
- 7.Giamouzis, G., Schelbert, E. B. & Butler, J. Growing evidence linking Microvascular Dysfunction with Heart failure with preserved ejection fraction. J. Am. Heart Assoc. 5, e003259 (2016). [DOI] [PMC free article] [PubMed] [Google Scholar]
- 8.Bhella, P. S. et al. Abnormal haemodynamic response to exercise in heart failure with preserved ejection fraction. Eur. J. Heart Fail. 13, 1296–1304 (2011). [DOI] [PMC free article] [PubMed] [Google Scholar]
- 9.Packer, M. & Kitzman, D. W. Obesity-related heart failure with a preserved ejection fraction: The mechanistic rationale for combining inhibitors of Aldosterone, Neprilysin, and sodium-glucose Cotransporter-2. JACC Heart Fail. 6, 633–639 (2018). [DOI] [PubMed] [Google Scholar]
- 10.Haykowsky, M. J. et al. Regional Adipose distribution and its relationship to Exercise Intolerance in older obese patients who have heart failure with preserved ejection fraction. JACC Heart Fail. 6, 640–649 (2018). [DOI] [PMC free article] [PubMed] [Google Scholar]
- 11.Kitzman, D. W. et al. Skeletal muscle abnormalities and exercise intolerance in older patients with heart failure and preserved ejection fraction. Am. J. Physiol. Heart Circ. Physiol. 306, H1364–H1370 (2014). [DOI] [PMC free article] [PubMed] [Google Scholar]
- 12.Keteyian, S. J. et al. Variables measured during Cardiopulmonary Exercise Testing as predictors of Mortality in Chronic Systolic Heart failure. J. Am. Coll. Cardiol. 67, 780–789 (2016). [DOI] [PMC free article] [PubMed] [Google Scholar]
- 13.Koike, A. et al. Oxygen uptake kinetics are determined by cardiac function at onset of exercise rather than peak exercise in patients with prior myocardial infarction. Circulation. 90, 2324–2332 (1994). [DOI] [PubMed] [Google Scholar]
- 14.Chatterjee, N. A. et al. Prolonged mean VO2 response time in systolic heart failure: An indicator of impaired right ventricular-pulmonary vascular function. Circ. Heart Fail. 6, 499–507 (2013). [DOI] [PMC free article] [PubMed] [Google Scholar]
- 15.Poole, D. C. & Jones, A. M. Oxygen uptake kinetics. Compr. Physiol. 2, 933–996 (2012). [DOI] [PubMed] [Google Scholar]
- 16.Hirai, D. M., Musch, T. I. & Poole, D. C. Exercise training in chronic heart failure: Improving skeletal muscle O2 transport and utilization. Am. J. Physiol. Heart Circ. Physiol. 309, H1419–H1439 (2015). [DOI] [PMC free article] [PubMed] [Google Scholar]
- 17.Hearon, C. M. Jr., Sarma, S., Dias, K. A., Hieda, M. & Levine, B. D. Impaired oxygen uptake kinetics in heart failure with preserved ejection fraction. Heart. 105, 1552–1558 (2019). [DOI] [PubMed] [Google Scholar]
- 18.von Elm, E. et al. The strengthening the reporting of Observational studies in Epidemiology (STROBE) statement: Guidelines for reporting observational studies. PLoS Med. 4, e296 (2007). [DOI] [PMC free article] [PubMed] [Google Scholar]
- 19.Ponikowski, P. et al. 2016 ESC guidelines for the diagnosis and treatment of acute and chronic heart failure: The Task Force for the diagnosis and treatment of acute and chronic heart failure of the European Society of Cardiology (ESC)developed with the special contribution of the Heart Failure Association (HFA) of the ESC. Eur. Heart J. 37, 2129–2200 (2016). [DOI] [PubMed] [Google Scholar]
- 20.Beaver, W. L., Wasserman, K. & Whipp, B. J. A new method for detecting anaerobic threshold by gas exchange. J Appl Physiol 1986;60:2020-7. (1985). [DOI] [PubMed]
- 21.Guazzi, M. et al. EACPR/AHA Joint Scientific Statement. Clinical recommendations for cardiopulmonary exercise testing data assessment in specific patient populations. Eur. Heart J. 33, 2917–2927 (2012). [DOI] [PubMed] [Google Scholar]
- 22.Quaresima, V. & Ferrari, M. Muscle oxygenation by near-infrared-based tissue oximeters. J. Appl. Physiol. (1985). 107, 371 (2009). author reply 372-3. [DOI] [PubMed] [Google Scholar]
- 23.Chiappa, G. R. et al. Kinetics of muscle deoxygenation are accelerated at the onset of heavy-intensity exercise in patients with COPD: Relationship to central cardiovascular dynamics. J Appl Physiol 2008;104:1341-50. (1985). [DOI] [PubMed]
- 24.Belardinelli, R., Barstow, T. J., Nguyen, P. & Wasserman, K. Skeletal muscle oxygenation and oxygen uptake kinetics following constant work rate exercise in chronic congestive heart failure. Am. J. Cardiol. 80, 1319–1324 (1997). [DOI] [PubMed] [Google Scholar]
- 25.Sietsema, K. E., Ben-Dov, I., Zhang, Y. Y., Sullivan, C. & Wasserman, K. Dynamics of oxygen uptake for submaximal exercise and recovery in patients with chronic heart failure. Chest. 105, 1693–1700 (1994). [DOI] [PubMed] [Google Scholar]
- 26.Taniguchi, Y. et al. A new method using pulmonary gas-exchange kinetics to evaluate efficacy of beta-blocking agents in patients with dilated cardiomyopathy. Chest. 124, 954–961 (2003). [DOI] [PubMed] [Google Scholar]
- 27.Mettauer, B. et al. VO(2) kinetics reveal a central limitation at the onset of subthreshold exercise in heart transplant recipients. J Appl Physiol 2000;88:1228-38. (1985). [DOI] [PubMed]
- 28.Sullivan, M. J., Knight, J. D., Higginbotham, M. B. & Cobb, F. R. Relation between central and peripheral hemodynamics during exercise in patients with chronic heart failure. Muscle blood flow is reduced with maintenance of arterial perfusion pressure. Circulation. 80, 769–781 (1989). [DOI] [PubMed] [Google Scholar]
- 29.Nakamura, M. Pharmacological modulations of the renin-angiotensin-aldosterone system in human congestive heart failure: Effects on peripheral vascular endothelial function. Curr. Vasc. Pharmacol. 2, 65–70 (2004). [DOI] [PubMed] [Google Scholar]
- 30.Bauersachs, J. & Widder, J. D. Endothelial dysfunction in heart failure. Pharmacol. Rep. 60, 119–126 (2008). [PubMed] [Google Scholar]
- 31.Musch, T. I. & Terrell, J. A. Skeletal muscle blood flow abnormalities in rats with a chronic myocardial infarction: Rest and exercise. Am. J. Physiol. 262, H411–H419 (1992). [DOI] [PubMed] [Google Scholar]
- 32.Tschakovsky, M. E. & Hughson, R. L. Rapid blunting of sympathetic vasoconstriction in the human forearm at the onset of exercise. J Appl Physiol 2003;94:1785-92. (1985). [DOI] [PubMed]
- 33.Sarma, S. & Levine, B. D. Soothing the sleeping giant: Improving skeletal muscle oxygen kinetics and exercise intolerance in HFpEF. J. Appl. Physiol. 119, 734–738. (1985). [DOI] [PubMed]
- 34.Hughson, R. L. & Kowalchuk, J. M. Beta-blockade and oxygen delivery to muscle during exercise. Can. J. Physiol. Pharmacol. 69, 285–289 (1991). [DOI] [PubMed] [Google Scholar]
- 35.Gianrossi, R. et al. Effect of Beta-blockade on Postexercise Oxygen Uptake Kinetics in patients with chronic heart failure. Heart Drug. 1, 148–154 (2001). [Google Scholar]
- 36.Witte, K. K., Thackray, S., Nikitin, N. P., Cleland, J. G. & Clark, A. L. The effects of long-term beta-blockade on the ventilatory responses to exercise in chronic heart failure. Eur. J. Heart Fail. 7, 612–617 (2005). [DOI] [PubMed] [Google Scholar]
- 37.Puente-Maestu, L. et al. Reproducibility of the parameters of the on-transient cardiopulmonary responses during moderate exercise in patients with chronic obstructive pulmonary disease. Eur. J. Appl. Physiol. 85, 434–441 (2001). [DOI] [PubMed] [Google Scholar]
Associated Data
This section collects any data citations, data availability statements, or supplementary materials included in this article.
Data Availability Statement
The datasets used and/or analysed during the current study available from the corresponding author on reasonable request.