Abstract
BACKGROUND
Pancreatic cancer is one of the most lethal malignancies, characterized by poor prognosis and low survival rates. Traditional prognostic factors for pancreatic cancer offer inadequate predictive accuracy, often failing to capture the complexity of the disease. The hypoxic tumor microenvironment has been recognized as a significant factor influencing cancer progression and resistance to treatment. This study aims to develop a prognostic model based on key hypoxia-related molecules to enhance prediction accuracy for patient outcomes and to guide more effective treatment strategies in pancreatic cancer.
AIM
To develop and validate a prognostic model for predicting outcomes in patients with pancreatic cancer using key hypoxia-related molecules.
METHODS
This pancreatic cancer prognostic model was developed based on the expression levels of the hypoxia-associated genes CAPN2, PLAU, and CCNA2. The results were validated in an independent dataset. This study also examined the correlations between the model risk score and various clinical features, components of the immune microenvironment, chemotherapeutic drug sensitivity, and metabolism-related pathways. Real-time quantitative PCR verification was conducted to confirm the differential expression of the target genes in hypoxic and normal pancreatic cancer cell lines.
RESULTS
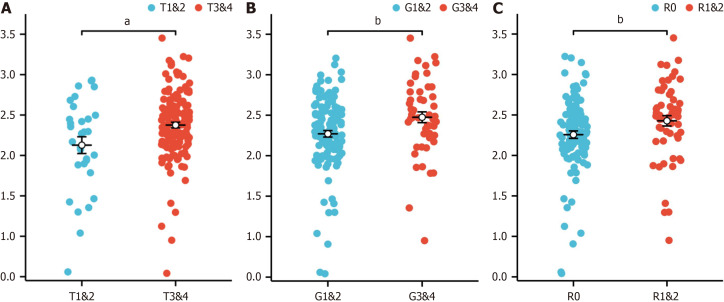
The prognostic model demonstrated significant predictive value, with the risk score showing a strong correlation with clinical features: It was significantly associated with tumor grade (G) (bP < 0.01), moderately associated with tumor stage (T) (aP < 0.05), and significantly correlated with residual tumor (R) status (bP < 0.01). There was also a significant negative correlation between the risk score and the half-maximal inhibitory concentration of some chemotherapeutic drugs. Furthermore, the risk score was linked to the enrichment of metabolism-related pathways in pancreatic cancer.
CONCLUSION
The prognostic model based on hypoxia-related genes effectively predicts pancreatic cancer outcomes with improved accuracy over traditional factors and can guide treatment selection based on risk assessment.
Keywords: Pancreatic cancer, Hypoxia, Prognostic model, Immune microenvironment, Metabolism pathway
Core Tip: In this study, a prognostic model based on the expression levels of the hypoxia-related genes CAPN2, PLAU, and CCNA2 was developed for pancreatic cancer. Compared with traditional methods, the model demonstrated superior predictive accuracy, and the model risk score was strongly correlated with clinical features such as cancer stage and tumor size. The risk score was also significantly associated with chemotherapy drug sensitivity and metabolic pathway activity. These findings highlight the model's potential to enhance personalized treatment selection and improve prognosis.
INTRODUCTION
Among cancers, pancreatic cancer has a highly unsatisfactory prognosis worldwide and has the third-highest mortality rate in the United States; it has a very high degree of malignancy[1]. According to statistics, the 5-year survival rate of patients with pancreatic cancer is less than 5%[2]. It is very aggressive and characterized by dense interstitial tissue, severe hypoxia, and an immunosuppressive microenvironment[3], and its rapid progression, late onset of symptoms, and lack of specific diagnostic methods are the main reasons for its poor prognosis[4]. Past studies have investigated some of the regulatory mechanisms and signalling pathways involved in pancreatic cancer. In recent years, diagnostic and therapeutic methods have been partially improved with the development of related research, but the low 5-year survival rate still indicates the need for a new model[5].
The tumor microenvironment, which encompasses the cellular milieu in which tumors subsist, proliferate, and infiltrate, has garnered increasing amounts of scholarly interest due to the expanding recognition of its pivotal role in facilitating intricate interactions between tumors and adjacent microenvironments[6]. Within the context of pancreatic cancer, the microenvironment comprises a minor subset of malignant cells, while fibroblasts, extracellular matrix, endothelial cells, and haematopoietic cells are highly abundant; these components collectively form the intricate pancreatic cancer microenvironment[7]. The formation of an anoxic microenvironment in tumors is mainly due to the high and rapid oxygen consumption of tumors, and the growth of new capillaries is not yet possible, resulting in an anoxic state in the interior of tumors[8]. Moreover, pancreatic cancer highly promotes hyperplasia of connective tissue, which is also an important reason for the formation of an anoxic tumor microenvironment in pancreatic cancer patients. For many patients, intratumoral hypoxia has an adverse effect on prognosis because it is associated with tumor aggressiveness and distant metastasis[9].
The interaction between tumors and the immune system plays a crucial role in the initiation, progression, and treatment of cancer[10]. tumor-associated immune cells may have antitumor or protumor functions[11]. While antitumor immune cells frequently exhibit efficacy in targeting and eliminating tumor cells during the initial phases of tumor development, certain cancer cells eventually manage to evade immune surveillance and actively inhibit the cytotoxic functions of antitumor immune cells through a variety of mechanisms[12]. These findings suggest that the tumor immune microenvironment plays a role in tumor regulation.
Hypoxia and the immune microenvironment play important roles in the tumor microenvironment of pancreatic cancer and in the progression of pancreatic cancer. Through bioinformatics analysis, we conducted screening to identify genes associated with hypoxia in pancreatic cancer and constructed a prognostic model linked to hypoxia, aiming to elucidate the influence of the prognostic model risk score on the immune microenvironment. This study provides new insights into the prognosis and treatment of pancreatic cancer.
MATERIALS AND METHODS
Cell culture and reagents
The human pancreatic cancer cell line (PANC-1) human pancreatic cancer cell line and the human telomerase reverse transcriptase-immortalized human pancreatic nestin-expressing (hTERT-HPNE) normal pancreatic ductal cell line were stored in the repository of the Department of Hepatobiliary and Pancreatic Medicine at the Affiliated Hospital of Qingdao University (originally obtained from Procell Life Science & Technology). PANC-1 and hTERT-HPNE cells were cultured in DMEM supplemented with 10% fetal bovine serum and 1% penicillin-streptomycin (P/S) (Meilunbio) in a humidified incubator at 37 °C with 5% carbon dioxide. To induce a hypoxic environment, PANC-1 cells were subjected to 24 hours of culture in an anoxic setting using the Ruskinn Invivo 2400 Hypoxia Workstation.
Search for genes involved in hypoxia
Using gene expression profiling interactive analysis 2 (GEPIA2)[13], we systematically explored the unique gene expression patterns in pancreatic cancer utilizing the log2FoldChange (logFC) and P value as criteria for screening differentially expressed genes (DEGs). Genes with P < 0.05 were considered to be differentially expressed, with log2 fold change (log2FC) > 2 denoting upregulation and log2FC < -2 indicating downregulation. Next, the top ranked genes were visualized using volcano plots.
Identification of prognostic genes
We used the clusterProfiler package (for enrichment analysis), the msigdbr package (reference gene set sources), and molecular signatures database (MSigDB) gene sets for Gene Ontology (GO)/Kyoto Encyclopedia of Genes and Genomes (KEGG) enrichment analysis of DEGs. The genes enriched in pathways and gene sets related to hypoxia were further investigated.
We constructed a protein-protein interaction (PPI) network composed of genes related to the above hypoxia pathways via search tool for the retrieval of interacting genes/proteins (STRING)[14].
We used the “betweenness” algorithm to calculate the scores of hypoxia-related genes in the PPI network. Using the "survival" package, we performed univariate Cox regression analysis of the top 30 genes.
Construction of a prognostic model
We used the "betweenness" algorithm to assess the betweenness among "30 genes related to hypoxia and performed univariate Cox regression analysis to assess the betweenness among prognostic genes with P < 0.05. We then used prognostic least absolute shrinkage and selection operator (LASSO) coefficients to screen these hypoxia- and prognosis-related genes to construct a prognostic model. Specifically, we constructed a LASSO prognostic model, calculated the lambda value of the model, calculated the coefficient of the variable according to the lambda value, and identified variables with coefficients of 0 by screening and excluded them. In the prognostic model, a coefficient of 0 indicates that there is no correlation between the variables; therefore, these variables have no real significance in the prognostic model.
Relevant RNAseq data and clinical information for pancreatic adenocarcinoma (PAAD) patients were obtained from the cancer genome atlas (TCGA) database (https://portal.gdc.cancer.gov). Employing the "glmnet" package, we integrated survival time, survival status, and gene expression data (Supplementary Table 1). The LASSO coefficient screening process was used to assess the statistics corresponding to each lambda value, facilitating variable selection for the construction of the prognostic model. Analysis of overall survival (OS) was performed for PAAD patients into high-risk and low-risk groups based on the median risk score. Utilizing the "time-dependent receiver operating characteristic (ROC)" software package, we generated a ROC curve to assess the prognostic efficacy of the model.
Validation of the prognostic model
To validate our model, we conducted cross-validation using the GSE62452 dataset (Supplementary Table 2). Simultaneously, we employed the "rms" and "survival" packages to compare the model's predictions with against actual outcomes, graphically representing the model's actual and predicted probabilities under diverse conditions. To assess the prognostic superiority of the model over conventional clinical scoring systems, ROC curves were generated for risk scores and relevant clinical variables using the "pROC" software package. Univariate Cox analyses were also conducted for clinicopathological characteristics, including histological grade and T stage, to evaluate the factors with predictive potential for inclusion in the risk score model.
Correlation of clinical prognostic factors with the risk score based on the model
In addition, we analysed the correlation between the risk score derived from our prognostic model and the clinical characteristics of TCGA-PAAD patients. Patients were stratified based on clinical features, and the associations between the risk score and these features in the TCGA-PAAD cohort were thoroughly examined.
Analysis of the infiltration level of immune cells
Using the Single-sample Gene Set Enrichment Analysis algorithm from the "Gene Set Variation Analysis (GSVA)" package[15], we evaluated the association of infiltrating immune cells with the risk score based on the prognostic model by employing the 24 immune cell markers detailed in the Immunity article[16]. Moreover, the expression levels of immune checkpoint molecules in TCGA-PAAD patients were assessed.
Using the TCGA-PAAD matrix, the linear ridge function of the ridge package was used for ridge regression analysis to predict the sensitivity of patients to specific drugs. When risk group was considered, the groups displayed differences in drug sensitivity.
Differential enrichment of signalling pathways between hypoxia-related risk groups
The "limma" package was used to analyse the difference between the high- and low-risk groups for hypoxia. After the analysis, the DEGs between risk groups were extracted for gene set enrichment analysis (GSEA). The "KEGG representational state transfer (KEGGREST)" package was used to extract metabolism-related pathways and their related genes from the KEGG database. The enrichment levels of metabolism-related pathways in different hypoxia risk groups were analysed via GSVA.
Real-time quantitative PCR
Total RNA was extracted from PANC-1, hypoxic-treated PANC-1, and hTERT-HPNE cells via incubation in Tri-Reagent (TRIzol) (Invitrogen); reverse transcription was performed using the PrimeScript RT-PCR Kit (Takara, Japan), and RT-qPCR was conducted on an Agilent AriaMX (Agilent) employing SYBR Green (SYBR) (Takara, Japan). Supplementary Table 3 contains the sequences of primers used in this study.
Statistical analysis
A paired t test or unpaired t test was used to compare experimental data between groups, and one-way analysis of variance was used to compare multiple groups. The figures were generated using GraphPad Prism 7 (GraphPad Software, Inc., La Jolla, CA, United States) and Photoshop software (Adobe, Version CS5.1).
RESULTS
Search for genes associated with hypoxia
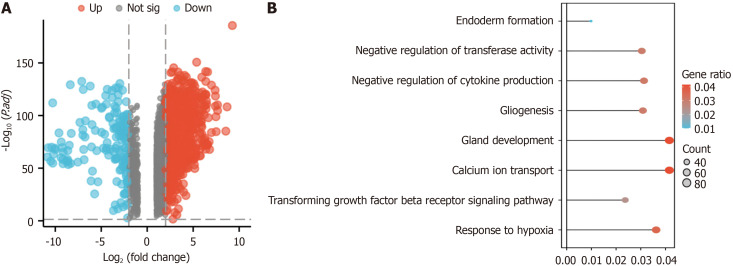
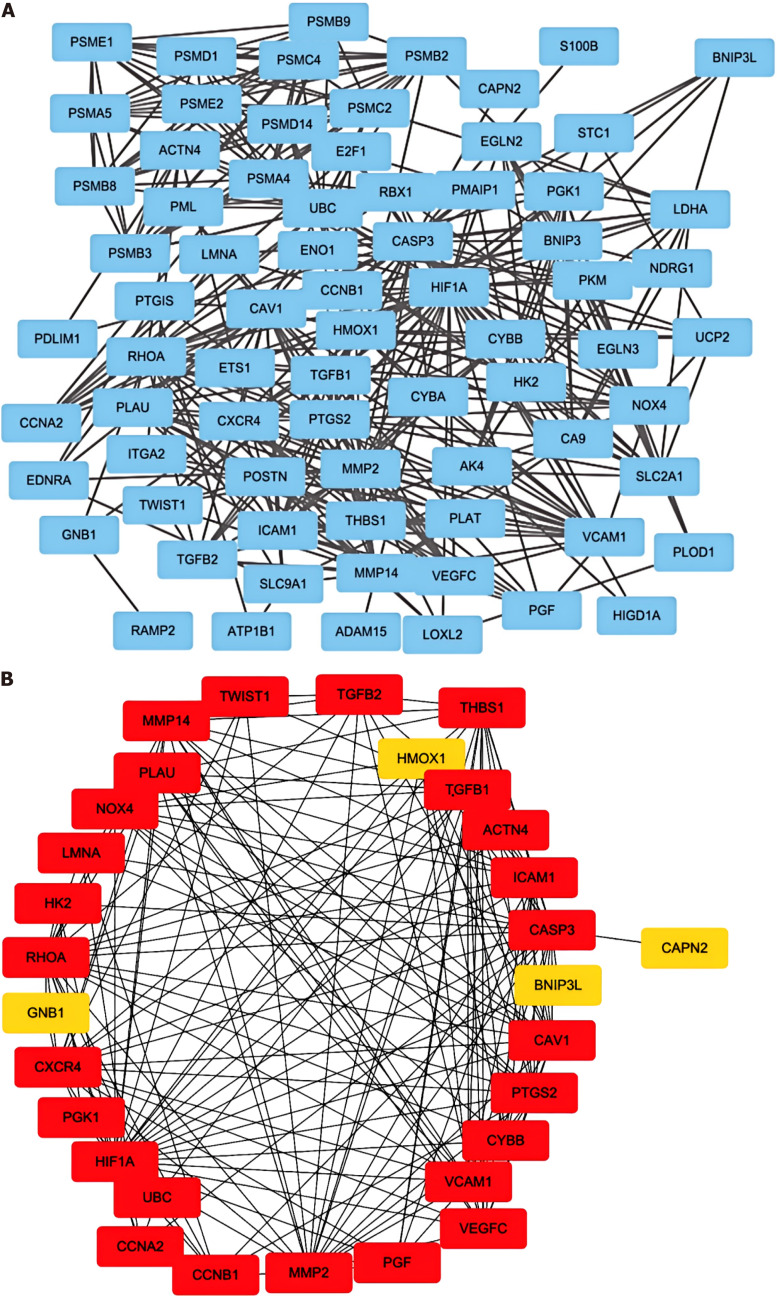
Through gene expression analysis, a comprehensive screening process identified 9221 DEGs, consisting of 2457 upregulated genes and 158 downregulated genes (Figure 1A). We analyzed the enrichment of the 9211 DEGs in hypoxia-related pathways via GO and KEGG analyses (Figure 1B). The DEGs were enriched in the response to hypoxia pathway (GO: 0001666, 81 genes identified in total) (Figure 2A).
Figure 1.
Identification and enrichment analysis of differentially expressed genes in the GEPIA2 dataset. A: Genes differentially expressed in pancreatic cancer according to GEPIA2; upregulated in red (2457 upregulated genes) and downregulated in blue (2457 upregulated genes (158 downregulated genes); B: Gene Ontology and Kyoto Encyclopedia of Genes and Genomes enrichment analyses of the differentially expressed genes in the GEPIA2 pancreatic cancer dataset.
Figure 2.
Visualization of genes associated with hypoxia pathways. A: The protein-protein interaction network of the proteins related to the Gene Ontology (GO): 0001666 gene set; B: The direct interactions among thirty genes in GO: 0001666 were assessed via the “betweenness” algorithm.
We identified 30 genes involved in the hypoxia pathway via screening with the STRING database (Figure 2B). Genes with P < 0.05 were identified by screening via univariate Cox regression analysis of key hypoxia-related genes (Supplementary Table 4).
Construction of a prognostic model
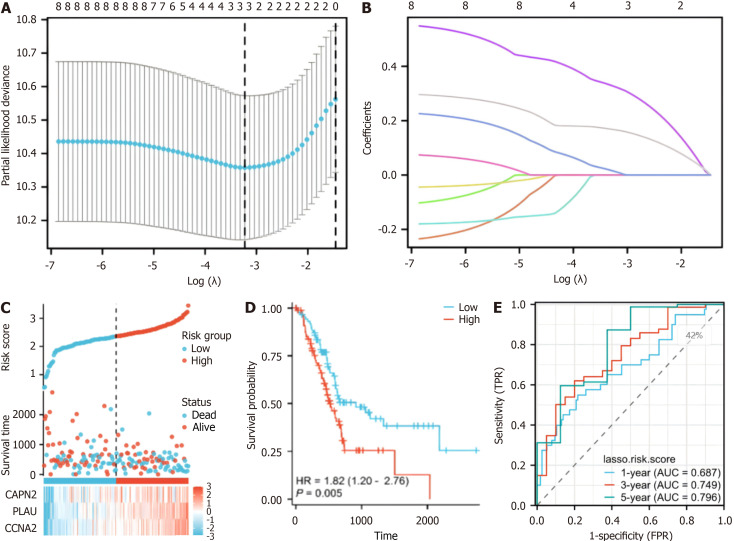
A prognostic model was developed for all cancer samples in the training set, and the risk score was calculated as follows: Risk score = 0.00701516690012852 × CAPN2 + 0.163284368708758 × PLAU + 0.317555399984732 × CCNA2 (Figure 3A and B). To assess the ability of our model to predict pancreatic cancer prognosis, 178 patients were categorized into high-risk (n = 89) and low-risk (n = 89) groups (Figure 3C). Cox regression analysis demonstrated a statistically significant difference in the distribution of survival time between the risk groups (P = 0.005) (Figure 3D) and indicated a poorer prognosis in the high-risk group. Additionally, CAPN2, PLAU, and CCNA2 exhibited higher expression levels in the high-risk group and lower expression levels in the low-risk group (Figure 3C). Time-dependent ROC curve analysis revealed a 1-year area under the curve (AUC) (which indicates prognostic accuracy) of 0.687 (95%CI: 0.6158-0.8084), a 3-year AUC of 0.749 (95%CI: 0.5969-0.8341), and a 5-year AUC of 0.796 (95%CI: 0.6218-0.9497) for OS (Figure 3E). These findings suggest that the hypoxia-related gene-based prognostic model can effectively predict the prognosis of pancreatic cancer.
Figure 3.
Risk score analysis, prognostic performance, and survival analysis based on the prognostic model. A: Least absolute shrinkage and selection operator (LASSO) regression analysis with tenfold cross-validation was performed to construct a model based on 3 hypoxia-related genes; B: The coefficient distribution in the LASSO regression model; C: Risk scores and survival time distribution of patients in the cancer genome atlas-pancreatic adenocarcinoma (TCGA-PAAD) cohort stratified by the risk score of the hypoxia-related model; D: Kaplan-Meier analysis of overall survival (OS) for the risk groups in the TCGA-PAAD cohort (P = 0.005); E: The receiver operating characteristic curves of the risk score model for predicting 1-year [area under the curve (AUC) = 0.687], 3-year (AUC = 0.749), and 5-year (AUC = 0.796) OS in the TCGA-PAAD cohort.
Validation of prognostic model
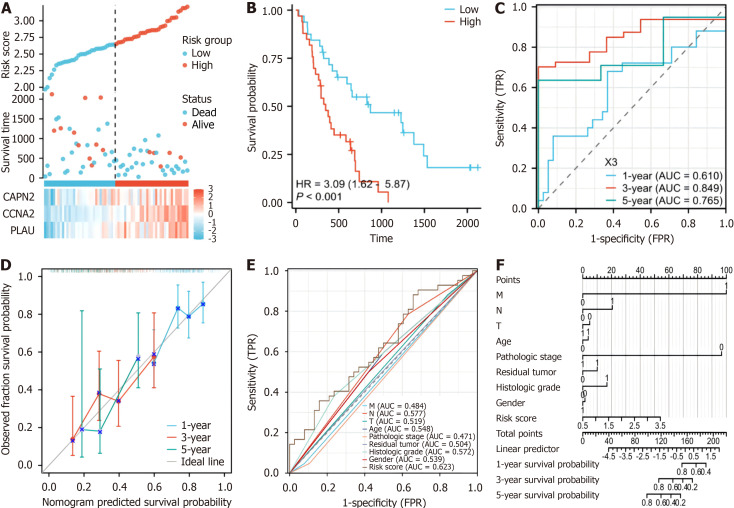
To assess the precision of the established prognostic model, an additional validation dataset on 65 patients with pancreatic cancer (GSE62452) was assessed. The risk score was computed using the same formula used for the training cohort, and the patients in the validation cohort were stratified into a high-risk subgroup (n = 33) and a low-risk subgroup (n = 32) based on the median risk score (Figure 4A). Like in the training cohort, in the high-risk cohort, patients exhibited significantly shorter survival (P < 0.001) (Figure 4B). Time-dependent ROC curve analysis revealed a 1-year AUC (indicating prognostic accuracy) of 0.765 (95%CI: 0.463-0.7643) and a 3-year AUC of 0.849 (95%CI: 0.6934-0.9195). The 5-year AUC for OS was 0.809 (95%CI: 0.6053-1.0127) (Figure 4C). These validation results reinforce the robustness of our prognostic model across distinct datasets.
Figure 4.
Analysis of the risk score model and its prognostic performance of the validation set prognostic model. A: The risk score and survival time distribution of hypoxia-related genes in the verification cohort; B: Kaplan-Meier survival analysis of overall survival (OS) between risk groups in the verification cohort (P < 0.001); C: The verification set receiver operating characteristic (ROC) curves of the risk scoring model for predicting 1-year [area under the curve (AUC) = 0.765], 3-year (AUC = 0.845), and 5-year OS (AUC = 0.809) survival; D: Nomogram calibration curves for predicting 1-year, 3-year, and 5-year OS in the cancer genome atlas-pancreatic adenocarcinoma cohort; E: ROC curves for the prediction of survival based on the risk score and other variables (M, N, T, age, pathologic stage, residual tumor, neoplasm histologic grade, and LASSO-derived risk score); F: Nomogram of the risk score and traditional prognostic factors. AUC: Area under the curve.
Furthermore, calibration curves were generated, revealing the congruence of our model with the observed survival patterns in patients with PAAD (Figure 4D). The results of the formulation of a nomogram incorporating risk scores and conventional prognostic factors (Figure 4F) revealed that our model displayed an increased AUC compared to that of traditional clinical parameters (Figure 4F). This finding emphasizes the heightened predictive accuracy of our model, underscoring its potential as a robust tool for clinical prognostication.
Correlations of clinical prognostic factors with the model risk score
When the correlations between the risk score associated with hypoxia and the clinicopathological characteristics of TCGA-PAAD patients were analysed, the risk score was found to be closely associated with tumor stage (T) (Figure 5A), tumor grade (G) (Figure 5B), and residual tumor status (R) (Figure 5C). These results underscore the potential of our prognostic model to discern and stratify risk across patients with various clinical features, providing valuable insights into the heterogeneity of PAAD.
Figure 5.
Association between clinical features and the risk score in the cancer genome atlas-pancreatic adenocarcinoma dataset. A: T stage (T1 and T2 vs T3 and T4); B: G stage (G1 and G2 vs G3 and G4); C: Residual tumor status (R0 vs R1 and R2). aP < 0.05, bP < 0.01.
Analysis of the infiltration levels of immune cells
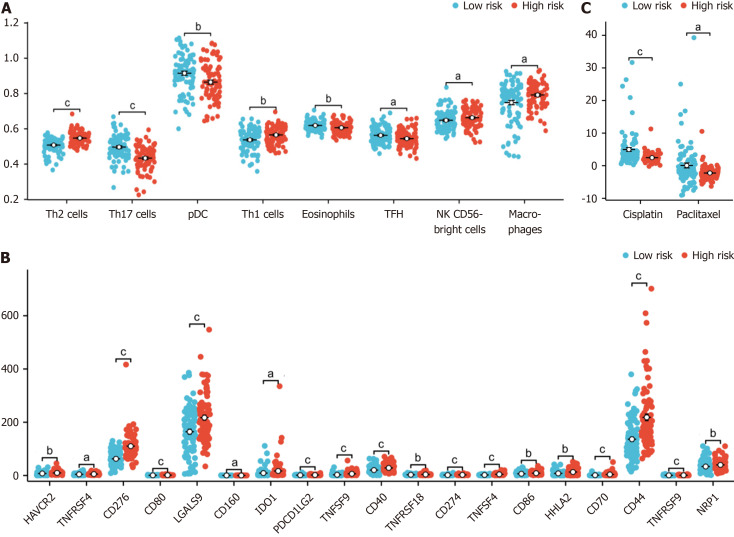
We found that the proportions of macrophages, T helper 1 cells (Th1) , activated dendritic cells (aDCs), “natural killer CD56bright cells (NK CD56bright cells) and T helper 2 cells (Th2) were higher in the high-risk group, while those of T helper 17 cells (Th17), plasmacytoid dendritic cells (pDCs), eosinophils, t follicular helper (TFH), mast cells, CD8 T cells, immature dendritic cells, T cells, B cells, cytotoxic cells and Tem cells were lower in the high-risk group (Figure 6A).
Figure 6.
Association of immune infiltration with the risk score in the cancer genome atlas-pancreatic adenocarcinoma dataset. A: Box plot showing the difference in the level of immune cell infiltration between the high-risk and low-risk groups; B: The box plot shows the difference in immune checkpoint expression between the high-risk and low-risk groups; C: The estimated half-maximal inhibitory concentration of different hypoxia-related risk groups. aP < 0.05, bP < 0.01, cP < 0.001.
We also found that cluster of CD276, TNFSF4, CD70, TNFSF9, CD44, CD80, CD274, CD40, TNFRSF9, PDCD1 LG2, LGALS9, CD86, HHLA2, HAVCR2, NRP1, TNFRSF18, TNFRSF4, IDO1 and CD160 were differentially expressed between high-risk and low-risk patients grouped according to our model (Figure 6B).
We also explored the relationship between the hypoxia-related risk score and the effect of chemotherapy on PAAD treatment. We found that the half-maximal inhibitory concentrations (IC50) of the chemotherapy drugs cisplatin and paclitaxel were lower in the high-risk group (Figure 6C).
Differential enrichment of signal pathways between hypoxia-related risk groups
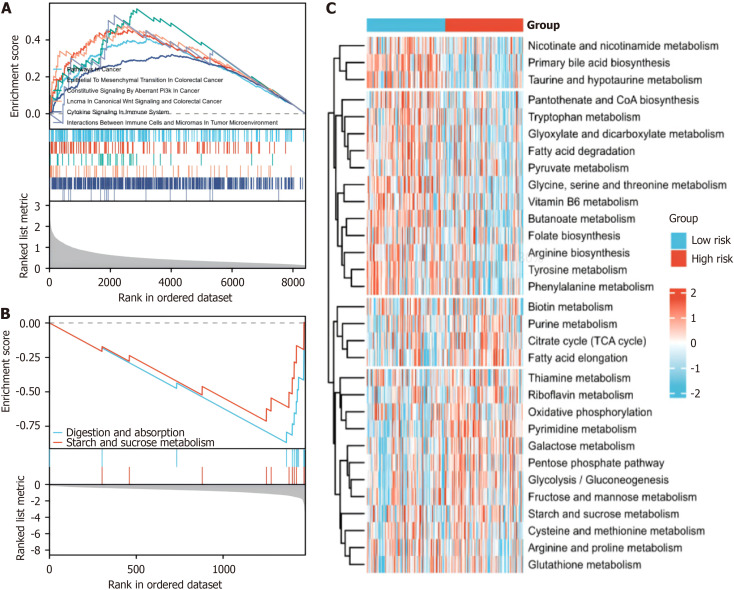
GSEA revealed enrichment of pathways related to tumor progression and immunity in the high-risk group (Figure 7A), whereas pathways associated with tumor progression and immunity were less enriched in the low-risk group (Figure 7B). Our GSVA further revealed substantial alterations in metabolic pathways among the distinct hypoxia risk groups (Figure 7C). This comprehensive examination sheds light on the intricate interplay between hypoxia, the immune response, and metabolic dynamics in pancreatic cancer, offering valuable insights into potential therapeutic avenues.
Figure 7.
Enrichment of signalling pathways in the hypoxia-related risk groups. A: gene set enrichment analysis (GSEA) of the differentially expressed genes in the high-risk group based on the hypoxia-related model; B: GSEA of differentially expressed genes in the low-risk and high-risk groups based on the hypoxia-related model; C: Gene Set Variation Analysis of the enrichment of metabolic pathways in different risk groups based on the hypoxia-related model.
RT-qPCR
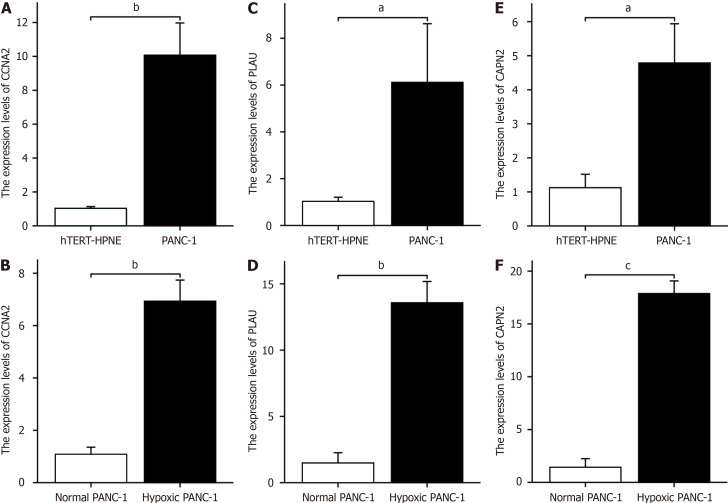
The RT-PCR results revealed that CCNA2 was highly expressed in PANC-1 cells and hTERT-HPNE cells (Figure 8A). The expression levels of CCNA2 in PANC-1 cells subjected to hypoxia was greater than those in untreated cells (Figure 8B). Similarly, PLAU was highly expressed in PANC-1 cells and hTERT-HPNE cells (Figure 8C), the expression levels of CCNA2 in PANC-1 cells subjected to hypoxia was greater than those in untreated cells (Figure 8D). Additionally, CAPN2 was highly expressed in both PANC-1 cells and hTERT-HPNE cells (Figure 8E), the expression levels of CCNA2 in PANC-1 cells subjected to hypoxia was greater than those in untreated cells (Figure 8F).
Figure 8.
Hypoxia key gene expression changes in hTERT-HPNE cells, normal PANC-1 cells, and hypoxic PANC-1 cells. A: CCNA2 expression in PANC-1 and hTERT-HPNE cells; B: CCNA2 expression in hypoxia-treated vs untreated PANC-1 cells; C: PLAU expression in PANC-1 and hTERT-HPNE cells; D: PLAU expression in hypoxia-treated vs untreated PANC-1 cells; E: CAPN2 expression in PANC-1 and hTERT-HPNE cells; F: CAPN2 expression in hypoxia-treated vs untreated PANC-1 cells. aP < 0.05, bP < 0.01, cP < 0.001.
DISCUSSION
Pancreatic cancer mainly originates from the pancreatic ductal epithelium; its symptoms are not obvious, and it is difficult to diagnose this disease early[17]. It has a very poor prognosis and a high mortality rate worldwide[18]. Its onset is insidious, and there are no specific symptoms at the beginning of the disease; once there are obvious symptoms, most tumors have reached the advanced stage, which is one of the reasons for the poor prognosis of pancreatic cancer[19]. In this context, identifying new high-efficiency prognostic models that contribute to clinical diagnosis, treatment, and prognosis evaluation is critical. Overall, we conducted a comprehensive analysis of pancreatic cancer using gene expression omnibus, TCGA, and genotype-tissue expression data and searched for relevant key molecules in the anoxic tumor microenvironment of pancreatic cancer to construct a prognostic model.
Hypoxia is one of the main factors leading to the malignant progression of pancreatic cancer[20]. Hypoxia occurs when the oxygen supply is insufficient to meet the metabolic needs of the tissues[21]. A hypoxic environment can promote the survival and proliferation of cancer cells and induce the expression of genes related to angiogenesis and metastasis, leading to the formation of abnormal and inefficient blood vessels and further leading to a hypoxic environment[22]. Recent studies have shown that HIF-1 plays an important role in this process. Hypoxia-induced HIF-1a overexpression can decrease caspase-3 and caspase-9 expression and inhibit tumor cell apoptosis[23].
Previous studies have highlighted the critical role of hypoxia in pancreatic cancer progression and prognosis. Lin et al[24] identified that hypoxia-induced exosomal circPDK1 promotes pancreatic cancer glycolysis via c-myc activation. Liu et al[25] revealed that m6A methylation regulates hypoxia-induced pancreatic cancer glycolytic metabolism through an ALKBH5-HDAC4-HIF1α positive feedback loop. Chen et al[26] showed that in the hypoxic environment of pancreatic cancer, exosomal miR-30b-5p promotes tumor angiogenesis by inhibiting GJA1 expression. These studies collectively demonstrate the complex interplay between hypoxia, exosomes, epigenetic modifications, and cellular metabolism in pancreatic cancer, providing insights into potential therapeutic targets and diagnostic markers. Our study builds upon these findings by focusing on a more refined set of genes and their specific roles in the hypoxic pancreatic cancer microenvironment.
In recent years, an increasing focus has been placed on biomarkers, prognostic markers, and prognostic models in the context of pancreatic ductal adenocarcinoma[27]. We performed enrichment analysis of DEGs between risk grounds in the PAAD dataset via GEPIA2 and constructed a PPI network, and these analyses revealed genes associated with hypoxia. Through univariate Cox analysis, we further screened hypoxia- and prognosis-related genes (CAPN2, PLAU, and CCNA2) from among the above genes and established a prognostic model via LASSO analysis. According to rigorous validation and analysis, our model demonstrated robust reliability in prognosis prediction for pancreatic cancer patients, exhibiting superior performance compared to conventional clinical prognostic factors, as indicated by the area under the ROC curve. The close correlation of our prognostic model with key clinical features, including tumor grade, T stage, and residual tumor status, emphasizes its potential utility for clinicians. Consequently, our model offers a valuable tool for improving the prognosis of pancreatic cancer patients, as it facilitates more effective and timely treatment and reveals potentially effective intervention options.
Our analysis identified three key hypoxia- and prognosis-related genes: PLAU, CCNA2, and CAPN2. PLAU is crucial for extracellular matrix degradation and angiogenesis[28]. CCNA2 regulates cancer cell growth and influences the tumor immune microenvironment[29]. CAPN2 promotes epithelial-mesenchymal transition in pancreatic cancer[30]. These genes likely play significant roles in hypoxia-mediated pancreatic cancer progression, highlighting their potential as prognostic markers and therapeutic targets.
The microenvironment of pancreatic cancer has a crucial and complex impact on the biological behaviour of cancer cells[31]. As the tumor evolves, its tissue structure and function dynamically change, forming an immunosuppressive environment that facilitates tumor cell evasion of immune surveillance[32]. Patients with rapidly progressing PAAD typically exhibit insufficient infiltration of immune cells in the tumor immune microenvironment[33]. Research has shown that the NLRP3 signalling pathway and Dectin-1 signalling pathway mediate the predominant effects of immunosuppressive Th2 cells and regulatory T cells in the response of CD4+ T lymphocytes, thereby exacerbating the immunosuppressive effect of the pancreatic cancer microenvironment[34]. NK cells are cytotoxic lymphocytes that are essential for the innate immune system[35]. CD56bright NK cells (10% of the total NK cells) are inhibitory[36]. IL-27 is an antigen-presenting cell-derived cytokine that can transmit regulatory activity to NK cells positive for CD56, mediating their inhibitory effect on T cells and thus playing an important role in autoimmune regulation[37]. In our study, we observed a significant positive correlation between the proportions of Th2 cells and NK CD56bright cells in the immune microenvironment of pancreatic cancer patients and a high risk score based on our hypoxia-related prognostic model, demonstrating that these cells are highly invasive in the high-risk group. In contrast, Th17, pDCs, eosinophils, and TFH cells were significantly negatively correlated with the risk score of our hypoxia-related prognostic model, indicating decreased invasion in the high-risk group. In our research, the high invasion of immunosuppressive cells and significantly reduced invasion of immune effector cells in the immune microenvironment of high-risk pancreatic cancer patients indicate that hypoxia influences the immune suppression of pancreatic cancer. Patients with rapidly progressing PAAD typically exhibit insufficient infiltration of immune cells in the tumor immune microenvironment.
The immune checkpoint programmed death-ligand 1 (PD-L1) (CD274) is an important immune regulatory molecule that primarily inhibits the activity of immune cells by binding to programmed death-1 (PD-1) on the surface of immune cells to prevent excessive immune responses[38]. Overexpression of PD-L1 has been observed in various cancers and is associated with tumor progression, metastasis, and treatment resistance[39]. In our study, the immune checkpoint programmed death 1 (PD-1) was significantly upregulated in the group of pancreatic cancer patients at high risk of hypoxia. The excessive activation of these immune checkpoints in patients at high risk of hypoxia prevents immune cells from attacking tumor cells, thereby helping tumor cells evade immune surveillance and clearance[40]. We analysed the relationship between our model risk score and the immune microenvironment by assessing the levels of infiltrating immune cells in high-risk and low-risk patients. Furthermore, we investigated the correlation between hypoxia risk factors and treatment outcomes in PAAD patients. Our findings suggest a significant correlation between the risk score based on the prognostic model and IC50 of chemotherapeutic drugs such as cisplatin and paclitaxel. These findings indicate that the sensitivity of tumor cells to chemotherapeutic drugs such as cisplatin and paclitaxel may be affected by the hypoxic tumor microenvironment in pancreatic cancer. This discovery underscores the potential role of the hypoxia-related prognostic model we constructed in assessing chemotherapy sensitivity and devising personalized treatment plans. Therefore, accurate assessment and monitoring of risk factors in prognostic models, as well as research on their correlation with chemotherapy drug sensitivity, are of paramount importance for optimizing treatment strategies for cancer patients.
There is a strong link between hypoxia and metabolism, especially at the cellular and tissue levels[41]. In hypoxic environments, cells often choose to produce energy through lactic acid fermentation rather than through oxidative phosphorylation[42]. This choice stems from the fact that lactic acid fermentation is a more rapid way to produce ATP in the absence of oxygen, helping to meet the energy needs of cells[43]. Hypoxia may lead to disruption of the reduction-oxidation (REDOX) balance in cells, which in turn affects multiple metabolic pathways[44]. In our study, GSVA revealed that, compared with those in the low-risk group, the expression of genes in multiple metabolic pathways, including those involved in the REDOX pathway and tricarboxylic acid cycle, tended to increase or decrease, respectively. Dysregulation of these pathways may be a key factor affecting the prognosis of pancreatic cancer. Moreover, through GSEA, we observed significant differences in survival in the high-risk group, with significant enrichment of tumor-related and immune-related pathways, including cytokine signalling in the immune system and interactions between immune cells and microRNAs in the tumor microenvironment; moreover, no significant enrichment was observed in the low-risk group. Hypoxia is closely related to the immunosuppressive microenvironment, which profoundly affects the progression of tumors[45].
Through RT-qPCR analysis, our investigation revealed notable differences in the expression levels of critical hypoxia-related genes (CAPN2, PLAU, and CCNA2) in pancreatic cancer cells subjected to a hypoxic environment compared to those in untreated pancreatic cancer cells. The substantial upregulation of these genes implies their potential pivotal role in promoting the progression of pancreatic cancer.
While our study provides insights into the role of hypoxia-related genes in the prognosis of patients with pancreatic cancer, there are some limitations related to its retrospective nature, so prospective clinical validation studies are needed. Future research should focus on validating our model's predictive power through prospective trials, exploring the complex interactions between hypoxia and other tumor microenvironment factors, and elucidating the underlying molecular mechanisms involved. Nevertheless, our hypoxia-related prognostic model provides a new tool for predicting the prognosis of pancreatic cancer patients according to the expression of hypoxia-related genes and the features of the immune microenvironment. This approach allows us to study the complex microenvironment of pancreatic cancer in greater depth.
CONCLUSION
In this study, we established a novel hypoxia-related prognostic model for pancreatic cancer, which demonstrated robust power in predicting patient outcomes. By elucidating the relationships among hypoxia, gene expression, and the immune landscape, we developed a tool for guiding personalized treatment. This integration of hypoxia-related biomarkers may lead to more targeted treatment strategies, potentially improving outcomes in patients with pancreatic cancer.
Footnotes
Institutional review board statement: The manuscript did not involve human participants, animal subjects, or any other materials that require ethical review.
Institutional animal care and use committee statement: The manuscript did not involve animal subjects.
Conflict-of-interest statement: The authors declare that they have no competing interests, and all authors confirm its accuracy.
Provenance and peer review: Unsolicited article; Externally peer reviewed.
Peer-review model: Single blind
Specialty type: Gastroenterology and hepatology
Country of origin: China
Peer-review report’s classification
Scientific Quality: Grade B, Grade B
Novelty: Grade A, Grade B
Creativity or Innovation: Grade A, Grade B
Scientific Significance: Grade B, Grade B
P-Reviewer: Limijadi EKS; Tang X S-Editor: Qu XL L-Editor: A P-Editor: Xu ZH
Contributor Information
Fan Yang, Department of Gastroenterology, The Affiliated Hospital of Qingdao University, Qingdao 266000, Shandong Province, China.
Na Jiang, Department of Gastroenterology, The Affiliated Hospital of Qingdao University, Qingdao 266000, Shandong Province, China.
Xiao-Yu Li, Department of Gastroenterology, The Affiliated Hospital of Qingdao University, Qingdao 266000, Shandong Province, China.
Xing-Si Qi, Department of Gastroenterology, The Affiliated Hospital of Qingdao University, Qingdao 266000, Shandong Province, China.
Zi-Bin Tian, Department of Gastroenterology, The Affiliated Hospital of Qingdao University, Qingdao 266000, Shandong Province, China.
Ying-Jie Guo, Department of Gastroenterology, The Affiliated Hospital of Qingdao University, Qingdao 266000, Shandong Province, China. guoyingjie305@163.com.
Data sharing statement
Technical appendix, statistical code, and dataset available from the corresponding author at guoyingjie305@163.com.
References
- 1.Mizrahi JD, Surana R, Valle JW, Shroff RT. Pancreatic cancer. Lancet. 2020;395:2008–2020. doi: 10.1016/S0140-6736(20)30974-0. [DOI] [PubMed] [Google Scholar]
- 2.Padoan A, Plebani M, Basso D. Inflammation and Pancreatic Cancer: Focus on Metabolism, Cytokines, and Immunity. Int J Mol Sci. 2019;20 doi: 10.3390/ijms20030676. [DOI] [PMC free article] [PubMed] [Google Scholar]
- 3.Vincent A, Herman J, Schulick R, Hruban RH, Goggins M. Pancreatic cancer. Lancet. 2011;378:607–620. doi: 10.1016/S0140-6736(10)62307-0. [DOI] [PMC free article] [PubMed] [Google Scholar]
- 4.Wolpin BM. Pancreatic Cancer. Hematol Oncol Clin North Am. 2015;29:xiii–xxiv. doi: 10.1016/j.hoc.2015.06.002. [DOI] [PubMed] [Google Scholar]
- 5.Dreyer SB, Chang DK, Bailey P, Biankin AV. Pancreatic Cancer Genomes: Implications for Clinical Management and Therapeutic Development. Clin Cancer Res. 2017;23:1638–1646. doi: 10.1158/1078-0432.CCR-16-2411. [DOI] [PubMed] [Google Scholar]
- 6.Ren B, Cui M, Yang G, Wang H, Feng M, You L, Zhao Y. Tumor microenvironment participates in metastasis of pancreatic cancer. Mol Cancer. 2018;17:108. doi: 10.1186/s12943-018-0858-1. [DOI] [PMC free article] [PubMed] [Google Scholar]
- 7.Chen D, Huang H, Zang L, Gao W, Zhu H, Yu X. Development and Verification of the Hypoxia- and Immune-Associated Prognostic Signature for Pancreatic Ductal Adenocarcinoma. Front Immunol. 2021;12:728062. doi: 10.3389/fimmu.2021.728062. [DOI] [PMC free article] [PubMed] [Google Scholar]
- 8.Garcea G, Doucas H, Steward WP, Dennison AR, Berry DP. Hypoxia and angiogenesis in pancreatic cancer. ANZ J Surg. 2006;76:830–842. doi: 10.1111/j.1445-2197.2006.03872.x. [DOI] [PubMed] [Google Scholar]
- 9.Tan Z, Xu J, Zhang B, Shi S, Yu X, Liang C. Hypoxia: a barricade to conquer the pancreatic cancer. Cell Mol Life Sci. 2020;77:3077–3083. doi: 10.1007/s00018-019-03444-3. [DOI] [PMC free article] [PubMed] [Google Scholar]
- 10.Ru B, Wong CN, Tong Y, Zhong JY, Zhong SSW, Wu WC, Chu KC, Wong CY, Lau CY, Chen I, Chan NW, Zhang J. TISIDB: an integrated repository portal for tumor-immune system interactions. Bioinformatics. 2019;35:4200–4202. doi: 10.1093/bioinformatics/btz210. [DOI] [PubMed] [Google Scholar]
- 11.Li Y, Yang S, Yue H, Yuan D, Li L, Zhao J, Zhao L. Unraveling LGALS1 as a Potential Immune Checkpoint and a Predictor of the Response to Anti-PD1 Therapy in Clear Cell Renal Carcinoma. Pathol Oncol Res. 2020;26:1451–1458. doi: 10.1007/s12253-019-00710-4. [DOI] [PubMed] [Google Scholar]
- 12.Lei X, Lei Y, Li JK, Du WX, Li RG, Yang J, Li J, Li F, Tan HB. Immune cells within the tumor microenvironment: Biological functions and roles in cancer immunotherapy. Cancer Lett. 2020;470:126–133. doi: 10.1016/j.canlet.2019.11.009. [DOI] [PubMed] [Google Scholar]
- 13.Tang Z, Kang B, Li C, Chen T, Zhang Z. GEPIA2: an enhanced web server for large-scale expression profiling and interactive analysis. Nucleic Acids Res. 2019;47:W556–W560. doi: 10.1093/nar/gkz430. [DOI] [PMC free article] [PubMed] [Google Scholar]
- 14.Szklarczyk D, Kirsch R, Koutrouli M, Nastou K, Mehryary F, Hachilif R, Gable AL, Fang T, Doncheva NT, Pyysalo S, Bork P, Jensen LJ, von Mering C. The STRING database in 2023: protein-protein association networks and functional enrichment analyses for any sequenced genome of interest. Nucleic Acids Res. 2023;51:D638–D646. doi: 10.1093/nar/gkac1000. [DOI] [PMC free article] [PubMed] [Google Scholar]
- 15.Yoshihara K, Shahmoradgoli M, Martínez E, Vegesna R, Kim H, Torres-Garcia W, Treviño V, Shen H, Laird PW, Levine DA, Carter SL, Getz G, Stemke-Hale K, Mills GB, Verhaak RG. Inferring tumour purity and stromal and immune cell admixture from expression data. Nat Commun. 2013;4:2612. doi: 10.1038/ncomms3612. [DOI] [PMC free article] [PubMed] [Google Scholar]
- 16.Bindea G, Mlecnik B, Tosolini M, Kirilovsky A, Waldner M, Obenauf AC, Angell H, Fredriksen T, Lafontaine L, Berger A, Bruneval P, Fridman WH, Becker C, Pagès F, Speicher MR, Trajanoski Z, Galon J. Spatiotemporal dynamics of intratumoral immune cells reveal the immune landscape in human cancer. Immunity. 2013;39:782–795. doi: 10.1016/j.immuni.2013.10.003. [DOI] [PubMed] [Google Scholar]
- 17.McGuigan A, Kelly P, Turkington RC, Jones C, Coleman HG, McCain RS. Pancreatic cancer: A review of clinical diagnosis, epidemiology, treatment and outcomes. World J Gastroenterol. 2018;24:4846–4861. doi: 10.3748/wjg.v24.i43.4846. [DOI] [PMC free article] [PubMed] [Google Scholar]
- 18.Chiorean EG, Coveler AL. Pancreatic cancer: optimizing treatment options, new, and emerging targeted therapies. Drug Des Devel Ther. 2015;9:3529–3545. doi: 10.2147/DDDT.S60328. [DOI] [PMC free article] [PubMed] [Google Scholar]
- 19.Ryan DP, Hong TS, Bardeesy N. Pancreatic adenocarcinoma. N Engl J Med. 2014;371:1039–1049. doi: 10.1056/NEJMra1404198. [DOI] [PubMed] [Google Scholar]
- 20.Tao J, Yang G, Zhou W, Qiu J, Chen G, Luo W, Zhao F, You L, Zheng L, Zhang T, Zhao Y. Targeting hypoxic tumor microenvironment in pancreatic cancer. J Hematol Oncol. 2021;14:14. doi: 10.1186/s13045-020-01030-w. [DOI] [PMC free article] [PubMed] [Google Scholar]
- 21.Feig C, Gopinathan A, Neesse A, Chan DS, Cook N, Tuveson DA. The pancreas cancer microenvironment. Clin Cancer Res. 2012;18:4266–4276. doi: 10.1158/1078-0432.CCR-11-3114. [DOI] [PMC free article] [PubMed] [Google Scholar]
- 22.Shah VM, Sheppard BC, Sears RC, Alani AW. Hypoxia: Friend or Foe for drug delivery in Pancreatic Cancer. Cancer Lett. 2020;492:63–70. doi: 10.1016/j.canlet.2020.07.041. [DOI] [PMC free article] [PubMed] [Google Scholar]
- 23.Semenza GL. HIF-1 and mechanisms of hypoxia sensing. Curr Opin Cell Biol. 2001;13:167–171. doi: 10.1016/s0955-0674(00)00194-0. [DOI] [PubMed] [Google Scholar]
- 24.Lin J, Wang X, Zhai S, Shi M, Peng C, Deng X, Fu D, Wang J, Shen B. Hypoxia-induced exosomal circPDK1 promotes pancreatic cancer glycolysis via c-myc activation by modulating miR-628-3p/BPTF axis and degrading BIN1. J Hematol Oncol. 2022;15:128. doi: 10.1186/s13045-022-01348-7. [DOI] [PMC free article] [PubMed] [Google Scholar]
- 25.Liu X, Feng M, Hao X, Gao Z, Wu Z, Wang Y, Du L, Wang C. m6A methylation regulates hypoxia-induced pancreatic cancer glycolytic metabolism through ALKBH5-HDAC4-HIF1α positive feedback loop. Oncogene. 2023;42:2047–2060. doi: 10.1038/s41388-023-02704-8. [DOI] [PMC free article] [PubMed] [Google Scholar]
- 26.Chen K, Wang Q, Liu X, Wang F, Yang Y, Tian X. Hypoxic pancreatic cancer derived exosomal miR-30b-5p promotes tumor angiogenesis by inhibiting GJA1 expression. Int J Biol Sci. 2022;18:1220–1237. doi: 10.7150/ijbs.67675. [DOI] [PMC free article] [PubMed] [Google Scholar]
- 27.Zhou Z, Cheng Y, Jiang Y, Liu S, Zhang M, Liu J, Zhao Q. Ten hub genes associated with progression and prognosis of pancreatic carcinoma identified by co-expression analysis. Int J Biol Sci. 2018;14:124–136. doi: 10.7150/ijbs.22619. [DOI] [PMC free article] [PubMed] [Google Scholar]
- 28.Hosen SMZ, Uddin MN, Xu Z, Buckley BJ, Perera C, Pang TCY, Mekapogu AR, Moni MA, Notta F, Gallinger S, Pirola R, Wilson J, Ranson M, Goldstein D, Apte M. Metastatic phenotype and immunosuppressive tumour microenvironment in pancreatic ductal adenocarcinoma: Key role of the urokinase plasminogen activator (PLAU) Front Immunol. 2022;13:1060957. doi: 10.3389/fimmu.2022.1060957. [DOI] [PMC free article] [PubMed] [Google Scholar]
- 29.Chen Q, Shen P, Ge WL, Yang TY, Wang WJ, Meng LD, Huang XM, Zhang YH, Cao SJ, Miao Y, Jiang KR, Zhang JJ. Roundabout homolog 1 inhibits proliferation via the YY1-ROBO1-CCNA2-CDK2 axis in human pancreatic cancer. Oncogene. 2021;40:2772–2784. doi: 10.1038/s41388-021-01741-5. [DOI] [PubMed] [Google Scholar]
- 30.Li P, Miao C, Liang C, Shao P, Wang Z, Li J. Silencing CAPN2 Expression Inhibited Castration-Resistant Prostate Cancer Cells Proliferation and Invasion via AKT/mTOR Signal Pathway. Biomed Res Int. 2017;2017:2593674. doi: 10.1155/2017/2593674. [DOI] [PMC free article] [PubMed] [Google Scholar]
- 31.Daley D, Mani VR, Mohan N, Akkad N, Ochi A, Heindel DW, Lee KB, Zambirinis CP, Pandian GSB, Savadkar S, Torres-Hernandez A, Nayak S, Wang D, Hundeyin M, Diskin B, Aykut B, Werba G, Barilla RM, Rodriguez R, Chang S, Gardner L, Mahal LK, Ueberheide B, Miller G. Dectin 1 activation on macrophages by galectin 9 promotes pancreatic carcinoma and peritumoral immune tolerance. Nat Med. 2017;23:556–567. doi: 10.1038/nm.4314. [DOI] [PMC free article] [PubMed] [Google Scholar]
- 32.Tanaka A, Sakaguchi S. Regulatory T cells in cancer immunotherapy. Cell Res. 2017;27:109–118. doi: 10.1038/cr.2016.151. [DOI] [PMC free article] [PubMed] [Google Scholar]
- 33.Abdel Mouti M, Pauklin S. TGFB1/INHBA Homodimer/Nodal-SMAD2/3 Signaling Network: A Pivotal Molecular Target in PDAC Treatment. Mol Ther. 2021;29:920–936. doi: 10.1016/j.ymthe.2021.01.002. [DOI] [PMC free article] [PubMed] [Google Scholar]
- 34.Sendler M, van den Brandt C, Glaubitz J, Wilden A, Golchert J, Weiss FU, Homuth G, De Freitas Chama LL, Mishra N, Mahajan UM, Bossaller L, Völker U, Bröker BM, Mayerle J, Lerch MM. NLRP3 Inflammasome Regulates Development of Systemic Inflammatory Response and Compensatory Anti-Inflammatory Response Syndromes in Mice With Acute Pancreatitis. Gastroenterology. 2020;158:253–269.e14. doi: 10.1053/j.gastro.2019.09.040. [DOI] [PubMed] [Google Scholar]
- 35.Ghosh D, Lippert D, Krokhin O, Cortens JP, Wilkins JA. Defining the membrane proteome of NK cells. J Mass Spectrom. 2010;45:1–25. doi: 10.1002/jms.1696. [DOI] [PubMed] [Google Scholar]
- 36.Euchner J, Sprissler J, Cathomen T, Fürst D, Schrezenmeier H, Debatin KM, Schwarz K, Felgentreff K. Natural Killer Cells Generated From Human Induced Pluripotent Stem Cells Mature to CD56(bright)CD16(+)NKp80(+/-)In-Vitro and Express KIR2DL2/DL3 and KIR3DL1. Front Immunol. 2021;12:640672. doi: 10.3389/fimmu.2021.640672. [DOI] [PMC free article] [PubMed] [Google Scholar]
- 37.Veneziani I, Alicata C, Pelosi A, Landolina N, Ricci B, D'Oria V, Fagotti A, Scambia G, Moretta L, Maggi E. Toll-like receptor 8 agonists improve NK-cell function primarily targeting CD56(bright)CD16(-) subset. J Immunother Cancer. 2022;10 doi: 10.1136/jitc-2021-003385. [DOI] [PMC free article] [PubMed] [Google Scholar]
- 38.Feng M, Xiong G, Cao Z, Yang G, Zheng S, Song X, You L, Zheng L, Zhang T, Zhao Y. PD-1/PD-L1 and immunotherapy for pancreatic cancer. Cancer Lett. 2017;407:57–65. doi: 10.1016/j.canlet.2017.08.006. [DOI] [PubMed] [Google Scholar]
- 39.Soliman H, Khalil F, Antonia S. PD-L1 expression is increased in a subset of basal type breast cancer cells. PLoS One. 2014;9:e88557. doi: 10.1371/journal.pone.0088557. [DOI] [PMC free article] [PubMed] [Google Scholar]
- 40.Hashimoto S, Furukawa S, Hashimoto A, Tsutaho A, Fukao A, Sakamura Y, Parajuli G, Onodera Y, Otsuka Y, Handa H, Oikawa T, Hata S, Nishikawa Y, Mizukami Y, Kodama Y, Murakami M, Fujiwara T, Hirano S, Sabe H. ARF6 and AMAP1 are major targets of KRAS and TP53 mutations to promote invasion, PD-L1 dynamics, and immune evasion of pancreatic cancer. Proc Natl Acad Sci U S A. 2019;116:17450–17459. doi: 10.1073/pnas.1901765116. [DOI] [PMC free article] [PubMed] [Google Scholar]
- 41.Parks SK, Cormerais Y, Pouysségur J. Hypoxia and cellular metabolism in tumour pathophysiology. J Physiol. 2017;595:2439–2450. doi: 10.1113/JP273309. [DOI] [PMC free article] [PubMed] [Google Scholar]
- 42.Wang Q, Wang P, Qin Z, Yang X, Pan B, Nie F, Bi H. Altered glucose metabolism and cell function in keloid fibroblasts under hypoxia. Redox Biol. 2021;38:101815. doi: 10.1016/j.redox.2020.101815. [DOI] [PMC free article] [PubMed] [Google Scholar]
- 43.Wu Z, Zuo M, Zeng L, Cui K, Liu B, Yan C, Chen L, Dong J, Shangguan F, Hu W, He H, Lu B, Song Z. OMA1 reprograms metabolism under hypoxia to promote colorectal cancer development. EMBO Rep. 2021;22:e50827. doi: 10.15252/embr.202050827. [DOI] [PMC free article] [PubMed] [Google Scholar]
- 44.Infantino V, Santarsiero A, Convertini P, Todisco S, Iacobazzi V. Cancer Cell Metabolism in Hypoxia: Role of HIF-1 as Key Regulator and Therapeutic Target. Int J Mol Sci. 2021;22 doi: 10.3390/ijms22115703. [DOI] [PMC free article] [PubMed] [Google Scholar]
- 45.Suthen S, Lim CJ, Nguyen PHD, Dutertre CA, Lai HLH, Wasser M, Chua C, Lim TKH, Leow WQ, Loh TJ, Wan WK, Pang YH, Soon G, Cheow PC, Kam JH, Iyer S, Kow A, Tam WL, Shuen TWH, Toh HC, Dan YY, Bonney GK, Chan CY, Chung A, Goh BKP, Zhai W, Ginhoux F, Chow PKH, Albani S, Chew V. Hypoxia-driven immunosuppression by Treg and type-2 conventional dendritic cells in HCC. Hepatology. 2022;76:1329–1344. doi: 10.1002/hep.32419. [DOI] [PubMed] [Google Scholar]
Associated Data
This section collects any data citations, data availability statements, or supplementary materials included in this article.
Data Availability Statement
Technical appendix, statistical code, and dataset available from the corresponding author at guoyingjie305@163.com.


