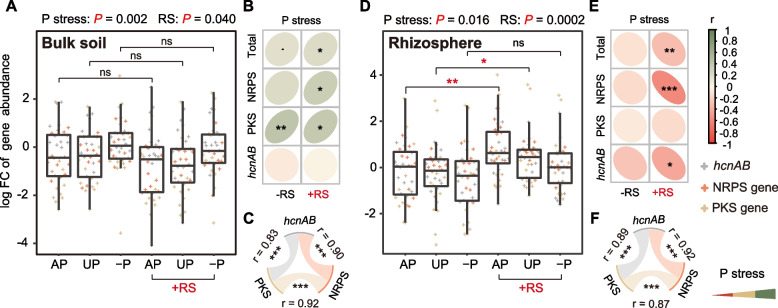
Fig. 2.
Contrasting responses of microbial disease-suppressive genes to phosphorus stress in bulk and rhizosphere soils. Results from the quantitative PCR analysis were pooled for seasons 1 and 2. Phosphorus stress gradually increased in the order of AP, UP, and −P because of different fertilizer treatments. A and D Fold changes of disease-suppressive genes in bulk and rhizosphere soils compared to the CK group. Scheirer-Ray-Hare test and Wilcoxon test were conducted. B and E Spearman correlations between the disease-suppressive genes and phosphorus stress in bulk and rhizosphere soils, with or without pathogen inoculation. Colors and circle shapes represent the correlation coefficient. C and F Spearman correlations within the three disease-suppressive genes of NRPS, PKS, and hcnAB in bulk and rhizosphere soils. +RS denotes R. solanacearum inoculation; P denotes phosphorus. Significance levels are denoted as follows: “ns,” not significant, “.”P < 0.1, “*”P < 0.05, “**”P < 0.01, and “***”P < 0.001

