

Abstract
DHAV-1 is a highly infectious pathogen that can cause acute hepatitis in ducklings. MicroRNA (miRNA) plays an essential regulatory role in virus response. We characterized and compared miRNA and mRNA expression profiles in duck embryonic fibroblasts (DEF) and the liver of ducklings infected with DHAV-1. DHAV-1 infected DEF was divided into infection group (D group) and blank group (M group), and DHAV-1 infected duckling group was divided into infection group (H group) and blank group (N group). D vs. M have 130 differentially expressed (DE) miRNA (DEM) and 2204 differentially expressed (DE) mRNA (DEG), H vs. N have 72 DEM and 1976 DEG. By the intersection of D vs. M and H vs. N comparisons, 15 upregulated DEM, 5 downregulated DEM, 340 upregulated DEG and 50 downregulated DEG were found with both in vivo and in vitro DHAV-1 infection. In particular, we identified the same DE miRNA target genes and functional annotations of DE mRNA. We enriched with multiple gene ontology (GO) and the Kyoto Encyclopedia of Genes and Genomes (KEGG) pathways, which may have important roles in viral virulence, host immunity, and metabolism. We selected miR-155, which is co-upregulated, and found that miR-155 targets SOCS1 to inhibit DHVA-1 replication.
Supplementary Information
The online version contains supplementary material available at 10.1038/s41598-024-72992-x.
Keywords: DHAV-1, miRNA, mRNA, miR-155, SOCS1
Subject terms: Virology, Virus-host interactions
Introduction
Duck hepatitis A virus type 1 (DHAV-1) is one of the deadliest pathogens in ducks, especially those less than one week old, causing 100% morbidity and 95% mortality1. DHAV-1 can cause viral hepatitis in ducklings, characterized by lesions in the liver, and the autopsy shows that the liver is enlarged, brittle, dull, or yellow and has dark purple dots or bruises on the surface2. Levine and Hofstad discovered the disease in the United States in 1949, isolated the DHAV virus from chicken embryos in 1950, and have since seen epidemics in other countries3. The virus belongs to the genus Avihepatovirus of the Picornaviridae4. Neutralization assays and phylogenetic analysis, DHAV was divided into 3 genotypes. At present, DHAV-1 and DHAV-3 are the primary pathogens causing duck hepatitis in China’s duck breeding industry1. However, DHAV-2 was included within the DHAV-3, while DHAV-1 was a separate clade5.
MicroRNA (miRNA) is a short endogenous noncoding RNA6, which is assembled with AGO2 and other proteins to form an RNA-induced silencing complex (RISC). Subsequently, RISC binds to target gene mRNA under the guidance of miRNA according to the base pairing principle. It regulates target gene expression by inhibiting mRNA translation or inducing degradation7,8. As a key regulatory element of gene expression, miRNA regulates protein-coding genes and participates in various biological processes such as cell differentiation, apoptosis, tumorigenesis, and viral infection9,10. More and more evidence show that miRNA plays a vital role in viral life. Liver-specific miR-122 binds to the 5’UTR of the hepatitis C virus (HCV) genome and promotes viral replication11. Enterovirus71 (EV71) infection promotes viral replication by upregulating miR-628-5p targeting TRAF3 to inhibit IFN-β transcription12. Coxsackie virus (CVB) virus infection inhibits the release of virus from infected cells by upregulating miR-21 to inhibit the MAPK signaling pathway, which ultimately leads to a decrease in apoptosis rate and viral titer13.
Expression of miR-155 was first reported in the human spleen and thymus, liver, lungs, and kidneys14,15. Several reports have demonstrated an aberrant increase in miR-155 expression in various activated immune cells, suggesting an important role for miR-155 in the immune response16–18. Cytokine signaling inhibitor (SOCS) protein is a cellular protein that can inhibit cytokine signaling in many cell types. The most typical function of SOCS1 is to inhibit IFN signaling by interacting with IFN-α receptor 1 (IFN-receptor 1, IFNAR1) and IFN-γ receptor (IFNGR) subunits, thereby limiting IFN activation of STAT (STAT1, STAT2, and STAT3)19,20.
RNA sequencing (RNA-Seq) is a high-throughput technique providing a comprehensive transcriptome view. In this study, samples were collected from DEF infected with DHAV-1 for 48 h and duckling livers for 24 h after the challenges. This study investigates the molecular mechanisms underlying the interaction between DHAV-1 and the host with a particular emphasis on miRNA and mRNA expression profiles and their possible implications for viral virulence and host responses. In this study, we explore the intersection of key miRNAs and mRNAs after DHAV-1 infection from cells and animals, and we believe that it can provide a certain basis for subsequent research. The combination of in vivo and in vitro analyses, along with the comprehensive profiling and enrichment analyses, complement this area of expertise.
Results
Characteristics of DHAV-1 infection in duck embryo fibroblasts and duck liver
As (Fig. 1A), duck-embryo fibroblasts (DEF) showed shriveled and vacuole-like changes 48 h after infection with DHAV-1. The vacuole-like changes and fragmentation intensified 72 h after infection, and the fragmentation intensified further 96 h after infection, while the blank group showed no significant differences. The results of intracellular viral load showed that the number of viral copies at 48 h after infection was higher than that at 72 and 96 h (Fig. 1B). Based on the consideration of cytopathies and viral load, cells with the highest viral load 48 h viral infection were selected for high-throughput sequencing. 7-d-old ducks died at 19 h after being infected with DHAV-1. Autopsied at 24 h found that the liver edge of the ducks became blunt, and obvious ecchymosis appeared in the liver (Fig. 1C). At the same time, no significant changes occurred in the blank group of ducks, and the viral load reached 108.10 (Fig. 1D). DEF was infected with DHAV-1 for 48 h in vitro. Liver tissues infected with DHAV-1 for 24 h in vivo were selected for RNA analysis and sequencing.
Fig. 1.

Lesions and viral load of DHAV-1 infected hosts. (A) Pathological changes of DHAV-1 infection with DEF (10×). (B) Pathological changes in the liver of DHAV-1 infected ducklings. (C) RT-PCR detection of DHAV-1 infection with DEF viral load at different times. (D) RT-PCR detection of DHAV-1 infection liver 24 h viral load.
Construction and analysis of small RNA libraries
To determine the effect of DHAV-1 infection on miRNA expression profiles of DEF and ducklings, we constructed 2 small RNA libraries from DEF in the infected group (group D) and the cell blank group (group M). RNA libraries were constructed from 7-day-old ducks infected with DHAV-1 group (group H) and DMEM group (group N). The original data of 4 small RNA libraries were obtained by high-throughput sequencing. 24.83 M and 23.87 M of clean reads were collected from group D and group M, and 23.92 M and 25.58 M of clean reads were collected from group H and group N, respectively. All clean reads are annotated and classified as Cis-reg, rRNA, snRNA, other Rfam RNA, gene, know miRNA, unannotation, and repeat (Fig. 2). The results showed that the number of clean reads measured in the blank group and the virus infection group was basically the same, the proportion of miRNA decreased sharply after virus infection.
Fig. 2.

Overview of RNA sequencing in the Mock and DHAV-1-infected library. (A) D vs. M RNA annotation (B) H vs. N RNA annotation.
miRNA expression difference analysis
To verify the biological repeatability of the samples, cluster analysis was performed on the differentially expressed miRNA, and miRNA with similar expressions were grouped and displayed in the form of heat maps. The expression pattern of differentially expressed miRNA was identical between the DHAV-1 infected and the blank groups, indicating that the samples had good biological repeatability (Fig. 3). After integrating the data from biological repeat samples in each group, inter-group analysis was conducted to analyze the expression level of miRNA in the libraries of the DHAV-1 infected group and the blank control group. In the D vs. M 130 miRNA were significantly changed, of which 69 miRNA were upregulated, and 61 miRNA were downregulated (Fig. 4A). In the H vs. N 72 miRNA were significantly changed, among which 65 miRNA were upregulated, and 7 miRNA were downregulated (Fig. 4B).
Fig. 3.
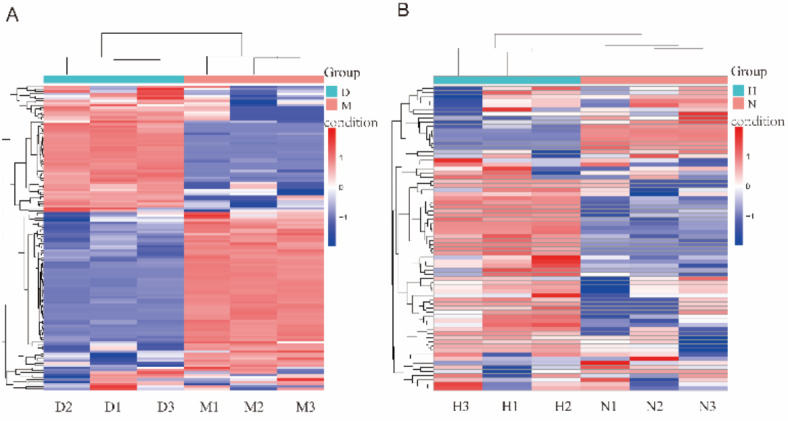
Cluster analysis of differentially expressed miRNA expression patterns. (A) D vs. M Cluster analysis expression. (B) H vs. N Cluster analysis. Red indicates high expression, and blue indicates low expression. Heatmap from Ouyi Yun (vision 2.0) https://cloud.oebiotech.com.
Fig. 4.

miRNA volcano map of DHAV-1 infection with DEF and duckling formation. (A) D vs. M volcano map. (B) H vs. N volcano map. Volcano plot: Gray is non-significantly differentiating miRNA, red is upregulated miRNA, and blue is downregulated miRNA.
Transcriptome sequencing data quality control
While using high-throughput sequencing technology to explore changes in miRNA expression profiles, we also examined the overall changes in gene expression. Transcriptome sequencing was performed using the same grouping as miRNA sequencing. Quality preprocessing results of the sequencing data are listed in (Table 1). The actual data volume was distributed in 46.81–50.68 M, the Q30 bases were distributed in 92.46–94.81%, the average GC content was 50.12–50.79%, and the genome comparison rates were 81.10-86.05%, which proved that the sequencing data were accurate and available.
Table 1.
Summary translation of transcriptome sequencing.
| Samples | Raw reads | Clean reads | Q30 | CG | Total mapped reads |
|---|---|---|---|---|---|
| D1 | 47.74 M | 46.81 M | 94.77% | 50.79% | 81.24% |
| D2 | 47.97 M | 47.06 M | 94.81% | 50.79% | 81.15% |
| D3 | 50.77 M | 49.79 M | 94.55% | 50.67% | 81.10% |
| M1 | 48.74 M | 47.81 M | 94.70% | 50.21% | 82.26% |
| M2 | 51.68 M | 50.68 M | 94.62% | 50.30% | 82.04% |
| M3 | 49.50 M | 48.59 M | 94.72% | 50.35% | 82.02% |
| H1 | 51.48 M | 50.40 M | 92.80% | 50.12% | 85.51% |
| H2 | 51.33 M | 50.14 M | 92.89% | 50.22% | 85.50% |
| H3 | 47.96 M | 46.93 M | 92.92% | 50.22% | 85.60% |
| N1 | 48.74 M | 47.54 M | 92.46% | 50.55% | 85.53% |
| N2 | 51.66 M | 50.45 M | 92.65% | 50.13% | 85.66% |
| N3 | 51.4 0 M | 50.12 M | 92.60% | 50.19% | 86.05% |
Differential gene analysis
According to the transcriptional sequencing results, compared with the (M group), there were 2204 DEG in the DHAV-1 infected DEF (D group) including 1292 upregulated genes and 912 downregulated genes (Fig. 5A). Compared with the N blank group, DHAV-1 infected ducks (H group) had a total of 1976 differential genes, including 1538 upregulated genes and 438 downregulated genes (Fig. 5B).
Fig. 5.

Genetic volcano map of DHAV-1 infection with DEF and duckling formation. (A) D vs. M volcano map. (B) H vs. N volcano map. Volcano plot: gray is non-significantly differentiating mRNA, red is upregulated mRNA, and blue is downregulated mRNA.
Identification of identical DEM and DEG in DHAV-1 infected DEF and duck liver
Comparing differentially expressed miRNA (DEM) and differentially expressed miRNA (DEG) in DHAV-1 infected DEF with those in the infected duck liver, it was found that 15 upregulated DEM, 340 upregulated DEG, 5 downregulated DEM, and 50 downregulated DEG appeared simultaneously in the above two sets of data. These miRNA and mRNA are suggested to play an essential role in DHAV-1 infection (Fig. 6, supplementary table S2, S3, S4, S5).
Fig. 6.

Homologous DEM and DEG in DHAV-1 infected DEF and liver. (A) Venn diagram of upregulated homologous DEM. (B) Venn diagram of downregulated homologous DEM. (C) Venn diagram of upregulated homologous DEG. (D) Venn diagram of downregulated homologous DEG.
Validation of DEM and DEG by RT-PCR
In this study, 13 miRNA and 15 mRNA were randomly selected to verify the correctness of the sequencing results (Fig. 7). The results analyzed by RT-PCR were in accordance with the high-throughput sequencing data.
Fig. 7.

RT-PCR verification of differentially expressed miRNA and mRNA. (A) RT-PCR verification of DEM. (B) RT-PCR verification of DEG. The relative expression level of each miRNA and mRNA in DHAV-1-infected sample was calculated using the 2−ΔΔCt method and represented as an n-fold change compared to the mock sample.
Target prediction and enrichment analysis of the same DEM
Target prediction using Miranda software for the same DEM showed 4733 predicted targets for the upregulated DEM and 461 target genes for the downregulated DEM. The GO function analysis and KEGG pathway analysis is performed for the predicted targets. GO enrichment analysis of upregulated DEM focused on Transcription-related events (Fig. 8A). KEGG pathway analysis found that these genes were related to the mTOR signaling pathway and RNA degradation (Fig. 8B). The same downregulated DEM prediction target genes were enriched in Superoxide-generating NADPH oxidase activity (Fig. 8C). KEGG pathway analysis showed that these genes were related to purine metabolism, EMC-receptor interaction, and Focal adhesion (Fig. 8D), suggesting that, after DHAV-1 infection, miRNA mainly function in DNA transcription, RNA degradation, and cell peroxidation.
Fig. 8.

The enrichment analysis for the predicted target genes of homologous DEM. (A) upregulated DEM GO enrichment analysis. (B) upregulated DEM KEGG pathway enrichment analysis. (C) downregulated DEM GO enrichment analysis. (D) downregulated DEM KEGG pathway enrichment analysis. GO terms distribution of target genes under molecular functions, cellular components, and biological processes. Dot color indicates the p-value of enrichment analysis for mapping specific functional entries, dot size indicates the number of genes involved in the pathway.
Enrichment analysis of the same DEG
The results of the GO function analysis and KEGG pathway analysis for the same upregulated DEG showed that, in the molecular function category, it was enriched in STAT family protein and cytokine activity and related to antiviral innate immune responses and virus life activity regulation in the biological process category (Fig. 9A). The same downregulated DEG is enriched in cellular junctions and sodium ion channels voltage-gated sodium channel activity (Fig. 9C). KEGG pathway analysis found that the same upregulated DEG was enriched in a variety of innate immune response signaling pathways, such as RIG-1 signaling pathway, Toll-like receptor signaling pathway, as well as herpesvirus infection and calcium signaling pathway (Fig. 9B). KEGG pathway analysis showed that the same downregulated DEG is enriched in the Wnt signaling pathway and MAPK signaling pathway (Fig. 9D).
Fig. 9.

The enrichment analysis for the genes of homologous DEG. (A) upregulated DEG GO enrichment analysis. (B) upregulated DEG KEGG pathway enrichment analysis. (C) downregulated DEG GO enrichment analysis. (D) downregulated DEG KEGG pathway enrichment analysis. Dot color indicates the p-value of enrichment analysis for mapping specific functional entries, dot size indicates the number of genes involved in the pathway.
miR-155 inhibits DHAV-1 replication
miR-155 and SOCS1 were significantly upregulated after DHAV-1 infection at 36 h (Fig. 10A, 10B). MiR-155 nc, mimic, inhibitor nc and inhibitor were transfected into DEF cells, infected with DHAV-1 12 h later, and samples were collected at 12 h, 24 h, 36 h and 48 h after viral infection. The results showed that the viral load of the miR-155 mimics group after viral infection was significantly lower than that of the negative control group (Fig. 10C, 10D). However viral load of the miR-155 inhibitor group after viral infection was significantly lower than that of the negative control group (Fig. 10E, 10F). This suggests that miR-155 can inhibit DHAV-1 replication.
Fig. 10.

Effect of of miR-155 on DHAV-1 replication. (A) Expression of miR-155 at different time points after DHAV-1 infection. (B) Expression of SOCS1. (C) DEF was transfected with corresponding miR-155 mimics (40pmol), RT-PCR to detect the effect of miR-155 mimics on the copy number of DHAV-1. (D) DEF was transfected with corresponding miR-155 inhibitor nc and inhibitor (40pmol), RT-PCR to detect the effect of miR-155 inhibitor on the copy number of DHAV-1. (E) After mimics transfection, DHAV-1 protein expression was detected by western blot. (F) After inhibitor transfection, DHAV-1 protein expression was detected by western blot.
miR-155 targets SOCS1
The dual-luciferase recombinant plasmid and corresponding miR-155 mimics, inhibitor were co-transfected into DEF, and nc, inhibitor nc control was set up. pmirGLO-SOCS1(WT) groups were significantly different compared with the negative control group, pmirGLO-SOCS1 (Mut) groups were not significantly different compared with the control group (Fig. 11A, 11B), indicating that miR-155 targets SOCS1, Subsequently, the effect of miR-155 on SOCS1 protein expression was examined, and it was found that it inhibited the expression of SOCS1 (Fig. 11C, 11D). This indicated that miR-155 can SOCS1 and reduce its expression.
Fig. 11.

Validation of the targeting relationship between miRNA and SOCS1. A. The dual-luciferase recombinant plasmid and corresponding miR-155 nc, mimics, inhibitor nc and inhibitor were co-transfected into DEF, and nc and inhibitor nc negative control was set up. (A) pmirGLO-SOCS1(wt), groups compared with the negative control group. (B) pmirGLO-SOCS1 (Mut) groups compared with the negative control group. (C) Transfection of miR-155 mimics and nc to detect protein of SOCS1. (D) Transfection of miR-155 inhibitor and inhibitor nc to detect protein of SOCS1.
SOCS1 promotes DHAV-1 replication
pCAGGS, SOCS1, sh-NC and sh-SOCS1 were transfected into DEF cells, infected with DHAV-1 at 12 h, and samples were collected at 12 h, 24 h, 36 h and 48 h after virus infection. As a result, the viral load was significantly promoted in the pCAGGS-SOCS1-3flag group compared to the negative control group (Fig. 12A, 12B). viral load was significantly inhibited in the sh-SOCS1 group compared to the negative control group (Fig. 12C, 12D). This suggests that SOCS1 can promote DHAV-1 replication.
Fig. 12.

Effect of SOCS1 on DHAV-1 replication. (A) RT-PCR to detect the effect of over expression SOCS1 on the copy number of DHAV-1. (B) RT-PCR to detect the effect of Knock down SOCS1 on the copy number of DHAV-1. (C) overexpression of SOCS1 on the expression level of VP1 protein. (D) Knock down of SOCS1 on the expression level of VP1 protein.
Discussion
DHAV-1 can cause acute bleeding and death in ducks and it poses a significant threat to the duck industry. However, the mechanism of the virus invasion and infection of the host has not been clarified, and high-throughput sequencing can help us understand the mechanisms of viral invasion biological processes and the occurrence and development of diseases. This study will help to elucidate the dynamics of miRNA and mRNA after DHAV-1 infection.
Our results (Figs. 2 and 7; Table 1) demonstrate the authenticity of the sequencing data. DHAV-1 infection changes the expression of miRNAs and mRNAs. We found that DHAV-1 infection reduced the proportion of miRNAs. Viral infection degrades RNA, such as the herpes virus Saimiri encodes several conserved non-coding RNAs, including HSUR1 and HSUR2. HSUR1 and HSUR2 can be base-paired with the seed sequence of miR-27a to degrade it21. The viral miRNA suppresses the population of cellular miRNA and via this pathway makes the mRNA and protein populations larger22. In the D vs. M comparison, 130 DEM and 2204 DEG were identified, whereas the H vs. N comparison revealed 72 DEM and 1976 DEG (Figs. 4 and 5). Notably, of these DEM, gga-miR-155 is involved in the regulation of inflammation, immunity and fat metabolism, TLR4 signaling regulates its expression, and the expression of miR-155 is upregulated after viral infection23, which can promote inflammation and apoptosis, and previous studies suggest that it can target immune-related genes SOCS1 and TANK to inhibit Burse disease virus replication24, and to target caspase-6 and FOXO3a to inhibit apoptosis and accelerate cell cycle, thus improving viability of Reticuloendotheliosis virus (REV) infected CEF25. The downregulated of miR-133a-3p, observed in both Bovine leukemia virus (BLV) and Aujeszky’s disease virus (ADV) infections26,27, is consistent with our study. miR-133a-3p is involved in pyroptosis, ATK signaling pathway, and other pathways28,29. Therefore, we speculate that they might play a role in infection of DHAV-1.
Upregulated DEM predicts target gene GO enrichment into the nucleus cytoplasm and is associated with DNA transcription, KEGG enrichment to RNA degradation, and mTOR signaling pathways such as gga-miR-155, gga-miR-1763, gga-miR-193b-3p (Fig. 8A and B). The function of miRNA is to degrade the targeted mRNA through the silencing complex (RISC), so the process of upregulation of miRNA may be related to DNA transcription and induce RNA degradation30. The mTOR signaling pathway plays a crucial role in many biological processes such as cell proliferation, survival autophagy metabolism, and immunity31. For example, DTMUV infection activates the ERK and AMPK pathways, resulting in decreased phosphorylation of the autophagy repressor mTOR, subsequently leading to autophagic induction and promoting viral replication in neuronal cells32. FMDV infection activated the mTOR/p70S6K1 signaling axis to promote viral replication33. The VP1 protein and 2B protein of DHAV-1 can induce autophagy in DEF, and it is speculated that the autophagy of DEF may also be caused by miRNA targeting genes related to the mTOR signaling pathway34,35.
Downregulation of DEM predicted target GO enrichment to basement membrane and extracellular matrix (ECM). KEGG enrichment included EMC-receptor interaction and Focal adhesion such as gga-miR-133a-3p, gga-miR-375 (Fig. 8C and D). ECM receptor interaction and adhesion pathways control many critical cellular activities, such as apoptosis proliferation differentiation adhesion migration and motility36. Focal adhesion kinase (FAK) mediates the IGTP-induced PI3K/Akt survival pathway and further initiates a positive feedback loop activated by NF-κB, promoting CVB3 replication37. Downregulated miRNA predicts the target genes, leading to speculation that these miRNAs may influence the apoptosis, differentiation, and migration of viruses during DHAV-1 life activities.
In this study, GO enrichment analysis of upregulated DEG after DHAV-1 infection suggests a defensive role for viral innate immunity and immune responses. KEGG was enriched into the RIG-like signaling pathway, Toll-like signaling pathway and NOD-like signaling pathway (Fig. 9A and B). Our findings reveal the upregulation of genes involved in RIG-I like pathway and cGAS-STING pathway, including RIG, IFIT5, TBK1, IRF7, INFAR1 and cGAS STING, were upregulated. Pattern recognition receptors (PRRS), including Toll-like receptors (TLR), retinoid-inducing gene I (RIG-I) -like receptors (RLR), and nucleotide oligomerization domain (NOD)-like receptors (NLR), recognize pathogen-associated molecular patterns (PAMP)38–40. The 3CD protein of small RNA family virus DHAV-1 targets IRF7 to promote DHAV-1 replication via the RIG signal axis41. PLAC8 is highly expressed in immune organs and significantly inhibits the expression of Toll-like receptor 7 (TLR7), leading to decreased expression of downstream signaling molecules, including myeloid differentiation factor gene 88 (MyD88) and NF-κB signaling pathway, ultimately leading to low INF-β and interleukin-6 (IL-6) levels, facilitating DHAV-1 replication42. This indicates that DHAV-1 invasion of the host is followed by a corresponding antiviral response against the virus.
GO enrichment of downregulated DEG showed cell connections and sodium ion channels. KEGG is enriched in the Wnt and MAPK signaling pathways (Fig. 9C and D). Human rhinovirus (HRV) infection destroys the tight connections in epithelial cells and Rhinovirus stimulated the production of IL-6 IL-8 and granulocyte-macrophage colony-stimulating factors in human epithelial cell line cultures43,44. miR-126 stimulates GSK-1β activity and induces β-catenin degradation by inhibiting two newly discovered targets in the Wnt pathway, LRP3 and WRCH6, sensitizing cells to virus-induced cell death and increasing viral offspring release to trigger new infections45. FMDV capsid protein VP1 interacts with host ribosomal protein SA (RPSA), which negatively regulates MAPK pathway activation during FMDV infection and shows antiviral function46. This suggests that DHAV-1 can downregulate both in vivo and in vitro host metabolism after infection.
In a previous study Nana Sui47 performed KEGG pathway enrichment analysis on differentially expressed miRNA targets at 12 and 24 h after DHAV-1 infection with DEF. It was found that ribosome adhesion plaque and cell adhesion molecule were highly enriched at 12 h. The pathways with high enrichment at 24 h were calcium and adhesion. Differentially expressed miRNA targets exhibited distinct KEGG pathway enrichment patterns at other time points following virus infection, possibly associated with different stages of viral life activities. Viral life activities can be divided into adsorption invasion replication and release of progeny. Adhesion molecules, including integrins, cadherins, immunoglobulin superfamily molecules, and selectin, bind cells to each other and regulate cell-to-cell and cell-to-matrix communication48. The rhinoviruses (Rhinovirus, RV) and EV of the small RNA virus family rely on a family of cell adhesion molecules to invade host cells and establish infection49,50. Adhesion plaque is an anchor between cells and extracellular matrix composed of many signaling proteins, catalytic proteins, cytoskeleton proteins, adaptor proteins, and scaffold proteins, and plays a vital role in cell proliferation migration and cell cycle regulation51. Plague kinase regulates viral entry and genome replication in influenza viruses52. Therefore, DHAV-1 may achieve adsorption and invasion through molecular adhesion pathway 12 h after infection, viral genome replication through adhesion plaque pathway 24 h post-infection. Subsequently, apoptosis or autophagy release of progeny virions may occur through the MAPK signaling pathway or calcium ion signaling pathway 36 and 48 h after infection13,34. The differentially expressed miRNA targets at different time points after viral infection have different KEGG pathway enrichment patterns, which may be related to the different viral life activities carried out at different time points, but the influence of different strains, cell types, viral infection, amounts and test systems used in the assay cannot be ruled out.
We identified miRNA and mRNA (Table S1, S2, S3, S4) that may play crucial regulatory roles after DHAV-1 infection. This suggest that DHAV-1 infection downregulate the expression of genes in specific for metabolic pathways (Wnt and MAPK signal pathways), lead to inhibiting the host cell metabolism, induction of cellular damage and apoptosis. Meanwhile, the expression of immune genes (RIG, Toll and NOD signal pathways) is upregulated by the host to inhibit viral infection and replication, consistent with Zhang’s study53. Moreover, the upregulated miRNAs may inhibit viral replication by targeting autophagy (mTOR and PI3K3/ATK) genes. Additionally, the downregulated miRNAs target peroxidation genes to promote cell and liver damage, leading to host death. We believe that DEM and DEG observed in vitro and in vivo after DHAV-1 infection will be critical factors influencing viral regulation of the host. In our future research, we can focus on miRNAs that play important functions, such as gga-miR-155., gga-miR-133a-3p. This study extends the understanding of DHAV-1 interactions with the host in vivo and in vitro, helping to pave the way for further research and development of strategies to manage this infectious disease in ducklings.
Materials and methods
Ethics statement
All animal experiments were conducted in accordance with approved guidelines. 1-d-old Peking ducks were purchased from a farm operated by Sichuan Agricultural University (Sichuan, China). All the ducks were housed in the animal facility at Sichuan Agricultural University, Chengdu, China. The study was approved by the Committee of Experiment Operational Guidelines and Animal Welfare of Sichuan Agricultural University (approved permit number XF2014-18). All experiments were performed in accordance with relevant guidelines and regulations of the China Law of Animal Protection. The study was also carried out in compliance with the ARRIVE guidelines.
Cells and animals
Our laboratory isolated, preserved, and provided the DHAV-1 H strain (GenBank ID: JQ301467.1). According to the above method54, duck embryo fibroblasts (DEF) were prepared from 9-11d old duck embryos purchased from Yaan City, Sichuan Province, and cultured in a 5% CO2 cell incubator at 37℃ using DMEM supplemented with 10% newborn bovine serum (NBS), (Gibco, AUS).
Viral infection and sample collection
When cells grow to 90% density, the medium is discarded, infected with DHAV-1, MOI = 1 toxicity. Incubate the cells at 37 °C for 1 h, add them to DMEM medium containing 2% NBS, and culture in an incubator at 37 °C and 5% CO₂. Observe cytopathies at different time points after infection with fluorescence microscopy and take pictures. Samples were collected using RNAiso Plus (Takara, Japan). 7-d-old ducks were randomly selected and injected intramuscularly with a 100-fold dilution of DHAV-1 0.5 ml. 24 h after infection, and the ducklings were beheaded. Liver tissue is collected and washed with pre-chilled PBS, then frozen in liquid nitrogen and stored at − 80 °C.
RNA extraction and viral load detection
Total RNA was extracted from cell samples using RNAiso Plus following the manufacturer’s protocol. The concentration and purity of RNA samples were determined by measuring OD260 and OD260/OD280 using a Nanodrop instrument (Thermo Fisher Scientific Inc, USA). RNA integrity was assessed using an Agilent 2100 bioanalyzer (Agilent Technologies, USA). The viral load of each group of samples was determined by one-step double fluorescence quantitative RT-PCR constructed in our laboratory55.
Small RNA sequencing analysis and data analysis
Shanghai Oebiotech Biomedical Technology was commissioned for library construction and small RNA sequencing. The operation process was as follows: Trizol method was used to extract total RNA, Nanodrop was used to detect RNA concentration and purity, and Agilent 2100 bioanalyzer was used to detect RNA integrity. After passing the test, 1 µg total RNA was taken from each group to construct a cDNA library. High-throughput sequencing was performed using the Illumina HiSeq X Ten platform. Raw reads containing junction sequences were eliminated56, and lines with lengths less than 15 bp and distances greater than 40 bp were filtered. During DNA transcription into RNA, introns are excised and the exon cleavage sites are joined together, and reads that cross the splice site are called junction reads. To realize the identification and annotation of known miRNA (because there are too few annotated duck miRNAs in the current miRbase database, this study chose to compare the integrated results of known miRNA of birds). According to the biological characteristics of miRNA, new miRNA was predicted by mirdeep257 software.
mRNA sequencing and data analysis
The samples used for mRNA sequencing were the same as those used for small RNA sequencing. A cDNA library was constructed with 4 µg total RNA, and eukaryotic mRNA was enriched with magnetic beads with Oligo (dT), and then the mRNA was fragmented by adding interrupting reagents.
Illumina58 was used to conduct quality control on the original data, remove the adapter sequence, filter out reads containing N bases, and obtain high-quality clean reads. The clean reads sequence was compared with the Anas platyrhynchos reference genome (GenBank ID: CA_015476345.1) using the heat 259 software with default parameters. DESeq was used to standardize the data. NB (negative binomial distribution test) was used to calculate the p-value and F old change of gene difference comparison, P-value<0.05 |Fold Change|>2 miRNA and mRNA are defined as differentially expressed.
RT-PCR verification
To confirm the accuracy of high-throughput sequencing results, RT-PCR was used to verify the expression of several differentially expressed miRNA and differentially expressed mRNA in RNA samples used for high-throughput sequencing. RT-PCR validation was performed according to TB Green® Premix Ex Taq™ II (Takara, Japan). The primers used are shown in the attached table. The primers for mRNA and miRNA were designed using Primer Premier (version 5.0) and Primer 3 (https://primer3.ut.ee/). GAPDH and Small nuclear RNA (snRNA) U6 are internal reference genes of mRNA and miRNA, respectively. All reactions were performed in triplicate. The relative expression level was calculated using the 2−ΔΔCT method60. Primer sequences are shown in the supplements file (S1).
Enrichment analysis
Gene ontology (GO) and Kyoto Encyclopedia of Genes and Genomes (KEGG) signaling pathway enrichment analysis61–63 were performed for differentially expressed miRNA prediction target genes and differentially expressed mRNA, respectively. P-value < 0.05 GO or KEGG entries are considered to be significantly enriched.
Plasmid construction
Primers were designed for PCR amplification using Primer Premier 5 software according to the nucleotide sequences of the corresponding genes and the DHAV-1 genome recorded in the Genbank database, and the details of the primer sequences are shown in file (S1). The templates for PCR amplification of the SOCS1 were the cDNAs of the total RNAs extracted from the DEF cells, which were reverse transcribed from the total RNAs. The cDNA after reverse transcription of the total RNA extracted was used to construct the recombinant plasmid of pmirGLO-SOCS1(WT), pmirGLO-SOCS1(Mut) and pCAGGS-SOCS1-3flag. Confirm the integrity and fidelity of the insert by sequencing (Tsingke, Chengdu, China). Sh-NC and sh-SOCS1 were donated by Shanzhi Huang.
Luciferase activity assay
The dual-luciferase recombinant plasmid and the corresponding miR-155 nc, mimics, inhibitor nc, inhibitor (GenePharma, Shanghai) were co-transfected into cells according to the Lipofectamine2000 (Thermo Fisher Scientific, USA) transfection reagent instruction manual, and three biological replicates were set up for each group, and the activity of firefly luciferase and sea kidney luciferase was detected after 24 h according to the procedure of the Dual-Luciferase® Reporting (Yeasen, China) and Analysis System instruction manual (Promega, USA).
DHAV-1 infection and sample collection
RNA samples were collected at different time points for DHAV-1 with MOI = 1 infection and blank group. DEF cells were transfected into the cells in 24-well plates when the cells grew to a density of 70%~80% according to the instructions of Lipofectamine 2000 transfection reagent, nc, inhibitor nc pCAGGS and sh-NC were set as the negative control group, and 3 biological replicates were set in each group. After transfection, the cells were washed with 1 × PBS for 3 times, then the cells were infected with DHAV-1 with MOI = 0.5 toxic amount, the venom was discarded after incubation at 37 °C for 1 h, and the cells were washed with 1 × PBS for 3 times, and then DMEM culture medium with a concentration of 2% NBS was added and cultured in a 5% CO2 cell culture incubator at 37 °C. Cell samples were collected using RNAiso Plus Reagent at 12 h 24 h, 36 h and 48 h after viral infection and stored at -80 °C using RNAiso Plus reagent. The method for measuring the copy number of the virus is the same as in "RNA extraction and viral load detection" section.
Western bolt
To study the effects of miR-155 and SOCS1 on DHAV-1 replication, 48 h after transfection of nc, mimics, inhibitor nc, inhibitor, pCAGGS, pCAGGS-SOCS1-3flag, sh-NC and sh-SOCS1, RIPA buffer (Beyotime, Shanghai) was lysed and the mixture was collected. Cell mixtures were detected by Western blotting. Mouse anti-β-Tublin monoclonal antibody (TransGen, Beijing) and HRP-conjugated anti-rabbit IgG and anti-mouse IgG secondary antibody (Abmart, Shanghai). the effect of SOCS1 on the viral replication, transfection for 12 h inoculation of 0.5 MOI, 48 h collection of RIPA-comprehended mouse anti-SOCS1 polyclonal antibody (1:50) and DHAV-1 VP1 polyclonal antibody (1:500) were prepared in our laboratory and ECL detection kit (Biotech, NCM) was used for colour development. Grayscale analysis use Image J (version 2.14.0). The original Western blot image is located in (file S2).
Statistical analysis
All the data analyses were performed GraphPad Prism (Version 9.5). The data were presented as means ± SEM of three replicates, using Student’s t test and are presented as *P < 0.05, **P < 0.01, ***P < 0.001 and ****< 0.0001. Supplementary Materials: The following supporting information can be downloaded at: File S1 title; Tables S1, S2, S3, S4.
Electronic supplementary material
Below is the link to the electronic supplementary material.
Author contributions
Conceptualization, M.S.W.; methodology, Q.Y.; software, T.B.; validation, X.O.; formal analysis, D.S., X.Z. and M.L.; resources, S.Z. and D.Z.; data curation, J.H and Y.W.; writing—original draft preparation, M.W.; writing—review and editing, Z.L.; visualization, R.J.; project administration, S.C.; funding acquisition A.C. All authors reviewed the manuscript.
Funding
This work was supported by grants from China Agricultural Research System (CARS-42-17) and the Program Sichuan Veterinary Medicine and Drug Innovation Group of China Agricultural Research System (SCCXTD-2020-18).
Data availability
The Illumina sequencing data from this study have been submitted to NCBI Sequence Read Archive. BioProject number is PRJNA998588 https://www.ncbi.nlm.nih.gov/sra/PRJNA998588 and PRJNA1002099http://www.ncbi.nlm.nih.gov/bioproject/1002099.
Declarations
Competing interests
The authors declare no competing interests.
Footnotes
Publisher’s note
Springer Nature remains neutral with regard to jurisdictional claims in published maps and institutional affiliations.
These authors contributed equally: Meng Wang and Zezheng Liu.
References
- 1.Wen, X. et al. Molecular epidemiology of duck hepatitis a virus types 1 and 3 in China, 2010–2015. Transbound. Emerg. Dis.65, 10–15. 10.1111/tbed.12741 (2018). [DOI] [PubMed] [Google Scholar]
- 2.Niu, Y. et al. The pathogenicity of duck hepatitis a virus types 1 and 3 on ducklings. Poult. Sci.98, 6333–6339. 10.3382/ps/pez455 (2019). [DOI] [PMC free article] [PubMed] [Google Scholar]
- 3.Levine, P. & Fabricant, J. A hitherto-undescribed virus disease of ducks in North America. Cornell Vet.40, 71–86 (1950). [Google Scholar]
- 4.Danielle, M. Y., Ruediger, H., Shivaprasad, H. L. & Xiang-Jin, M. Hepatitis virus infections in poultry. Avian Dis.60, 576–588. 10.1637/11229-070515-Review.1 (2016). [DOI] [PubMed] [Google Scholar]
- 5.Wen, H. et al. Duck hepatitis a virus (DHAV) genotype definition: comment on the article by Cha et al. Vet. Microbiol.170, 462–464. 10.1016/j.vetmic.2014.01.037 (2014). [DOI] [PubMed] [Google Scholar]
- 6.Aguilar, C., Mano, M. & Eulalio, A. MicroRNAs at the host-bacteria interface: Host defense or bacterial offense. Trends Microbiol.27, 206–218. 10.1016/j.tim.2018.10.011 (2019). [DOI] [PubMed] [Google Scholar]
- 7.Cullen, B. R. Viruses and microRNAs. Nat. Genet.38 (Suppl), S30 (2006). [DOI] [PubMed] [Google Scholar]
- 8.Esquela-Kerscher, A. & Slack, F. J. Oncomirs - microRNAs with a role in cancer. Nat. Rev. Cancer. 6, 259–269 (2006). [DOI] [PubMed] [Google Scholar]
- 9.Bushati, N. & Cohen, S. M. microRNA functions. Annu. Rev. Cell. Dev. Biol.23, 175–205 (2007). [DOI] [PubMed] [Google Scholar]
- 10.Bartel, D. P. MicroRNAs: Target recognition and regulatory functions. Cell136, 215–233. 10.1016/j.cell.2009.01.002 (2009). [DOI] [PMC free article] [PubMed] [Google Scholar]
- 11.Chahal, J. et al. miR-122 and ago interactions with the HCV genome alter the structure of the viral 5’ terminus. Nucleic Acids Res.47, 5307–5324. 10.1093/nar/gkz194 (2019). [DOI] [PMC free article] [PubMed] [Google Scholar]
- 12.Li, D. et al. MicroRNA-628-5p facilitates Enterovirus 71 infection by suppressing TRAF3 signaling. Cell. Mol. Immunol.18, 1320–1322. 10.1038/s41423-020-0453-4 (2021). [DOI] [PMC free article] [PubMed] [Google Scholar]
- 13.He, F. et al. The protective role of microRNA-21 against coxsackievirus B3 infection through targeting the MAP2K3/P38 MAPK signaling pathway. J. Transl. Med.17, 335. 10.1186/s12967-019-2077-y (2019). [DOI] [PMC free article] [PubMed] [Google Scholar]
- 14.Tam, W., Ben-Yehuda, D. & Hayward, W. S. Bic, a novel gene activated by proviral insertions in avian leukosis virus-induced lymphomas, is likely to function through its noncoding RNA. Mol. Cell. Biol.17, 1490–1502 (1997). [DOI] [PMC free article] [PubMed] [Google Scholar]
- 15.Tam, W. Identification and characterization of human BIC, a gene on chromosome 21 that encodes a noncoding RNA. Gene. 274, 157–167 (2001). [DOI] [PubMed] [Google Scholar]
- 16.Landgraf, P. et al. A mammalian microRNA expression atlas based on small RNA library sequencing. Cell. 129, 1401–1414 (2007). [DOI] [PMC free article] [PubMed] [Google Scholar]
- 17.Calame, K. MicroRNA-155 function in B cells. Immunity. 27, 825–827 (2007). [DOI] [PubMed] [Google Scholar]
- 18.Rodriguez, A. et al. Requirement of bic/microRNA-155 for normal immune function. Science. 316, 608–611 (2007). [DOI] [PMC free article] [PubMed] [Google Scholar]
- 19.Fenner, J. E. et al. Suppressor of cytokine signaling 1 regulates the immune response to infection by a unique inhibition of type I interferon activity. Nat. Immunol.7, 33–39 (2006). [DOI] [PubMed] [Google Scholar]
- 20.Qing, Y., Costa-Pereira, A. P., Watling, D. & Stark, G. R. Role of tyrosine 441 of interferon-gamma receptor subunit 1 in SOCS-1-mediated attenuation of STAT1 activation. J. Biol. Chem.280, 1849–1853 (2005). [DOI] [PubMed] [Google Scholar]
- 21.Zhang, Z., Qin, Y. W., Brewer, G. & Jing, Q. MicroRNA degradation and turnover: Regulating the regulators. Wiley Interdiscip. Rev. RNA3, 593–600. 10.1002/wrna.1114 (2012). [DOI] [PMC free article] [PubMed] [Google Scholar]
- 22.Zhdanov, V. P. Interplay of cellular mRNA, miRNA and viral miRNA during infection of a cell. Int. J. Mol. Sci.10.3390/ijms24010122 (2022). [DOI] [PMC free article] [PubMed] [Google Scholar]
- 23.Jafarzadeh, A. et al. MicroRNA-155 and antiviral immune responses. Int. Immunopharmacol.101, 108188. 10.1016/j.intimp.2021.108188 (2021). [DOI] [PubMed] [Google Scholar]
- 24.Wang, B. et al. Gga-miR-155 enhances type I Interferon expression and suppresses infectious burse disease virus replication via targeting SOCS1 and TANK. Front. Cell. Infect. Microbiol.8, 55. 10.3389/fcimb.2018.00055 (2018). [DOI] [PMC free article] [PubMed] [Google Scholar]
- 25.Gao, C., Dang, S., Zhai, J. & Zheng, S. Regulatory mechanism of microRNA-155 in chicken embryo fibroblasts in response to reticuloendotheliosis virus infection. Vet. Microbiol.242, 108610. 10.1016/j.vetmic.2020.108610 (2020). [DOI] [PubMed] [Google Scholar]
- 26.Ma, H., Lippolis, J. D. & Casas, E. Expression profiles and Interaction of MicroRNA and transcripts in response to bovine leukemia virus exposure. Front. Vet. Sci.9, 887560. 10.3389/fvets.2022.887560 (2022). [DOI] [PMC free article] [PubMed] [Google Scholar]
- 27.Timoneda, O. et al. The role of viral and host microRNAs in the Aujeszky’s disease virus during the infection process. PLoS One. 9, e86965. 10.1371/journal.pone.0086965 (2014). [DOI] [PMC free article] [PubMed] [Google Scholar]
- 28.Zhu, W. et al. Macrophage migration inhibitory factor facilitates the therapeutic efficacy of mesenchymal stem cells derived exosomes in acute myocardial infarction through upregulating miR-133a-3p. J. Nanobiotechnol.19, 61. 10.1186/s12951-021-00808-5 (2021). [DOI] [PMC free article] [PubMed] [Google Scholar]
- 29.Song, C. et al. Reduction of miR-133a-3p contributes to apoptosis and gasdermin E-mediated pyroptosis of keratinocytes in skin exposed to ultraviolet B radiation. J. Photochem. Photobiol B. 238, 112613. 10.1016/j.jphotobiol.2022.112613 (2023). [DOI] [PubMed] [Google Scholar]
- 30.Lu, T. X., Rothenberg, M. E. & MicroRNA J. Allergy Clin. Immunol.141, 1202–1207 10.1016/j.jaci.2017.08.034 (2018). [DOI] [PMC free article] [PubMed] [Google Scholar]
- 31.Saxton, R. A. & Sabatini, D. M. mTOR signaling in growth, metabolism, and disease. Cell168, 960–976. 10.1016/j.cell.2017.02.004 (2017). [DOI] [PMC free article] [PubMed] [Google Scholar]
- 32.Wang, Q. et al. Duck Tembusu virus induces incomplete autophagy via the ERK/mTOR and AMPK/mTOR signalling pathways to promote viral replication in neuronal cells. Vet. Res.54, 103. 10.1186/s13567-023-01235-0 (2023). [DOI] [PMC free article] [PubMed] [Google Scholar]
- 33.Liu, H. et al. Picornavirus infection enhances aspartate by the SLC38A8 transporter to promote viral replication. PLoS Pathog. 19, e1011126. 10.1371/journal.ppat.1011126 (2023). [DOI] [PMC free article] [PubMed] [Google Scholar]
- 34.Liu, Z. et al. A viroporin-like 2B protein of duck hepatitis a virus 1 that induces incomplete autophagy in DEF cells. Poult. Sci.100, 101331. 10.1016/j.psj.2021.101331 (2021). [DOI] [PMC free article] [PubMed] [Google Scholar]
- 35.Li, J. et al. The DHAV-1 protein VP1 interacts with PI3KC3 to induce autophagy through the PI3KC3 complex. Vet. Res.53, 64. 10.1186/s13567-022-01081-6 (2022). [DOI] [PMC free article] [PubMed] [Google Scholar]
- 36.He, X. et al. Combination of levofloxacin and cisplatin enhances anticancer efficacy via co-regulation of eight cancer-associated genes. Discov. Oncol.13, 76. 10.1007/s12672-022-00541-x (2022). [DOI] [PMC free article] [PubMed] [Google Scholar]
- 37.Liu, Z. et al. Focal adhesion kinase mediates the interferon-gamma-inducible GTPase-induced phosphatidylinositol 3-kinase/Akt survival pathway and further initiates a positive feedback loop of NF-kappaB activation. Cell. Microbiol.10, 1787–1800. 10.1111/j.1462-5822.2008.01165.x (2008). [DOI] [PMC free article] [PubMed] [Google Scholar]
- 38.Rehwinkel, J. & Gack, M. U. RIG-I-like receptors: their regulation and roles in RNA sensing. Nat. Rev. Immunol.20, 537–551. 10.1038/s41577-020-0288-3 (2020). [DOI] [PMC free article] [PubMed] [Google Scholar]
- 39.Fitzgerald, K. A. & Kagan, J. C. Toll-like receptors and the control of immunity. Cell. 180, 1044–1066. 10.1016/j.cell.2020.02.041 (2020). [DOI] [PMC free article] [PubMed] [Google Scholar]
- 40.Liu, Y., Olagnier, D. & Lin, R. Host and viral modulation of RIG-I-Mediated antiviral immunity. Front. Immunol.7, 662. 10.3389/fimmu.2016.00662 (2016). [DOI] [PMC free article] [PubMed] [Google Scholar]
- 41.Lai, Y. et al. DHAV-1 blocks the signaling pathway upstream of type I interferon by inhibiting the interferon regulatory factor 7 protein. Front. Microbiol.12, 700434. 10.3389/fmicb.2021.700434 (2021). [DOI] [PMC free article] [PubMed] [Google Scholar]
- 42.An, H. et al. Placenta-specific 8 facilitates the infection of duck hepatitis a virus type 1 by inhibiting the TLR7 MyD88-dependent signaling pathway. Poult. Sci.102, 102724. 10.1016/j.psj.2023.102724 (2023). [DOI] [PMC free article] [PubMed] [Google Scholar]
- 43.Kim, K. A., Jung, J. H., Choi, Y. S. & Kim, S. T. Wogonin inhibits tight junction disruption via suppression of inflammatory response and phosphorylation of AKT/NF-κB and ERK1/2 in rhinovirus-infected human nasal epithelial cells. Inflamm. Res.71, 357–368. 10.1007/s00011-022-01542-w (2022). [DOI] [PubMed] [Google Scholar]
- 44.Subauste, M. C., Jacoby, D. B., Richards, S. M. & Proud, D. Infection of a human respiratory epithelial cell line with rhinovirus. Induction of cytokine release and modulation of susceptibility to infection by cytokine exposure. J. Clin. Investig.96, 549–557. 10.1172/JCI118067 (1995). [DOI] [PMC free article] [PubMed] [Google Scholar]
- 45.Ye, X. et al. MiR-126 promotes coxsackievirus replication by mediating cross-talk of ERK1/2 and Wnt/β-catenin signal pathways. Cell. Mol. Life Sci.70, 4631–4644. 10.1007/s00018-013-1411-4 (2013). [DOI] [PMC free article] [PubMed] [Google Scholar]
- 46.Zhu, Z. et al. Foot-and-mouth disease virus capsid protein VP1 interacts with Host ribosomal protein SA to maintain activation of the MAPK signal pathway and promote virus replication. J. Virol.10.1128/JVI.01350-19 (2020). [DOI] [PMC free article] [PubMed] [Google Scholar]
- 47.Sui, N. et al. Integrated miRNA and mRNA expression profiles reveal differentially expressed miR-222a as an antiviral factor against duck Hepatitis A virus type 1 infection. Front. Cell. Infect. Microbiol.11, 811556. 10.3389/fcimb.2021.811556 (2021). [DOI] [PMC free article] [PubMed] [Google Scholar]
- 48.Gahmberg, C. G. & Grönholm, M. How integrin phosphorylations regulate cell adhesion and signaling. Trends Biochem. Sci.47, 265–278. 10.1016/j.tibs.2021.11.003 (2022). [DOI] [PMC free article] [PubMed] [Google Scholar]
- 49.Sun, Y. et al. Cryo-EM structure of rhinovirus C15a bound to its cadherin-related protein 3 receptor. Proc. Natl. Acad. Sci. USA117, 6784–6791. 10.1073/pnas.1921640117 (2020). [DOI] [PMC free article] [PubMed] [Google Scholar]
- 50.Wei, W. et al. ICAM-5/Telencephalin is a functional entry receptor for Enterovirus D68. Cell. Host Microbe. 20, 631–641. 10.1016/j.chom.2016.09.013 (2016). [DOI] [PubMed] [Google Scholar]
- 51.Mishra, Y. G. & Manavathi, B. Focal adhesion dynamics in cellular function and disease. Cell. Signal.85, 110046. 10.1016/j.cellsig.2021.110046 (2021). [DOI] [PubMed] [Google Scholar]
- 52.Elbahesh, H. et al. Novel roles of focal adhesion kinase in cytoplasmic entry and replication of influenza A viruses. J. Virol.88, 6714–6728. 10.1128/jvi.00530-14 (2014). [DOI] [PMC free article] [PubMed] [Google Scholar]
- 53.Zhang, R. in Tissue Transcriptome Analysis of DHAV-1-Infected Ducklings Based on RNA-Seq Master thesis, (Huazhong Agricultural University, 2014).
- 54.Lai, Y. et al. The VP3 protein of duck hepatitis a virus mediates host cell adsorption and apoptosis. Sci. Rep.9, 16783. 10.1038/s41598-019-53285-0 (2019). [DOI] [PMC free article] [PubMed] [Google Scholar]
- 55.Hu, Q. et al. A one-step duplex rRT-PCR assay for the simultaneous detection of duck hepatitis a virus genotypes 1 and 3. J. Virol. Methods. 236, 207–214. 10.1016/j.jviromet.2016.07.011 (2016). [DOI] [PubMed] [Google Scholar]
- 56.Kechin, A., Boyarskikh, U., Kel, A., Filipenko, M. & cutPrimers,. A new tool for accurate cutting of primers from reads of targeted next generation sequencing. J. Comput. Biol.24, 1138–1143. 10.1089/cmb.2017.0096 (2017). [DOI] [PubMed] [Google Scholar]
- 57.Friedländer, M. R., Mackowiak, S. D., Li, N., Chen, W. & Rajewsky, N. miRDeep2 accurately identifies known and hundreds of novel microRNA genes in seven animal clades. Nucleic Acids Res.40, 37–52. 10.1093/nar/gkr688 (2012). [DOI] [PMC free article] [PubMed] [Google Scholar]
- 58.Bolger, A. M., Lohse, M. & Usadel, B. Trimmomatic: A flexible trimmer for Illumina sequence data. Bioinformatics30, 2114–2120. 10.1093/bioinformatics/btu170 (2014). [DOI] [PMC free article] [PubMed] [Google Scholar]
- 59.Kim, D., Langmead, B. & Salzberg, S. L. HISAT: A fast spliced aligner with low memory requirements. Nat. Methods12, 357–360. 10.1038/nmeth.3317 (2015). [DOI] [PMC free article] [PubMed] [Google Scholar]
- 60.Livak, K. J. & Schmittgen, T. D. Analysis of relative gene expression data using real-time quantitative PCR and the 2(-Delta Delta C(T)) method. Methods. 25, 402–408 (2001). [DOI] [PubMed] [Google Scholar]
- 61.Kanehisa, M. Toward understanding the origin and evolution of cellular organisms. Protein Sci.28, 1947–1951. 10.1002/pro.3715 (2019). [DOI] [PMC free article] [PubMed] [Google Scholar]
- 62.Kanehisa, M. & Goto, S. KEGG: kyoto encyclopedia of genes and genomes. Nucleic Acids Res.28, 27–30 (2000). [DOI] [PMC free article] [PubMed] [Google Scholar]
- 63.Kanehisa, M., Furumichi, M., Sato, Y., Kawashima, M. & Ishiguro-Watanabe, M. KEGG for taxonomy-based analysis of pathways and genomes. Nucleic Acids Res.51, D587–D592. 10.1093/nar/gkac963 (2023). [DOI] [PMC free article] [PubMed] [Google Scholar]
Associated Data
This section collects any data citations, data availability statements, or supplementary materials included in this article.
Supplementary Materials
Data Availability Statement
The Illumina sequencing data from this study have been submitted to NCBI Sequence Read Archive. BioProject number is PRJNA998588 https://www.ncbi.nlm.nih.gov/sra/PRJNA998588 and PRJNA1002099http://www.ncbi.nlm.nih.gov/bioproject/1002099.