

Abstract
Proton exchange underpins essential mechanisms in diverse MR imaging contrasts. Omega plots have proven effective in mapping proton exchange rates (kex) in live human brains, enabling the differentiation of MS lesion activities and characterization of ischemic stroke. However, Omega plots require extended saturation durations (typically 5 to 10 s), resulting in high specific absorption rates (SAR) that can hinder clinical feasibility. In this study, we introduce a novel kex mapping approach, named induced Saturation Transfer Recovery Steady-States (iSTRESS). iSTRESS integrates an excitation flip angle pulse prior to chemical exchange saturation transfer (CEST) saturation, effectively aligning the magnetization with its steady-state value. This innovation reduces saturation times and mitigates SAR concerns. The formula for iSTRESS-based kex quantification was derived theoretically, involving two measurements with distinct excitation flip angles and saturation B1 values. Bloch-McConnell simulations confirmed that iSTRESS-based kex values closely matched input values (R2 > 0.99). An iSTRESS MRI sequence was implemented on a 9.4 T preclinical MRI, imaging protein phantoms with pH values ranging from 6.2 to 7.4 (n = 4). Z-spectra were acquired using excitation flip angles of 30° and 60°, followed by CEST saturation at powers of 30 and 120 Hz respectively, with a total saturation time of <1 s, resulting in two iSTRESS states for kex mapping. kex maps derived from the phantom study exhibited a linear correlation (R2 > 0.99) with Omega plot results. The developed iSTRESS method allows for kex quantification with significantly reduced saturation times, effectively minimizing SAR concerns.
Keywords: CEST, Proton exchange rate mapping
1. Introduction
Proton exchange plays important roles in producing MR imaging contrasts, including T1- and T2- relaxations, chemical exchange saturation transfer (CEST), magnetization transfer (MT) [1], and nuclear Overhauser enhancement (NOE) [2]. For instance, proton exchange and dipole-dipole interaction are the two major mechanisms for MT. Despite the importance of proton exchange in various MRI contrasts, its in vivo quantification and imaging remains a challenge.
Current methods for measuring proton exchange rate (kex) include MR spectroscopy (MRS)-based methods, model-based fittings, and the use of exogenous contrast agents. MRS-Based methods, such as Water exchange (WEX) filter spectroscopy [3] and the measurement of line widths [4], are inherently low resolution and more suitable for slow exchange rates to avoid signal loss [5]. Quantifying kex directly through Z-spectral fitting to the Bloch-McConnell eqs. [6] relies significantly on estimating unmeasurable parameters for initial fitting parameters. More straightforward fitting procedures for measuring kex are offered through theoretically developed methods such as QUEST and QUESP (QUantifying Exchange using Saturation Time and Saturation Power dependencies) [5], along with their linearized versions [7,8], which provide better results but require more acquisitions. Novel fingerprinting-based MRI [9,10], which also relies on simulated datasets from Bloch-McConnell models, has great potential for clinical translation.
Among these methods, Omega plotting [7] offers a direct approach to determine kex independent of the CEST agent concentration within a certain range of kex values. This technique involves acquiring a series of steady-state Z-spectra with different saturation pulses and analyzing the plot of the inverse of the Z-spectral signal intensity versus the inverse of the square of saturation pulse power (the omega plot). This method can be used to determine the rate of transfer of saturated or partially saturated spins to the bulk water pool, for a range where the exchange rate (kex) is much faster than the relaxations rates (i.e., kex ≫ R1 & R2), but not excessively high such that the CEST spectral signatures in Z-spectra coalesce.
Omega plotting was initially developed to measure kex of paramagnetic CEST (paraCEST) agents [11], where the resonance frequencies of labile protons are far from the water resonance, thus not affected by the direct saturation (DS) of water protons (the “spillover” effect). However, in vivo tissues predominantly involve proton exchange contributed by diamagnetic metabolites, whose exchangeable protons resonate close to water, typically within a range of <5 ppm [12,13].
To address the mentioned obstacles, a modification of omega plotting has been developed [14] and verified in recent studies [14–16]. By analytically fitting and removing the contaminating direct saturation signal in the Z-spectrum, the direct saturation-removed Omega plots method has demonstrated its applicability for mapping kex variation in phantoms, in vivo healthy human brains [14], and patients with multiple sclerosis (MS) [15] or stroke [16]. However, in those human studies, to avoid long saturation times and the potential for high Specific Absorption Rate (SAR), the steady-state saturation required for Omega plotting was approximated using only a 1.5-s-long saturation pulse.
In this study, we present an MRI method for quantifying kex, developed based on induced Saturation Transfer Recovery Steady-State (iSTRESS). This method offers several improvements, including being designed for endogenous CEST contrasts, having analytic solutions, short saturation time, and negligible SAR, making it highly suitable for clinical translation. To achieve this, we derived mathematical formulas for quantifying kex based on iSTRESS and conducted simulations to verify its accuracy. Subsequently, we implemented an iSTRESS MRI pulse sequence on a 9.4 T preclinical MRI scanner and performed iSTRESS MRI on in vitro protein phantoms at varying pH levels. The results were then compared with the Omega plotting technique for kex mapping.
2. Theoretical consideration
Proton exchange plays a crucial role in many MRI contrasts, including CEST. CEST can be effectively modeled as a two-pool exchanging system between pool A (such as bulk water protons) and pool B (such as metabolites with exchangeable protons), as illustrated in Fig. 1. When a continuous saturation radiofrequency (RF) pulse is applied to pool B, which can be the solute or the metabolite of interest, its signal is reduced when the saturation rate is fast compared to the inherent relaxation rates (R1 & R2) of the solute (Fig. 1A, left).
Fig. 1.
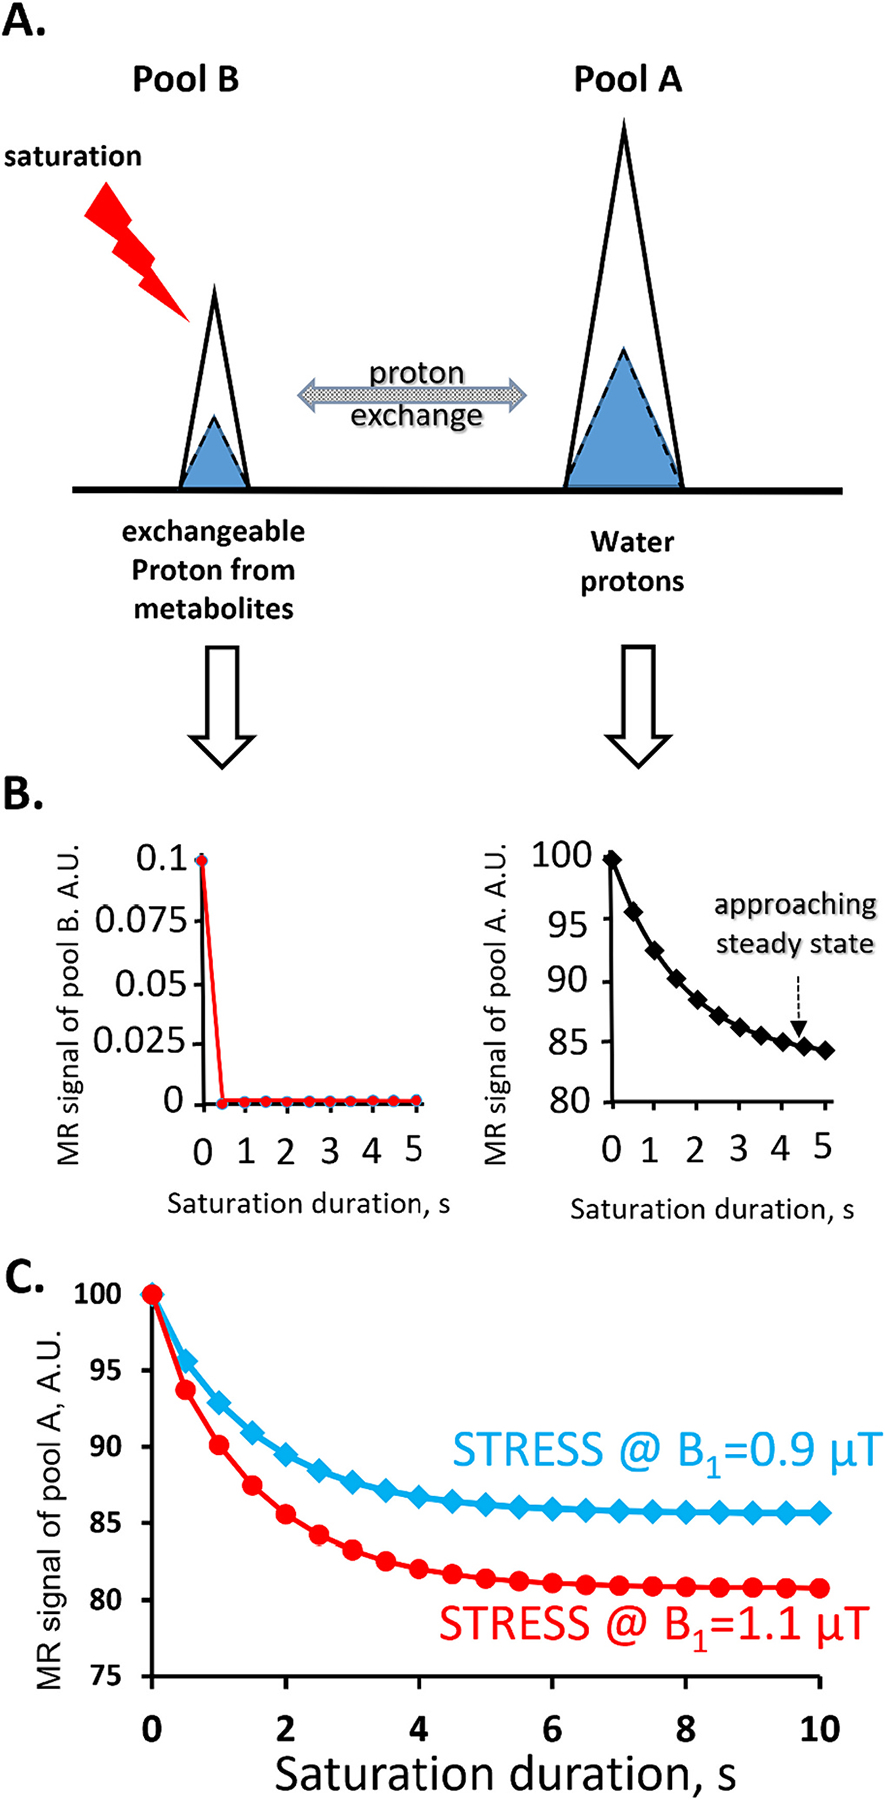
A) Illustration of a two-pool proton exchange model. Frequency selective saturation of pool B protons leads to signal reduction in pool A via proton exchange.
B). Simulations from Bloch-McConnell equations with the following parameters: pool A proton concentration (M0a) 100 mol/L; pool B proton concentration (M0b) 100 mM; T1 and T2 relaxation times of both pools T1a = T1b = 2 s, T2a = T2b = 0.1 s; proton exchange rate between the pools kex = 100 s−1; Δω = 40,000 Hz; saturation RF pulse strength (B1) = 2 μT. (A.U.: arbitrary unit).
C) Saturation transfer and T1 recovery process can balance each other after a prolonged saturation (>10 s), reaching a steady-state, at which signal from pool A remains constant. Here, two different saturation transfer recovery steady-states (STRESS) with different saturation powers (B1’s) (0.9 μT, blue diamonds; 1.1 μT, red circles) are rendered (kex = 600 s−1, rest of the simulation parameters are same as in B). With two different steady-states, the proton exchange rate can be analytically derived from Eq.(9).
Proton exchange between pool B (metabolites’ exchangeable protons) and pool A (bulk water), results in the transfer of some saturated protons from pool B to pool A, indirectly reducing the signal of pool A (Figure1A, right). Simultaneously, the signal from pool A protons tends to recover back toward the equilibrium value due to the inherent spin-lattice relaxation (T1-relaxation) process. Once the signal loss due to the saturation transfer balances the signal gain due to T1 recovery, the pool A signal reaches a steady-state value and remains constant. We refer to this condition as the Saturation Transfer REcovery Steady State (STRESS).
Under STRESS, the average signal value of pool A proton, normalized to its equilibrium value, can be expressed as:
| (1) |
where MZ,ss and MZ,eq represent the steady-state and equilibrium magnetization, respectively. On the other hand, for pool B protons, the signal normalized to its equilibrium value can be written as:
| (2) |
where α represents the amount of signal reduction due to the applied saturation pulse. For pools with a relatively fast exchange rate compared to T1 & T2 relaxation rates (i.e., kex≫R1&R2), the saturation efficiency α can be approximated as [17–20].
| (3) |
Here, γ is the nuclear gyromagnetic ratio, and B1 denotes the applied saturation pulse power (γ is 42.58 MHz/Tesla for protons).
The signal loss in pool A due to exchange from saturated pool B protons depends on several factors: the exchange rate between the pools (kex), the fraction of protons in pool B relative to pool A (fB), and the saturations of pool B protons (1 − mB). This can be described by the equation:
| (4) |
Simultaneously, the reduced signal of pool A protons increases back to its equilibrium value due to the inherent spin-lattice relaxation (T1-relaxation) process with the rate of:
| (5) |
where is defined by the T1 relaxation rate. The steady-state condition is reached when the signal loss and the signal gain balance each other, as shown in the equation:
| (6) |
In the above equation, MZ,ss, MZ,eq, , and B1 are either known or measurable parameters. This equation allows for the determination of the relative proton density of the two pools, fB, and the exchange rate, kex. However, it’s important to note that a single equation cannot be used to solve for both parameters simultaneously. By applying two different saturation pulses powers (B1,1 and B1,2) and reaching two STRESS states (SS1 and SS2, as shown in Fig. 1C), the above equation can be solved analytically by dividing the following equations:
| (7) |
| (8) |
which leads to determining (and hence kex) as:
| (9) |
This equation allows for the calculation of the kex by knowing the initial water signal , the steady-state signals under saturation , and the two saturation pulse powers leading to those steady-states (B1,1&B1,2), all of which are experimentally determinable.
2.1. Inducing the steady states
Reaching the steady state theoretically requires a long saturation duration, typically between 5 and 10 s. However, the long saturation may result in excessive RF heat deposition, which is not desirable in clinical applications. To address this challenge, it is important to consider that a steady state represents an equilibrium situation where the saturation rate and the T1 relaxation rate balance each other. Once the system reaches a steady state, the process by which the steady-state is achieved becomes irrelevant. Furthermore, determining the kex from Eq. (9) only necessitates knowledge of the equilibrium (Mz,eq) and steady-state signal ( and ) values for two different saturation pulses. These considerations suggest that if the steady states can be induced with the help of an excitation pulse, the exchange rate can be determined with shorter saturation durations and without SAR concerns.
To achieve this objective, we developed a novel pulse sequence, as illustrated in Fig. 2, for obtaining an induced saturation transfer recovery steady-state (iSTRESS). In the iSTRESS MRI pulse sequence, an excitation RF pulse is first applied to rotate the magnetization by a specific flip angle (β). Following the flip angle pulse, a saturation pulse with power B1 is applied to the rotated magnetization to yield a steady-state, and then the signal is acquired. Once two steady-state signal values are acquired, kex can be determined using Eq. (9), which involves the two saturation powers and the equilibrium magnetization signal value. By following this approach for each pixel, we can generate exchange rate maps.
Fig. 2.

A) An iSTRESS MRI sequence: an excitation RF pulse (typically in ms) rotates the magnetization by a small flip angle (β), which is followed by a saturation pulse and signal reading.
B) The demonstration of two iSTRESS states under flip angles of 20° and 40°. The exchange rate is set to kex = 600 s−1, and the other simulation parameters are the same as in Fig. 1.
C) Signal readings from a series of iSTRESS MRI sequences with varied saturation strengths (varied B1’s) to determine the optimum B1, denoted by the black square, leading to an iSTRESS state for the flipped magnetization (MSS), (here B1 = 0.53 μT). The lines with different colors demonstrate signal dynamics due to varied B1. The signals to be acquired in actual experiments are denoted by the large solid circles. Saturation durations can be shortened, and two different iSTRESS states can be induced at even shorter times. (kex = 600 s−1, the simulation parameters are same as in Fig. 1).
To assess the proper saturation power (B1,i, i = 1 or 2) yielding the steady-state for each rotated magnetization, a series of saturation trials are conducted with different B1 values for a short saturation time (typically <1 s, as shown in Fig. 2C). The B1,i value leading to an iSTRESS condition is then computed by interpolating the collected MR signals at varied B1 values, aiming to find the saturation power that results in a steady-state signal close to the magnetization right following the applied rotation.
This trial experiment is only required once at the beginning of any systematic study as the precise determination of B1,1 and B1,2 values is not necessary. Our simulations have shown that for each applied flip angle, there is a range of B1 values that can maintain the rotated magnetization close to its steady-state value. Based on our numerical simulations (not shown), we found that a deviation of ±4 Hz for small flip angles (~30°) and ± 9 Hz for larger flip angles (~60°) from the optimal B1,i still keeps the signal within 2% of the steady-state value. This means that under such conditions, immediately after the applied rotation, the signal value is already close to its steady-state value, and the subsequent saturation pulse will further lead the signal toward the steady-state level. By adopting this approach, a more efficient and practical implementation of the iSTRESS method may be achieved.
3. Material and methods
To validate the accuracy of the proposed iSTRESS-based kex quantification we conducted numerical simulations with the Bloch-McConnell equations. In these simulations, the Bloch-McConnell equations were utilized to calculate the signal values for a two-pool exchanging system consisting of bulk water at 0 ppm and exchangeable protons at 100 ppm, at 9.4 T. A large offset for exchangeable protons was employed to avoid potential influence from direct saturation. The remaining parameters used in the simulation were as follows: T1a = 2 s, T2a = 0.2 s, T1b = 0.01 s, T2b = 0.005 s, (80 mM exchangeable protons), and the exchange rate spanned from relatively slow (kex = 50 s−1) to fast (kex = 3000 s−1) values.
In these numerical simulations, we calculated the signal values following a saturation duration of 0.875 s, using varied saturation powers (B1) applied right after the flip angle pulses of β = 20° or 40°. B1 values ranged from 10 to 150 Hz, with 10 Hz intervals. The optimal saturating B1,i, inducing the steady-state for each flip angle, was determined by interpolating the two saturation powers corresponding to steady-state values adjacent to the value of the rotated signal. To calculate the exchange rates, Eq.(9) was then utilized.
3.1. Image acquisition
We implemented an iSTRESS MRI sequence (Fig. 3) on a 9.4 T preclinical MRI scanner (Agilent Technologies, Santa Clara, CA) and performed initial validation using phantoms with varied pH (Fig. 5). In vitro protein phantoms containing 20% (w/w) bovine serum albumin (BSA) (Sigma-Aldrich Corp., St. Louis, MO) in phosphate-buffered saline (n = 3) were freshly prepared in four 5-mm NMR tubes at room temperature. The pH of the solutions was varied to include pH values of 6.2, 6.6, 7.0, and 7.4. MRI scans were conducted on a single slice using the following parameters: field of view (FOV) = 2 × 2 cm2, matrix size = 128 × 128, slice thickness = 5 mm, number of averages = 2.
Fig. 3.

Diagram of an iSTRESS MRI pulse sequence designed to promptly rotate the water magnetization to an approximate steady-state level before applying the saturation pulse. The iSTRESS pulse consist of the following components: an excitation flip angle pulse, a chemical shift selective saturation pulse with a total saturation duration of 0.875 s, crusher gradients, followed by a single-shot Fast Low-Angle Shot (FLASH) readout sequence, and a T1 recovery delay of 5 s.
Fig. 5.

Phantom study using BSA in PBS 20% (w/w) with four pH values ranging from 6.2 to 7.4. A) Proton exchange rate maps constructed using iSTRESS with a total saturation length of 0.875 s. The two steady-states were induced with two flip angle pulses (β = 30° & β =60°) and corresponding saturation powers (B1,i = 30 & B1,i = 120 Hz, respectively). B) proton exchange rate maps constructed using the Omega plot method with two saturation powers (B1 = 40 & B1 = 120 Hz) and a saturation length of 2 s. In phantoms, pH values decrease counterclockwise from the top. Both maps exhibit a very similar trend, indicating an increase in exchange rate with pH within this range. C) Correlation between the two methods demonstrates linearity.
The samples were scanned using the iSTRESS protocol with flip angles of β = 30° and 60°. For each flip angle, two Z-spectra were acquired using a single-shot fast low-angle shot (FLASH) [21]. One Z-spectrum was acquired immediately after the flip angle pulse (saturation duration = 0), and the other Z-spectrum was acquired following a 0.875 s of saturation using different saturation powers (B1 = 30 Hz for β = 30°, and B1 = 120 Hz for β = 60°). These optimal saturation power values were determined by interpolation among three B1’s for each flip angle.
The Z-spectra consisted of the following 22 saturation offsets: −100, −15, 0, ±0.25, ±0.5, ±1, 1.5, 2, 2.5, 2.75, ±3, 3.25, 3.5, 3.75, 4, ±5 & 10 ppm and the total scanning time was about 16 min. To correct B0 inhomogeneity, a WAter Saturation Shift Referencing (WASSR) scheme sequence [22] was also scanned using a saturation pulse of 0.4μT for 200 ms and frequency offsets within ±1 ppm. Other parameters of the WASSR sequence were the same as the aforementioned Z-spectral imaging, with no pre-excitation pulse. For Omega plotting, two additional Z-spectra were collected with saturation powers B1 = 40 and B1 = 120 Hz, each with a saturation length of 2 s.
3.2. Image processing
All data analyses were performed using custom-developed programs in MATLAB R2016a (MathWorks, Natick, MA). The collected Z-spectra were first corrected for B0 inhomogeneity based on the B0 maps generated using the WASSR method. For the quantification of kex in the phantom experiment, the Z-spectral signal at +2.75 ppm, corresponding to the offset frequency where there is a dominant Z-spectral dip, caused by amine protons in the BSA solution [23], was utilized.
According to Eq.(9), there are five parameters that need to be acquired in an experiment for the quantification of kex: the initial equilibrium signal value of water protons (Mz,eq), two steady-state signal values (Mz,ss1 and Mz,ss2), and their corresponding applied saturation pulse strengths (B1,1, B1,2). In the iSTRESS scheme, the saturation power strengths that maintain the rotated signal values, i.e., the steady-state-inducing saturation pulse, B1,i, are determined via interpolation. To determine the optimal B1 power for inducing iSTRESS condition for each flip angle, a trial set of experiments was performed at the beginning of the study, during which the value of the rotated signal right after the flip angle pulse (equal to Mz,ss in Eq.(5)) was interpolated among three different signal values collected for three tentative saturating B1’s at a saturation duration of 0.875 s. To obtain a more accurate value for the signal right after the flip angle pulse, the averaged signal value over all the collected frequency offsets was used, as there is no saturation at this point.
After determining the optimal B1,i value for each flip angle, the exchange rate was determined using Eq.(9) with the two steady-state signal values and their corresponding saturation pulse powers. Exchange rate maps were then constructed following this procedure in a pixel-wise manner. As for Omega plotting, we followed the methodology described in [7].
4. Results
Fig. 4 presents the summarized results from the numerical simulations conducted. The magnetization of the water pool protons was calculated by numerically solving the Bloch-McConnell equations in an iSTRESS scheme with two flip angles, β = 20° and 40°, for a two-pool exchanging system consisting of bulk water at 0 ppm and bound protons at 100 ppm. The exchange rates determined using Eq.(9) are plotted against the actual input kex values spanning a range from 50 to 3000 s−1. The simulation results confirm a linear relationship between the input and calculated exchange rate values obtained from the iSTRESS method (kex,iSTRESS = 1.0355 kinput + 165.84, R2 = 0.999), over a wide range of values, validating the linearity of the iSTRESS method in quantifying the exchange rate.
Fig. 4.
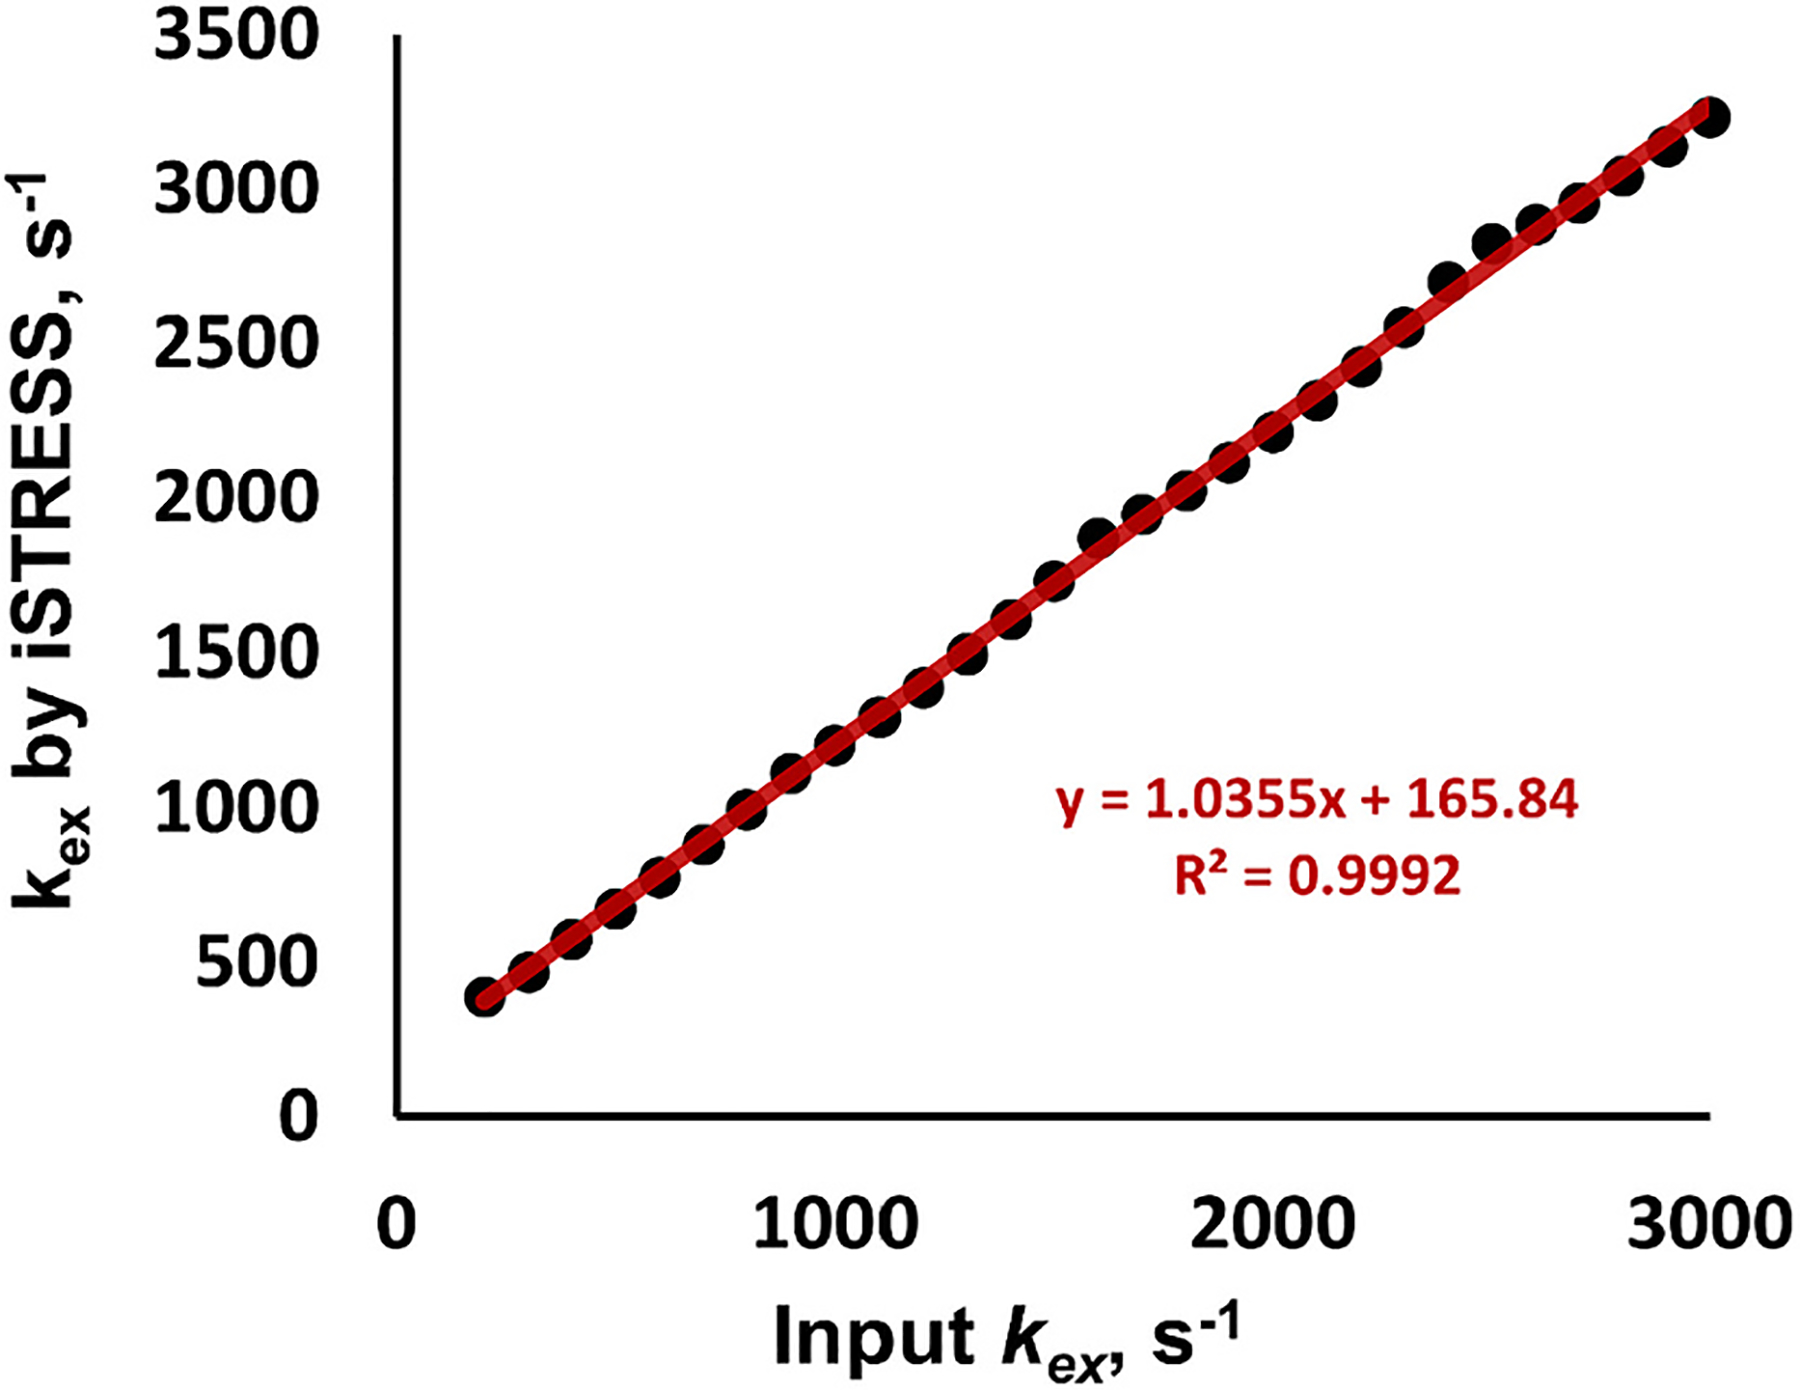
The plot shows the calculated exchange rates using the derived Eq.(9) for determining the exchange rate from the steady-state magnetization values, versus the input rates. The simulation was performed using two-pool Bloch-McConnell equations with the following parameters: Δω = 40,000 Hz (100 ppm at 9.4 T), T1a = 2 s, T2a = 0.2 s, T1b = 0.01 s, T2b = 0.005 s, , saturation duration = 0.875 s, and β = 20° & 40°. Proton exchange rates from iSTRESS are linearly dependent with the actual input rates. The linear relationship between the determined and actual exchange values holds for a larger range of exchange rate values.
Fig. 5 summarizes the results from the protein phantoms prepared at different pH levels. The proton exchange rate maps constructed using iSTRESS method show a similar trend when compared to the exchange rate maps obtained through Omega plotting. The iSTRESS results were generated using two different flip angles (β = 30° & β =60°) and their corresponding steady-state inducing RF powers (B1,i = 30 & B1,i = 120 Hz, respectively), with a total saturation length of less than a second (saturation duration = 0.9 s). These results are compared with the Omega plot results obtained using two saturation powers (B1 = 40 & B1 = 120 Hz) with a saturation length of 2 s. The comparison indicates a linear correlation between the outcomes of the two methods.
5. Discussion
In this study, we explored iSTRESS MRI for quantifying the exchange rate (kex) using short saturation durations, resulting in reduced SAR. Our approach involves promptly rotating the water magnetization to approximate steady-state levels before applying a saturation pulse, thereby eliminating the gradual steady state buildup time. The iSTRESS MRI scheme offers a significant reduction in the saturation time required to reach the steady-state condition, reducing it from a minimum of 5 s to <1 s.
The iSTRESS method was validated through numerical simulations, revealing a linear correlation between the calculated exchange rate values and the actual input values, with an R-squared value exceeding 0.99. It’s important to acknowledge that the calculated exchange rates in the iSTRESS method may not precisely match the input values. This discrepancy may be attributed in part to the approximation of saturation efficiency (as in Eq.3) during the derivation of the exchange rate formula (Eq.9), or, in part, to the interpolation of the saturation powers (B1,i’s) during practical implementation. Despite the deviation from actual kex values, the linear correlation between the two confirms the potential of using iSTRESS MRI for kex mapping.
In a phantom study using protein solutions with varying pH levels, the results obtained from the iSTRESS method were compared with those obtained using the Omega plot method [7]. Both the iSTRESS and Omega plotting methods exhibit a very similar trend in the exchange rate maps, indicating an increase in exchange rate with higher pH values. This observation aligns with findings from previous studies [14,24]. The similarity between the outcomes of the two methods and their linear correlation further validates the capacity of the iSTRESS method in detecting variations in exchange rates due to pH changes.
While the iSTRESS method has the potential for concentration-independent quantification of exchange rates based on Eq.(9), further experiments are required to experimentally verify its applicability for measuring kex values independent of the proton concentration, as demonstrated for Omega plotting [7].
It is important to acknowledge several factors that can potentially affect the accuracy of exchange rates quantification in the iSTRESS method in practice. These factors include the choice of excitation flip angles, contamination from direct saturation (DS) and magnetization transfer (MT), as well as B0 and B1 inhomogeneity-induced variations. The proper choice of excitation flip angles in the iSTRESS method is crucial: selecting a small flip angle (β < 20°) can make it challenging to determine the optimal B1,i values, especially in the presence of noise, as the steady-state signals may be very close to the equilibrium signal value. On the other hand, choosing a large flip angle (β > 70°) will result in larger saturating B1,i values, which can lead to increased DS and MT contamination, as well as high SAR.
These contaminating effects are unavoidable, especially at high saturation B1 powers, and are typically involved in in vivo experiments. To enhance the accuracy of kex quantification using the iSTRESS method, it is crucial to mitigate these contaminating effects and account for their influence on the quantification of kex. Fitting methods, such as multi-Lorentzian fitting of the Z-spectra [25], have already been employed to account for and remove signals resulting from these contaminating effects in in vivo studies. Specifically, the direct signal removal technique has been successfully applied in kex quantification using the Omega plot method, which shares similarities with the iSTRESS method developed here, in various in vivo studies [14,26,27]. Utilizing analytical fitting methods alongside iSTRESS MRI can improve the accuracy of kex quantification and extends the applicability of the developed iSTRESS to in vivo experiments.
It is also important to correct for B0 inhomogeneity and B1 field variations when employing the iSTRESS method, as these can introduce additional errors in the quantification of exchange rates. By considering these factors and further investigating their impacts, the applicability and accuracy of kex quantification with iSTRESS MRI can potentially be enhanced.
In our experiment, we collected full Z-spectra for proof of principle. However, this comprehensive Z-spectra collection led to extended acquisition times. The scan time can be reduced by minimizing the number of Z-spectral offsets and implementing fast imaging techniques. Additionally, the required number of Z-spectra can be reduced to just two, one for each flip angle, once the optimal B1,i values for each flip angle are determined. Finally, our implementation of the iSTRESS MRI pulse sequence is on a 9.4 T preclinical MRI scanner, and translation into clinical scanners with lower magnetic fields results in smaller frequency separation between solute and water protons.
In conclusion, our proof-of-principle study, conducted through simulations and phantom experiments, has successfully demonstrated a novel MR imaging method capable of efficiently collecting saturation signal values within a relatively short saturation duration. This addresses SAR concerns, thereby enhancing clinical translatability. The next step involves applying this method in vivo, which we plan to present in future work. The iSTRESS MRI method holds great promise for mapping in vivo proton exchange rates in various clinical applications.
Funding
Research reported in this publication was supported by the NIH under Award Numbers R01DK135722, R01CA283548, and R01AG061114. The content is solely the responsibility of the authors and does not necessarily represent the official views of the National Institutes of Health.
Footnotes
CRediT authorship contribution statement
Mehran Shaghaghi: Writing – review & editing, Writing – original draft, Visualization, Validation, Software, Methodology, Investigation, Formal analysis, Data curation. Frederick C. Damen: Writing – review & editing. Weiguo Li: Writing – review & editing, Resources. Leon M. Tai: Resources. Kejia Cai: Writing – review & editing, Supervision, Methodology, Funding acquisition, Conceptualization.
References
- [1].Henkelman RM, Stanisz GJ, Graham SJ. “Magnetization transfer in MRI: a review,” (in English). NMR Biomed 2001;14(2):57–64. [DOI] [PubMed] [Google Scholar]
- [2].Jones CK, et al. “nuclear Overhauser enhancement (NOE) imaging in the human brain at 7T,” (in English). NeuroImage 2013;77:114–24. [DOI] [PMC free article] [PubMed] [Google Scholar]
- [3].Mori S, Abeygunawardana C, van Zijl PC, Berg JM. Water exchange filter with improved sensitivity (WEX II) to study solvent-exchangeable protons. Application to the consensus zinc finger peptide CP-1. J Magn Reson B Jan 1996;110(1): 96–101. [DOI] [PubMed] [Google Scholar]
- [4].Haris M, et al. Exchange rates of creatine kinase metabolites: feasibility of imaging creatine by chemical exchange saturation transfer MRI. NMR Biomed Nov 2012;25 (11):1305–9. [DOI] [PMC free article] [PubMed] [Google Scholar]
- [5].McMahon MT, Gilad AA, Zhou J, Sun PZ, Bulte JW, van Zijl PC. Quantifying exchange rates in chemical exchange saturation transfer agents using the saturation time and saturation power dependencies of the magnetization transfer effect on the magnetic resonance imaging signal (QUEST and QUESP): Ph calibration for poly-L-lysine and a starburst dendrimer. Magn Reson Med Apr 2006;55(4):836–47. [DOI] [PMC free article] [PubMed] [Google Scholar]
- [6].Woessner DE, Zhang S, Merritt ME, Sherry AD. Numerical solution of the Bloch equations provides insights into the optimum design of PARACEST agents for MRI. Mag Reson Med 2005;53(4):790–9. [DOI] [PubMed] [Google Scholar]
- [7].Dixon WT, et al. A concentration-independent method to measure exchange rates in PARACEST agents. Magn Reson Med Mar 2010;63(3):625–32. [DOI] [PMC free article] [PubMed] [Google Scholar]
- [8].Randtke EA, Chen LQ, Pagel MD. The reciprocal linear QUEST analysis method facilitates the measurements of chemical exchange rates with CEST MRI. Contrast Media Mol Imaging May–Jun 2014;9(3):252–8. [DOI] [PMC free article] [PubMed] [Google Scholar]
- [9].Zhou Z, et al. Chemical exchange saturation transfer fingerprinting for exchange rate quantification. Magn Reson Med Oct 2018;80(4):1352–63. [DOI] [PMC free article] [PubMed] [Google Scholar]
- [10].Heo HY, Han Z, Jiang S, Schar M, van Zijl PCM, Zhou J. Quantifying amide proton exchange rate and concentration in chemical exchange saturation transfer imaging of the human brain. Neuroimage Apr 1, 2019;189:202–13. [DOI] [PMC free article] [PubMed] [Google Scholar]
- [11].Zhang S, Merritt M, Woessner DE, Lenkinski RE, Sherry AD. PARACEST agents: modulating MRI contrast via water proton exchange. Acc Chem Res 2003;36(10): 783–90. [DOI] [PubMed] [Google Scholar]
- [12].McMahon MT, Gilad AA, DeLiso MA, Cromer Berman SM, Bulte JW, Van Zijl PC. New “multicolor” polypeptide diamagnetic chemical exchange saturation transfer (DIACEST) contrast agents for MRI. Magn Reson Med 2008;60(4):803–12. [DOI] [PMC free article] [PubMed] [Google Scholar]
- [13].Vinogradov E, Sherry AD, Lenkinski RE. CEST: from basic principles to applications, challenges and opportunities. J Magn Reson Apr 2013;229:155–72. [DOI] [PMC free article] [PubMed] [Google Scholar]
- [14].Shaghaghi M, et al. In vivo quantification of proton exchange rate in healthy human brains with omega plot. Quant Imaging Med Surg 2019;9(10):1686. [DOI] [PMC free article] [PubMed] [Google Scholar]
- [15].Ye H, et al. In vivo proton exchange rate (kex) MRI for the characterization of multiple sclerosis lesions in patients. J Magn Reson Imaging 2020;53(2):408–15. [DOI] [PMC free article] [PubMed] [Google Scholar]
- [16].Wang Z, et al. Novel proton exchange rate MRI presents unique contrast in brains of ischemic stroke patients. J Neurosci Methods 2020;346:108926. [DOI] [PMC free article] [PubMed] [Google Scholar]
- [17].van Zijl PCM, Yadav NN. “Chemical exchange saturation transfer (CEST): what is in a name and what isn’t?,” (in English). Magn Reson Med 2011;65(4):927–48. [DOI] [PMC free article] [PubMed] [Google Scholar]
- [18].McMahon MT, Gilad AA, Zhou J, Sun PZ, Bulte JWM, van Zijl PCM. “Quantifying exchange rates in chemical exchange saturation transfer agents using the saturation time and saturation power dependencies of the magnetization transfer effect on the magnetic resonance imaging signal (QUEST and QUESP): Ph calibration for poly-L-lysine and a starburst dendrimer,” (in English). Magn Reson Med 2006;55(4):836–47. [DOI] [PMC free article] [PubMed] [Google Scholar]
- [19].Zhou J, Wilson DA, Sun PZ, Klaus JA, Van Zijl PCM. “quantitative description of proton exchange processes between water and endogenous and exogenous agents for WEX, CEST, and APT experiments,” (in English). Magn Reson Med 2004;51(5): 945–52. [DOI] [PubMed] [Google Scholar]
- [20].Snoussi K, Bulte JWM, Gueron M, van Zijl PCM. “sensitive CEST agents based on nucleic acid imino proton exchange: detection of poly(rU) and of a dendrimer-poly (rU) model for nucleic acid delivery and pharmacology,” (in English). Magn Reson Med 2003;49(6):998–1005. [DOI] [PubMed] [Google Scholar]
- [21].Cai KJ, et al. Magnetic resonance imaging of glutamate. Nat Med Feb 2012;18(2): 302–6. [DOI] [PMC free article] [PubMed] [Google Scholar]
- [22].Kim M, Gillen J, Landman BA, Zhou JY, van Zijl PCM. Water saturation shift referencing (WASSR) for chemical exchange saturation transfer (CEST) experiments. Magn Reson Med Jun 2009;61(6):1441–50. [DOI] [PMC free article] [PubMed] [Google Scholar]
- [23].McVicar N, et al. Quantitative tissue pH measurement during cerebral ischemia using amine and amide concentration-independent detection (AACID) with MRI. J Cereb Blood Flow Metab Apr 2014;34(4):690–8. [DOI] [PMC free article] [PubMed] [Google Scholar]
- [24].Jin T, Autio J, Obata T, Kim SG. Spin-locking versus chemical exchange saturation transfer MRI for investigating chemical exchange process between water and labile metabolite protons. Magn Reson Med May 2011;65(5):1448–60. [DOI] [PMC free article] [PubMed] [Google Scholar]
- [25].Cai KJ, et al. CEST signal at 2ppm (CEST@2ppm) from Z-spectral fitting correlates with creatine distribution in brain tumor. NMR Biomed Jan 2015;28(1):1–8. [DOI] [PMC free article] [PubMed] [Google Scholar]
- [26].Ye H, et al. In vivo proton exchange rate (kex) MRI for the characterization of multiple sclerosis lesions in patients. J Magn Reson Imaging 2021;53(2):408–15. [DOI] [PMC free article] [PubMed] [Google Scholar]
- [27].Wang Z, et al. Novel proton exchange rate MRI presents unique contrast in brains of ischemic stroke patients. J Neurosci Methods Sep 5, 2020;346:108926. [DOI] [PMC free article] [PubMed] [Google Scholar]