

Abstract
Ischemic postconditioning (PostC) is known to reduce cerebral ischemia/reperfusion (I/R) injury; however, whether the opening of mitochondrial ATP-dependent potassium (mito-KATP) channels and mitochondrial permeability transition pore (mPTP) cause the depolarization of the mitochondrial membrane that remains unknown. We examined the involvement of the mito-KATP channel and the mPTP in the PostC mechanism. Ischemic PostC consisted of three cycles of 15 s reperfusion and 15 s re-ischemia, and was started 30 s after the 7.5 min ischemic load. We recorded N-methyl-d-aspartate receptors (NMDAR)-mediated currents and measured cytosolic Ca2+ concentrations, and mitochondrial membrane potentials in mouse hippocampal pyramidal neurons. Both ischemic PostC and the application of a mito-KATP channel opener, diazoxide, reduced NMDAR-mediated currents, and suppressed cytosolic Ca2+ elevations during the early reperfusion period. An mPTP blocker, cyclosporine A, abolished the reducing effect of PostC on NMDAR currents. Furthermore, both ischemic PostC and the application of diazoxide potentiated the depolarization of the mitochondrial membrane potential. These results indicate that ischemic PostC suppresses Ca2+ influx into the cytoplasm by reducing NMDAR-mediated currents through mPTP opening. The present study suggests that depolarization of the mitochondrial membrane potential by opening of the mito-KATP channel is essential to the mechanism of PostC in neuroprotection against anoxic injury.
Electronic supplementary material
The online version of this article (10.1007/s10571-020-00996-y) contains supplementary material, which is available to authorized users.
Keywords: Ischemic postconditioning, NMDA receptor, Mitochondrial KATP channel, Mitochondrial permeability transition pore, Ca2+
Introduction
Brain tissue ischemia–reperfusion (I/R) injury is a common characteristic of ischemic stroke which occurs when blood supply is restored after a period of ischemia. Although reperfusion is the main treatment for acute ischemic stroke (AIS), it can also worsen tissue damage and limit the recovery of function. It has been shown that the mechanisms underlying I/R injury include leukocyte infiltration, platelet activation, oxidative stress, complement activation, mitochondria-mediated mechanisms, disruption of the blood–brain barrier, and ultimately post-ischemic hyperperfusion leading to edema or hemorrhagic transformation (Carden and Granger 2000; Nagai et al. 2015; Nour et al. 2013; Zhao 2009).
A phenomenon whereby ischemic tolerance can be obtained by intermittently applying ischemic loads prior to lethal ischemia has been called ischemic preconditioning (IPC; Kitagawa et al. 1990; Nakagawa et al. 2002; Yin et al. 2005). Although IPC has been proven to have a remarkable neuroprotective effect for cerebral I/R injury, clinical application of the IPC mechanism for AIS is impractical unless the onset of AIS can be predicted. However, it has been found that intermittent ischemic loads after severe ischemia can also suppress I/R injury, which is termed postconditioning (PostC; Wang et al. 2008; Zhao et al. 2006, 2003). Since the onset time of reperfusion after AIS can be predictable or controllable in clinic settings, the concept of PostC could lead to establishing new therapeutic modalities in addition to intravenous tissue plasminogen activator (tPA) treatment and mechanical thrombectomy. Previous studies have demonstrated that PostC is mediated by opening of mitochondrial ATP-dependent potassium (mito-KATP) channels (Kis et al. 2003; Robin et al. 2011), and we previously reported that the opening of mito-KATP channels is involved in the suppressive effect of ischemic PostC on excessive synaptic glutamate release and in protection against neuronal death (Yokoyama et al. 2019). However, the more detailed mechanism by which the opening of mito-KATP channels exerts neuroprotective effects in PostC has not yet been elucidated.
One of the crucial elements of the cellular process involved in cerebral I/R injury is the N-methyl-d-aspartate receptor (NMDAR). Activation of NMDAR by excessive glutamate release due to cerebral ischemia exerts a harmful effect in acute cerebral ischemia (Mayor and Tymianski 2018). Overactivation of NMDAR increases cytosolic Ca2+ concentrations ([Ca2+]), activates proteins such as caspases and endonucleases, and ultimately leads to cell death (Szydlowska and Tymianski 2010). Interestingly, the western painted turtle, which is highly resistant to ischemia, exhibits decreased NMDAR currents during anoxia (Bickler et al. 2000). Furthermore, Hawrysh et al. indicated that this mechanism involves the opening of the mito-KATP channel (Hawrysh and Buck 2013).
Another element participating in cerebral I/R injury is the mitochondrial permeability transition pore (mPTP). The excessive accumulation of Ca2+ in the mitochondrial matrix and other pathological factors cause the opening of mPTP. The mPTP has two modes of opening. One is the high-conductance mode, which allows the passage of molecules with molecular weights up to about 1.5 kDa, and is mainly involved in mitochondrial swelling and cell death (Haworth and Hunter 1979; Hunter and Haworth 1979a, b). The other is termed as a low-conductance mode and allows the passage of small molecules (< 300 Da) such as the inorganic ions Ca2+, H+, and K+. Hawrysh et al. reported that in western painted turtles, the low-conductance mode of mPTP opening reduces NMDAR conductance to obtain ischemic tolerance (Haworth and Hunter 1979). It has been presumed that the low-conductance mode of mPTP opening, together with mito-KATP channel opening, depolarizes the matrix membrane potential (ΔΨ), causes mitochondrial Ca2+ release, and consequently lowers NMDAR currents during anoxia. However, whether the opening of mito-KATP channels and mPTP actually cause the depolarization of the mitochondrial membrane remains unknown.
In the present study, we hypothesized that the anoxic tolerance mechanisms in western painted turtles might also be applicable to PostC in mammals. We analyzed NMDAR currents, cytosolic Ca2+ concentrations, and mitochondrial membrane potential changes under ischemia or chemical PostC in hippocampal pyramidal neurons using whole-cell patch-clamp techniques.
Materials and Methods
Preparation of Mouse Hippocampal Slices
All experimental procedures were approved by the Animal Care and Use Committee of Nara Medical University (No. 12102). All experimental procedures were conducted in accordance with the guidelines for appropriate implementation of animal experiments. C57BL/6J mice (81 males) were used in the experiments. The mice were housed under a 12:12 light cycle with free access to food and water. Mice at 4–8 weeks of age were anesthetized with isoflurane and oxygen (0.05 V/V, administered via inhalation) and killed by decapitation. The brain was removed quickly and immersed in an ice-cold solution (composition in mmol/L: sucrose 230, KCl 2.5, NaHCO3 25, NaH2PO4 1.25, CaCl2 0.5, MgSO4 10, d-glucose 10) bubbled with 95% O2/5% CO2. Horizontal slices of the hippocampal formation and adjacent cortices were cut at a 350-µm thickness in the above solution using a vibratome (Vibratome 1000 Plus 102, Pelco International, Redding, CA, USA). The slices were then incubated in a standard artificial cerebrospinal fluid (aCSF, composition in mmol/L: NaCl 125, KCl 2.5, NaHCO3 25, NaH2PO4 1.25, CaCl2 2.0, MgCl2 1.0, d-glucose 10) bubbled with the same mixed gas at 32 °C for at least 1 h, and then maintained in the aCSF at 27 °C. Three hippocampal slices were obtained per individual animal and used for experimentation; thus, N = 12 consists of at least four separate animals.
Patch-Clamp Recording
Individual slices were placed in an 800 µL recording chamber that was continuously perfused with the gas-saturated aCSF at a flow rate of 2.0 mL/min. The temperature was maintained between 31 and 33 °C by a regulated heater connected to the inflow. The recording chamber was mounted on a BX50WI upright microscope (Olympus, Tokyo, Japan) equipped with infrared differential interference contrast (IR-DIC) and epifluorescence imaging apparatuses. Whole-cell voltage-clamp recordings were made from the soma of visually identified CA1 pyramidal cells using an EPC-9 patch-clamp amplifier (Heka, Lambrecht/Pfalz, Germany). The holding potential was set to − 70 mV. Patch pipettes were constructed from thick-walled borosilicate glass capillaries and filled with an internal solution containing (mmol/L): Cs-gluconate 141, CsCl 4.0, MgCl2 2.0, HEPES 10.0, Mg-ATP 2.0, Na-GTP 0.3, EGTA 0.2, pH 7.25 with CsOH. Pipette resistance was 2.5–3.5 MΩ. Whole-cell recordings were rejected if access resistance was greater than 20 MΩ. To isolate glutamatergic excitatory postsynaptic currents (EPSCs), all recordings were conducted in aCSF supplemented with the GABAA and GABAB antagonist picrotoxin (50 µmol/L).
Simulating Ischemia and Postconditioning in Brain Slices
We simulated severe brain ischemia by exposing slices to a solution in which glucose and oxygen were replaced with sucrose and nitrogen. Reperfusion for 20 min was performed after 7.5 min of ischemia. Ischemic postconditioning (PostC) was started 30 s after 7.5 min of anoxia and consisted of 3 anoxic perfusions of 15 s separated by non-anoxic reperfusion of 15 s. To estimate the time course of dissolved oxygen levels in the recording chamber, O2 partial pressure () of the chamber solution was measured using a Klerk electrode. When the anoxic perfusion started, the began to lower rapidly, and then approached a minimum value quasi-exponentially. Six minutes (360 s) after the onset of anoxic perfusion, the was lower than 10% of the pre-anoxic oxygenated solution value. After anoxia, the recovery of appeared to be a mirror image of reduction during anoxic perfusion. 3 min (180 s) after the anoxia, the recovered to 90% of the pre-anoxic level. The PostC procedure arrested the recovery at about 40–50% of the pre-anoxic level and retarded the subsequent recovery for about 90 s. In our previous study (Yokoyama et al. 2019) that utilized the same protocols as the present study, we found that a surge of synaptic glutamate release occurred during the immediate-early reperfusion period, and that the cumulative occurrence of synaptic glutamate release is positively correlated with the number of neurons that died during the anoxia/reperfusion period. We have also demonstrated that the ischemic PostC, as well as administration diazoxide (DZX) after the anoxic perfusion, significantly suppress the reperfusion surge in glutamate release. Therefore, these protocols are suitable for simulating ischemia and PostC. Reperfusion lasted for 20 min after anoxia PostC. DZX, NMDA, DL-AP5, 5-hydroxydecanoate (5-HD), and cyclosporine A (CsA) were purchased from Sigma-Aldrich, and picrotoxin was purchased from Wako Pure Chemical.
Perfusion Protocols
We examined the effects of ischemic PostC and chemical PostC using DZX (500 µmol/L; the concentration for maximum neuroprotective effect, Nakagawa et al. 2002) on NMDAR currents, cytosolic Ca2+ concentrations, and mitochondrial membrane potentials, and tested whether the application of 5-HD (200 µmol/L with reference to previous studies Liang et al. 2005; Pain et al. 2000) blocks these effects. We randomly assigned mouse hippocampal slices to the following groups (Fig. 1): (1) control group (54 slices from 26 animals: 6 ± 0.2 weeks): the slices were exposed to 7.5 min of anoxia and reperfusion with aCSF for 20 min; (2) PostC group (41 slices from 22 animals: 6 ± 0.2 weeks): after 7.5 min of anoxia and 30 s of reperfusion, the slices were exposed to the PostC procedure and then reperfused with aCSF; (3) DZX group (22 slices from 11 animals: 6 ± 0.3 weeks): after 7.5 min of anoxia, the slices were perfused with aCSF containing DZX for 10 min and then with normal aCSF for 10 min; (4) PostC and 5-HD group (10 slices from 4 animals: 6 ± 0.3 weeks): both normal and glucose-free aCSFs contained 5-HD throughout the recording period with the same anoxia/reperfusion schedule as the PostC group; (5) PostC and CsA group (11 slices from 7 animals: 6 ± 0.5 weeks): after 5 min normal perfusion, slices were perfused with CsA containing normal or glucose-free aCSF using an the same anoxia/reperfusion schedule as the PostC group.
Fig. 1.
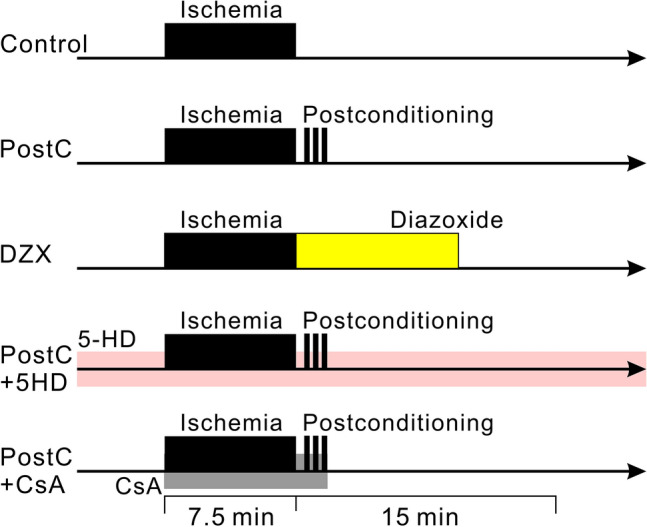
Diagrams representing the time schedules of ischemia and drug administration for each perfusion protocol. In each protocol, data were collected for 25 min, from 5 min before, and 20 min after anoxia. The black bands indicate the anoxic period. Yellow, pink, and gray bands indicate the administration of diazoxide, 5-HD, cyclosporine A into the aCSF, respectively
Recording of Whole-Cell Current Responses to NMDA Application
To assess the sensitivity of NMDAR, whole-cell current responses to NMDA application were recorded. NMDA (5 µmol/L) was puffed to the cell body for 80–160 ms with a micropipette similar to that used for whole-cell recording. To reduce Mg2+ blocking of NMDAR channels, the neuron was voltage clamped to a holding potential of − 55 mV during the pre- (1 s) and post-stimulation period (6 s). Experiments were performed over 30–35 min periods, where NMDAR current recordings were made every 30 s.
Fluorometric Assessment of Cytosolic Ca2+ Changes
To assess cytosolic changes in [Ca2+], Fura-2 fluorescence signals of whole-cell voltage-clamped pyramidal cells were measured by adding 15 µmol/L Fura-2 (Dojindo, Kumamoto, Japan) to the pipette solution. Fura-2 was excited every 10 s at 340 nm and 380 nm using a fast-switching multi-wavelength illumination system (Lambda DG-4, Sutter Instrument, CA, USA). The fluorescent emission was long pass filtered at 510 nm, and a 500 nm dichroic mirror was used. The image was acquired using a × 40 water-immersion objective lens (LUMPlanFI/IR, Olympus, Japan) and a CCD camera (CoolSNAP EZ, Photometrics, AZ, USA). The illumination and image acquisition were controlled with MetaMorph software (Molecular Devices, CA, USA). A circular area (5 µm diameter) with maximum fluorescence intensity located near the center of the soma was set as the region of interest (ROI). The ratio of mean fluorescence intensity (340 nm excitation/380 nm excitation) in the ROI was calculated.
Fluorometric Assessment of the Mitochondrial Membrane Potential
To assess the mitochondrial membrane potential, a fluorescent dye exhibiting a membrane potential-dependent shift in emission wavelength, JC1 (Cayman Chemical, MI, USA), was loaded to the cytosol through the patch pipette. The patch pipette was tip filled with dye-free internal solution, and then back filled with dye-containing internal solution (2.0 µmol/L) just before use. The J-aggregated state (red fluorescence) of JC1 was excited at 548 nm with a 580 nm dichroic mirror, and fluorescence emission was long pass filtered at 590 nm. The monomeric state (green fluorescence) of JC1 was excited at 477 nm with a 500 nm dichroic mirror, and fluorescence emission was band pass filtered between 515 and 565 nm. Fluorescence measurements were conducted at 30 s intervals using the same equipment as that used for Fura-2. Since red fluorescence was distributed eccentrically around the nucleus, which was frequently in a crescent formation, the ROI was defined as a hand drawn polygonal area covering the region of high red fluorescence. The ratio of mean fluorescence intensity (green/red) in the ROI was calculated. Mitochondrial depolarization-induced JC1 fluorescence changes were confirmed by administering an uncoupler of mitochondrial oxidative phosphorylation, 10 µmol/L carbonilcyanide p-trifluoromethoxyphenylhydrazone (FCCP).
Statistical Analysis
For comparisons of NMDA-induced current amplitudes and fluorescence ratios among groups, each experimental value was expressed as a percentage relative to the mean value observed during the 5-min pre-ischemia period for each pyramidal cell. Wilcoxon rank-sum tests are applied for the data which were not normally distributed. Error bars depicted in each dotted graph or sequential line plot indicate SDs of the percentages. The percentage data were analyzed using a Kruskal–Wallis test followed by Dunn’s multiple comparisons test. Sample size and power calculations based on previous data were performed using an effect size of 35%, power of 0.8, and α 0.05. We planned to perform at least five experiments in each group. Significant effects were further tested with a post hoc multiple comparison test (Holm–Šídák method). Significance was set at p < 0.05. The results of the tests for normality and variance heterogeneity were described as Supplementary Table.
Results
Postconditioning Silences NMDAR Currents After Anoxia
To test the effects of ischemic PostC and chemical PostC on NMDAR currents, we randomly assigned mouse hippocampal slices to the following groups (Fig. 1). The puff application of NMDA to CA1 pyramidal cells caused an inward current composed of a fast falling phase followed by a slow decay phase, which lasted several seconds (Fig. 2a). Since the waveform of the NMDA-induced currents showed no apparent change throughout the anoxic period, we estimated gross NMDAR conductance by measuring the peak amplitude of the NMDA-induced currents. Both ischemic and chemical PostC reduced NMDAR currents during the early reperfusion period. We compared the change in NMDAR current amplitudes during the period from 10 to 20 min after anoxia among the control, PostC and CsA + PostC groups (Fig. 2). NMDA-induced currents during the early reperfusion period were decreased to a greater degree in the PostC group than in the control group [PostC: N = 9, control: N = 10, r(3) = 0.48, p < 0.05, Fig. 2b]. NMDA-induced currents in the DZX group were reduced compared to control [N = 6, r(3) = 0.74, p < 0.05, Fig. 2b). Furthermore, NMDA-induced currents in the PostC group were lower than in the CsA + PostC group [N = 11, r(3) = 0.36, p < 0.05, Fig. 2b). These results indicate that PostC, as well as the application of the mito-KATP channel opener DZX, silenced gross NMDAR conductance during the early reperfusion period, and that the mPTP inhibitor CsA dissipated the suppressive effect of PostC on NMDAR conductance.
Fig. 2.
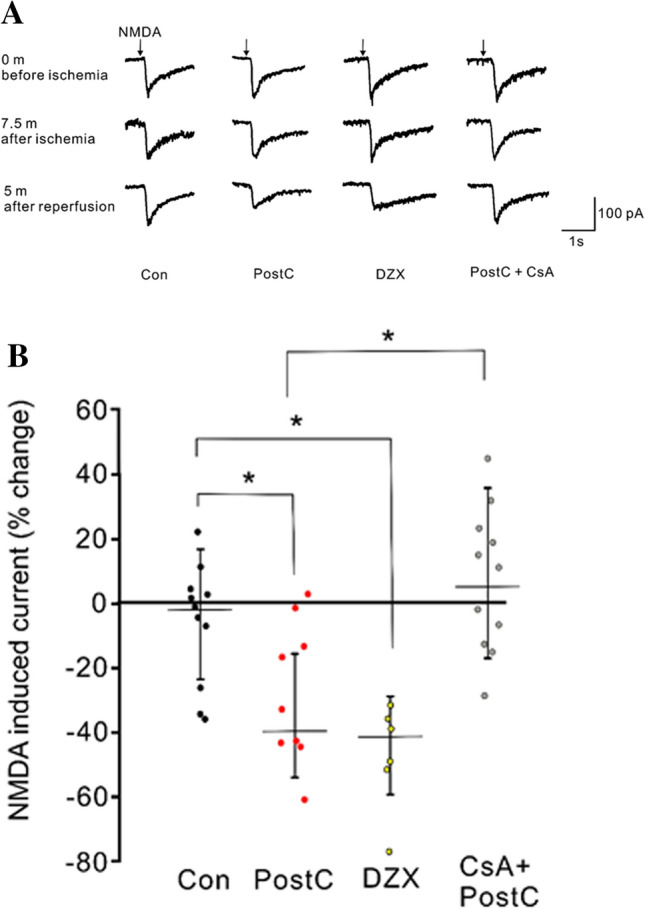
Effects of ischemic postconditioning and diazoxide administration after anoxia on NMDA-induced currents recorded from voltage-clamped hippocampal pyramidal neurons. a Typical traces of NMDA-induced currents for Control, PostC, DZX, and PostC + CsA groups before anoxia, at the end of anoxia and 5 min after anoxia. Inward currents are represented as downward deflections. For the PostC group, the NMDA-induced current was reduced with no waveform modification 5 min after anoxia. For the Control group, no apparent change in NMDA-induced current was observed. b Dotted graph presenting the change in median peak amplitude of NMDA-induced current during the period from 10 to 20 min after anoxia for the Control, PostC, DZX, and CsA + PostC groups. Values are given as percent change relative to the average peak amplitude during the 5 min preceding anoxia. Asterisks indicate significant differences by post hoc pairwise comparisons (p < 0.05)
Postconditioning Suppresses Cytosolic Ca2+ Increases via Extracellular Influx
To assess the involvement of cytosolic [Ca2+] in PostC-induced neuroprotection, cytosolic [Ca2+] changes were examined in the control, PostC, DZX, and 5-HD + PostC groups. During the anoxic period, the Fura-2 ratio gradually increased, which indicates an increase in cytosolic [Ca2+]. Cytosolic [Ca2+] continued to rise until 5 min after anoxia and gradually decreased thereafter (Supplementary Fig. 1; Fig. 3a). We analyzed the changes in Fura-2 ratios during the period from 5 to 10 min after anoxia among the groups. In the PostC and DZX groups, the % change in Fura-2 ratio was significantly lower than in the control group [Con: N = 14, PostC: N = 10, DZX: N = 11, Con vs PostC; r(3) = 0.72, p < 0.05, Con vs DZX; r(3) = 0.72, p < 0.05 Fig. 3a, b]. In addition, the % change in Fura-2 ratio for the 5-HD + PostC group was significantly higher than the PostC group [5-HD + PostC: N = 10, r(3) = 0.87, p < 0.05, Fig. 3a, b]. These results indicate that ischemic PostC and chemical PostC suppress cytosolic [Ca2+] elevation during the early reperfusion period, and that blocking the mito-KATP channel prevents the ability of ischemic PostC and to suppress cytosolic [Ca2+] elevation.
Fig. 3.

Effects of ischemic postconditioning and diazoxide administration after anoxia on cytosolic Ca2+ concentrations. a Time course of change in Fura-2 ratio during the pre-anoxia, anoxia, and reperfusion periods. The percentages are calculated relative to the average values observed during the 5-min pre-anoxic period. The red horizontal bar indicates the reperfusion period. The pink band represents the period used for statistical analysis. b Dotted graph of median percent change in Fura-2 ratio during 7.5 to 12.5 min after 7.5 min of anoxia (pink band in b). Asterisks indicate significant differences by post hoc pairwise comparisons (p < 0.05)
Furthermore, we determined whether the elevation in cytosolic [Ca2+] during the anoxic period was due to release from cytosolic Ca2+ stores or influx from the extracellular fluid. To examine this, we evaluated the Fura-2 ratio during the anoxic/reperfusion period using Ca2+-free aCSF. With Ca2+-free aCSFs perfusion, the elevation in Fura-2 ratio during the late anoxia and early reperfusion period was less prominent than in the presence of Ca2+-containing aCSF, and the PostC procedure showed no detectable effect (Fig. 4a). The change in Fura-2 ratio during the period from 5 to 10 min after anoxia in the control group perfused with Ca2+-containing aCSFs was higher than in the control and PostC groups perfused with Ca2+-free aCSFs [Con: N = 14, Con (Ca0): N = 14, PostC (Ca0): N = 15, Con vs Con(Ca0); r(2) = 0.79, p < 0.05, Con vs PostC (Ca0); r(2) = 0.78, p < 0.05, Fig. 4b]. There was no significant difference in the change of Fura-2 ratio during the period from 5 to 10 min after anoxia between the control and PostC groups perfused with Ca2+-free aCSFs. These results indicate that the prominent elevation in cytosolic [Ca2+] observed during the anoxic period was mainly due to influx from the extracellular fluid.
Fig. 4.
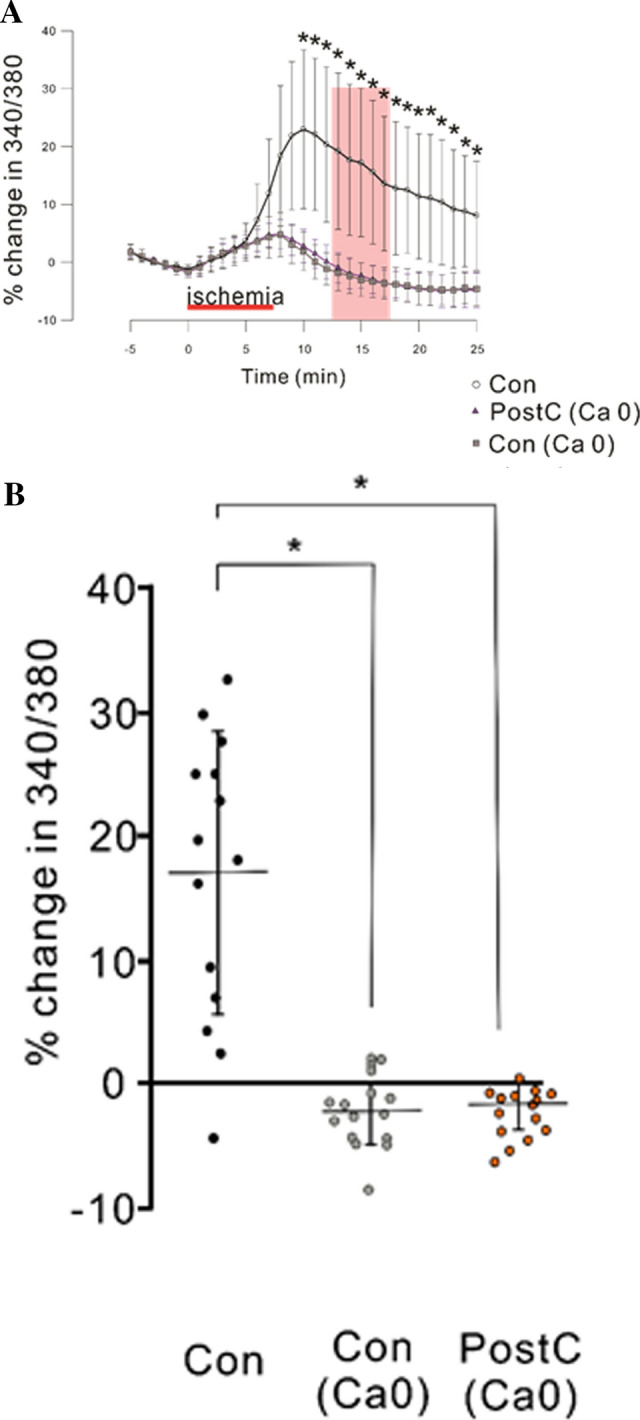
Effect of removal of extracellular Ca2+ on cytosolic Ca2+ concentrations. “Ca0” denotes the exclusion of Ca2+ from normal and glucose-free aCSF. The data for Con are the same as those shown in Fig. 3. a Time course of change in Fura-2 ratio during the pre-anoxia, anoxia, and reperfusion periods. The percentages are calculated relative to the average values observed during the 5-min pre-anoxic period. Red horizontal bar indicates the reperfusion period. Pink band represents the period used for statistical analysis. b Dotted graph of median percent change in Fura-2 ratio during 5 to 10 min after 7.5 min of anoxia (pink band in b). Asterisks indicate significant differences by post hoc pairwise comparisons (p < 0.05)
Activation of NMDA Receptor Mediates Elevation in Cytosolic Ca2+ Concentration
To confirm the involvement of NMDAR in cytosolic [Ca2+] elevation, we examined the effects of NMDA blocking with a NMDA competitive inhibitor (DL-AP5, 5 µmol/L) on changes in cytosolic [Ca2+] during anoxia. The addition of DL-AP5 to aCSFs suppressed the elevation in the Fura-2 ratio during anoxia (Fig. 5a). The Fura-2 ratio during the period from 5 to 10 min after anoxia in the control group perfused with DL-AP5-containing aCSFs was significantly lower than in the control group perfused with aCSFs without DL-AP5 [Con: N = 11, Con (NMDAR block): N = 9, r(2) = 0.75, p < 0.05, Fig. 5b].
Fig. 5.
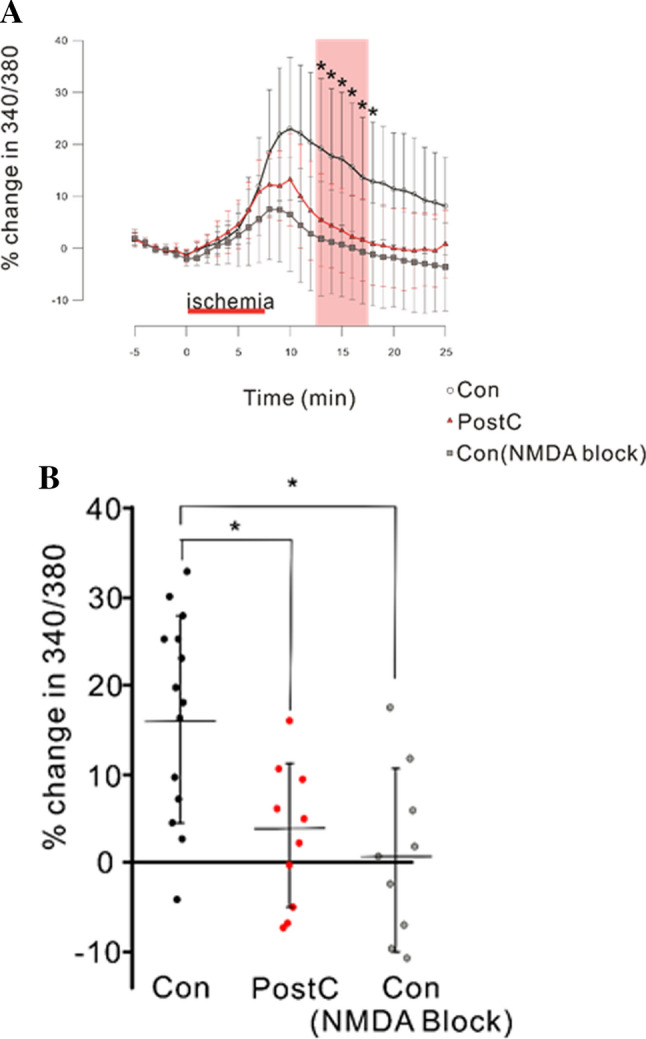
Effect of NMDAR blocking on cytosolic Ca2+ concentrations. “NMDA block” denotes that both the normal and glucose-free aCSFs contained a NMDAR blocker, DL-AP5 (5 µmol/L). The data for Con and PostC are the same as those shown in Fig. 3. a Time course of change in Fura-2 340/380 ratio during the pre-ischemia, ischemic, and reperfusion periods. The percentages are calculated against the averaged value for 5 min before ischemia. Red horizontal bar indicates ischemic perfusion period. Pink band represents the period for statistical analysis. b Dotted graph of percent change in Fura-2 340/380 ratio, median data from 5 to 10 min after 7.5 min of anoxia (pink band in a). Asterisks indicate significant differences in post hoc pairwise comparisons (p < 0.05)
Mitochondria Temporally Depolarize During Ischemic PostC and Chemical PostC with DZX
To determine whether ischemic PostC and chemical PostC with DZX depolarize the mitochondrial inner membrane after anoxia, changes in the mitochondrial membrane potential were examined in the control, PostC, and DZX groups. Microphotographs of a JC1-loaded pyramidal cell are showed at Supplementary Fig. 2. Application of an uncoupler of mitochondrial oxidative phosphorylation (FCCP) caused a remarkable increase in the green/red fluorescence ratio, which represents depolarization of the mitochondrial membrane potential (Fig. 6a). The green/red ratio began to increase at 5 min after the onset of anoxia and continued to rise until 3 min after anoxia, and then declined in the three groups (Fig. 6b). We compared % change in green/red ratio during the period from 2 to 3 min after anoxia among the three groups. Green/red ratios for the PostC and DZX groups were significantly higher than in the control group [Con: N = 7, PostC: N = 7, DZX: N = 5, Con vs PostC; r(2) = 0.70, p < 0.05, Con vs DZX; r(2) = 0.68, p < 0.05], and no significant difference was observed between the PostC and DZX groups (Fig. 6c). This result indicates that the mitochondrial membrane potential was more depolarized in the PostC and DZX groups than the control group during the early reperfusion period. In other words, both ischemic and DZX PostC prevented the mitochondrial inner membrane from rapid depolarization to the normal matrix-negative state after anoxia.
Fig. 6.

Changes in the mitochondrial membrane potential estimated with JC1 fluorescence during the pre-anoxia, anoxic, and reperfusion periods. a JC1 ratio (green/red) change in response to the administration of a protonophoric uncoupler, FCCP. A surging elevation in green/red fluorescent ratio following FCCP administration is observed, which indicates the depolarization of the mitochondrial inner membrane. b Time course of change in JC1 green/red ratio during the pre-anoxia, anoxic, and reperfusion periods. The percentages are calculated relative to the averaged values observed during the 5 min pre-anoxic period. Red horizontal bar indicates the reperfusion period. Pink band represents the period used for statistical analysis. c Dotted graph of percent change in JC1 green/red ratio, median data from the 2 to 3 min reperfusion period (pink band in c). Asterisks indicate significant differences in post hoc pairwise comparisons (p < 0.05)
Discussion
In the present study, both ischemic PostC and chemical PostC with DZX reduced gross NMDAR conductance during the early reperfusion period, which resembles the innate ability of neurons in western colored turtles to resist hypoxic conditions. In our experimental model system using hippocampal slices, we found that NMDAR activation played a crucial role in anoxia-induced elevation of cytosolic [Ca2+], and that ischemic and chemical PostC potently suppressed the elevation in cytosolic [Ca2+] after anoxia. Furthermore, we confirmed that ischemic and chemical PostC depolarized the mitochondrial inner membrane during the early reperfusion period, which underscores the importance of the electrical potential of mitochondrial membrane in PostC mechanisms.
It is well known that excessive accumulation of cytosolic Ca2+ caused by anoxia is the ultimate trigger for subsequent cellular injury through the activation of many enzymes (proteinases, phospholipases, nitric oxide synthases, and others) (Benveniste et al. 1984; Kristian and Siesjo 1998). In this experimental system, we observed that cytosolic [Ca2+] started to rise after ischemic perfusion, did not cease to rise after anoxia, and remained at levels greater than the pre-anoxic period for 20 min. This prolonged cytosolic [Ca2+] elevation may represent the essential nature of anoxia-induced cytosolic [Ca2+] elevation as a triggering event of catastrophic consequences, and suggests the existence of a anoxia-specific mechanism for maintaining high levels of cytosolic [Ca2+]. Since the removal of Ca2+ from aCSFs suppressed most of the prolonged cytosolic [Ca2+] elevation in this experiment, the main source of an increase in cytosolic [Ca2+] appears to be Ca2+ influx from the extracellular fluid through voltage-dependent Ca2+ channels and NMDA receptors. Furthermore, in this experiment, the blockade of NMDAR strongly suppressed the prolonged [Ca2+] elevation after anoxia. Therefore, it is likely that NMDAR functions as the primal gate for Ca2+ influx during the early reperfusion period.
In the present experiment, we found that ischemic PostC and chemical PostC with DZX reduced the amplitude of whole-cell inward current induced by NMDA puff applied to the cell body. The observed current may originate in the activation of extra- and presynaptic receptors as well as postsynaptic receptors. This result indicates that the whole-cell conductance of NMDAR channels is downregulated by an intracellular mechanism. Zhang suggested that NMDAR mediates PostC-induced neuroprotection (Zhang et al. 2015). We also confirmed that ischemic PostC and DZX PostC suppressed cytosolic [Ca2+] elevation after anoxia. Our results suggest that the downregulated NMDAR conductance disrupts the positive-feedback loop for Ca2+ influx and suppresses the prolonged cytosolic [Ca2+] elevation after anoxia.
Hawrych and Buck suggested that a modest elevation in cytosolic [Ca2+], which is released through mPTP in response to anoxia, caused the downregulation of NMDAR conductance in turtle neurons (Hawrysh and Buck 2013). Since we observed that cytosolic [Ca2+] began to rise after ischemia and continued to increase after reperfusion, it seems unlikely that the elevation in cytosolic [Ca2+] was caused by the ischemic or chemical PostC rather than the I/R schedule alone. A possible explanation is that a Ca2+-dependent mechanism that functions to reduce NMDAR conductance may be disturbed by the control I/R schedule, whereas ischemic and chemical PostCs permit the mechanism to function after reperfusion.
It has been demonstrated that the opening of mito-KATP channels is involved in ischemic PostC (Robin et al. 2011; Yokoyama et al. 2019) and in chemical PostC using a volatile anesthetic, isoflurane (Jiang et al. 2006; Lee et al. 2008). In the present experiment, we found that the mito-KATP channel opener DZX, when applied after anoxia, reduced NMDAR conductance, and that the mito-KATP channel blocker 5-HD blocked the ischemic PostC effect reducing NMDAR conductance. Another important observation was that CsA, which inhibits mPTP opening, also blocked the ischemic PostC effect reducing NMDAR conductance. These results indicate that the opening of mito-KATP channels and mPTP mediate the process that promotes the reduction in NMDAR conductance. Sun et al. reported that the inhibition of mPTP opening by CsA suppressed I/R induced brain damage, and that the application of the mPTP opener atractyloside blocked the neuroprotective effects of ischemic PostC (Sun et al. 2012). These previous results appear to contradict the present finding. This discrepancy may be related to the mode of mPTP opening in the experiments. The low-conductance mode of mPTP opening may intermittently occur under physiological conditions for cellular homeostasis, whereas the high-conductance mode of mPTP opening is likely to induce a catastrophic process of cell injury (Brenner and Moulin 2012). Therefore, the previous results might be due to inhibition or activation of the high-conductance mode of mPTP opening. Moreover, it is likely that the low-conductance mode of mPTP opening prevents high-conductance mode opening and served to reduce NMDAR conductance in the present experiment. It is possible that the high-conductance mode of mPTP opening induces excessive elevation in cytosolic Ca2+ and disturbs the reduction in NMDAR conductance. It has been reported that DZX dose dependently inhibits succinate dehydrogenase (complex II) activity to reduce succinate oxidation in cardiac myocyte (Dzeja et al. 2003; Hanley et al. 2002; Lim et al. 2002). Since DZX may inhibit sufficiently succinate dehydrogenase activity in this study, the inhibited succinate dehydrogenase activity can bring about suppressive effect of DZX. In addition, it has been shown that DZX inhibits succinate dehydrogenase activity without changing the electrical potential of mitochondrial inner membrane, and that metabolized 5-HD provides a substrate for β oxidation (Drose et al. 2006; Hanley et al. 2002). Whether the proposition that mito-KATP channels are not involved in the actions of diazoxide and 5-HD is applicable to brain neuronal cells remains to be determined.
In this study, we demonstrated that both ischemic PostC and chemical PostC with DZX temporally depolarized the mitochondrial inner membrane after anoxia, which suggests the suppression of a fast restoration of a matrix-negative membrane potential from the depolarized state due to the anoxia-induced cessation of proton pumping although the effect of PostC and DZX in the presence of 5-HD is unclear. We propose a hypothetical mechanism for protection against the large-conductance mode of mPTP opening by the opening of mito-KATP channels. The mitochondrial Ca2+ uniporter (MCU) together with mPTP appears to function as essential components of this mechanism. MCU is a Ca2+ selective channel present on the mitochondrial inner membrane, and the net Ca2+ transfer through the MCU requires an electrochemical driving force generated by the matrix-negative electrical potential (ΔΨ) and [Ca2+] gradient across the mitochondrial inner membrane. Under normal physiological conditions, the uptake of Ca2+ through the MCU is believed to be counter-balanced by release through mitochondrial Na+–Ca2+ exchangers. At the end of ischemia, the cytosolic [Ca2+] has accumulated to high levels. Since the driving force for Ca2+ (i.e. ΔΨ) has been lost, the matrix [Ca2+] is expected to be roughly equivalent to that of the cytosol. As and glucose levels normalize during reperfusion, mitochondrial respiration begins to polarize the inner membrane and produce ATP. The restored matrix-negative electrical potential drives Ca2+ uptake into the matrix through the MCU. Since the cell membrane remains depolarized at this time point, due to accumulated extracellular glutamate, Ca2+ continues to flow through NMDA receptors to the cytosol and subsequently transfers into the matrix by ΔΨ, which ultimately results in excessive Ca2+ accumulation in the matrix and mPTP opening. The opening of mito-KATP channels by ischemic or chemical PostC causes a depolarization of the mitochondrial membrane potential, as was observed herein during the early period of reperfusion. This reduces the driving force for Ca2+ influx, and the excessive Ca2+ accumulation in the matrix is abrogated, which avoids the high-conductance mode of mPTP opening (Fig. 7).
Fig. 7.

Possible mechanism of ischemic PostC. Ischemic PostC suppresses Ca2+ influx into cytoplasm and causes neuroprotection by reducing NMDAR conductance through an mPTP low-conductance mode opening. Furthermore, the opening of mito-KATP channels by ischemic PostC causes a depolarization of mitochondrial membrane potential (ΔΨ). Then, the driving force for Ca2+ influx via MCU is lowered, which avoids mPTP form the high-conductance mode opening
In our considerations of mPTP opening, we implicitly presumed that the Ca2+ concentration needed for low-conductance mode mPTP opening might be lower than for high-conductance mode opening; however, the detailed properties of the low-conductance mode of mPTP opening and the involvement of MCU function remain to be clarified. Recently, Urbani et al. reported that an artificial channel composed of F-ATP synthase can reproduce the phenomena of mPTP in planar lipid bilayers, and suggested that the molecular substrate of mPTP is the F-ATP synthase oligomer (Urbani et al. 2019). Mitochondrial potassium transport such as K+ uniporter and K+/H+ antiporter is also associated with matrix volume homeostasis and cell signaling as well as mito-KATP channel (Brierley 1976; Garlid et al. 2003; Nowikovsky et al. 2009; Szabo et al. 2012). However, the beneficial effect of mitochondrial K+ uniporter and K+/H+ antiporter for PostC has not been elucidated. mPTP opening and cell survival may also depend on additional factors including Bax for Kv1.3 channels.
Understanding the molecular nature of mPTP may propel further studies to elucidate the mechanism and function of the low-conductance mode of mPTP opening. Further additional experimental groups to prove additive and synergistic effects for the mechanism, including postC + DZX to validate whether postC works through mito-KATP channel opening, DCX + CsA to assess mPTP opening under conditions of mito-KATP channel opening, and postC + DL-AP5 to validate that postC works through NMDAR opening could allow to understand the precise mechanism of postconditioning. Further studies, including a pathological and molecular biological approach, will be required to prove the precise mechanism underlying the involvement of mPTP in PostC and its translation into clinical practice.
Conclusions
Ischemic PostC suppresses Ca2+ influx into the cytoplasm by reducing NMDAR conductance through mPTP opening. Furthermore, ischemic PostC depolarized the mitochondrial inner membrane during the early reperfusion period, indicating the importance of the electrical potential of mitochondrial membranes in PostC mechanisms.
Electronic supplementary material
Below is the link to the electronic supplementary material.
(TIF 126158 kb) Supplementary Fig. 1 Representative microphotographs showing changes in Fura-2 emissions resulting from excitation at 340 and 380 nm for the control group. The elevation in the Fura-2 ratio (340/380 ratio) represents an increase in cytosolic Ca2+ concentration. Scale bar 10 µm
(TIF 48504 kb) Supplementary Fig. 2 Representative microphotographs of JC1 fluorescence in a hippocampal slice for the control group. Left: infrared differential interference contrast image; Middle: green fluorescent image excited at 477 nm; Right: red fluorescent image excited at 548 nm. Scale bar 10 µm
Acknowledgements
None.
Author Contributions
Conception and design or analysis and interpretation of data, or both; YM, IN, YO. Drafting of the manuscript or revising it critically for important intellectual content; YM, IN, YO, SY, TF, YS, HN. Final approval of the manuscript submitted; IN, YS, HN.
Funding
This study was supported by JSPS KAKENHI Grant Number JP16K10735.
Data Availability
The datasets of the current study are available upon request with no restriction.
Compliance with Ethical Standards
Conflicts of interest
The authors declare that they have no conflict of interest.
Footnotes
Publisher's Note
Springer Nature remains neutral with regard to jurisdictional claims in published maps and institutional affiliations.
References
- Benveniste H, Drejer J, Schousboe A, Diemer NH (1984) Elevation of the extracellular concentrations of glutamate and aspartate in rat hippocampus during transient cerebral ischemia monitored by intracerebral microdialysis. J Neurochem 43(5):1369–1374 [DOI] [PubMed] [Google Scholar]
- Bickler PE, Donohoe PH, Buck LT (2000) Hypoxia-induced silencing of NMDA receptors in turtle neurons. J Neurosci 20(10):3522–3528 [DOI] [PMC free article] [PubMed] [Google Scholar]
- Brenner C, Moulin M (2012) Physiological roles of the permeability transition pore. Circ Res 111(9):1237–1247 [DOI] [PubMed] [Google Scholar]
- Brierley GP (1976) The uptake and extrusion of monovalent cations by isolated heart mitochondria. Mol Cell Biochem 10(1):41–63 [DOI] [PubMed] [Google Scholar]
- Carden DL, Granger DN (2000) Pathophysiology of ischaemia–reperfusion injury. J Pathol 190(3):255–266 [DOI] [PubMed] [Google Scholar]
- Drose S, Brandt U, Hanley PJ (2006) K+-independent actions of diazoxide question the role of inner membrane KATP channels in mitochondrial cytoprotective signaling. J Biol Chem 281(33):23733–23739 [DOI] [PubMed] [Google Scholar]
- Dzeja PP, Bast P, Ozcan C, Valverde A, Holmuhamedov EL, Van Wylen DG, Terzic A (2003) Targeting nucleotide-requiring enzymes: implications for diazoxide-induced cardioprotection. Am J Physiol Heart Circ Physiol 284(4):H1048–H1056 [DOI] [PubMed] [Google Scholar]
- Garlid KD, Dos Santos P, Xie ZJ, Costa AD, Paucek P (2003) Mitochondrial potassium transport: the role of the mitochondrial ATP-sensitive K(+) channel in cardiac function and cardioprotection. Biochim Biophys Acta 1606(1–3):1–21 [DOI] [PubMed] [Google Scholar]
- Hanley PJ, Mickel M, Loffler M, Brandt U, Daut J (2002) K(ATP) channel-independent targets of diazoxide and 5-hydroxydecanoate in the heart. J Physiol 542(Pt 3):735–741 [DOI] [PMC free article] [PubMed] [Google Scholar]
- Haworth RA, Hunter DR (1979) The Ca2+-induced membrane transition in mitochondria. II. Nature of the Ca2+ trigger site. Arch Biochem Biophys 195(2):460–467 [DOI] [PubMed] [Google Scholar]
- Hawrysh PJ, Buck LT (2013) Anoxia-mediated calcium release through the mitochondrial permeability transition pore silences NMDA receptor currents in turtle neurons. J Exp Biol 216(Pt 23):4375–4387 [DOI] [PubMed] [Google Scholar]
- Hunter DR, Haworth RA (1979a) The Ca2+-induced membrane transition in mitochondria. I. The protective mechanisms. Arch Biochem Biophys 195(2):453–459 [DOI] [PubMed] [Google Scholar]
- Hunter DR, Haworth RA (1979b) The Ca2+-induced membrane transition in mitochondria. III. Transitional Ca2+ release. Arch Biochem Biophys 195(2):468–477 [DOI] [PubMed] [Google Scholar]
- Jiang X, Shi E, Nakajima Y, Sato S (2006) Postconditioning, a series of brief interruptions of early reperfusion, prevents neurologic injury after spinal cord ischemia. Ann Surg 244(1):148–153 [DOI] [PMC free article] [PubMed] [Google Scholar]
- Kis B, Rajapakse NC, Snipes JA, Nagy K, Horiguchi T, Busija DW (2003) Diazoxide induces delayed pre-conditioning in cultured rat cortical neurons. J Neurochem 87(4):969–980 [DOI] [PubMed] [Google Scholar]
- Kitagawa K, Matsumoto M, Tagaya M, Hata R, Ueda H, Niinobe M, Handa N, Fukunaga R, Kimura K, Mikoshiba K et al (1990) ‘Ischemic tolerance’ phenomenon found in the brain. Brain Res 528(1):21–24 [DOI] [PubMed] [Google Scholar]
- Kristian T, Siesjo BK (1998) Calcium in ischemic cell death. Stroke J Cereb Circ 29(3):70 [DOI] [PubMed] [Google Scholar]
- Lee JJ, Li L, Jung HH, Zuo Z (2008) Postconditioning with isoflurane reduced ischemia-induced brain injury in rats. Anesthesiology 108(6):1055–1062 [DOI] [PMC free article] [PubMed] [Google Scholar]
- Liang HW, Xia Q, Bruce IC (2005) Reactive oxygen species mediate the neuroprotection conferred by a mitochondrial ATP-sensitive potassium channel opener during ischemia in the rat hippocampal slice. Brain Res 1042(2):169–175. 10.1016/j.brainres.2005.02.031 [DOI] [PubMed] [Google Scholar]
- Lim KH, Javadov SA, Das M, Clarke SJ, Suleiman MS, Halestrap AP (2002) The effects of ischaemic preconditioning, diazoxide and 5-hydroxydecanoate on rat heart mitochondrial volume and respiration. J Physiol 545(3):961–974 [DOI] [PMC free article] [PubMed] [Google Scholar]
- Mayor D, Tymianski M (2018) Neurotransmitters in the mediation of cerebral ischemic injury. Neuropharmacology 134(Pt B):178–188 [DOI] [PubMed] [Google Scholar]
- Nagai N, Yoshioka C, Ito Y, Funakami Y, Nishikawa H, Kawabata A (2015) Intravenous administration of cilostazol nanoparticles ameliorates acute ischemic stroke in a cerebral ischemia/reperfusion-induced injury model. Int J Mol Sci 16(12):29329–29344 [DOI] [PMC free article] [PubMed] [Google Scholar]
- Nakagawa I, Nakase H, Aketa S, Kamada Y, Yamashita M, Sakaki T (2002) ATP-dependent potassium channel mediates neuroprotection by chemical preconditioning with 3-nitropropionic acid in gerbil hippocampus. Neurosci Lett 320(1–2):33–36 [DOI] [PubMed] [Google Scholar]
- Nour M, Scalzo F, Liebeskind DS (2013) Ischemia–reperfusion injury in stroke. Interv Neurol 1(3–4):185–199 [DOI] [PMC free article] [PubMed] [Google Scholar]
- Nowikovsky K, Schweyen RJ, Bernardi P (2009) Pathophysiology of mitochondrial volume homeostasis: potassium transport and permeability transition. Biochim Biophys Acta 1787(5):345–350 [DOI] [PubMed] [Google Scholar]
- Pain T, Yang X-M, Critz SD, Yue Y, Nakano A, Liu GS, Heusch G, Cohen MV, Downey JM (2000) Opening of mitochondrial KATP channels triggers the preconditioned state by generating free radicals. Circ Res 87(6):460–466 [DOI] [PubMed]
- Robin E, Simerabet M, Hassoun SM, Adamczyk S, Tavernier B, Vallet B, Bordet R, Lebuffe G (2011) Postconditioning in focal cerebral ischemia: role of the mitochondrial ATP-dependent potassium channel. Brain Res 1375:137–146 [DOI] [PubMed] [Google Scholar]
- Sun J, Luan Q, Dong H, Song W, Xie K, Hou L, Xiong L (2012) Inhibition of mitochondrial permeability transition pore opening contributes to the neuroprotective effects of ischemic postconditioning in rats. Brain Res 1436:101–110 [DOI] [PubMed] [Google Scholar]
- Szabo I, Leanza L, Gulbins E, Zoratti M (2012) Physiology of potassium channels in the inner membrane of mitochondria. Pflugers Arch 463(2):231–246 [DOI] [PubMed] [Google Scholar]
- Szydlowska K, Tymianski M (2010) Calcium, ischemia and excitotoxicity. Cell Calcium 47(2):122–129 [DOI] [PubMed] [Google Scholar]
- Urbani A, Giorgio V, Carrer A, Franchin C, Arrigoni G, Jiko C, Abe K, Maeda S, Shinzawa-Itoh K, Bogers JFM, McMillan DGG, Gerle C, Szabo I, Bernardi P (2019) Purified F-ATP synthase forms a Ca(2+)-dependent high-conductance channel matching the mitochondrial permeability transition pore. Nat Commun 10(1):4341 [DOI] [PMC free article] [PubMed] [Google Scholar]
- Wang JY, Shen J, Gao Q, Ye ZG, Yang SY, Liang HW, Bruce IC, Luo BY, Xia Q (2008) Ischemic postconditioning protects against global cerebral ischemia/reperfusion-induced injury in rats. Stroke J Cereb Circ 39(3):983–990 [DOI] [PubMed] [Google Scholar]
- Yin XH, Zhang QG, Miao B, Zhang GY (2005) Neuroprotective effects of preconditioning ischaemia on ischaemic brain injury through inhibition of mixed-lineage kinase 3 via NMDA receptor-mediated Akt1 activation. J Neurochem 93(4):1021–1029 [DOI] [PubMed] [Google Scholar]
- Yokoyama S, Nakagawa I, Ogawa Y, Morisaki Y, Motoyama Y, Park YS, Saito Y, Nakase H (2019) Ischemic postconditioning prevents surge of presynaptic glutamate release by activating mitochondrial ATP-dependent potassium channels in the mouse hippocampus. PLoS ONE 14(4):e0215104 [DOI] [PMC free article] [PubMed] [Google Scholar]
- Zhao H, Sapolsky RM, Steinberg GK (2006) Interrupting reperfusion as a stroke therapy: ischemic postconditioning reduces infarct size after focal ischemia in rats. J Cereb Blood Flow Metab Off J Int Soc Cereb Blood Flow Metab 26(9):1114–1121 [DOI] [PubMed] [Google Scholar]
- Zhao H (2009) Ischemic postconditioning as a novel avenue to protect against brain injury after stroke. J Cereb Blood Flow Metab Off J Int Soc Cereb Blood Flow Metab 29(5):873–885 [DOI] [PMC free article] [PubMed] [Google Scholar]
- Zhao ZQ, Corvera JS, Halkos ME, Kerendi F, Wang NP, Guyton RA, Vinten-Johansen J (2003) Inhibition of myocardial injury by ischemic postconditioning during reperfusion: comparison with ischemic preconditioning. Am J Physiol Heart Circ Physiol 285(2):H579–H588 [DOI] [PubMed] [Google Scholar]
- Zhang X, Zhang Q, Tu J, Zhu Y, Yang F, Liu B, Brann D, Wang R (2015) Prosurvival NMDA 2A receptor signaling mediates postconditioning neuroprotection in the hippocampus. Hippocampus 25(3):286–296 [DOI] [PubMed] [Google Scholar]
Associated Data
This section collects any data citations, data availability statements, or supplementary materials included in this article.
Supplementary Materials
(TIF 126158 kb) Supplementary Fig. 1 Representative microphotographs showing changes in Fura-2 emissions resulting from excitation at 340 and 380 nm for the control group. The elevation in the Fura-2 ratio (340/380 ratio) represents an increase in cytosolic Ca2+ concentration. Scale bar 10 µm
(TIF 48504 kb) Supplementary Fig. 2 Representative microphotographs of JC1 fluorescence in a hippocampal slice for the control group. Left: infrared differential interference contrast image; Middle: green fluorescent image excited at 477 nm; Right: red fluorescent image excited at 548 nm. Scale bar 10 µm
Data Availability Statement
The datasets of the current study are available upon request with no restriction.