

Abstract
Objective:
Mucosal decongestion with nasal sprays is a common treatment for nasal airway obstruction. However, the impact of mucosal decongestion on nasal aerodynamics and the physiological mechanism of nasal airflow sensation are incompletely understood. The objective of this study is to compare nasal airflow patterns in nasal airway obstruction (NAO) patients with and without mucosal decongestion and non-decongested healthy subjects.
Study Design:
Cross-sectional study of a convenience sample.
Setting:
Academic tertiary medical center.
Methods:
Forty-five subjects were studied (15 non-decongested healthy subjects, 15 non-decongested NAO patients, and 15 decongested NAO patients). Three-dimensional models of the nasal anatomy were created from computed tomography scans. Steady-state simulations of airflow and heat transfer were conducted at 15 L/min inhalation rate using computational fluid dynamics.
Results:
In the narrow side of the nose, unilateral nasal resistance was similar in decongested NAO patients and non-decongested healthy subjects, but substantially higher in non-decongested NAO patients. The vertical airflow distribution within the nasal cavity (inferior vs. middle vs. superior) was also similar in decongested NAO patients and non-decongested healthy subjects, but non-decongested NAO patients had substantially less middle airflow. Mucosal cooling, quantified by the surface area where heat flux exceeds 50 W/m2, was significantly higher in decongested NAO patients than in non-decongested NAO patients.
Conclusion:
This pilot study suggests that mucosal decongestion improves objective measures of nasal airflow, which is consistent with improved subjective sensation of nasal patency after decongestion.
Keywords: Nasal airway obstruction, subjective nasal patency, nasal airflow sensation, mucosal decongestion, mucosal cooling, nasal resistance, intranasal airflow distribution, computational fluid dynamics, healthy subjects
INTRODUCTION
Nasal airflow aerodynamics is influenced by multiple factors, including anatomical structure, tissue inflammation, and mucosal engorgement. Changes in these factors can impact airspace cross-sectional area, nasal resistance to airflow, regional distribution of airflow, total flow, and mucosal cooling, among other variables. When these aerodynamic variables deviate from normative ranges, patients can develop symptoms of nasal airway obstruction (NAO), either acutely as in the common cold, or chronically due to other conditions like rhinitis, septal deviations, or turbinate hypertrophy. NAO is among the most common complaints in otolaryngology clinics, costing over $5 billion annually.1 NAO has surgical and medical interventions, with mucosal decongestants being the most common medical treatment, especially in acute cases. Nasal decongestants deliver a topical dose of alpha-adrenergic drugs to the nasal cavity, causing vasoconstriction.2 This in turn leads to changes in nasal aerodynamics, providing symptom relief and better sensation of nasal patency.2 Understanding the impact of mucosal decongestion on nasal aerodynamics can shed light on the physiological mechanism of nasal airflow sensation, which remains incompletely understood.3
Previous research suggests that the primary mechanism of nasal airflow sensation is the stimulation of TRPM8 cold receptors in the nasal mucosa.3–15 Thus, we hypothesized that mucosal decongestion increases mucosal cooling. The objective of this study is to compare nasal airflow variables in 45 subjects, including healthy subjects without decongestion and NAO patients with and without decongestion. This study explores multiple variables that are impacted by mucosal decongestion and provides a comprehensive comparison of NAO patients with decongestion, NAO patients without decongestion and healthy subjects without decongestion. This pilot study explores how mucosal decongestion in NAO patients leads to nasal aerodynamics variables that better resemble non-decongested healthy subjects. Importantly, this study tests the hypothesis that mucosal decongestion is associated with higher mucosal cooling, which research suggests is the primary physiological mechanism of nasal airflow sensation.3
METHODS
Patient Selection
This research was performed under approval by the institutional review boards at the Medical College of Wisconsin and Universidade de São Paulo. Informed consent was obtained from all patients. The sample of 45 subjects included 15 NAO patients after mucosal decongestion, 15 NAO patients without decongestion, and 15 healthy subjects without decongestion. The non-decongested NAO patients and healthy subjects are the same cohort reported by Casey and coauthors (2017),16 thus the goal of the present study is to investigate the impact of mucosal decongestion on nasal aerodynamics by comparing this previously reported cohort to decongested NAO patients. All subjects were adults (age ≥ 18 years). The main inclusion criterion was a history of subjective nasal obstruction for NAO patients and a normal subjective nasal patency for the healthy subjects based on Nasal Obstruction Symptom Evaluation (NOSE) scores (namely NOSE ≥ 30 for NAO patients and NOSE ≤ 30 for healthy subjects).17,18 Additional inclusion and exclusion criteria are described in the Supplementary Material.
Both cohorts of NAO patients were composed of patients undergoing surgery for structural abnormalities (septal deviation, turbinate hypertrophy, and/or nasal valve dysfunction). All NAO patients had a septal deviation (except for 1 patient in the decongested NAO cohort) with or without additional structural abnormalities. Pre-surgery computed tomography (CT) scans were collected for all NAO patients (Figure 1). For the NAO cohort with mucosal decongestion, the CT scan was obtained 125 ± 43 minutes after mucosal decongestion with an oxymetazoline nasal spray. The healthy cohort were subjects undergoing cone-beam CT (CBCT) scans for dental treatment. All healthy subjects had a normal sensation of nasal patency (Figure 2).19 Interestingly, 9 out of 15 healthy subjects had a non-symptomatic septal deviation (most of which were relatively small), which is a common observation in the general population.20
Figure 1 -.
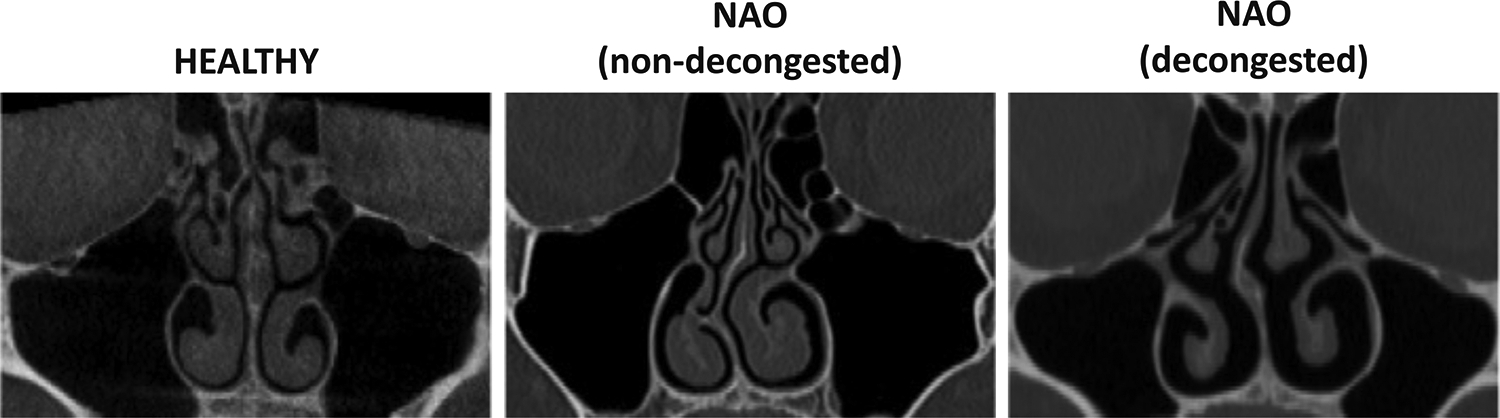
Coronal computed tomography (CT) scans of healthy subject, patient with nasal airway obstruction (NAO) without decongestion, and patient with NAO after decongestion at coronal plane D = 0.7, where D is the relative distance from nostrils to the posterior end of the septum.
Figure 2 -.
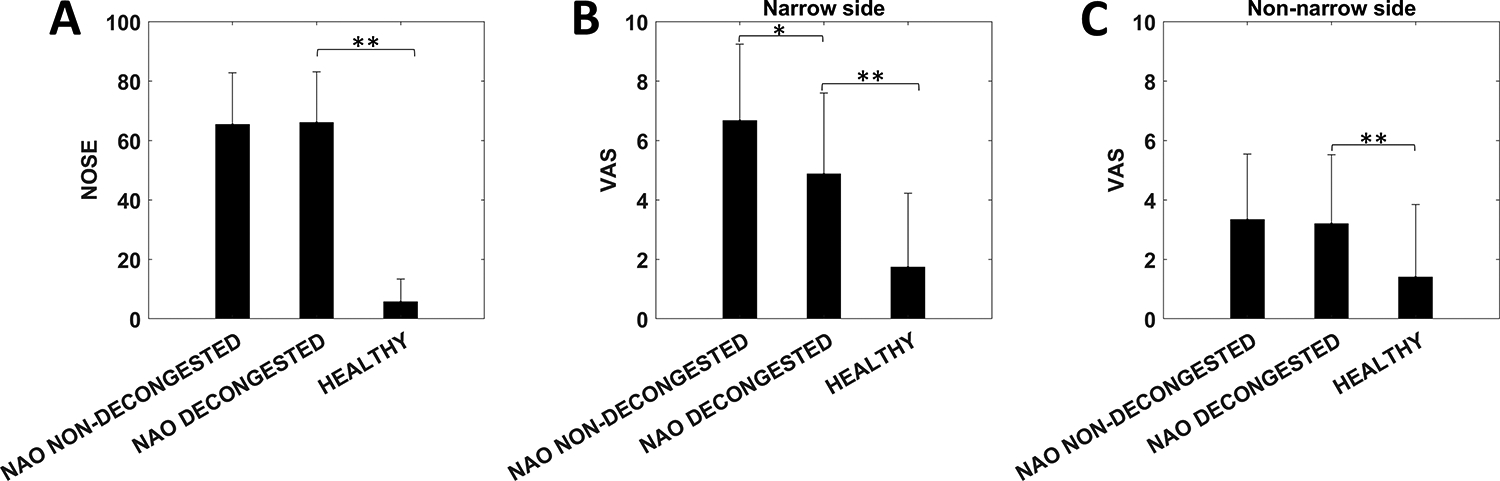
(A) Nasal Obstruction Symptom Evaluation (NOSE) scores in nasal airway obstruction (NAO) patients without decongestion, NAO patients with decongestion, and non-decongested healthy subjects. (B, C) Visual analog scale (VAS) scores in the narrow side and non-narrow side. Symbols: * denotes statistically different between decongested and non-decongested NAO patients; ** denotes statistically different between decongested NAO patients and healthy subjects. Error bars: 1 standard deviation.
Creation of 3-Dimensional Models
Three-dimensional digital models of the nasal passages (excluding the paranasal sinuses) were created in Mimics software (Materialise, Leuven, Belgium). The airspace was segmented with a threshold of −300 Hounsfield Units (HU) in the healthy cohort, −300 HU in the non-decongested NAO cohort, and −550 HU in the decongested NAO cohort. The fact that a more negative radiodensity threshold was used in the decongested NAO cohort may have slightly underestimated the degree of mucosal decongestion in the decongested NAO cohort.21 The models were exported in STL format and imported into ICEM-CFD (ANSYS, Canonsburg, Pennsylvania), where planar nostrils and outlet surfaces were created and the geometry was meshed with approximately 4 million tetrahedral cells.
Definition of Intranasal Regions for Airflow Distribution
Each nasal cavity was sectioned into 11 uniformly spaced coronal sections. The most posterior extent of either nostril was designated as relative distance D = 0.0 and the posterior-most edge of the septum as D = 1.0 (Figure 3A). Coronal sections were labeled according to their relative distance from the nostril, as defined by D = Z/Lseptum, where Z is the distance from the nostrils and Lseptum is the septum length. To analyze regional airflow, the coronal section at D = 0.7 was divided into 3 vertical segments designated as inferior, middle, and superior regions independently for each nasal cavity using horizontal lines at the ventral lamella of each turbinate (Figure 4A).
Figure 3 -.
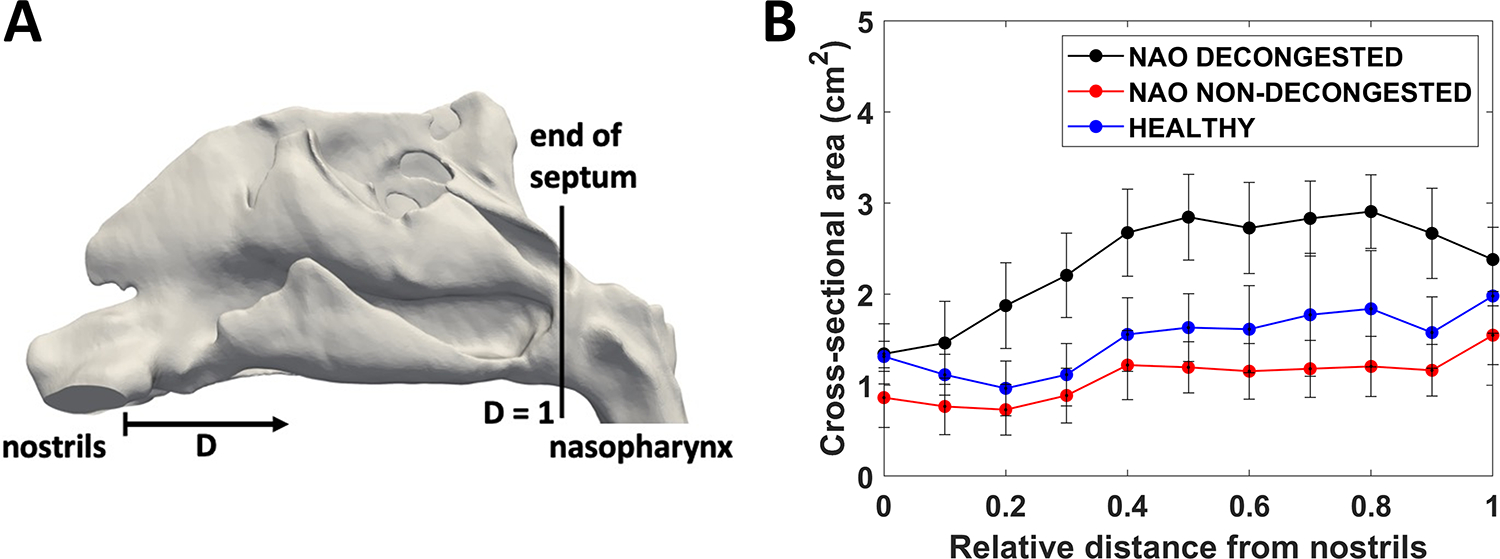
(A) Lateral view of nasal cavity model illustrating the definition of the relative distance (D) from nostrils (D=0) to the posterior end of the septum (D=1). (B) Coronal cross-sectional areas in the cohorts of nasal airway obstruction (NAO) patients with decongestion, NAO patients without decongestion, and healthy subjects without decongestion (narrow side). Error bars: 1 standard deviation.
Figure 4 –

Intranasal airflow distribution. (A) Each nasal cavity was vertically divided into inferior, middle, and superior regions at coronal plane D = 0.7. (B) Regional airflow distribution in ml/s in nasal airway obstruction (NAO) patients without decongestion, NAO patients with decongestion, and non-decongested healthy subjects in the narrow side of the nose. Symbols: * denotes statistically different between decongested and non-decongested NAO patients; ** denotes statistically different between decongested NAO patients and healthy subjects. Error bars: 1 standard deviation.
Computational Fluid Dynamics (CFD) Simulations
Our CFD methods have been described in detail elsewhere.22,23 Steady-state inspiratory laminar airflow simulations were conducted in Fluent 14.0 (ANSYS) with the following boundary conditions: (1) air velocity set to zero at stationary walls, (2) pressure inlet with gauge pressure set to zero (i.e., atmospheric pressure) at the nostrils, and (3) an outlet pressure such that bilateral airflow was equal to 15 L/min. The outlet pressure required to obtain 15 L/min of bilateral airflow was estimated by running preliminary simulations to quantify the relationship between outlet pressure and flowrate. For heat transfer simulations, the nasal mucosa temperature during inspiration was assumed constant at a value of 32.6°C.5,22
Assessment of Subjective Nasal Patency
All participants were administered the Nasal Obstruction Symptom Evaluation (NOSE) to assess disease-specific quality of life.17 This is a 5-item scale in which patients rate symptoms of nasal congestion, nasal blockage, difficulty breathing through nose, difficulty sleeping, and air hunger sensation on a 0 (not a problem) to 4 (severe problem) scale. The score is then multiplied by 5 to give a score from 0 to 100. In addition, a unilateral visual analog scale (VAS) score was obtained. Patients were asked to cover one nostril with a finger and rate their ability to breathe through the open nostril on a 0 (no obstruction) to 10 (severe obstruction) scale. This was repeated for the contralateral nostril. The VAS score represented an assessment of subjective nasal patency at the time of administration, while the NOSE score reflected NAO symptoms during the preceding 30 days. For the NAO cohort with decongestion, VAS scores were obtained before and 18 ± 2 minutes after administration of the oxymetazoline nasal spray.
Outcome Measures
CFD simulations provided the following measurements of previously described objective measurements of nasal patency5,23: (1) unilateral nasal airflow, (2) unilateral nasal resistance, (3) total unilateral heat flux, and (4) unilateral surface area where heat flux exceeds 50 W/m2 (SAHF50), which is a measure of the surface area stimulated by mucosal cooling. Regional flow was quantified in inferior, middle, and superior regions of coronal section D = 0.7 (Figure 4A). We report unilateral variables in the narrow nasal cavity of each patient because previous studies reported that (1) subjective nasal patency has a stronger correlation with unilateral rather than bilateral objective measures,23,24 and (2) subjective nasal patency has a stronger correlation with unilateral measures in the most obstructed side than with measures in the least obstructed side.16,23 The narrow side was defined as the cavity with lesser unilateral airflow in each individual.
Statistical analysis
Wilcoxon signed-rank tests were used to test whether differences between two cohorts were statistically significant at p < 0.05. The Student’s t test was used to test if unilateral VAS scores before and after mucosal decongestion were statistically different in the decongested NAO cohort. The correlation coefficients between subjective and objective measures of nasal patency were computed using the Pearson correlation coefficient.
RESULTS
Subjective Patency Scores
NOSE scores were not statistically different between the cohorts of NAO patients with and without decongestion (65 ± 17 vs. 66 ± 17, p = 0.87). (NOSE scores are not affected by mucosal decongestion as they represent subjective nasal patency during a 1-month period.) NOSE scores were significantly higher in the decongested NAO patients than in the healthy subjects (66 ± 17 vs. 5.7 ± 7.7, p<0.0001) (Figure 2A), demonstrating the symptom of nasal obstruction in the NAO patients. Unilateral VAS scores on the narrow side were statistically lower after decongestion (4.9 ± 2.8) than before decongestion (6.5 ± 2.7) in the cohort of decongested NAO patients (p = 0.0025), demonstrating that mucosal decongestion improves subjective nasal patency. Narrow side VAS scores were significantly different between the decongested and non-decongested NAO patients (4.9 ± 2.8 vs. 6.7 ± 2.7, p = 0.04) and between the decongested NAO patients and non-decongested healthy subjects (4.9 ± 2.8 vs. 1.7 ± 2.6, p = 0.004) (Figure 2B). The higher narrow side VAS score in decongested NAO patients relative to the healthy subjects suggests that mucosal decongestion is not sufficient to normalize subjective nasal patency in NAO patients with severe structural abnormalities.
Cross-sectional Areas
Airspace CSAs were significantly larger in decongested NAO patients than in the other two cohorts (Figure 3B), demonstrating that mucosal decongestion enlarges the nasal airway. For example, at coronal plane D = 0.7, the bilateral CSA was larger in decongested NAO patients than non-decongested NAO patients (2.8 ± 0.4 cm2 vs. 1.2 ± 0.3 cm2, p < 0.0001) and larger in decongested NAO patients than healthy subjects (2.8 ± 0.4 cm2 vs. 1.8 ± 0.7 cm2, p < 0.0001).
Average CFD Variables
Narrow side airflow was higher in decongested than non-decongested NAO patients (102 ± 23 mL/s vs. 72 ± 34 mL/s, p = 0.003) (Figure 5A), consistent with the expectation that mucosal decongestion increases nasal airflow. This higher airflow in decongested NAO patients was explained by the lower unilateral resistance when compared to non-decongested NAO patients (0.057 ± 0.060 Pa.s/mL vs. 0.75 ± 1.45 Pa.s/mL, p < 0.0001) (Figure 5B). When comparing decongested NAO patients with healthy subjects, narrow side airflow was not statistically different (102 ± 23 mL/s vs. 105 ± 14 mL/s, p = 0.84) (Figure 5A), but narrow side resistance was smaller in decongested NAO patients (0.057 ± 0.060 Pa.s/mL vs. 0.097 ± 0.040 Pa.s/mL, p = 0.003) (Figure 5B). Unilateral heat flux in the narrow side was not statistically different between decongested and non-decongested NAO patients (142 ± 32 W/m2 vs. 114 ± 54 W/m2, p = 0.20), or between decongested NAO patients and healthy subjects (142 ± 32 W/m2 vs. 167 ± 27 W/m2, p = 0.051) (Figure 5C). However, SAHF50, representing the surface area stimulated by mucosal cooling, was higher in decongested than non-decongested NAO patients (42 ± 10 cm2 vs. 30 ± 13 cm2, p = 0.014) (Figure 5D). SAHF50 was not statistically different between decongested NAO patients and healthy subjects (42 ± 10 cm2 vs. 41 ± 5 cm2, p = 0.71). As reported in Casey and coauthors (2017), the differences between non-decongested NAO patients and healthy subjects were statistically significant for unilateral airflow (p = 0.003), unilateral resistance (p < 0.0001), unilateral heat flux (p = 0.006), and unilateral SAHF50 (p = 0.007) all measured on the narrow side.
Figure 5 -.
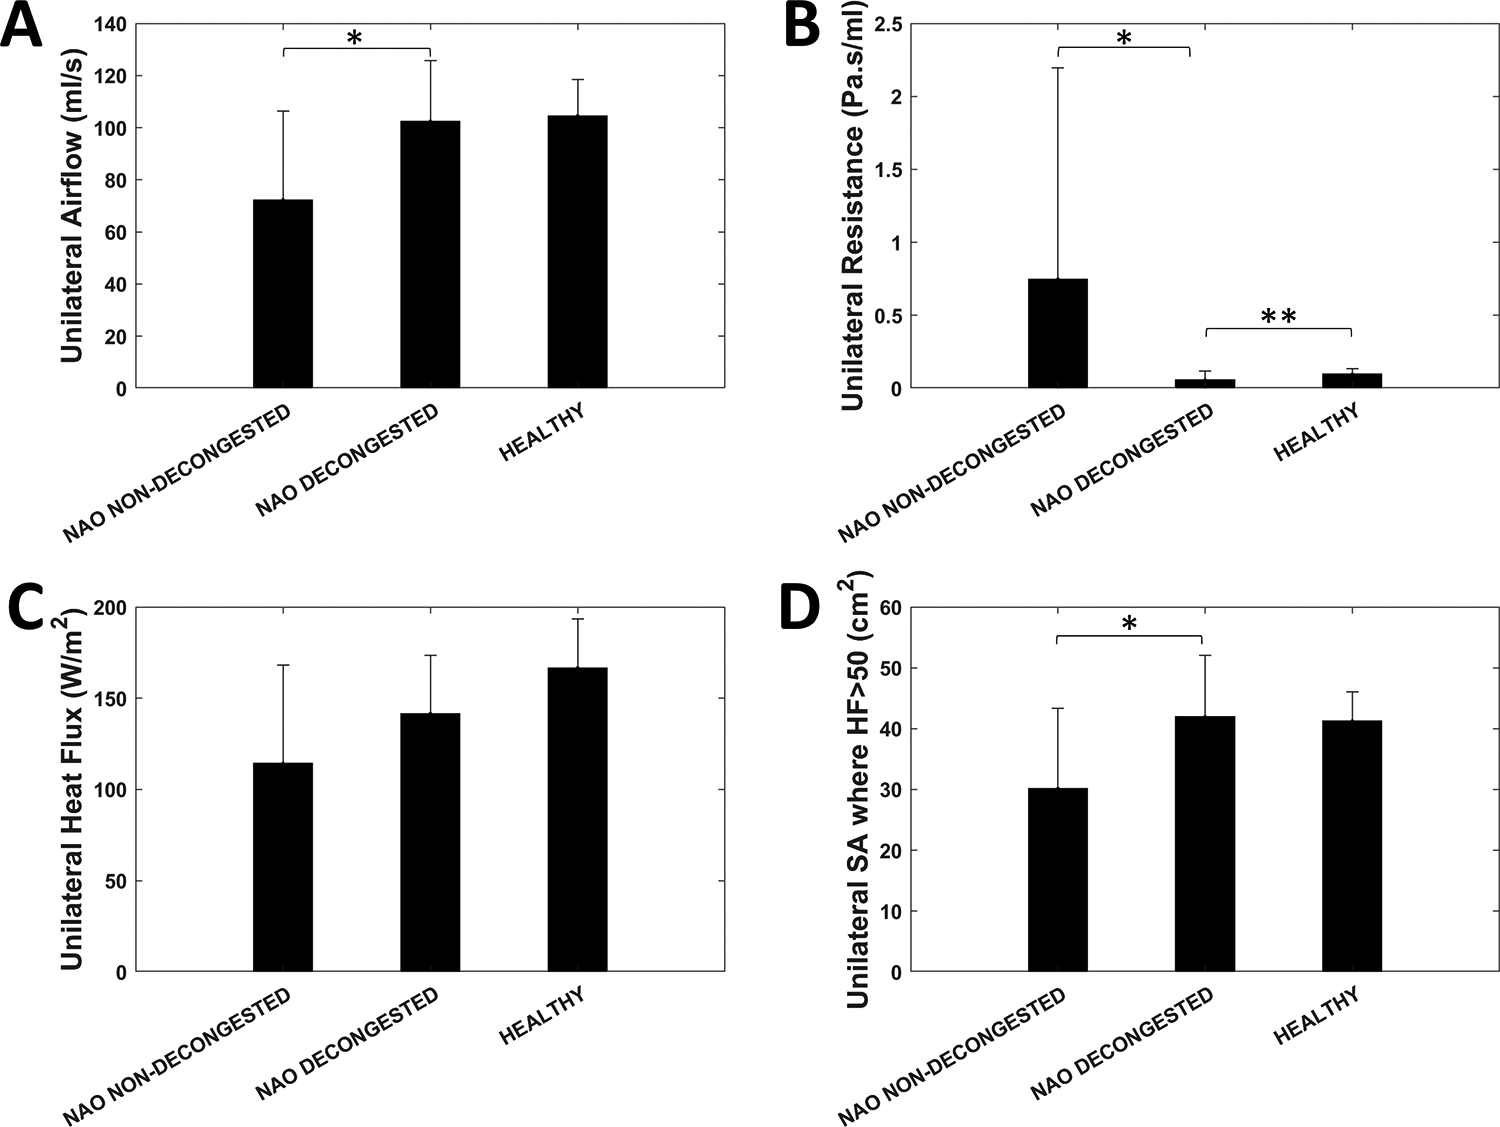
Narrow side unilateral (A) airflow, (B) resistance, (C) heat flux, and (D) surface area where heat flux exceeds 50 W/m2 in nasal airway obstruction (NAO) patients without decongestion, NAO patients with decongestion, and healthy subjects without decongestion. Symbols: * denotes statistically different between decongested and non-decongested NAO patients; ** denotes statistically different between decongested NAO patients and healthy subjects. Error bars: 1 standard deviation.
Regional Airflow Distribution
Intranasal airflow distribution in the narrow side was significantly different between the 3 cohorts (Figure 4B). Middle airflow was significantly higher in decongested than non-decongested NAO patients (69 ± 20 mL/s vs. 31 ± 18 mL/s, p < 0.0001) and higher in healthy subjects than non-decongested NAO patients (68 ± 10 mL/s vs. 31 ± 18 mL/s, p < 0.0001). Middle airflow was not significantly different between decongested NAO patients and healthy subjects (69 ± 20 mL/s vs. 68 ± 10 mL/s, p = 0.84). Superior airflow was higher in healthy subjects than in decongested NAO patients (11.6 ± 5.9 mL/s vs. 6.6 ± 7.0 mL/s, p = 0.03). No other statistically significant differences were observed regarding intranasal airflow distribution.
Correlation between Subjective and Objective Measures
Subjective nasal patency, as measured by VAS scores in the narrow side, correlated with four CFD variables, namely unilateral airflow, unilateral heat flux, unilateral SAHF50, and middle airflow (Table 1). The strongest correlation was observed between VAS scores and middle airflow in the narrow side (Pearson r = −0.46, p = 0.001) (Figure 6). VAS scores did not correlate with CFD variables in the non-narrow side (Supplementary Material). These Pearson correlation coefficients were computed for all 3 cohorts combined using the post-decongestant VAS scores for the decongested NAO cohort.
Table 1 -.
Pearson correlation coefficients (95% confidence intervals) for the correlation between subjective nasal patency (VAS score) and CFD variables on the narrow side of the nose. Statistically significant correlations (p < 0.05) are marked with an asterisk.
| r (95% CI) | p value | |
|---|---|---|
| Unilateral airflow (mL/s) | −0.42 (−0.64 to −0.15) | 0.004* |
| Unilateral resistance (Pa.s/mL) | 0.25 (−0.044 to 0.51) | 0.09 |
| Unilateral heat flux (W/m2) | −0.35 (−0.59 to −0.068) | 0.017* |
| SAHF50 (cm2) | −0.38 (−0.61 to −0.10) | 0.009* |
| Inferior region airflow (mL/s) | −0.059 (−0.35 to 0.24) | 0.70 |
| Middle region airflow (mL/s) | −0.46 (−0.67 to −0.20) | 0.001* |
| Superior region airflow (mL/s) | −0.02 (−0.31 to 0.28) | 0.92 |
Abbreviations: CI = confidence interval; SAHF50 = surface area where heat flux > 50 W/m2; VAS = visual analog scale; CFD = computational fluid dynamics.
Figure 6 –

Correlation between subjective nasal patency and CFD variables. VAS scores are plotted against unilateral (A) airflow, (B) resistance, (C) heat flux, and (D) surface area where heat flux exceeds 50 W/m2 (SAFH50) in the narrow side of the nose. VAS scores are also plotted against the intranasal airflow distribution, namely (E) inferior airflow, (F) middle airflow, and (G) superior airflow at coronal section D = 0.7 in the narrow side of the nose.
Subgroup analysis
Allergic rhinitis was an exclusion criterion in the healthy cohort and the non-decongested NAO cohort, but the decongested NAO cohort was composed of patients with and without allergic rhinitis. A subgroup analysis suggested that NAO patients with allergic rhinitis have a greater response to mucosal decongestion than NAO patients without allergic rhinitis (Supplementary Material).
DISCUSSION
Mucosal decongestion is often used to treat acute or chronic nasal obstruction. Nasal decongestants, like oxymetazoline, are alpha-adrenergic drugs that cause vasoconstriction in the nasal tissues. This pilot study investigated the effects of vasoconstriction on nasal aerodynamics to explore the physiological mechanism by which vasoconstriction leads to symptom relief.
Limited research has been conducted to quantify the impact of mucosal decongestion on nasal aerodynamics using computational fluid dynamics (CFD). Kishore and coauthors (2015) applied CFD to investigate 21 NAO patients who underwent magnetic resonance imaging (MRI) before and 8 hours after mucosal decongestion with 0.05% oxymetazoline nasal spray.25 Mucosal decongestion led to substantial reduction in nasal resistance compared to placebo (puff of air administered with an empty bottle), but unfortunately the numerical values of the data points illustrated on a scatter plot were not reported. Xiao and coauthors (2021) applied CFD to investigate 10 healthy subjects who underwent MRI before and 10 minutes after mucosal decongestion with xylometazoline HCL 0.1% drops.26 They reported an increase in the volume of the nasal airspace and a reduction in nasal resistance from a median of 0.032 Pa.s/mL before mucosal decongestion to a median of 0.020 Pa.s/mL after mucosal decongestion (p = 0.0058). These CFD studies are in good agreement with previous acoustic rhinometry and rhinomanometry studies that documented an increase in airspace minimal cross-sectional area and a reduction in nasal resistance after mucosal decongestion.2,27–30 However, the physiological mechanism by which mucosal decongestion leads to improved subjective nasal patency remains unclear. Many research studies have shown a lack of correlation between nasal resistance and sensation of nasal airflow.24,31,32 In fact, today the leading hypothesis is that the primary mechanism of nasal airflow sensation is the stimulation of TRPM8 cold receptors,3–15 which was not investigated in past studies of mucosal decongestion.
Our data confirms that mucosal decongestion improves subjective nasal patency (i.e., decreases VAS scores on the narrow side).2 We also confirmed that mucosal decongestion significantly increases the airspace CSA (Figure 3B) and significantly decreases nasal resistance (Figure 5B), as documented by rhinomanometry and acoustic rhinometry studies.2,27–30 Unilateral airflow on the narrow side was higher in decongested NAO patients than non-decongested NAO patients (Figure 5A). The observation of higher airflow does not explain the improvement in subjective nasal patency because airflow, specifically peak nasal inspiratory airflow (PNIF), has been shown to weakly correlate with subjective nasal patency.33 Interestingly, SAHF50 was statistically higher in the decongested NAO patients than in non-decongested NAO patients (Figure 5D). This suggests that mucosal decongestion increases the surface area stimulated by mucosal cooling. We also found that mean heat flux on the narrow side was higher in decongested NAO patients than in non-decongested NAO patients, but the difference was not statistically significant (Figure 5C).
Regional airflow distribution also correlates with subjective nasal patency. Specifically, studies have shown that airflow in the middle region of a coronal section correlates with subjective nasal patency.16,34 In our cohort, decongested NAO patients had higher middle region airflow than non-decongested NAO patients (Figure 4B). This suggests that mucosal decongestion causes a regional redistribution of airflow to more closely mimic healthy subjects, which may further explain the improvement in subjective nasal patency.
Mucosal cooling leads to firing of TRPM8 receptors when the mucosal temperature falls below approximately 24°C leading to afferent trigeminal sensory stimulation.7,10,35 Identifying objective measurements that can be targeted for medical or surgical intervention may help increase the success rate of surgical interventions to treat NAO. As such, several studies have investigated the physiological mechanisms of mucosal cooling and nasal airflow sensation. Studies exploring the topographical sensitivity or distribution of receptors have shown that both anterior and posterior regions of the nasal cavity contribute to airflow perception.8,15 Few studies to date have investigated the distribution of TRPM8 receptors on the nasal mucosa, but the existing studies suggest that TRPM8 receptors are uniformly distributed throughout the nasal mucosa.8,36 Additionally a recent study has shown a potential role of the olfactory epithelium in airflow sensation, a topic which should be further explored.37 Many CFD studies, including this one, have explored the role of airflow variables in nasal patency sensation and mucosal cooling. These studies have shown that CFD-derived metrics of mucosal cooling, such as heat flux and SAHF50, correlate with subjective nasal patency.5,13,15,34
Several limitations of this study must be acknowledged. First, this cross-sectional study investigated a convenience sample with heterogenous patient characteristics. Future studies with more restrictive inclusion criteria may be able to clarify how factors such as comorbid allergic rhinitis or nasal valve stenosis modulate the response to mucosal decongestion. Second, the non-decongested and decongested NAO cohorts were different patients, thus no pre/post-decongestion comparison could be made (except for VAS scores which were taken pre/post-decongestion in the decongested NAO cohort). Our subgroup analysis suggested that mucosal decongestion may be less effective at normalizing airflow variables in patients with more severe structural abnormalities (Supplementary Material). If confirmed, this would be consistent with the observation that nasal sprays have a suboptimal distribution in the presence of inferior turbinate hypertrophy38 and that steroid nasal sprays can be ineffective to treat NAO in patients with septal deviation.39 However, since pre/post-decongestion data were not available on the same patients, we could not test the hypothesis that mucosal decongestion is less effective at normalizing nasal airflow in patients with more severe structural abnormalities.
A third limitation of this study is that our CFD models assumed a constant mucosal temperature of 32.6°C, which does not account for the anterior-posterior gradient in nasal mucosal temperature and the inverse relationship between nasal mucosal temperature and nasal airflow.15,40,41 Furthermore, nasal decongestants cause vasoconstriction leading to a decrease in blood flow to the nasal tissues, possibly decreasing mucosal temperature. Thus, vasoconstriction may contribute to improved subjective nasal patency by directly reducing nasal mucosal temperature. Future computational studies should incorporate regional changes in nasal mucosal temperature,15 while future experimental studies could measure mucosal temperature before and after vasoconstriction.
A fourth limitation of this study is that the 3D models of the healthy cohort were created from CBCT scans, while the 3D models of NAO patients were created from traditional CT scans. Previous studies reported that both CBCT and traditional CT scans provide accurate estimates of the air-tissue interface.42,43 Although we did not compare the two modalities to confirm that they produce equivalent reconstructions of the nasal airspace, our finding of a statistically significant correlation between subjective nasal patency and CFD metrics supports the validity of our methods. Finally, a fifth limitation of this study is that a radiodensity threshold of −550 HU was used to segment the airspace in the decongested NAO cohort, while a threshold of −300 HU was used for the healthy subjects and non-decongested NAO cohort. However, the 3D models of the decongested NAO cohort would display even greater mucosal decongestion if a threshold of −300 HU had been used,21 thus our CFD results may have slightly underestimated the changes in aerodynamic variables after mucosal decongestion.
CONCLUSION
The results of this pilot study suggest that mucosal decongestion increases airspace CSA, decreases nasal resistance, increases unilateral airflow, and increases the surface area stimulated by mucosal cooling. The higher middle region airflow in the decongested NAO patients compared to the non-decongested NAO patients suggests a potential role for intranasal airflow distribution in perception of nasal airflow. In summary, our computer simulations suggest that mucosal decongestion changes nasal aerodynamics to more closely mimic healthy subjects, including airflow variables that correlate with subjective nasal patency. However, a subgroup analysis suggested that mucosal decongestion in NAO patients with severe structural abnormalities may be insufficient to bring airflow variables into the normal range. Additional studies are needed to quantify the impact of mucosal decongestion in different subgroups of NAO patients.
Supplementary Material
ACKNOWLEDGEMENTS
This work was funded in part by the National Institutes of Health through the National Institute of Biomedical Imaging and Bioengineering (grant number: R01EB009557) and by Fundação de Amparo à Pesquisa do Estado de São Paulo (grant number: 2012/20823-9).
Footnotes
This research was presented as an oral presentation at the 2016 American Academy of Otolaryngology Head and Neck Surgery Annual Meeting, San Diego, CA, USA, October 18–21, 2016.
Conflicts of interest: None
REFERENCES
- 1.Kimmelman CP. The problem of nasal obstruction. Otolaryngol Clin North Am. 1989;22(2):253–264. [PubMed] [Google Scholar]
- 2.Clarke RW, Cook JA, Jones AS. The effect of nasal mucosal vasoconstriction on nasal airflow sensation. Clin Otolaryngol Allied Sci. 1995;20(1):72–73. [DOI] [PubMed] [Google Scholar]
- 3.Sozansky J, Houser SM. The physiological mechanism for sensing nasal airflow: a literature review. Int Forum Allergy Rhinol. 2014;4(10):834–838. [DOI] [PubMed] [Google Scholar]
- 4.Zhao K, Blacker K, Luo Y, Bryant B, Jiang J. Perceiving nasal patency through mucosal cooling rather than air temperature or nasal resistance. PLoS One. 2011;6(10):e24618. [DOI] [PMC free article] [PubMed] [Google Scholar]
- 5.Sullivan CD, Garcia GJ, Frank-Ito DO, Kimbell JS, Rhee JS. Perception of better nasal patency correlates with increased mucosal cooling after surgery for nasal obstruction. Otolaryngol Head Neck Surg. 2014;150(1):139–147. [DOI] [PMC free article] [PubMed] [Google Scholar]
- 6.Bailey RS, Casey KP, Pawar SS, Garcia GJ. Correlation of Nasal Mucosal Temperature With Subjective Nasal Patency in Healthy Individuals. JAMA Facial Plast Surg. 2017;19(1):46–52. [DOI] [PMC free article] [PubMed] [Google Scholar]
- 7.Peier AM, Moqrich A, Hergarden AC, et al. A TRP channel that senses cold stimuli and menthol. Cell. 2002;108(5):705–715. [DOI] [PubMed] [Google Scholar]
- 8.Meusel T, Negoias S, Scheibe M, Hummel T. Topographical differences in distribution and responsiveness of trigeminal sensitivity within the human nasal mucosa. Pain. 2010;151(2):516–521. [DOI] [PubMed] [Google Scholar]
- 9.Keh SM, Facer P, Yehia A, Sandhu G, Saleh HA, Anand P. The menthol and cold sensation receptor TRPM8 in normal human nasal mucosa and rhinitis. Rhinology. 2011;49(4):453–457. [DOI] [PubMed] [Google Scholar]
- 10.Liu SC, Lu HH, Fan HC, et al. The identification of the TRPM8 channel on primary culture of human nasal epithelial cells and its response to cooling. Medicine (Baltimore). 2017;96(31):e7640. [DOI] [PMC free article] [PubMed] [Google Scholar]
- 11.Wu CL, Fu CH, Lee TJ. Distinct Histopathology Characteristics in Empty Nose Syndrome. Laryngoscope. 2021;131(1):E14–E18. [DOI] [PubMed] [Google Scholar]
- 12.Malik J, Spector BM, Wu Z, et al. Evidence of Nasal Cooling and Sensory Impairments Driving Patient Symptoms With Septal Deviation. Laryngoscope. 2022;132(3):509–517. [DOI] [PMC free article] [PubMed] [Google Scholar]
- 13.Radulesco T, Meister L, Bouchet G, et al. Correlations between computational fluid dynamics and clinical evaluation of nasal airway obstruction due to septal deviation: An observational study. Clin Otolaryngol. 2019;44(4):603–611. [DOI] [PubMed] [Google Scholar]
- 14.Tjahjono R, Singh N. Correlation between nasal mucosal temperature change and the perception of nasal patency: a literature review. J Laryngol Otol. 2021;135(2):104–109. [DOI] [PubMed] [Google Scholar]
- 15.Tjahjono R, Salati H, Inthavong K, Singh N. Correlation of Nasal Mucosal Temperature and Nasal Patency-A Computational Fluid Dynamics Study. Laryngoscope. 2023;133(6):1328–1335. [DOI] [PubMed] [Google Scholar]
- 16.Casey KP, Borojeni AA, Koenig LJ, Rhee JS, Garcia GJ. Correlation between Subjective Nasal Patency and Intranasal Airflow Distribution. Otolaryngol Head Neck Surg. 2017;156(4):741–750. [DOI] [PMC free article] [PubMed] [Google Scholar]
- 17.Stewart MG, Witsell DL, Smith TL, Weaver EM, Yueh B, Hannley MT. Development and validation of the Nasal Obstruction Symptom Evaluation (NOSE) scale. Otolaryngol Head Neck Surg. 2004;130(2):157–163. [DOI] [PubMed] [Google Scholar]
- 18.Rhee JS, Sullivan CD, Frank DO, Kimbell JS, Garcia GJ. A systematic review of patient-reported nasal obstruction scores: defining normative and symptomatic ranges in surgical patients. JAMA Facial Plast Surg. 2014;16(3):219–225; quiz 232. [DOI] [PMC free article] [PubMed] [Google Scholar]
- 19.Borojeni AAT, Garcia GJM, Moghaddam MG, et al. Normative ranges of nasal airflow variables in healthy adults. Int J Comput Assist Radiol Surg. 2020;15(1):87–98. [DOI] [PMC free article] [PubMed] [Google Scholar]
- 20.Garcia GJ, Rhee JS, Senior BA, Kimbell JS. Septal deviation and nasal resistance: an investigation using virtual surgery and computational fluid dynamics. Am J Rhinol Allergy. 2010;24(1):e46–53. [DOI] [PubMed] [Google Scholar]
- 21.Cherobin GB, Voegels RL, Gebrim E, Garcia GJM. Sensitivity of nasal airflow variables computed via computational fluid dynamics to the computed tomography segmentation threshold. PLoS One. 2018;13(11):e0207178. [DOI] [PMC free article] [PubMed] [Google Scholar]
- 22.Garcia GJ, Bailie N, Martins DA, Kimbell JS. Atrophic rhinitis: a CFD study of air conditioning in the nasal cavity. J Appl Physiol (1985). 2007;103(3):1082–1092. [DOI] [PubMed] [Google Scholar]
- 23.Kimbell JS, Frank DO, Laud P, Garcia GJ, Rhee JS. Changes in nasal airflow and heat transfer correlate with symptom improvement after surgery for nasal obstruction. J Biomech. 2013;46(15):2634–2643. [DOI] [PMC free article] [PubMed] [Google Scholar]
- 24.Andre RF, Vuyk HD, Ahmed A, Graamans K, Nolst Trenite GJ. Correlation between subjective and objective evaluation of the nasal airway. A systematic review of the highest level of evidence. Clin Otolaryngol. 2009;34(6):518–525. [DOI] [PubMed] [Google Scholar]
- 25.Kishore A, Blake L, Wang C, Ba S, Gross G. Evaluating the Effect of Sinex(R) (0.05% Oxymetazoline) Nasal Spray on Reduction of Nasal Congestion Using Computational Fluid Dynamics. J Biomech Eng. 2015;137(8):081011. [DOI] [PubMed] [Google Scholar]
- 26.Xiao Q, Bates AJ, Cetto R, Doorly DJ. The effect of decongestion on nasal airway patency and airflow. Sci Rep. 2021;11(1):14410. [DOI] [PMC free article] [PubMed] [Google Scholar]
- 27.Lenders H, Pirsig W. Diagnostic value of acoustic rhinometry: patients with allergic and vasomotor rhinitis compared with normal controls. Rhinology. 1990;28(1):5–16. [PubMed] [Google Scholar]
- 28.Corey JP, Gungor A, Nelson R, Liu X, Fredberg J. Normative standards for nasal cross-sectional areas by race as measured by acoustic rhinometry. Otolaryngol Head Neck Surg. 1998;119(4):389–393. [DOI] [PubMed] [Google Scholar]
- 29.Lal D, Corey JP. Acoustic rhinometry and its uses in rhinology and diagnosis of nasal obstruction. Facial Plast Surg Clin North Am. 2004;12(4):397–405, v. [DOI] [PubMed] [Google Scholar]
- 30.Braun T, Rich M, Berghaus A, Kramer MF. Effects of oxymetazoline nasal spray on the nasal cycle assessed by long-term rhinoflowmetry. Rhinology. 2012;50(4):370–375. [DOI] [PubMed] [Google Scholar]
- 31.Lam DJ, James KT, Weaver EM. Comparison of anatomic, physiological, and subjective measures of the nasal airway. Am J Rhinol. 2006;20(5):463–470. [DOI] [PubMed] [Google Scholar]
- 32.Thulesius HL, Cervin A, Jessen M. Can we always trust rhinomanometry? Rhinology. 2011;49(1):46–52. [DOI] [PubMed] [Google Scholar]
- 33.Xavier R, Azeredo-Lopes S, Menger DJ, de Carvalho HC, Spratley J. Objective measurement and patient-reported evaluation of the nasal airway: Is correlation dependent on symptoms or on nasal airflow? Clin Otolaryngol. 2021;46(4):744–751. [DOI] [PubMed] [Google Scholar]
- 34.Zhao K, Jiang J. What is normal nasal airflow? A computational study of 22 healthy adults. Int Forum Allergy Rhinol. 2014;4(6):435–446. [DOI] [PMC free article] [PubMed] [Google Scholar]
- 35.McKemy DD, Neuhausser WM, Julius D. Identification of a cold receptor reveals a general role for TRP channels in thermosensation. Nature. 2002;416(6876):52–58. [DOI] [PubMed] [Google Scholar]
- 36.Jones AS, Wight RG, Durham LH. The distribution of thermoreceptors within the nasal cavity. Clin Otolaryngol Allied Sci. 1989;14(3):235–239. [DOI] [PubMed] [Google Scholar]
- 37.Chao YT, Nakov A, Haehner A, Poletti S, Hummel T. Olfactory stimulation may modulate the sensation of nasal patency. Rhinology. 2023;61(1):24–31. [DOI] [PubMed] [Google Scholar]
- 38.Dowley AC, Homer JJ. The effect of inferior turbinate hypertrophy on nasal spray distribution to the middle meatus. Clin Otolaryngol Allied Sci. 2001;26(6):488–490. [DOI] [PubMed] [Google Scholar]
- 39.Rudy SF, Kandathil C, Spataro EA, Moubayed SP, Most SP. Effect of Nasal Steroids on Nasal Obstruction in Septal Deviation: A Double-Blind Randomized Controlled Trial. Facial Plast Surg Aesthet Med. 2020;22(4):243–248. [DOI] [PubMed] [Google Scholar]
- 40.Lindemann J, Leiacker R, Rettinger G, Keck T. Nasal mucosal temperature during respiration. Clin Otolaryngol Allied Sci. 2002;27(3):135–139. [DOI] [PubMed] [Google Scholar]
- 41.Lindemann J, Keck T, Scheithauer MO, Leiacker R, Wiesmiller K. Nasal mucosal temperature in relation to nasal airflow as measured by rhinomanometry. Am J Rhinol. 2007;21(1):46–49. [DOI] [PubMed] [Google Scholar]
- 42.Guijarro-Martinez R, Swennen GR. Cone-beam computerized tomography imaging and analysis of the upper airway: a systematic review of the literature. Int J Oral Maxillofac Surg. 2011;40(11):1227–1237. [DOI] [PubMed] [Google Scholar]
- 43.Yamashina A, Tanimoto K, Sutthiprapaporn P, Hayakawa Y. The reliability of computed tomography (CT) values and dimensional measurements of the oropharyngeal region using cone beam CT: comparison with multidetector CT. Dentomaxillofac Radiol. 2008;37(5):245–251. [DOI] [PubMed] [Google Scholar]
Associated Data
This section collects any data citations, data availability statements, or supplementary materials included in this article.