

Significance
Understanding the mechanisms underlying immune evasion is crucial for developing novel anticancer modalities. To systematically uncover tumor-intrinsic genetic modulators involved in immune escape in tumor microenvironment, we performed genome-scale in vivo CRISPR screens in two syngeneic models and later expanded up to seven syngeneic models with a focused validation library. These data help us better understand tumor immune evasion and pave the way for developing effective therapeutics. Importantly, we uncovered that Mga depletion elicited an antitumor immune response and inhibited tumor growth in triple-negative breast cancer. Our findings suggest that Mga may play a role in modulating the tumor immune landscape, though the precise mechanisms require further investigation. Further studies are needed to test MGA inhibition in cancer treatment.
Keywords: CRISPR screen, breast cancer, in vivo screen, MGA, immune evasion
Abstract
Immune evasion is not only critical for tumor initiation and progression, but also determines the efficacy of immunotherapies. Through iterative in vivo CRISPR screens with seven syngeneic tumor models, we identified core and context-dependent immune evasion pathways across cancer types. This valuable high-confidence dataset is available for the further understanding of tumor intrinsic immunomodulators, which may lead to the discovery of effective anticancer therapeutic targets. With a focus on triple-negative breast cancer (TNBC), we found that Mga knock-out significantly enhances antitumor immunity and inhibits tumor growth. Transcriptomics and single-cell RNA sequencing analyses revealed that Mga influences various immune-related pathways in the tumor microenvironment. Our findings suggest that Mga may play a role in modulating the tumor immune landscape, though the precise mechanisms require further investigation. Interestingly, we observed that low MGA expression in breast cancer patients correlates with a favorable prognosis, particularly in those with active interferon-γ signaling. These observations provide insights into tumor immune escape mechanisms and suggest that further exploration of MGA’s function could potentially lead to effective therapeutic strategies in TNBC.
Avoiding immune destruction is a key hallmark of cancer (1). However, the knowledge we have about immune escape is still limited, although immune checkpoint blockade (ICB), such as anti-PD1 or anti-CTLA4, has shown great success clinically in several cancer types (2, 3). Unfortunately, the overall response rate remains low in solid tumors (4). Further exploration into immune evasion mechanisms is crucial for developing novel strategies for immunotherapy. Previous studies have already utilized CRISPR screens to identify immune evasive genes with small focused sgRNA library (5–8), using in vitro coculture system (9), or in immunodeficient mice with genome-wide library (10). These studies couldn’t capture the genome-scale view of immune evasion in complicated tumor microenvironment, until one very recent study which assessed the immune evasion using genome-scale in vivo screens in syngeneic tumor models from five cancer types (melanoma, pancreatic, lung, renal, and colon cancers) with two-vector CRISPR system (11).
Here, we took advantage of the all-in-one vector-based CRISPR screen system and performed genome-scale in vivo CRISPR screens in syngeneic colon cancer model MC38 and triple-negative breast cancer (TNBC) model EMT6, revealing the model-specific and common immune evasion modulatory genes. Furthermore, a validation library composed of top hits identified above (395 genes) was generated and second-round screens were expanded to 7 syngeneic tumor models spanning five cancer types (breast, colon, melanoma, prostate, and ovary cancers). Through these iterative screens, we not only consolidated the findings in genome-scale screens, such as that the inactivation of interferon-γ (IFN-γ) signaling genes (Ifngr1/Ifngr2/Jak1/Stat1/Irf1) or antigen processing and presentation genes (Tap1/Tap2/Tapbp/B2m) rend tumor cells more sensitive to host immunity, but also identified high reliable context-dependent immune evasive genes. Among all these potential immune-sensitizing targets, we found Mga as a specific target for TNBC, and depletion of Mga inhibited tumor growth in immunocompetent mice but not in immunocompromised (Nude) mice. Together with transcriptional profiling and immune profiling with single-cell RNA sequencing (scRNA-seq), we found that Mga plays a role in modulating T cell–mediated antitumor immunity. Our analyses revealed that Mga influences various immune-related pathways in the tumor microenvironment including the repression of classical major histocompatibility complex class II (MHC-II), suggesting a complex interplay between Mga and tumor immunology. Importantly, in human breast cancer patients from TCGA, MGA expression inversely correlates with MHC-II expression and prognosis, particularly in those cases exhibiting active IFN-γ signaling. These findings highlight the potential of targeting MGA to enhance immune therapy.
Results
In Vivo Genome-Scale CRISPR Screens Reveal Tumor-Intrinsic Immune Modulators.
To identify potential immune evasive genes at a genome-scale, we performed in vivo CRISPR screens with mTKO library (9), which is an all-in-one vector-based genome-wide CRISPR-Cas9 library with excellent performance. As we did previously (12), MC38 (immunologically “warm”) and EMT6 (immunologically “cold”) cells were infected with lentiviruses carrying mTKO library and selected with puromycin, and then transplanted into immunocompetent C57BL6 and BALB/c mice, respectively. After 2 wk incubation, we harvested the tumors as well as the cells cultured in vitro and extracted genomic DNA to prepare the library, which was then sequenced by next-generation sequencing (NGS) (Fig. 1A). The quality of these screens was confirmed by the fold-change distribution of gRNAs of control genes (essential and nonessential) (SI Appendix, Fig. S1 A and B).
Fig. 1.
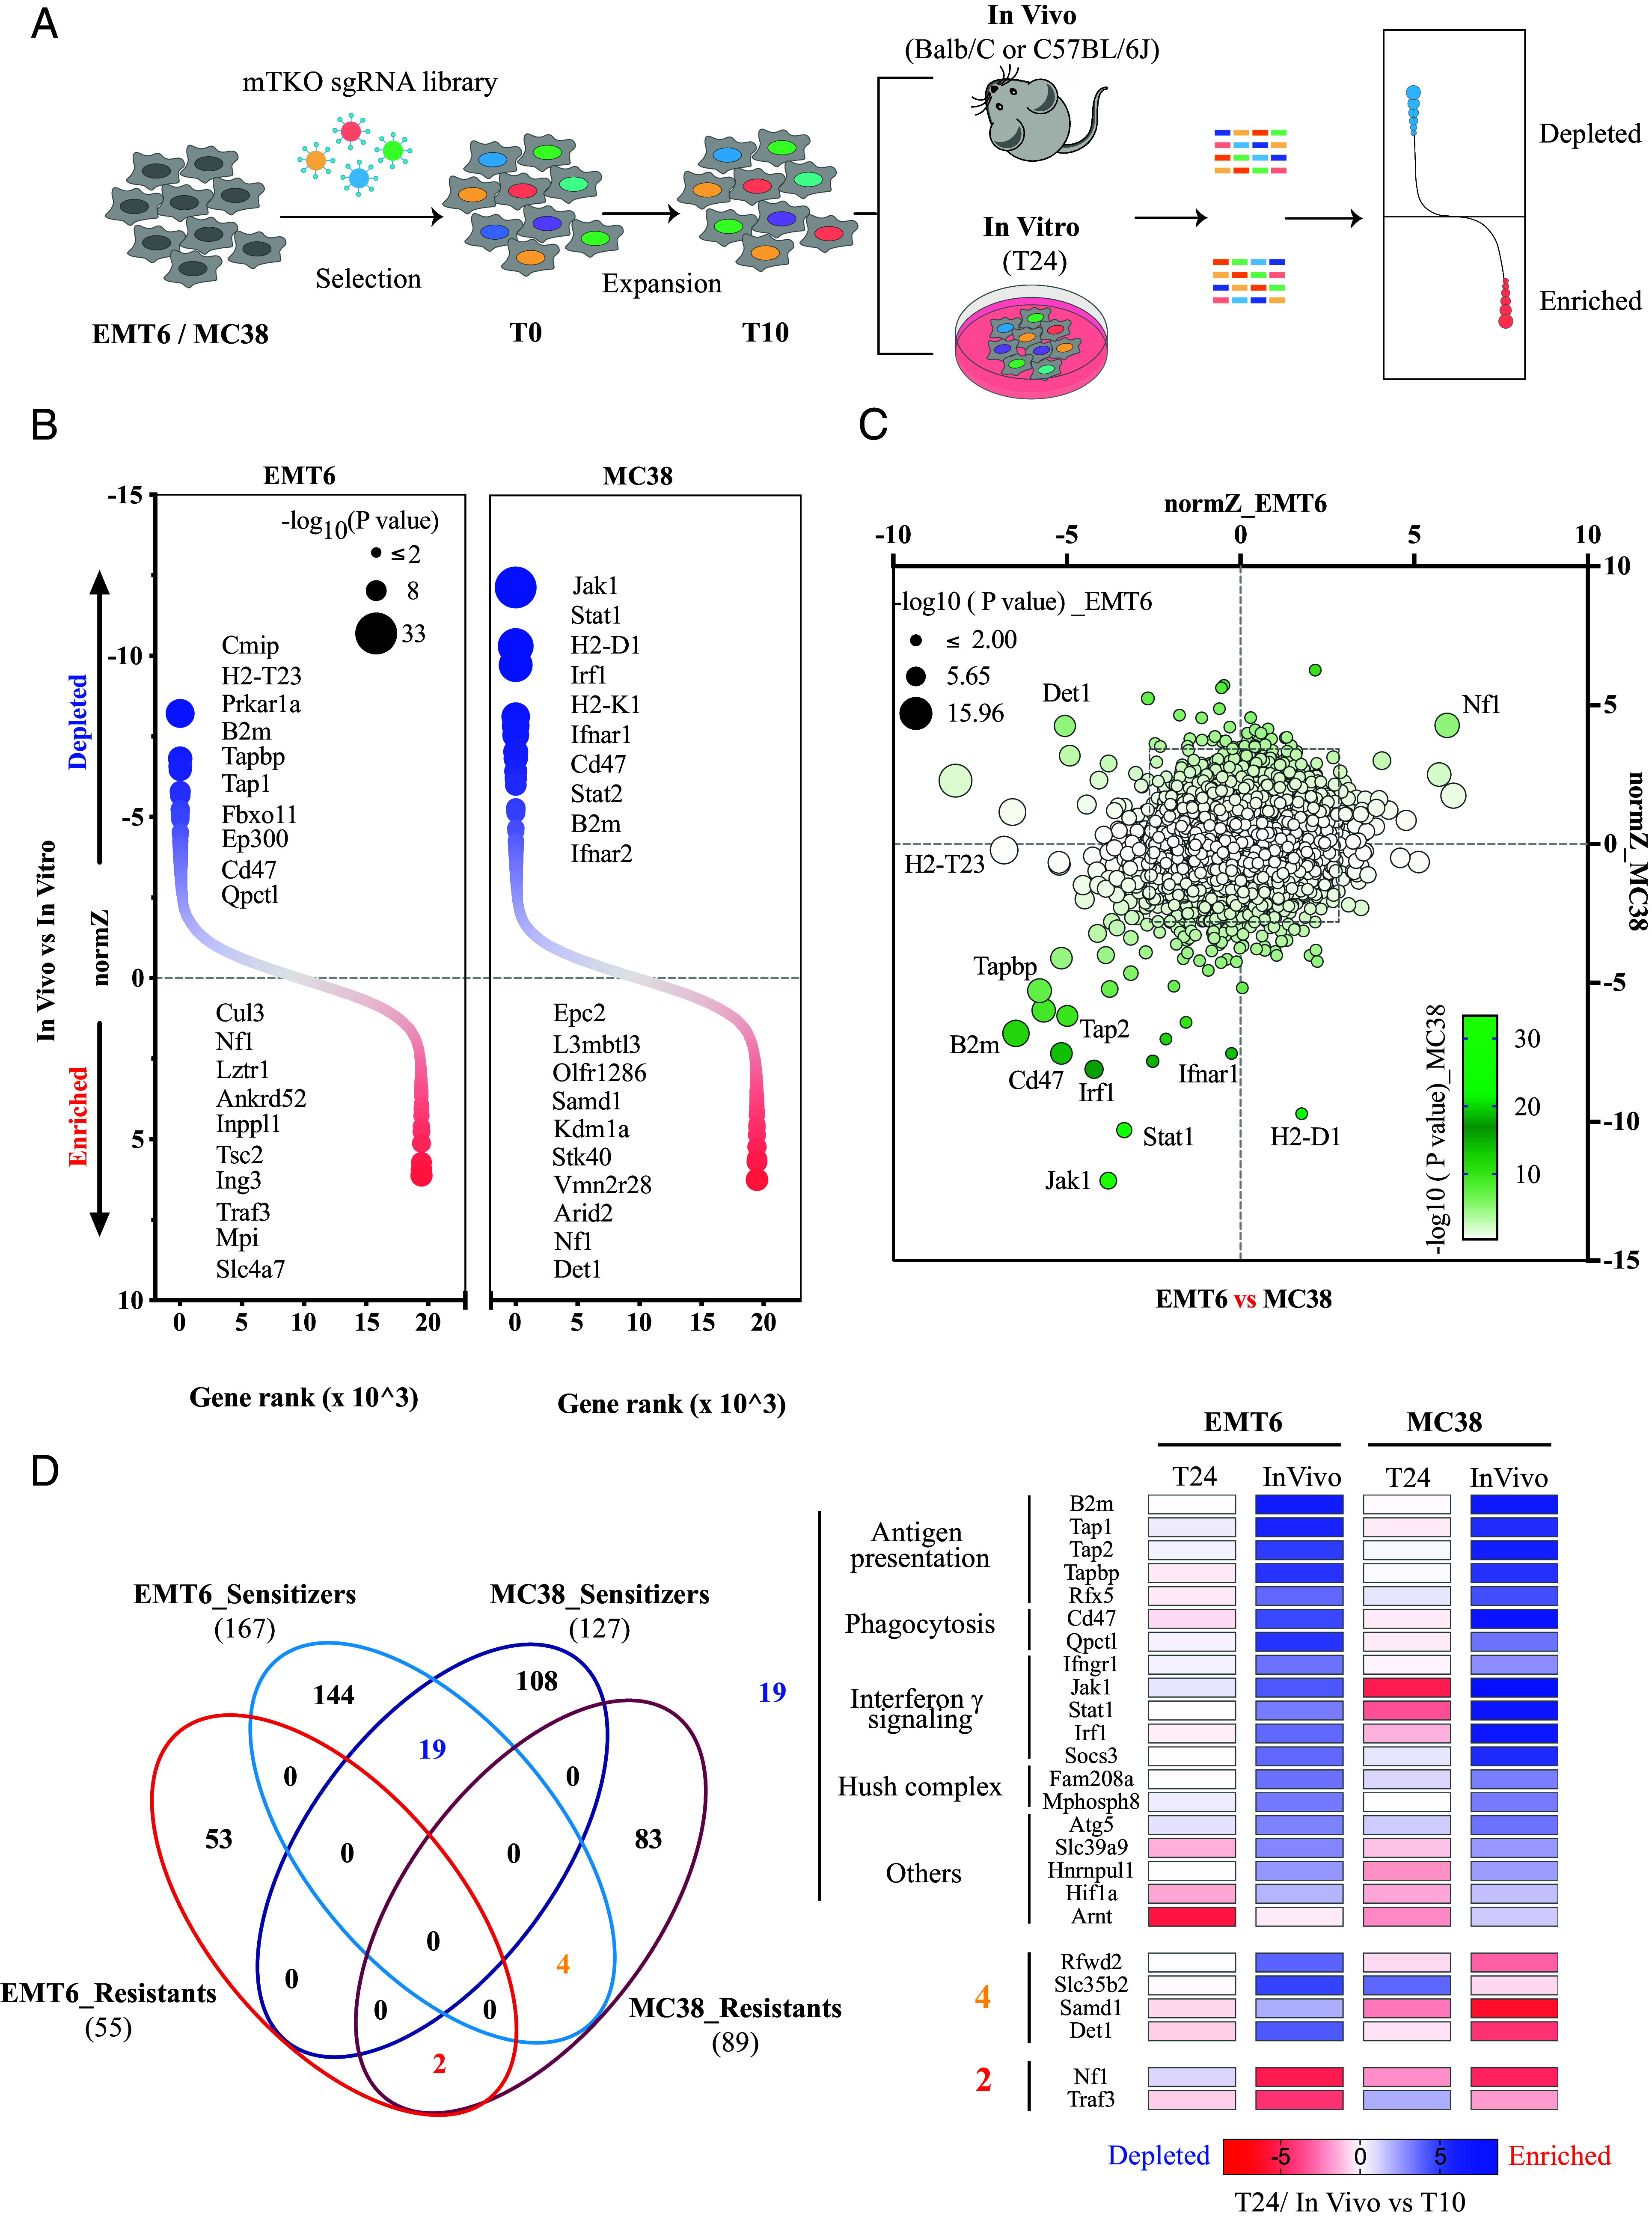
In vivo genome-scale screens uncover the landscape of immune evasion. (A) Schematic diagram showing the whole workflow of our genome-scale CRISPR screens. (B) DrugZ analysis showing gene ranks by in vivo vs. in vitro for genome-scale screens, with circle size corresponding to −log10 (P value). Positive normZ scores (red dots) indicate that the sgRNAs were enriched, while negative normZ scores (blue dots) indicate that the sgRNAs were depleted in the indicated in vivo group. The top 10 genes at each end are listed according to statistical significance. (C) Comparison of screening results between EMT6 and MC38 models. Circle size corresponds to −log10 (P value) in the EMT6 model, while color corresponds to −log10 (P value) in the MC38 model. Representative genes which are common or unique in these two models are labeled. (D) Top hits from the sensitizing end (P value < 0.005) and resistant end (P value < 0.002) are displayed. Left panel, the number of hits identified from both ends within the above cutoff. Right panel, heatmap shows the phenotypic effect of hits that behave consistently or oppositely in these two models. Heatmap was plotted using normZ scores by T24 or In Vivo vs. T10.
To identify immune-dependent regulators, we compared sgRNA abundance between in vivo and in vitro groups with DrugZ algorithm (13), in which negative scores indicate that loss of given gene expression sensitizes tumor cells to host immune microenvironment (also described as immune sensitizer) and positive scores indicate resistance (also described as immune resistants) (Datasets S1 and S2). We identified significant hits from each model (Fig. 1B). Notably, we clearly detected that many immune-sensitizing hits were shared between EMT6 and MC38 (Fig. 1C), such as Jak1/Stat1/Tap1/Tap2/Tapbp/B2m genes, which agree with findings from several recent in vivo screens (5, 11) but not by in vitro coculture study (9). However, the overlap in robust immune-resistant hits was relatively limited. The most noted one in our screens is Nf1. Meanwhile, we also noticed the clear divergence between these two models. For examples, H2-T23 and H2-D1 genes showed strong phenotypes in one model but little in another model. Some genes such as Det1 even behaved oppositely in two models. To get a better understanding of variations in these models, we set a cutoff for both directions (P < 0.005 for immune sensitizers and P < 0.002 for immune-resistant genes) with a preference on the immune-sensitizing side. Consequently, we identified 167/55 immune sensitizers/resistant genes for EMT6 and 127/89 for MC38, respectively (Fig. 1 D, Left panel). Among them, 19 potential immune-sensitizing hits (out of 275) overlapped and were manually classified into 5 categories, including antigen processing and presentation, phagocytosis, IFN-γ signaling, hush complex, and others (Fig. 1 D, Right panel). As mentioned above, these results are consistent with recent publications (5, 6, 11, 14–16). Only 2 (out of 142) genes, Nf1 and Traf3, were identified as shared immune-resistant genes, and four hits were sensitizers in EMT6 but showed as resistant genes in MC38 (Fig. 1 D, Right panel). The distinctive immune landscapes we observed between these two models may reflect inherited differences, since each model has to evolve on its own unique path to escape immune surveillance in their respective hosts.
Secondary Validation CRISPR Screens Reveal Common and Context-Dependent Immune Evasive Genes.
To further validate the top hits we identified from genome-scale screens and to distinguish the common and context-dependent immune regulators, we generated a validation CRISPR library consisting 395 hits with above-mentioned cutoff and 98 control genes (49 core essential and 49 nonessential genes), with 5 sgRNAs per gene, which has total 2,449 sgRNAs (SI Appendix, Fig. S2A and Dataset S3). The quality of this murine putative immune modulators (mPIM) library was evaluated by NGS, which showed the abundance of 90% sgRNAs was distributed within 4.2-fold range (SI Appendix, Fig. S2B). With this library, we proceeded to secondary screens. Besides the initial MC38 and EMT6 models, we also included five more syngeneic models—4T1 (TNBC), EO771 (BC), B16.F10 (Melanoma), RM-1 (Prostate cancer), and ID8 (Ovary cancer). The screens were performed as previously, except that immunocompromised nude mice were included to help us better assess gene function in immune escape (Fig. 2A). We compared the tumor weights from immunocompromised nude mice and immunocompetent mice. As expected, tumors always grew significantly larger in nude mice than they were in immunocompetent WT mice in all models except ID8 (Fig. 2B), which is consistent with differential immune pressure in nude and immunocompetent mice. In the case of the ID8 model, tumors barely grew regardless of whether they were implanted in nude or immunocompetent mice, although surprisingly tumors in immunocompetent host were larger than those in nude mice.
Fig. 2.

Second-round validation screens underpin common and context-dependent immune evasion processes. (A) Schematic diagram showing the screening workflow with mPIM CRISPR-Cas9 library. (B) The weights of tumors from immunocompromised Nude mice or immunocompetent mice. Five tumors per replicate and three replicates from the same background were plotted together. Data were presented as mean ± SD of 15 tumors. Statistical analysis was performed with Student’s t test. ****P < 0.0001; ***P < 0.001; **P < 0.01; *P < 0.05. (C) DrugZ analysis showing gene ranks by immunocompetent, i.e., WT, mice vs. Nude mice of mPIM screens for all seven models, with circle size corresponding to −log10 (P value). Top 10 genes from sensitizing end and top five genes from resisting end are listed by statistical significance. (D) A Venn diagram illustrating the approach for identifying reliable immune evasion genes in each model. Top 50 hits, with CEGs excluded, from each comparison as indicated, were overlaid and genes within the gray background were removed. (E) A histogram showing unique and shared immunosensitizing hits across each model. (F) Jaccard index matrix showing the similarities between any two models.
Again, DrugZ was applied to compare the sgRNA abundance among samples obtained from in vitro culture (T24), in vivo nude mice, and in vivo immunocompetent WT mice (Fig. 2C, SI Appendix, Fig. S2C, and Datasets S4–S11). To reveal high-confidence and phenotypically robust immune-sensitizing hits involving either innate or adaptive immunity for each model, we chose top 50 immune-sensitizing hits from each comparison (WT vs. nude, nude vs. T24, WT vs. T24) (Fig. 2C, SI Appendix, Fig. S2C, and Datasets S5–S11), and discarded those hits which only emerged in the comparison of nude vs. in vitro culture T24 samples. These analyses resulted in lists of putative immune evasive genes (Fig. 2D). Accordingly, we obtained 85, 69, 72, 77, 71, 74, and 70 potential immune-sensitizing genes for EMT6, 4T1, EO771, MC38, B16.F10, RM-1, and ID8 model, respectively (Fig. 2E and Dataset S12). More than 80% (ranging from 74% to 88%) hits were shared with at least one other model (Fig. 2E), indicating that the majority of the genes pivotal for immune escape are common across cancers. Among all 7 models, RM-1 and ID8, as well as EMT6 and 4T1, showed the highest similarity (Fig. 2F). The high similarity between EMT6 and 4T1 may be consistent with their classification as TNBC models and derived from the same host BALB/c mice.
Overview of Immune Evasion Pathways Across Cancer Types.
To systematically unravel common and context-specific immune evasion pathways, we performed gene set overrepresentation enrichment analysis with the above-identified putative immune-sensitizing hits for each model, and top 10 categories from each model were exhibited. In total, we derived a collection of 39 gene sets which can be aggregated into 16 pathways (Fig. 3A). Several pathways were shared by all models, for example, antigen processing and presentation via MHC-I pathways, interferon-mediated signaling pathways, regulation of immune response pathways, and response to virus pathways, which are consistent with a previous study (11). Other sensitizing pathways to host immunity only showed up in a subset of models; for example, heterochromatin organization pathways were depleted in EMT6, 4T1, EO771, MC38, and B16.F10 models, but not in RM-1 and ID8 models, whereas proteoglycan metabolic process pathways were only depleted in EMT6 and 4T1 cells, two TNBC models. We noticed that, even from one aggregated pathway, there are some differences in specific gene sets or differential statistical significance in the same gene set, which indicated the differences on gene level. To display the linkages of genes and enriched GO terms, we performed the cnetplot (Fig. 3B), which clearly displayed the connections between specific genes and enriched GO terms across all seven models. Interestingly, even genes involved in antigen processing and presentation, such as Tap1, Tap2, Tapbp, B2m, H2-D1, H2-K1, and H2-T23, were not captured as immune evasive genes in all models (Fig. 3B). For example, sgRNAs targeting H2-D1 were significantly depleted in EO771, MC38, B16.F10, and MC38, but not in EMT6, 4T1, and RM1 cells, which agree with our results of genome-scale screens (Fig. 1C). Moreover, Tasor (also known as Fam208a), Mphosph8, Pphln1, components of the human silencing hub (HUSH) epigenetic complex (17), were uncovered as immune evasive genes in EMT6, 4T1 EO771, and MC38 cells, while Setdb1 and Atf7ip, subunits of a central heterochromatin regulator complex (18), contributed to immune evasion mainly in EMT6, 4T1, and B16.F10 models (Fig. 3B).
Fig. 3.

Overview of core immune evasion genes across each model. (A) Core pathway enrichment with identified putative immune evasion genes for each model using clusterProfiler. Similar GO terms were manually integrated into one item as indicated (Right). The circle size corresponds to the gene ratio for overrepresentation, while circle color corresponds to the adjusted P value by the Benjamini–Hochberg method. (B) The cnetplot showing gene-GO terms network in the top four categories from each model. (C) Distribution of cancer-intrinsic immune evasion genes across the seven syngeneic model cell lines. (D) Hierarchical clustering showing the phenotypic effect of these 77 core-immune evasion genes by normZ score of In Vitro vs. T10, Nude vs. T10, and WT vs. T10. (E) Similarity matrix showing the Pearson correlation coefficient between H2-T23 and IFN-γ signaling genes. (F) Cell surface expressions of H2-T23 and PD-L1 were measured by flow cytometry on all seven syngeneic model cell lines with or without IFN-γ stimulation (100 ng/mL, 24 h). (G) Radar plots depict eight key immune evasion signatures across all seven models. The plots display the average normZ score of genes, from Nude vs. In Vitro and WT vs. In Vitro comparisons, for defined pathways as follows: Autophagy (Atg3/5/9a/10/12); H2-T23; Cd47-Qpctl; Pd-l1; IFN-γ signaling (Ifngr1/2, Jak1/Stat1/Irf1); Hush complex (Mphosph8/Fam208a/Pphln1); Setdb1–Atf7ip; Antigen processing and presentation (Tap1/2, Tapbp, B2m).
The identification of core immune evasive genes across cancer types is crucial for the discovery of universally applicable anticancer targets. Thus, we further defined the core cancer-intrinsic immune evasive genes as those hits consistently present in three or more of the seven models (Fig. 3C). This yielded 77 genes (Fig. 3D and Dataset S13), which contain most genes involved in major pathways identified above (Fig. 3 A and B), and revealed unidentified immune-sensitizing genes. More importantly, when we took the 3 DrugZ scores of T24 vs. T10, Nude vs. T10, and WT vs. T10 derived from each model and performed the hierarchical clustering for these 77 genes (Dataset S13), it revealed the phenotypic effects in each background and clustered the genes that are from one gene set or one complex, which demonstrates the quality of our screens. These clusters include Hush complex (6, 15) (Fam208a, Pphln1, and Mphosph8), Setdb1–Atf7ip complex (6, 19), Cd47–Qptcl axis (16, 20), Det1 and Rfwd2 (also called Cop1) (5), two components of CRL4COP1/DET1 ubiquitin ligase complex, as well as genes involved in antigen processing and presentation (Tap1/Tapbp/B2m/Tap2/Clec2d/H2-K1/H2-D1) (9, 11, 21) or autophagy (Atg3/Atg12/Atg5/Atg10) (9, 14) (Fig. 3D), which are consistent with the recent studies cited above. Additionally, if a gene was aggregated into a gene set with known function, it would be reasonable to assume the potential similar role of this gene during immune evasion. For example, here, we found that H2-T23 (HLA-E in humans), also known as Qa-1b, a noncanonical MHC-I molecule that suppress natural killer (NK) cells and T cells via inhibitory receptor NKG2A (22), was clustered with genes involved in the IFN-γ signaling pathway such as Ifngr1 (Fig. 3E), indicating that H2-T23 is an important downstream module of IFN-γ signaling-mediated immune escape, which agrees with published literature (11, 23, 24). Interestingly, we noticed that another important immunosuppressive gene Cd274 (Pd-l1), which is also an IFN-γ-inducible gene just like H2-T23 (Fig. 3F), did not cluster together with genes involved in IFN-γ signaling-mediated immune escape. In addition, we observed that depletion of tumor intrinsic H2-T23 expression always caused immune-mediated killing in vivo as long as it is expressed, even at a very low level; however, this was not the case for Cd274. In other words, our data indicate that targeting tumor intrinsic Qa-1b expression is sufficient to rejuvenate Qa-1b-restricted immune cells, but the contribution of tumor intrinsic Cd274 expression is highly context-dependent, as previously reported (25–28).
Based on the phenotypic effects observed in our screens and their consistence with the literature, we propose the immune evasion fingerprints for all seven models we used. These fingerprints encompass eight processes or complexes: Antigen processing and presentation (Tap1/Tap2/Tapbp/B2m), Autophagy (Atg3/Atg5/Atg10/Atg12/Atg9a), Phagocytosis (Cd47/Qpctl), IFN-γ signaling pathway (Ifngr1/Ifngr2/Jak1/Stat1/Irf1), Hush complex (Fam208a/Pphln1/Mphosph8), Setdb1–Atf7ip complex, H2-T23, and Cd274. To present a better view of the phenotypic effects of these eight processes/complexes in each model, we used the average DrugZ scores of all genes in each process/complex from Nude vs. InVitro and WT vs. InVitro comparisons and performed the radar plot (Fig. 3G and Dataset S14). These results revealed the functional consequence upon deficiency of individual process/complex in each model and the difference between immunocompromised nude mice and immunocompetent syngeneic mice.
Mga Functions as an Immune Suppressor in TNBC.
Besides the well-studied immune-sensitizing hits mentioned above among the 77 core immune evasion genes we identified, we are interested in other unexploited genes especially in TNBC models. This is due to the fact that first, EMT6, a TNBC model, was initially utilized to investigate the landscape of immune evasion on genome-scale in immunocompetent mice; Second, besides EMT6, we included 4T1, another well-established TNBC model, in the subsequent validation screens. When we went through the 41 overlapped hits from EMT6 and 4T1 models (Fig. 2F), we found that Mga (Max’s giant associated protein), a large transcription factor with dual-specificity via its N-terminal T-domain DNA binding motif and C-terminal basic helix–loop–helix zipper (bHLHZip) domain (29, 30), was identified as one of top hits in mPIM screens, particularly for TNBC models (Fig. 4A). As a transcriptional coregulator, Mga has the potential to directly or indirectly modulate the expression of numerous genes, encompassing both immune-related and immune-independent pathways. Among Mga’s diverse functions, our study focused specifically on its immunomodulatory effects within the tumor microenvironment, driven by the compelling evidence from our screens, which highlighted Mga’s particular relevance in immune-mediated tumor suppression in TNBC models. By concentrating on Mga’s immune-related functions, we sought to uncover insights into tumor immune evasion mechanisms and potentially identify therapeutic targets for enhancing antitumor immunity in TNBC. To validate the immunosuppressive function of Mga, we generated Mga knockout (KO) clones with the CRISPR-Cas9 technique in 4T1 and EMT6 cells. We verified them by Sanger sequencing (SI Appendix, Fig. S3 A and B) since no reliable commercial antibody was available. Additionally, we included Cd47 KO as a positive control (SI Appendix, Fig. S3C). Compared with 4T1 WT cells, Mga KO didn’t display significant growth defects in vitro (SI Appendix, Fig. S3D). We also used a more sensitivity in vitro competition assay in EMT6 cells and confirmed this result over a longer period (SI Appendix, Fig. S3E). We thus performed a competition assay in nude mice, where Cd47 null cells were significantly depleted, but not Mga null or H2-T23 null cells (SI Appendix, Fig. S3F), which is consistent with our screening data. However, when tumor cells were implanted in immunocompetent BALB/c mice, Mga KO tumors grew slower, which were similar to Cd47 KO tumors (Fig. 4 B and C and SI Appendix, Figs. S3G and S4A). Interestingly, when these cells were implanted in immunodeficient nude mice, we observed that in the 4T1 model, Mga KO tumors were still smaller than WT tumors in nude mice (SI Appendix, Fig. S4B), but the difference was notably less pronounced compared to that seen in immunocompetent mice. On the other hand, EMT6 Mga KO and WT tumors showed no significant difference in growth in nude mice (SI Appendix, Fig. S4C). These results suggest that while Mga depletion may have some intrinsic effects on tumor growth especially in 4T1 cells, its primary tumor-suppressive function is largely dependent on the host immune system, with the extent of this dependence possibly varying between different TNBC models. Taken together, these data demonstrated that Mga may function as an immunosuppressor, but its activity does not appear to depend on macrophage-mediated processes that are still present in nude mice.
Fig. 4.

Mga functions as an immune suppressor in TNBC. (A) A radar plot illustrates the immunosensitizing gene rank of Mga across all 7 models, with the scale displayed in log2. (B) Tumor volume over time for 4T1 WT (black), Cd47 KO (blue), and 2 Mga KO clones (red) cells implanted into immunocompetent BALB/c mice. Data are presented as mean ± SEM. Experiments were repeated at least three times with five tumors per group. (C) Tumor weight for 4T1 WT (black), Cd47 KO (blue), and 2 Mga KO clones (red) cells derived allograft tumors in immunocompetent BALB/c mice. Data were presented as mean ± SEM. Statistical analysis was performed with Student’s t test. **P < 0.01; *P <0.05. (D) Heatmap showing differential transcriptomic expression (P < 0.05 and fold change > 1.5) in WT and Mga KO 4T1 cells with IFN-γ stimulation (100 ng/mL, 24 h). (E) GSEA of Reactome pathways with differentially expressed genes (from D with fold change > 2) in Mga KO 4T1 cells compared with WT control cells with IFN-γ stimulation. The red bar represents up-regulated genes, while the blue bar represents down-regulated genes in Mga KO cells. (F) Volcano plot of differentially expressed genes in Mga KO 4T1 cells compared with WT control cells with IFN-γ stimulation. Red dots denote genes significantly (−log10 P > 5 and fold change > 2) and differentially expressed, while black arrows indicate several MHC-II genes. (G) Cell surface expressions of MHC-II genes were measured by flow cytometry on 4T1 WT and Mga KO cells with IFN-γ stimulation (100 ng/mL, 48 h). (H) The comparisons for expression levels of HLA-DPB1, HLA-DRB1, HLA-DMA, and HLA-DQB1 genes between MGA_H and MGA_L groups in patients with active IFN-γ signaling (n = 609, IFN-γ expression in the top 50%) from TCGA breast cancer cohort (n = 1,218). MGA_H represents patients with MGA expression in the top 200, while MGA_L represents patients with MGA expression in the bottom 200 from patients with active IFN-γ signaling (n = 609) as above defined. The median is highlighted with a red line. Statistical analysis was performed with unpaired Student’s t test. ****P < 0.0001. (I) Stratification of overall survival by MGA expression and IFN-γ signature in TCGA breast cancer cohort with matched curated survival data, selected by MGA and IFN-γ expression level. H (High) represents the upper 50%, while L (Low) represents the lower 50%. Data were analyzed by the log-rank test. **P < 0.01.
To further elucidate the mechanism by which Mga modulates antitumor immunity, we performed CD4+ and CD8+ T cell depletion experiments in both WT and Mga KO 4T1 tumors. Interestingly, depletion of either CD4+ or CD8+ T cells partially rescued the growth inhibition observed in Mga KO tumors (SI Appendix, Fig. S5 A and B). These results suggest that both CD4+ and CD8+ T cells contribute to the antitumor effect of Mga depletion. Flow cytometry analysis confirmed the efficacy of CD4+ and CD8+ T cell depletion in mice carrying WT or Mga KO tumors (SI Appendix, Fig. S5C).
To determine the underlying mechanism, we compared the transcriptome of WT and Mga KO 4T1 cells, both of which were stimulated with IFN-γ to mimic the situation in tumor microenvironment. As shown in Fig. 4D, differential expression analysis showed that 639 genes were significantly up-regulated and 662 down-regulated (Dataset S15, adjusted P < 0.05 and foldchange > 1.5) upon Mga ablation. Gene set enrichment analysis showed up-regulated genes in Mga KO cells are involved in immune-related pathways, including adaptive immune system, GPCR downstream signaling, innate immune system, and neutrophil degranulation; while genes down-regulated are in pathways such as metabolism, posttranslational protein modification, and developmental biology (Fig. 4E). One intriguing result we observed was that several immune-related genes, including a cluster of MHC-II genes, showed altered expression in the adaptive immune system pathway. Specifically, MHC-II genes were up-regulated in Mga KO cells compared to WT cells, both stimulated with IFN-γ (Fig. 4F). Given that MHC-II signaling is essential for CD4+ T cell-dependent immune responses (31), and increasing evidence demonstrated that cancer cell-intrinsic expression of MHC-II modulates the immune microenvironment and responses to immunotherapy (32–35), we investigate this further. To confirm these transcriptomic changes at the protein level, we examined cell surface expression of various immune markers, including MHC-II. Consistent with RNA-seq data, MHC-II protein expression was significantly increased in Mga KO cells compared to that in WT cells upon IFN-γ treatment (Fig. 4G and SI Appendix, Fig. S6A). This effect was observed in both 4T1 and EMT6 cell lines, and in Mga KO pool cells generated with independent sgRNAs (SI Appendix, Fig. S6B). We further investigated the expression of MHC-I, MHC-II, and PD-L1 in WT and Mga KO cells under different concentrations of IFN-γ stimulation, and revealed that Mga KO cells showed increased expression of MHC-II, while MHC-I and PD-L1 levels remained comparable between WT and Mga KO cells (SI Appendix, Fig. S6C). To investigate the potential mechanism, we examined the expression of Ciita, a master regulator of MHC-II transcription. Interestingly, we observed no or a slight increase in Ciita expression in Mga KO cells compared to WT cells (SI Appendix, Fig. S6 D and E), suggesting that additional mechanisms may be involved in Mga’s regulation on the immune landscape. In TCGA-BRCA cancer patients, we also observed that the expression levels of several MHC-II genes, such as HLA-DPB1, HLA-DRB1, HLA-DMA, and HLA-DQB1, were significantly higher in the group with low MGA expression, particularly for patients with active IFN-γ signaling (Fig. 4H), but not those with lessen IFN-γ signaling (SI Appendix, Fig. S6F). Importantly, low MGA expression in TCGA-BRCA patients shows a better prognosis, especially for those with active IFN-γ signaling (Fig. 4I). These findings collectively suggest that Mga plays a role in modulating the tumor immune landscape, potentially through multiple mechanisms including, but not limited to, MHC-II regulation. This highlights the potential of exploring Mga as a therapeutic target in breast cancer, though further investigation is needed to fully elucidate the mechanisms involved.
Mga Depletion Remodels the Intratumoral Immune Landscape in TNBC.
To further validate the immune suppressive function of Mga and the potential involvement of MHC-II signaling, we performed scRNA-seq experiments on three independent tumors derived from 4T1 WT or Mga KO cells implanted on immunocompetent BALB/c mice. A total of 53,458 cells passed quality control, of which 28,647 and 24,901 cells were derived from WT and Mga KO tumors, respectively (SI Appendix, Fig. S7A). Cell clustering, based on marker gene expressions, yielded 18 distinct clusters (Fig. 5A and SI Appendix, Fig. S7B), including most immune cell types, such as B cells, T cells, macrophages, and DCs, as well as tumor epithelial cells. Statistical analysis clearly showed that fewer tumor cells but more immune cell infiltrations, especially for macrophages and DCs, in Mga KO tumors, compared with those of WT tumors (Fig. 5B). To further elucidate the changes in cell–cell communications, we performed CellChat (36) analysis (Fig. 5 C–E), widely used to quantitatively infer and analyze intercellular communication networks. Overall, Mga KO tumors had differential interaction strengths of communication networks compared to WT tumors and showed quite different receiver and sender patterns (Fig. 5C). Next, we compared the information flow (i.e., the overall communication probability) for each signaling pathway between WT and Mga KO. We found that some pathways, such as LCK, TENASCIN, IL1, SELPLG, CD86, and CSF, maintained similar flow between WT and Mga KO (black in Fig. 5D). In contrast, other pathways prominently change their information flow at Mga KO as compared to WT. In detail, MHC-II, SEMA7, JAM, CD34, and several other signaling flow were markedly increased upon Mga KO (red in Fig. 5D), while PERIOSTIN, CD52, COMPLEMENT, OSM, and several other signaling flow were decreased (blue in Fig. 5D). Interestingly, in Mga KO tumors, macrophages and DCs as primary senders contributed to the majority of MHC-II signaling flow, while T cells and plasmacytoid dendritic cells (pDCs) as the primary receiver (Fig. 5E). Notably, among cell clusters of WT tumors, CellChat analysis showed no significant communication of the MHC-II signaling pathway. These observations suggest that Mga depletion leads to a remodeling of the tumor immune microenvironment, potentially enhancing antigen presentation and T cell activation.
Fig. 5.

scRNA-seq unveils that Mga depletion primes intratumoral MHC-II signaling in TNBC. (A) Integrated and separated UMAPs of cells from 4T1 WT (n = 3) and Mga KO (n = 3) tumors, annotated by cell types with different colors as indicated. NKT, natural killer T; cDC, classical dendritic cells; pDCs, plasmacytoid dendritic cells. (B) Cell proportions of each cell type for WT and Mga KO tumors. Three replicates were integrated as one for display. (C) Heatmap showing the interaction strength of the cell–cell communication network comparing Mga KO to WT, where red edges represent increased signaling strength and blue edges represent decreased signaling strength. (D) Bar plot showing all significant signaling pathways and their difference of overall information flow within the inferred networks between Mga KO and WT. The top signaling pathways colored blue are more enriched in WT, the middle ones colored black are equally enriched in WT and Mga KO, and the bottom ones colored red are more enriched in Mga KO. (E) The inferred MHC-II signaling networks in Mga KO tumors. Circle sizes are proportional to the number of cells in each cell group and edge width represents the communication probability. (F) Integrated and separated UMAPs of T cell populations from A, annotated by cell types with different colors as indicated. The feature plot showed the enrichment and localization of T cell markers, Cd3g, Mki67, Cd74, Tcf7, Cd4, Tbx21, Ifng, Gata3, Cd8a, Klrd1, Prf1, Gzmb, Foxp3, Ctla4, Pdcd1, and Havcr2, respectively. Double negative T, Cd4− Cd8− Cd3g+ T cells; Th1, type 1T helper; Th2, type 2T helper; Treg, regulatory Cd4+ T cells. (G) Percentages of each T cell subtype for WT and Mga KO tumors (3 vs. 3). Statistical analysis was performed with unpaired Student’s t test. (H) Dotplot showing IFN-γ expression in each T cell subtype from WT and Mga KO tumors.
To further substantiate our findings, we conducted a more comprehensive subclustering of T cells (Fig. 5F and SI Appendix, Fig. S7 C and D) and found that, in Mga-deficient tumors, Cd4+ T cells show a heightened polarization toward the T helper 1 (Th1) subtype (Ifng+ Tbx21+) when compared to WT tumors (Fig. 5 F and G), although accompanied with more regulatory T cells (Treg) (Ctla4+ Foxp3+). Intriguingly, Mga KO also led to less exhausted (Pdcd1+Havcr2+) (P = 0.046) and effector Cd8+ T cells (P= 0.083). Th1 subtype CD4+ T cells are characterized by their secretion of IFN-γ and enhancing CD8+ T cells and macrophage-based antitumor immune responses (37). We therefore further examined the IFN-γ expression level in each subtype. As shown in Fig. 5H, exhausted CD8+ and Th1 Cd4+ T cells are major sources of IFN-γ in tumor microenvironment, and there is a substantial increase of IFN-γ in strength and fraction in Mga KO tumors. These observations strongly support our hypothesis that Mga depletion leads to a more inflamed tumor microenvironment with enhanced antitumor immune responses.
Discussion
Understanding the mechanisms underlying immune evasion is crucial for developing novel anticancer modalities. To systematically uncover tumor-intrinsic genetic modulators involved in immune escape in tumor microenvironment, we performed genome-scale in vivo CRISPR screens in two syngeneic models and later expanded up to seven syngeneic models with a focused validation library. We not only identified a series of new genetic determinants of antitumor immunity, as well as recently defined immune regulators, such as H2-T23, Hush complex, and Adar1 (38); but also provided a valuable dataset that can be further exploited for deciphering gene–gene or gene–cancer type interactions. Without a doubt, this will help us better understand tumor immune evasion and pave the way for developing new therapeutics. Importantly, we uncovered that Mga depletion elicited an antitumor immune response and inhibited tumor growth in TNBC. Our findings suggest that Mga plays a role in modulating the tumor immune landscape, though the precise mechanisms require further investigation. In support of this, MGA expression shows inverse correlation with prognosis in TCGA-BRCA patients even though this correlation comes with certain limitations. The TCGA data represent bulk tumor samples, which include both tumor cells and various immune cell populations. As such, our current analysis cannot definitively distinguish whether the observed MHC-II expression patterns are primarily attributable to tumor cells, immune cells such as dendritic cells and macrophages, or a combination of both.
Our study suggests that MGA could be a potential therapeutic target for TNBC. Unfortunately, there are currently no available inhibitors for MGA. However, recent studies have demonstrated that MGA is a bona fade substrate of USP7 (39–41), a ubiquitin-specific peptidase, and highly potent inhibitors targeting USP7 have been developed for cancer therapy because of its pivotal roles in multiple key cellular processes, including tumor suppression, cell cycle, epigenetics, DNA damage and replication, immune response, and importantly, the MDM2–P53 pathway (42). Thus, while future endeavors are needed to develop selective inhibitors targeting MGA, it may be worthwhile to explore the efficacy of USP7 inhibitors beyond the MDM2–P53 axis in TNBC (43), especially in combination with immunotherapy.
The transcription factor MGA (Max’s giant associated protein), a heterodimeric partner of the MYC-interacting protein MAX, is thought to be an antagonist of MYC function (44). MGA regulates gene expression via recruiting noncanonical polycomb repressive complex PRC1.6 (ncPRC1.6) to specific loci by DNA binding-dependent and -independent mechanisms (30). MGA was found to be significantly mutated or deleted in a wide range of cancers, including lung adenocarcinomas and colon carcinomas, suggesting that MGA may act as a tumor suppressor (45, 46). Meanwhile, some studies demonstrated that MGA mutation status could predict the good outcome of patients treated with immune checkpoint inhibitors in lung adenocarcinomas (47, 48). As a transcriptional coregulator, MGA likely modulates the expression of numerous genes, both directly and indirectly, potentially influencing a wide array of cellular processes. Our study focused primarily on MGA’s role in immune-related pathways, but it is important to acknowledge that MGA’s functions may extend beyond immunomodulation. Here, we propose that the inactivation of Mga may possess immune modulatory effects against breast cancer. It is of particular interest to further investigate the context-dependent effect of MGA across cancers and explore the potential roles of ncPRC1.6 in the regulation of immune-related genes and subsequent antitumor immune responses. Furthermore, our RNA-seq and scRNA-seq data also revealed some alterations in cytokines or chemokines upon Mga depletion, which may contribute to the observed antitumor immune responses. Further research endeavors are warranted to confirm these findings and elucidate the intricate networks of MGA’s function, which may help us better understand the context-dependent effects associated with MGA deficiency and thereby facilitate the application of MGA inhibition in cancer treatment.
Materials and Methods
In Vivo CRISPR Screens and Data Analysis.
For genome-scale screens, 200 million EMT6 or MC38 cells were infected with the lentiviral mTKO library containing 94,528 gRNAs that target 19,069 protein-coding genes at a MOI ~ 0.25 to keep every gRNA representation in at least ~500 cells. 24 h after infection, cells were selected with puromycin for 72 h to eliminate uninfected cells, then 20 million cells were taken from the pool as T0 samples. The rest were split into 2 (EMT6) or 4 (MC38) replicates, and passaged for 10 d before being implanted into both flanks of BALB/c (EMT6) or C57BL/6J (MC38) mice, 5 (EMT6) or 3 (MC38) million cells mixed with Matrigel (1:1) were injected per tumor, 30 mice per replicate (~3,000 coverage per replicate for EMT6, and ~2,000 coverage per replicate for MC38), in total 60 mice for EMT6 and 120 mice for MC38.
Genomic DNA was extracted and PCR amplified with primers harboring Illumina TruSeq adapters with i5 and i7 barcodes, the resulting libraries were sequenced on Illumina NextSeq 500 High Output platform to determine gRNA representations.
Raw reads from NGS were processed as previously reported (13). The DrugZ algorithm was used to compare the difference between samples from different backgrounds, which provides a gene-level normZ score with statistical significance, a more negative normZ score indicates more sgRNA depletion in the experimental group compared with the control group.
RNA‐seq and Data Analysis.
4T1 WT or Mga KO cells were treated with vehicle or IFN-γ (100 ng/mL) for 24 h (three biological replicates), and then, total RNA was extracted using the RNeasy Mini Kit (Qiagen, 74104) according to the manufacturer’s instructions. The libraries were prepared with NEBNext Ploy(A) mRNA Magnetic Isolation Module (E7490L, New England Biolabs), NEBNext Ultra II Directional RNA Library Prep Kit for Illumina (E7760L, New England Biolabs) and NEBNext Multiplex Oligos for Illumina (E6609S, New England Biolabs), and sequencing on an Illumina NextSeq 550 system to generate 75 bp fragments from paired‐ends, completed by Cancer Genomics Center at the University of Texas Health Science Center at Houston.
For RNA‐seq data analysis, the raw reads were first processed using AfterQC (49) (Version 0.9.7, https://github.com/OpenGene/AfterQC) for data filtering, trimming, error removing, and quality control. Genome mapping was carried out using HISAT2 software (50) (v2.1.0) with the mouse reference genome (UCSC GRCm38/mm10). Reads in features were counted using htseq-count (v0.6.1p1) as a part of HTSeq (51) (https://htseq.readthedocs.io/en/latest/). DESeq2 (52) (v3.18) was used to identify significantly differentially expressed genes with a cutoff (adjusted P-value < 0.05 and fold change > 1.5).
Animals.
Six- to eight-week-old C57BL/6J (Strain #:000664), BALB/cJ (Strain #:000651), and Nude mice (Strain #:002019) were purchased from The Jackson Laboratory and housed and handled according to the regulations of UT MD Anderson cancer center. All experimental procedures were conducted according to the protocols approved by the Institutional Animal Care and Use Committee at MD Anderson Cancer Center under protocol number 00001106.
Sequencing of scRNA-seq Libraries.
The scRNA-seq libraries were sequenced on the Illumina NovaSeq platform in a read length of 150 bp (paired-end) under a read depth of at least 200 million read pairs per library at Novogene USA. The original sequencing data file was transformed into sequenced reads (raw reads) by CASAVA base recognition (base calling). Raw reads were stored in FASTQ format files.
Data Processing and Cell–Cell Communication Analysis of scRNA-seq Data.
Cell Ranger (v6.3) was used to perform the reads alignment of sequencing raw data for the scRNA-seq matrices generation. Scanpy (53) was used for processing the scRNA-seq data. Briefly, cells with more than 200 genes expressed, less than 10,000 counts/cell, less than 20% mitochondrial genes, less than 20% ribosomal (Rpl) genes, and less than 15% Rps genes were kept. Genes expressed in more than 20 cells were kept. Then we normalized and log-transformed the gene expression for each cell. 2,000 highly variable genes were selected for the next steps. The total counts, percentages of mitochondrial reads, and percentages of ribosomal reads were regressed out before scaling the data. After dimension reduction, the six datasets (3 Mga KO vs. 3 WT) were integrated by Harmony to remove batch effects. We clustered the cells by Leiden algorithm (resolution = 0.6). Cell types were annotated based on marker genes identified by the Wilcoxon test. The integrated scRNA-seq datasets were split by genotypes and processed to CellChat (36) analysis. CellChat was used to compare the ligand–receptor interaction-based cell–cell communications for Mga KO and WT datasets with such parameters: log fold change ≥ 1, P-value < 0.05, trimean = 0.25.
Statistical Analysis.
All data were plotted as mean with SEM or with SD as indicated, and statistical analysis was performed with the unpaired t test or others as indicated.
Details on cell lines and antibodies, CRISPR-Cas9 gene KO techniques, CRISPR-Cas9 library design and construction, genomic DNA extraction, in vitro and in vivo competition assays, cell growth measurement, plasmid construction and lentivirus infection, quantitative RT-PCR analysis, flow cytometry analysis of Ciita expression, in vivo T cell depletion experiments and library preparation for scRNA-seq are available in SI Appendix.
Supplementary Material
Appendix 01 (PDF)
Dataset S01 (XLSX)
Dataset S02 (XLSX)
Dataset S03 (XLSX)
Dataset S04 (XLSX)
Dataset S05 (XLSX)
Dataset S06 (XLSX)
Dataset S07 (XLSX)
Dataset S08 (XLSX)
Dataset S09 (XLSX)
Dataset S10 (XLSX)
Dataset S11 (XLSX)
Dataset S12 (XLSX)
Dataset S13 (XLSX)
Dataset S14 (XLSX)
Dataset S15 (XLSX)
Acknowledgments
We thank all members of the Chen laboratory for their help and constructive discussion. We thank MD Anderson’s Science Park Next-Generation Sequencing (NGS) Facility and Dr. Traver Hart’s group for their help with CRISPR library NGS (supported by MD Anderson’s NIH Cancer Center Support Grant, P30CA016672). This work was supported in part by institutional funds and the Pamela and Wayne Garrison Distinguished Chair in Cancer Research. J.C. also received support from Cancer Prevention and Research Institute of Texas (CPRIT) (RP160667 and RP180813) and NIH/National Cancer Institute (CA193124, CA210929, CA216911, CA216437, CA274234, and CA275712). T.H. received support from NIH (R35GM130119). T.H. is also an Andrew Sabin Family Fellow and a CPRIT Scholar in Cancer Research. We thank Single Cell Genomics Core at Baylor College of Medicine (BCM) for scRNA-seq library preparations, partially supported by NIH shared instrument grants (S10OD023469 and S10OD025240), P30EY002520, and CPRIT grant RP200504; also thank the Cytometry and Cell Sorting Core at Baylor College of Medicine with funding from the CPRIT Core Facility Support Award (CPRIT-RP180672), the NIH (CA125123 and RR024574), and the assistance of Joel M. Sederstrom. We thank the technical support staff from Cancer Genomics Center at the University of Texas Health Science Center at Houston for their help with RNA-seq (CPRITRP180734).
Author contributions
X.F., K.J., and J.C. designed research; X.F., C.Y., Y.H., D.S., C.W., L.L.W., L.Y., M.T., S.L., Z.C., D.Z., S.W., S.Z., J.Z., H.Z., L.N., and M.H. performed research; X.F., C.Y., Y.H., J.-I.P., T.H., and D.J. analyzed data; and X.F., C.Y., K.J., and J.C. wrote the paper.
Competing interests
The authors declare no competing interest.
Footnotes
This article is a PNAS Direct Submission.
Contributor Information
Xu Feng, Email: fengxu@njmu.edu.cn.
Dadi Jiang, Email: djiang2@mdanderson.org.
Kuirong Jiang, Email: jiangkuirong@njmu.edu.cn.
Junjie Chen, Email: jchen8@mdanderson.org.
Data, Materials, and Software Availability
Bulk in vitro RNA-seq and in vivo scRNA-seq data have been deposited in Gene Expression Omnibus under Accession No. GSE249760 (54, 55). All the codes used in this study are accessed at: https://github.com/hyjforesight/Mga_KO_vs_WT (56). All other data are included in the manuscript and/or supporting information.
Supporting Information
References
- 1.Hanahan D., Weinberg R. A., Hallmarks of cancer: The next generation. Cell 144, 646–674 (2011). [DOI] [PubMed] [Google Scholar]
- 2.Robert C., et al. , Nivolumab in previously untreated melanoma without BRAF mutation. N. Engl. J. Med. 372, 320–330 (2015). [DOI] [PubMed] [Google Scholar]
- 3.Reck M., et al. , Pembrolizumab versus chemotherapy for PD-L1-positive non-small-cell lung cancer. N. Engl. J. Med. 375, 1823–1833 (2016). [DOI] [PubMed] [Google Scholar]
- 4.Yarchoan M., Hopkins A., Jaffee E. M., Tumor mutational burden and response rate to PD-1 inhibition. N. Engl. J. Med. 377, 2500–2501 (2017). [DOI] [PMC free article] [PubMed] [Google Scholar]
- 5.Wang X., et al. , In vivo CRISPR screens identify the E3 ligase Cop1 as a modulator of macrophage infiltration and cancer immunotherapy target. Cell 184, 5357–5374.e5322 (2021). [DOI] [PMC free article] [PubMed] [Google Scholar]
- 6.Griffin G. K., et al. , Epigenetic silencing by SETDB1 suppresses tumour intrinsic immunogenicity. Nature 595, 309–314 (2021). [DOI] [PMC free article] [PubMed] [Google Scholar]
- 7.Li F., et al. , In vivo epigenetic CRISPR screen identifies Asf1a as an immunotherapeutic target in Kras-mutant lung adenocarcinoma. Cancer Discov. 10, 270–287 (2020). [DOI] [PMC free article] [PubMed] [Google Scholar]
- 8.Manguso R. T., et al. , In vivo CRISPR screening identifies Ptpn2 as a cancer immunotherapy target. Nature 547, 413–418 (2017). [DOI] [PMC free article] [PubMed] [Google Scholar]
- 9.Lawson K. A., et al. , Functional genomic landscape of cancer-intrinsic evasion of killing by T cells. Nature 586, 120–126 (2020). [DOI] [PMC free article] [PubMed] [Google Scholar]
- 10.Dai M., et al. , In vivo genome-wide CRISPR screen reveals breast cancer vulnerabilities and synergistic mTOR/Hippo targeted combination therapy. Nat. Commun. 12, 3055 (2021). [DOI] [PMC free article] [PubMed] [Google Scholar]
- 11.Dubrot J., et al. , In vivo CRISPR screens reveal the landscape of immune evasion pathways across cancer. Nat. Immunol. 23, 1495–1506 (2022). [DOI] [PubMed] [Google Scholar]
- 12.Wang C., et al. , Integrated screens uncover a cell surface tumor suppressor gene KIRREL involved in Hippo pathway. Proc. Natl. Acad. Sci. U.S.A. 119, e2121779119 (2022). [DOI] [PMC free article] [PubMed] [Google Scholar]
- 13.Colic M., et al. , Identifying chemogenetic interactions from CRISPR screens with drugZ. Genome Med. 11, 52 (2019). [DOI] [PMC free article] [PubMed] [Google Scholar]
- 14.Yamamoto K., et al. , Autophagy promotes immune evasion of pancreatic cancer by degrading MHC-I. Nature 581, 100–105 (2020). [DOI] [PMC free article] [PubMed] [Google Scholar]
- 15.Tunbak H., et al. , The HUSH complex is a gatekeeper of type I interferon through epigenetic regulation of LINE-1s. Nat. Commun. 11, 5387 (2020). [DOI] [PMC free article] [PubMed] [Google Scholar]
- 16.Logtenberg M. E. W., et al. , Glutaminyl cyclase is an enzymatic modifier of the CD47- SIRPalpha axis and a target for cancer immunotherapy. Nat. Med. 25, 612–619 (2019). [DOI] [PMC free article] [PubMed] [Google Scholar]
- 17.Tchasovnikarova I. A., et al. , Epigenetic silencing by the HUSH complex mediates position-effect variegation in human cells. Science 348, 1481–1485 (2015). [DOI] [PMC free article] [PubMed] [Google Scholar]
- 18.Timms R. T., Tchasovnikarova I. A., Antrobus R., Dougan G., Lehner P. J., ATF7IP-mediated stabilization of the histone methyltransferase SETDB1 is essential for heterochromatin formation by the HUSH complex. Cell Rep. 17, 653–659 (2016). [DOI] [PMC free article] [PubMed] [Google Scholar]
- 19.Hu H., et al. , Targeting the Atf7ip-Setdb1 complex augments antitumor immunity by boosting tumor immunogenicity. Cancer Immunol. Res. 9, 1298–1315 (2021). [DOI] [PMC free article] [PubMed] [Google Scholar]
- 20.Mair B., et al. , High-throughput genome-wide phenotypic screening via immunomagnetic cell sorting. Nat. Biomed. Eng. 3, 796–805 (2019). [DOI] [PubMed] [Google Scholar]
- 21.Garrido G., et al. , Tumor-targeted silencing of the peptide transporter TAP induces potent antitumor immunity. Nat. Commun. 10, 3773 (2019). [DOI] [PMC free article] [PubMed] [Google Scholar]
- 22.Creelan B. C., Antonia S. J., The NKG2A immune checkpoint—A new direction in cancer immunotherapy. Nat. Rev. Clin. Oncol. 16, 277–278 (2019). [DOI] [PubMed] [Google Scholar]
- 23.Kamiya T., Seow S. V., Wong D., Robinson M., Campana D., Blocking expression of inhibitory receptor NKG2A overcomes tumor resistance to NK cells. J. Clin. Invest. 129, 2094–2106 (2019). [DOI] [PMC free article] [PubMed] [Google Scholar]
- 24.Freeman A. J., et al. , Natural killer cells suppress T cell-associated tumor immune evasion. Cell Rep. 28, 2784–2794.e2785 (2019). [DOI] [PubMed] [Google Scholar]
- 25.Juneja V. R., et al. , PD-L1 on tumor cells is sufficient for immune evasion in immunogenic tumors and inhibits CD8 T cell cytotoxicity. J. Exp. Med. 214, 895–904 (2017). [DOI] [PMC free article] [PubMed] [Google Scholar]
- 26.Lau J., et al. , Tumour and host cell PD-L1 is required to mediate suppression of anti-tumour immunity in mice. Nat. Commun. 8, 14572 (2017). [DOI] [PMC free article] [PubMed] [Google Scholar]
- 27.Lin H., et al. , Host expression of PD-L1 determines efficacy of PD-L1 pathway blockade-mediated tumor regression. J. Clin. Invest. 128, 1708 (2018). [DOI] [PMC free article] [PubMed] [Google Scholar]
- 28.Tang H., et al. , PD-L1 on host cells is essential for PD-L1 blockade-mediated tumor regression. J. Clin. Invest. 128, 580–588 (2018). [DOI] [PMC free article] [PubMed] [Google Scholar]
- 29.Qin J., et al. , Mga safeguards embryonic stem cells from acquiring extraembryonic endoderm fates. Sci. Adv. 7, eabe5689 (2021). [DOI] [PMC free article] [PubMed] [Google Scholar]
- 30.Stielow B., et al. , L3MBTL2 and E2F6 determine genomic binding of the non-canonical Polycomb repressive complex PRC1.6. PLoS Genet. 14, e1007193 (2018). [DOI] [PMC free article] [PubMed] [Google Scholar]
- 31.Roche P. A., Furuta K., The ins and outs of MHC class II-mediated antigen processing and presentation. Nat. Rev. Immunol. 15, 203–216 (2015). [DOI] [PMC free article] [PubMed] [Google Scholar]
- 32.Johnson A. M., et al. , Cancer cell-intrinsic expression of MHC class II regulates the immune microenvironment and response to anti-PD-1 therapy in lung adenocarcinoma. J. Immunol. 204, 2295–2307 (2020). [DOI] [PMC free article] [PubMed] [Google Scholar]
- 33.Chan K. L., et al. , Inhibition of the CtBP complex and FBXO11 enhances MHC class II expression and anti-cancer immune responses. Cancer Cell 40, 1190–1206.e9 (2022), 10.1016/j.ccell.2022.09.007. [DOI] [PMC free article] [PubMed] [Google Scholar]
- 34.Zeng Z., et al. , Hippo signaling pathway regulates cancer cell-intrinsic MHC-II expression. Cancer Immunol. Res. 10, 1559–1569 (2022). [DOI] [PubMed] [Google Scholar]
- 35.Kasuga Y., et al. , FBXO11 constitutes a major negative regulator of MHC class II through ubiquitin-dependent proteasomal degradation of CIITA. Proc. Natl. Acad. Sci. U.S.A. 120, e2218955120 (2023). [DOI] [PMC free article] [PubMed] [Google Scholar]
- 36.Jin S., et al. , Inference and analysis of cell-cell communication using Cell Chat. Nat. Commun. 12, 1088 (2021). [DOI] [PMC free article] [PubMed] [Google Scholar]
- 37.Speiser D. E., Chijioke O., Schaeuble K., Munz C., CD4(+) T cells in cancer Nat. Cancer 4, 317–329 (2023). [DOI] [PubMed] [Google Scholar]
- 38.Ishizuka J. J., et al. , Loss of ADAR1 in tumours overcomes resistance to immune checkpoint blockade. Nature 565, 43–48 (2019). [DOI] [PMC free article] [PubMed] [Google Scholar]
- 39.Liu C., et al. , USP7 represses lineage differentiation genes in mouse embryonic stem cells by both catalytic and noncatalytic activities. Sci. Adv. 9, eade3888 (2023). [DOI] [PMC free article] [PubMed] [Google Scholar]
- 40.Sijm A., et al. , USP7 regulates the ncPRC1 Polycomb axis to stimulate genomic H2AK119ub1 deposition uncoupled from H3K27me3. Sci. Adv. 8, eabq7598 (2022). [DOI] [PMC free article] [PubMed] [Google Scholar]
- 41.Nie L., et al. , USP7 substrates identified by proteomics analysis reveal the specificity of USP7. Genes Dev. 36, 1016–1030 (2022). [DOI] [PMC free article] [PubMed] [Google Scholar]
- 42.Bhattacharya S., Chakraborty D., Basu M., Ghosh M. K., Emerging insights into HAUSP (USP7) in physiology, cancer and other diseases. Signal. Transduct. Target. Ther. 3, 17 (2018). [DOI] [PMC free article] [PubMed] [Google Scholar]
- 43.Yi J., et al. , Inhibition of USP7 induces p53-independent tumor growth suppression in triple-negative breast cancers by destabilizing FOXM1. Cell Death Differ. 30, 1799–1810 (2023). [DOI] [PMC free article] [PubMed] [Google Scholar]
- 44.Conacci-Sorrell M., McFerrin L., Eisenman R. N., An overview of MYC and its interactome. Cold Spring Harb. Perspect. Med. 4, a014357 (2014). [DOI] [PMC free article] [PubMed] [Google Scholar]
- 45.Mathsyaraja H., et al. , Loss of MGA repression mediated by an atypical polycomb complex promotes tumor progression and invasiveness. eLife 10, e64212 (2021). [DOI] [PMC free article] [PubMed] [Google Scholar]
- 46.Llabata P., et al. , Multi-omics analysis identifies MGA as a negative regulator of the MYC pathway in lung adenocarcinoma. Mol. Cancer Res. 18, 574–584 (2020). [DOI] [PMC free article] [PubMed] [Google Scholar]
- 47.Sun L., et al. , MGA mutation as a novel biomarker for immune checkpoint therapies in non-squamous non-small cell lung cancer. Front. Pharmacol. 12, 625593 (2021). [DOI] [PMC free article] [PubMed] [Google Scholar]
- 48.Qu Y., et al. , Predictive value of max’s giant associated protein mutation in outcomes of lung adenocarcinoma patients treated with immune checkpoint inhibitors. Front. Cell Dev. Biol. 9, 728647 (2021). [DOI] [PMC free article] [PubMed] [Google Scholar]
- 49.Chen S., et al. , AfterQC: Automatic filtering, trimming, error removing and quality control for fastq data. BMC Bioinf. 18, 80 (2017). [DOI] [PMC free article] [PubMed] [Google Scholar]
- 50.Kim D., Paggi J. M., Park C., Bennett C., Salzberg S. L., Graph-based genome alignment and genotyping with HISAT2 and HISAT-genotype. Nat. Biotechnol. 37, 907–915 (2019). [DOI] [PMC free article] [PubMed] [Google Scholar]
- 51.Putri G. H., Anders S., Pyl P. T., Pimanda J. E., Zanini F., Analysing high-throughput sequencing data in Python with HTSeq 2.0. Bioinformatics 38, 2943–2945 (2022). [DOI] [PMC free article] [PubMed] [Google Scholar]
- 52.Love M. I., Huber W., Anders S., Moderated estimation of fold change and dispersion for RNA-seq data with DESeq2. Genome Biol. 15, 550 (2014). [DOI] [PMC free article] [PubMed] [Google Scholar]
- 53.Wolf F. A., Angerer P., Theis F. J., SCANPY: Large-scale single-cell gene expression data analysis. Genome Biol. 19, 15 (2018). [DOI] [PMC free article] [PubMed] [Google Scholar]
- 54.Feng X., Huang Y., Yang C., Chen J., Gene expression profile at single cell level of 4T1 WT and Mga KO tumors derived on BALB/c mice. NCBI GEO. https://www.ncbi.nlm.nih.gov/geo/query/acc.cgi?acc=GSE249758. Deposited 8 December 2023.
- 55.Feng X., Jiang D., Yang C., Chen J., In vivo CRISPR screens identify Mga as an immunotherapy target in triple-negative breast cancer. NCBI GEO. https://www.ncbi.nlm.nih.gov/geo/query/acc.cgi?acc=GSE249759. Deposited 8 December 2023. [DOI] [PMC free article] [PubMed]
- 56.Feng X., Huang Y., Yang C., Chen J., In vivo CRISPR screens identify Mga as an immunotherapy target in triple-negative breast cancer. GitHub. https://github.com/hyjforesight/Mga_KO_vs_WT. Deposited 22 November 2023. [DOI] [PMC free article] [PubMed]
Associated Data
This section collects any data citations, data availability statements, or supplementary materials included in this article.
Supplementary Materials
Appendix 01 (PDF)
Dataset S01 (XLSX)
Dataset S02 (XLSX)
Dataset S03 (XLSX)
Dataset S04 (XLSX)
Dataset S05 (XLSX)
Dataset S06 (XLSX)
Dataset S07 (XLSX)
Dataset S08 (XLSX)
Dataset S09 (XLSX)
Dataset S10 (XLSX)
Dataset S11 (XLSX)
Dataset S12 (XLSX)
Dataset S13 (XLSX)
Dataset S14 (XLSX)
Dataset S15 (XLSX)
Data Availability Statement
Bulk in vitro RNA-seq and in vivo scRNA-seq data have been deposited in Gene Expression Omnibus under Accession No. GSE249760 (54, 55). All the codes used in this study are accessed at: https://github.com/hyjforesight/Mga_KO_vs_WT (56). All other data are included in the manuscript and/or supporting information.