

Abstract
Objectives
Gadolinium (Gd)–based contrast agents are well established in clinical routine and have been proven safe and effective. However, there is a need for “next-generation” Gd-based contrast agents that would allow lowering the Gd dose used for routine contrast-enhanced magnetic resonance imaging procedures. The objective of this first-in-human study was to investigate the pharmacokinetic profile, safety, and tolerability of gadoquatrane, a novel high-relaxivity Gd-based contrast agent.
Materials and Methods
This study was conducted in 2018/2019 as a prospective, randomized, single-blind, single-dose, placebo-controlled, escalating-dose study. Healthy volunteers were randomly assigned (6:2) to intravenous administration of gadoquatrane (0.025 to 0.2 mmol Gd/kg body weight) or placebo. Study procedures included collection of blood samples and excreta for pharmacokinetic analyses and safety assessments.
Results
Forty-nine healthy study participants (mean age ± SD, 35 ± 6.3 years; 24 female) were evaluated. The effective half-life of gadoquatrane in plasma was short and similar in all dose groups (1.4–1.7 hours). Plasma concentrations around the lower quantitation limit (0.0318 μmol Gd/L) were reached 15–72 hours after administration. The volume of distribution at steady state was ~0.2 L/kg in all dose groups. The clearance (total and renal) was ~0.1 L/h per kilogram in all groups. Across dose groups, the exposure of gadoquatrane increased dose-proportionally. Metabolite profiling revealed no hint of degradation in vivo or release of free Gd. Seven of 36 participants (19.4%) receiving gadoquatrane and 4 of 13 participants (30.8%) receiving placebo experienced mild or moderate treatment-emergent adverse events. No serious adverse events occurred. The analysis of the Gd concentration-QTc interval relationship indicated no risk of QT/QTc prolongation (>10 milliseconds) with gadoquatrane at clinical dose levels.
Conclusions
Gadoquatrane with its high-relaxivity, pharmacokinetic similarity to established Gd-based contrast agents and high tolerability is a promising “next-generation” contrast agent for magnetic resonance imaging.
Key Words: MRI, contrast enhancement, gadolinium presence, dose reduction, high relaxivity, macrocyclic, tetrameric, pharmacokinetics
Contrast-enhanced magnetic resonance imaging (MRI) is a standard radiology procedure in clinical routine. The gadolinium-based contrast agents (GBCAs) used for this purpose are well established and have been proven safe and effective.1 However, when the rare disorder nephrogenic systemic fibrosis associated with linear GBCAs in patients with severe renal impairment was described in 2006,2 a shift from linear to macrocyclic GBCAs started. This trend continued after the first reports on increased signal intensity on unenhanced (T1-weighted) MRIs in patients who had received repeated injections of linear GBCAs.3 It even yielded in suspension of the marketing authorization of such GBCAs in several countries. Both observations can be attributed to the lower stability of the linear GBCAs compared with the macrocyclic GBCAs, yielding in prolonged presence of gadolinium (Gd) in the central nervous system and other body regions, as shown in nonclinical and clinical studies.4–6 But despite the favorable properties of the macrocyclic GBCAs, there are ongoing concerns about a prolonged presence of Gd in the brain and other body areas.1,6,7 Thus, calls for next-generation contrast agents, that is, contrast agents with improved relaxivity that would allow lowering the Gd dose, have been voiced.8 The novel GBCA gadoquatrane, with its unique tetrameric structure, was designed to address this demand and is now in clinical development, entering phase 3.
Gadoquatrane combines high macrocyclic complex stability and high water solubility with high relaxivity.9 Thus, it has the potential to be used at substantially lower Gd doses in clinical routine than currently established extracellular “multipurpose” GBCAs such as gadobutrol, gadoterate meglumine, and gadoteridol.
Figure 1 shows the chemical structure of gadoquatrane next to the structure of gadobutrol as a representative of currently established, standard-of-care macrocyclic GBCAs. The strategy followed to increase the relaxivity of the contrast agent was to increase the molecular size sufficiently to reduce its tumbling rate. This was achieved by linking 4 single macrocyclic Gd-GlyMe-DOTA moieties. Compared with established macrocyclic GBCAs, the tetrameric structure of gadoquatrane leads to a more than 8-fold higher r1-relaxivity per molecule (47.2 mM−1·s−1) and more than 2-fold higher r1-relaxivity per Gd (11.8 mM−1·s−1) in human plasma.9 The pharmacokinetic (PK) properties of gadoquatrane, however, were expected to be the same as those of gadobutrol and other established macrocyclic GBCAs.
FIGURE 1.

Chemical structure of gadobutrol and gadoquatrane. The molecular weight of gadoquatrane is 2579 g/mol.9 The molecular weight of gadobutrol is 604.72 g/mol.10
Lohrke et al9 have demonstrated that the PK profile of gadoquatrane in rats is essentially the same as that of gadobutrol and other currently established extracellular GBCAs. It is characterized by fast distribution from the (intra)vascular space into the extracellular space and fast renal elimination in unmetabolized form.
In the present article, we report the results of the first-in-human study of gadoquatrane. The purpose of this study was to investigate the PK profile of gadoquatrane, including excretion pathways, its safety, and its tolerability. In addition, we report on the results of a population PK meta-analysis that included data from this first-in-human study.
To evaluate the potential impact of ethnic factors on the PK of gadoquatrane, we juxtapose the PK results of this first-in-human study, which was conducted in a sample of mostly White men and women, with the results of 2 very similarly designed phase 1 studies of gadoquatrane in Chinese and Japanese men.
MATERIALS AND METHODS
This first-in-human study was conducted at a single study center in Germany (CRS Clinical Research Services Berlin GmbH, Berlin, Germany) between July 2018 and February 2019 (first participant, first visit–last participant, last visit). The protocol for this study (EudraCT 2017-004756-32) was approved by the relevant independent ethics committee before the start of the study (Ethics Committee of the Landesamt für Gesundheit und Soziales, Berlin, Germany). All study participants gave their written informed consent before entry into the study.
Study Population, Design, and Treatments
Eligible for participation were healthy men and women between 18 and 45 years of age (inclusive) with a body weight (BW) of ≥45 and ≤90 kg and a body mass index of ≥18.5 and ≤30 kg/m2, respectively (see Supplemental Digital Content, Chapter 1, for details, http://links.lww.com/RLI/A877).
The study was conducted as a prospective, randomized, single-blind, placebo-controlled, escalating-dose study with 6 consecutive dose cohorts of 9 (cohort 1; sentinel design) or 8 (cohorts 2 to 6) participants each (49 in total) (Fig. 2). Six participants per cohort received the investigational product gadoquatrane (Bayer AG, Berlin, Germany), and 2 participants received placebo (3 in cohort 1). Gadoquatrane and placebo solutions were identical in appearance. Study participants, as well as the investigational staff up until dose-escalation decisions, were blinded to treatment assignments. In cohorts 1 to 3, treatment consisted of a single intravenous (IV) dose of gadoquatrane (0.025, 0.05, or 0.1 mmol Gd/kg BW) or matching placebo (isotonic saline) administered by infusion (5 minutes) with a standard infusion pump. In cohorts 4 to 6, a single dose of gadoquatrane (0.03, 0.1, or 0.2 mmol Gd/kg BW) or matching placebo was administered by IV injection with the MEDRAD MRXperion injection system (Bayer Medical Care, Pittsburgh, PA) (2 mL/s; with automatic flushing with 20 mL saline after the end of the injection). As this was a first-in-human study, administration by infusion was chosen for the first 3 cohorts.
FIGURE 2.

Schematic study design and schedule of procedures. The graph shows the schedule of procedures for the 6 cohorts. Blood (plasma) samples were collected before and at 0.033, 0.083, 0.167, 0.25, 0.33, 0.5, 0.75, 1, 1.5, 2, 3, 4, 6, 8, 12, 15, 24, 36, 48, and 72 hours after start of drug administration. Urine and feces were collected also over 3 days (72 hours). Holter ECGs were recorded from immediately before drug administration until 8 hours after start of administration. Safety monitoring included documentation and assessment of adverse events and concomitant medication, measurement of vital signs, clinical laboratory tests, and cardiorespiratory monitoring including oxygen saturation. The randomization was done between placebo and gadoquatrane at the pertinent dose level, not simultaneously across study arms. BW, body weight; D1, D0, D3, and D7, study days number 1, 0, 3, and 7; ECG, electrocardiogram; F, female; Gd, gadolinium; IV, intravenous; M, male; PK, pharmacokinetic.
Of note, molar dose specifications and drug concentrations in plasma and excreta are based on Gd content or concentration, respectively, to facilitate comparisons with established GBCAs. Due to its tetrameric structure, the molar data provided for gadoquatrane represent one quarter of the Gd content or concentration. A Gd concentration of 1000 mmol/L, for example, corresponds to a gadoquatrane concentration of 250 mmol/L.
Procedures and Variables
A detailed overview of the schedule of study procedures is given in Figure 2. Procedures included blood sampling and collection of urine and feces over 72 hours post dose and safety assessments.
Key PK parameters were the area under the Gd plasma concentration-time curve extrapolated to infinity (AUC), the observed maximum Gd concentration (Cmax) in plasma, and the total clearance (absolute and BW-normalized) (CL, CL/BW). Additional PK parameters were renal clearance (absolute and BW-normalized) (CLR, CLR/BW), mean residence time (MRT), effective half-life based on the MRT (t1/2,eff), apparent volume of distribution at steady state (Vss/BW), and the amounts of Gd excreted in urine and feces (%AE, urine, %AE, feces). Primary variables for the assessment of safety and tolerability were the frequency and severity of treatment-emergent adverse events (TEAEs).
Bioanalytical Methods to Determine Total Gadolinium and for Metabolite Profiling
Gadolinium concentrations were determined in plasma and urine after dilution and addition of the internal standard terbium using a newly developed, highly sensitive inductively coupled plasma mass spectrometry method covering a broad concentration range. In feces, the total Gd was determined after homogenization with the addition of the internal standard terbium and subsequent digestion under acidic conditions and analysis using inductively coupled plasma mass spectrometry. Analyses and method validation were conducted in compliance with the relevant EU and US guidelines.11,12 The lower limit of quantification of the method was 0.0318 μmol Gd/L in plasma, 0.0636 μmol Gd/L in urine, and 0.191 μmol Gd/kg in feces; see Supplemental Digital Content, Chapter 2, for further details and performance parameters of the method, http://links.lww.com/RLI/A877.
Plasma and urine samples from all participants in cohorts 4 to 6 who received gadoquatrane were analyzed for metabolite profiles using high-performance liquid chromatography methods with inductively coupled plasma mass spectrometry and high-resolution mass spectrometry detection. The chromatographic method was developed to separate unchanged gadoquatrane, 2 known potential degradation products, that is, monomeric Gd-complexes present in low amounts in the formulation used in this early clinical study and free Gd; see Supplemental Digital Content, Chapter 3, for details, http://links.lww.com/RLI/A877.
Pharmacokinetic Methods
Based on Gd plasma concentration-time data, standard noncompartmental PK parameters and other PK parameters as listed in Section 2.2 were calculated using WinNonlin v5.3 (Certara, Princeton, NJ). To evaluate the potential impact of ethnic factors on the PK of gadoquatrane, key PK parameters (calculated with the same method) determined in two phase 1 studies conducted in Chinese and Japanese healthy men were used for graphic comparison. See Supplemental Digital Content, Chapter 4, for a condensed overview of the PK-related details of these 2 studies, http://links.lww.com/RLI/A877.
Furthermore, a population PK model was developed using the program NONMEM, v7.4 (ICON Development Solutions, Ellicott City, MD); see Supplemental Digital Content, Chapter 5, for details, http://links.lww.com/RLI/A877. For this, in addition to the plasma concentration data from the present first-in-human study, respective data from the aforementioned PK and safety study in Japanese men and from a dose-response study of gadoquatrane in mostly White men and women were used. For a condensed overview of key characteristics of the 3 studies, see Supplemental Digital Content, Chapter 4, http://links.lww.com/RLI/A877. Publications reporting the results of the PK and safety studies in Japanese and Chinese men and the dose-response study of gadoquatrane are in preparation.
Statistical Analyses and Sample Size Considerations
Statistical analyses were carried out using SAS v9.2 (SAS Institute, Cary, NC). Data from participants receiving the same dose or placebo, respectively, were pooled for safety analyses. No formal interim analysis was planned or conducted.
Dose-proportionality of exposure was investigated by analyses of variance on log-transformed, dose-normalized AUC and Cmax data, with dose level as independent variable. To assess the effect of sex, an analysis of variance with factor sex was applied on log-transformed, dose-normalized AUC and Cmax data. As output, geometric mean ratios and their 90% confidence intervals were determined by exponentiating the point estimates (least square mean differences) and the respective 90% confidence intervals. Concentration-QTc (C-QTc) modeling as described by Garnett et al13,14 was used to assess the potential of gadoquatrane to cause QT/QTc interval prolongation (see Supplemental Digital Content, Chapter 6, for details).
No formal statistical sample size estimation was performed. Based on standard practice in first-in-human studies and internal experience with similar clinical trials, 8 participants per cohort (6 receiving gadoquatrane, 2 receiving placebo) were considered sufficient for the objectives of the study.
RESULTS
Study Population
Overall, 49 healthy men and women (age 22–45 years; 51% male; 94% White) were randomly assigned to treatment with gadoquatrane (n = 36) or placebo (n = 13). All participants completed the study; no participant was excluded from analysis (Fig. 3). The demographic characteristics were well balanced among the different treatment groups (Table 1).
FIGURE 3.

Participant disposition. The randomization was done between placebo and gadoquatrane at the pertinent dose level, not simultaneously across study arms. BW, body weight; F, female; Gd, gadolinium; GQ, gadoquatrane; IV, intravenous; M, male; n, number of participants; PK, pharmacokinetics. Pound sign (#) indicates that all participants received the allocated intervention.
TABLE 1.
Demographics
| Cohort | 1 | 2 | 3 | 4 | 5 | 6 | 1–3 | 4–6 | Total |
|---|---|---|---|---|---|---|---|---|---|
| Dose, mmol Gd/kg BW | 0.025 | 0.05 | 0.1 | 0.03 | 0.1 | 0.2 | Placebo | Placebo | |
| Mode of Administration | IV Infusion | IV Infusion | IV Infusion | IV Injection | IV Injection | IV Injection | IV Infusion | IV Injection | |
| n = 6 | n = 6 | n = 6 | n = 6 | n = 6 | n = 6 | n = 7 | n = 6 | n = 49 | |
| Sex | |||||||||
| Male* | 3 (50) | 3 (50) | 3 (50) | 3 (50) | 3 (50) | 3 (50) | 4 (57) | 3 (50) | 25 (51) |
| Female* | 3 (50) | 3 (50) | 3 (50) | 3 (50) | 3 (50) | 3 (50) | 3 (43) | 3 (50) | 24 (49) |
| Ethnicity | |||||||||
| Asian* | 0 (0) | 0 (0) | 0 (0) | 0 (0) | 0 (0) | 1 (17) | 0 (0) | 0 (0) | 1 (2) |
| Black/African American* | 0 (0) | 0 (0) | 0 (0) | 0 (0) | 0 (0) | 1 (17) | 1 (14) | 0 (0) | 2 (4) |
| White* | 6 (100) | 6 (100) | 6 (100) | 6 (100) | 6 (100) | 4 (67) | 6 (86) | 6 (100) | 46 (94) |
| Age, y† | 35 ± 6.7 | 35 ± 3.7 | 33 ± 7.7 | 34 ± 7.4 | 38 ± 3.6 | 31 ± 4.6 | 35 ± 7.8 | 36 ± 8.5 | 35 ± 6.3 |
| Body weight, kg† | 74 ± 11.3 | 68 ± 12.0 | 72 ± 11.6 | 70 ± 9.9 | 67 ± 5.8 | 68 ± 8.8 | 72 ± 13.2 | 72 ± 12.9 | 70 ± 10.4 |
| BMI, kg/m2† | 24 ± 1.2 | 23 ± 2.3 | 23 ± 2.5 | 24 ± 3.3 | 24 ± 2.9 | 24 ± 2.9 | 24 ± 3.2 | 23 ± 2.8 | 23 ± 2.6 |
Race/ethnicity classification was done by the investigator.
*Data are numbers of participants followed by percentages in parentheses.
†Data are mean ± SD.
BMI, body mass index; BW, body weight; Gd, gadolinium; IV, intravenous; n, number of participants.
Pharmacokinetics: Plasma
Noncompartmental Analysis
A condensed overview of the noncompartmental PK parameters obtained after IV bolus injection of gadoquatrane (cohorts 4 to 6) is given in Table 2. Pharmacokinetic parameters for all 6 cohorts and mean concentration-time curves of Gd in plasma for all cohorts are provided in Supplemental Digital Content, Chapter 7, Table S7-1, Fig. S7-1, http://links.lww.com/RLI/A877.
TABLE 2.
Pharmacokinetic Parameters in Plasma and Excretion Parameters Obtained After IV Administration of Gadoquatrane
| Noncompartmental Analysis | Population Pharmacokinetic Analysis | |||
|---|---|---|---|---|
| 0.03 mmol Gd/kg BW IV Bolus Injection | 0.1 mmol Gd/kg BW IV Bolus Injection | 0.2 mmol Gd/kg BW IV Bolus Injection | ||
| Parameter, Unit | n = 6 | n = 6 | n = 6 | n = 98 |
| Cmax, μmol/L | 250 (11.8) | 948 (34.3) | 1780 (25.6) | N/A |
| Cmax,norm, kg/L | 8.28 (12.1) | 9.48 (34.4) | 8.92 (25.6) | N/A |
| C10, μmol/L | 188 (11.5) | 625 (11.8) | 1283 (13.1) | 675 (15.8)* |
| C20, μmol/L | 143 (11.9) | 473 (11.9) | 921 (13.7) | 490 (12.2)* |
| AUC, μmol·h/L | 293 (16.9) | 1020 (22.1) | 2050 (12.0) | 942 (16.6)†,‡ |
| AUCnorm, kg·h/L | 9.73 (17.2) | 10.2 (22.1) | 10.2 (12.0) | 9.42†,‡ |
| CL/BW, L/h/kg | 0.103 (17.2) | 0.0984 (22.1) | 0.0978 (12.0) | 0.108 (13.1)‡ |
| CLR/BW, L/h/kg | 0.105 (15.8) | 0.0945 (23.4) | 0.0715 (30.7) | N/A |
| t1/2,eff, h | 1.46 (10.5) | 1.54 (17.3) | 1.73 (5.84) | 1.52 (13.7)‡ |
| MRT, h | 2.11 (10.5) | 2.22 (17.3) | 2.50 (5.84) | 2.20 (13.7)‡ |
| Vss/BW, L/kg | 0.217 (13.5) | 0.219 (7.91) | 0.244 (14.0) | 0.237 (7.00)‡ |
| AE,urine (0–12 h), % of dose | 101 ± 5.24 (5.17)§ | 94.4 ± 3.64 (3.85)§ | 74.2 ± 18.0 (24.2)§,∥ | N/A |
| AE,urine (0–72 h), % of dose | 102 ± 5.15 (5.04)§ | 96.0 ± 3.33 (3.46)§ | 75.2 ± 18.1 (24.1)§,∥ | N/A |
| AE,feces (0–72 h), % of dose | 0.0418 ± 0.0281 (67.2)§ | 0.0538 ± 0.0427 (79.3)§,¶ | 0.0610 ± 0.0478 (78.4)§,¶ | N/A |
Data are geometric means followed by coefficients of variation (%) in parentheses unless indicated otherwise. Drug concentrations in plasma are based on Gd concentration.
The complete list of noncompartmental pharmacokinetic parameters is provided in Supplemental Digital Content, Chapter 7, http://links.lww.com/RLI/A877. Details of the population pharmacokinetic analysis are provided in Supplemental Digital Content, Chapter 5, http://links.lww.com/RLI/A877.
*Individual predicted concentration after bolus injection of 0.1 mmol Gd/kg BW, n = 13.
†AUC and AUCnorm calculated for the standard dose of 0.1 mmol Gd/kg BW, n = 19.
‡Data obtained after bolus injection as well as after 5-minute infusion was considered for parameter calculation; n = 98.
§Data are arithmetic means ± SD followed by coefficient of variation (%) in parentheses.
∥One participant had an exceptionally low recovery within the first 4 hours post dose, most likely due to procedural difficulties. Thus, the cumulated amounts are lower in this group than in the other dose groups.
¶N = 5 (Note: Some participants had no bowel movements during the sampling interval.)
AE,feces (0–72 h), amount of Gd excreted in feces within 72 hours; AE,urine(0-…h), amount of Gd excreted in urine within the specified time interval; AUC, area under the concentration-time curve from time zero to infinity after single dose administration; AUCnorm, AUC divided by dose/kg BW; BW, body weight; CL/BW, total body clearance of drug per kg BW; CLR/BW, renal body clearance of drug per kg BW; C10, drug concentration at 10 minutes after IV bolus injection; C20, drug concentration at 20 minutes after IV bolus injection; Cmax, maximum observed drug concentration after single dose administration; Cmax, norm, Cmax divided by dose per kg BW; IV, intravenous; MRT, mean residence time; n, number of evaluable participants; N/A, not applicable; t1/2,eff, effective half-life calculated based on the MRT, which was multiplied by the natural logarithm of 2. This half-life describes the overall effective elimination of the drug. Vss/BW, apparent volume of distribution at steady state per kg BW.
Maximum Gd concentrations in plasma were reached at or shortly after the end of IV administration. Thereafter, the Gd concentrations declined rapidly. Gadolinium concentrations below or close to the quantitation limit of 0.0318 μmol/L were reached 15 to 72 hours after the administration. The effective plasma half-life, which describes the overall elimination of the compound, was short and very similar in all dose groups (1.4 to 1.7 hours). Across dose groups, the exposure increased dose-proportionally, as indicated by similar dose-normalized AUC values and also Cmax values. Exploratory analyses of variance did not reveal any deviations from dose-proportionality for either parameter or mode of administration (Supplemental Digital Content, Table S7-2, http://links.lww.com/RLI/A877).
The mean BW-normalized volume of distribution at steady state (Vss/BW) was approximately 0.2 L/kg (all dose groups), indicating distribution within the extracellular space. Clearance values were similar in all dose groups as well (CL: ~7 L/h; CL/BW and CLR/BW: ~0.1 L/h per kilogram). The similarity of total and renal clearance values documents that the compound is cleared almost exclusively by glomerular filtration.
No major differences were observed in any of the PK parameters between male and female participants (Supplemental Digital Content, Fig. S7-2, Table S7-3, http://links.lww.com/RLI/A877). The estimated geometric mean AUCnorm ratio female/male was 1.007 (90% confidence interval, 0.933–1.09); the estimated Cmax ratio female/male was 0.926 (90% confidence interval, 0.822–1.04).
Metabolite profiling (cohorts 4 to 6) revealed no hint of degradation in vivo or release of free Gd (Supplemental Digital Content, Chapter 3, http://links.lww.com/RLI/A877).
Population Pharmacokinetic Evaluation
The population PK model was based on data from 98 participants with a total of 1355 Gd plasma concentrations. It is a linear, 3-compartment model with all clearance and volume parameters scaled to individual BW using an allometric model with the commonly accepted scaling coefficients of 0.75 and 1,15 respectively. In the covariate analysis, the estimated glomerular filtration rate was identified as a significant covariate for the clearance; that is, the higher the estimated glomerular filtration rate, the higher the clearance. None of the other tested covariates was significant—neither age nor sex or racial subgroup (White, Asian, African American); see Supplemental Digital Content, Chapter 5, for parameter estimates of the final model. Summary statistics of the derived individual key PK parameters are given in Table 2. These derived individual key PK parameters are very similar to mean parameters determined by noncompartmental analysis for the 0.1 mmol Gd/kg BW dose (Table 2), and they are also similar to those reported for gadobutrol.16
Pharmacokinetics: Urine and Feces
Gadoquatrane was rapidly excreted into urine with almost complete excretion within 12 hours after single IV administration (Table 2; Supplemental Digital Content, Chapter 7, Table S7-4, http://links.lww.com/RLI/A877). Total mean recovery varied between 85% and 102% of the dose in 5 of the 6 dose groups. A lower mean value was observed only in 1 group (cohort 6), where 1 participant stood out with a recovery value of only 32% within the first 4 hours—most likely caused by incomplete urine collection at the early time points—while the other participants in this and the other cohorts had higher recovery values within the first 4 hours (between 57% and 99%). At later time points, this participant had recovery values in line with those of other participants, supporting this assumption. The amount of Gd detected in feces was negligible (<0.1% of the dose). No sex differences in excretion were observed (data not shown).
As in plasma, metabolite profiling in urine (cohorts 4 to 6) showed almost exclusively unchanged gadoquatrane; no signs of degradation or release of free Gd were detected (Supplemental Digital Content, Chapter 3, http://links.lww.com/RLI/A877).
Safety, Including Assessment of QT Intervals
Seven of 36 participants (19.4%) receiving gadoquatrane and 4 of 13 participants (30.8%) receiving placebo experienced TEAEs. All TEAEs were of mild or moderate intensity and had resolved or were resolving at the end of the study. No serious or unexpected TEAEs were observed. There were no apparent differences in TEAE incidence or severity between treatment groups receiving different doses of gadoquatrane or placebo.
Treatment-emergent adverse events that the investigator considered study drug–related were increased C-reactive protein and decreased lymphocyte count in 1 participant who received 0.1 mmol Gd/kg BW and headache in another who received 0.05 mmol Gd/kg BW. Study drug–related TEAEs in the placebo group were injection site pain and headache in one participant and headache in another. The complete summary of all TEAEs is provided in Table 3.
TABLE 3.
Treatment-Emergent Adverse Events
| 0.025 mmol Gd/kg BW | 0.05 mmol Gd/kg BW | 0.1 mmol Gd/kg BW | 0.03 mmol Gd/kg BW | 0.2 mmol Gd/kg BW | Placebo | |
|---|---|---|---|---|---|---|
| IV Infusion | IV Infusion | IV Infusion or Injection | IV Injection | IV Injection | IV Infusion or Injection | |
| n = 6 | n = 6 | n = 12 | n = 6 | n = 6 | n = 13 | |
| Participants with | ||||||
| At least 1 TEAE | 1 (16.7) | 2 (33.3) | 2 (16.7) | 1 (16.7) | 1 (16.7) | 4 (30.8) |
| Bound to left | ||||||
| Mild | 0 | 2 (33.3) | 1 (8.3) | 1 (16.7) | 1 (16.7) | 4 (30.8) |
| Moderate | 1 (16.7) | 0 | 1 (8.3) | 0 | 0 | 0 |
| Severe | 0 | 0 | 0 | 0 | 0 | 0 |
| Any study drug–related TEAE | 0 | 1 (16.7) | 1 (8.3) | 0 | 0 | 2 (15.4) |
| Any TEAE related to study procedures | 1 (16.7) | 2 (33.3) | 0 | 1 (16.7) | 1 (16.7) | 2 (15.4) |
| Any TEAE leading to discontinuation of study drug | 0 | 0 | 0 | 0 | 0 | 0 |
| Any serious TEAE | 0 | 0 | 0 | 0 | 0 | 0 |
| TEAEs, MedDRA preferred terms | ||||||
| Headache | 1 (16.7) | 2 (33.3) | 1 (8.3) | 0 | 0 | 3 (23.1) |
| Nasopharyngitis | 0 | 0 | 1 (8.3) | 1 (16.7) | 0 | 0 |
| Agitation | 0 | 0 | 0 | 0 | 0 | 1 (7.7) |
| Back pain | 0 | 0 | 0 | 1 (16.7) | 0 | 0 |
| Blood creatinine phosphokinase increased | 1 (16.7) | 0 | 0 | 0 | 0 | 0 |
| C-reactive protein increased | 0 | 0 | 1 (8.3) | 0 | 0 | 0 |
| Dysmenorrhea | 0 | 0 | 0 | 0 | 0 | 1 (7.7) |
| Injection site pain | 0 | 0 | 0 | 0 | 0 | 1 (7.7) |
| Lymphocyte count decreased | 0 | 0 | 1 (8.3) | 0 | 0 | 0 |
| Myalgia | 1 (16.7) | 0 | 0 | 0 | 0 | 0 |
| Presyncope | 0 | 0 | 0 | 0 | 1 (16.7) | 0 |
Data are numbers of participants followed by percentages in parentheses. Preferred terms are sorted by overall incidence and alphabetically. Adverse events were coded using MedDRA v22.0.
BW, body weight; Gd, gadolinium; IV, intravenous; MedDRA, Medical Dictionary for Regulatory Activities; n, number of participants; TEAE, treatment emergent adverse event.
The analysis of the Gd C-QTc interval relationship did not reveal an increase in heart rate–adjusted QT intervals after single IV administration of gadoquatrane up to 0.2 mmol Gd/kg BW, the highest dose tested. The upper limit of the 2-sided 90% confidence interval of the model-predicted ΔΔQTcF (baseline-corrected QTc interval corrected for placebo) was below the 10-millisecond threshold of regulatory concern over the entire range of observed Gd plasma concentrations. For the highest Gd plasma concentration observed in the 0.2 mmol Gd/kg BW group (2782 μmol/L), the upper limit was predicted to be +8.54 milliseconds (Fig. 4). Thus, for the anticipated diagnostic dose of gadoquatrane of 0.01 mmol/kg BW (corresponding to 0.04 mmol Gd/kg BW), a clinically relevant QT/QTc interval prolongation can be excluded according to Garnett et al.13,14
FIGURE 4.

Model-predicted and observed ΔΔQTcF versus observed gadolinium concentration based on data obtained in healthy men and women after intravenous administration of single doses of gadoquatrane. Triangles: All observations of placebo-treated participants and all observations of gadoquatrane-treated participants before study drug administration. Circles: All observations post drug administration, gadoquatrane-treated participants. Boxes with solid line, bold, black: 5th and 95th percentile and median from bins of equal sample size. Solid line and shaded area, green: typical linear model predicted C-QTcF effect with 90% confidence interval. Dashed line, red, horizontal: +10 milliseconds threshold and −10 milliseconds for orientation. Dashed line, blue, vertical: highest observed concentration. Dashed line, blue, horizontal: the upper limit of the 2-sided 90% confidence interval of the typical ΔΔQTc from the highest observed concentration (8.54 milliseconds). ΔΔQTcF, baseline-corrected QTcF interval corrected for placebo; QTcF, QT interval corrected for heart rate according to Fridericia formula.
DISCUSSION
Gadoquatrane, a novel tetrameric, macrocyclic extracellular Gd-based contrast agent with high complex stability and high relaxivity,9 has been designed to meet the need for next-generation Gd-based contrast agents for MRI. In the present first-in-human study, gadoquatrane proved to be safe and well tolerated and demonstrated the expected PK profile. This profile is characterized by rapid distribution of the compound into the extracellular space and fast, almost exclusive, renal elimination in unchanged form. Metabolite profiling did not reveal any indications of degradation in vivo or release of free Gd.
The PK profile of gadoquatrane determined in the present study is essentially the same as that of the currently established macrocyclic GBCAs gadobutrol, gadoteridol, and gadoterate meglumine17–19 as exemplified in Table 4 and Figure 5, and it is also similar to that of the recently Food and Drug Administration–approved gadopiclenol.21 Furthermore, the PK data collected in this first-in-human study of gadoquatrane are also in line with the preclinical profile of the drug described by Lohrke et al.9 As for other extracellular GBCAs, neither sex nor ethnic factors impacted the PK of gadoquatrane to a clinically relevant extent. In the present study, the key PK parameters, that is, dose-normalized AUCs and maximum concentrations, as well as CL/BW and Vss/BW, were essentially the same in men and women. In an across-study comparison of the key PK parameters obtained in the present study in mostly White (male and female) participants with the respective parameters obtained in the aforementioned, similarly designed studies in Chinese and Japanese men (Supplemental Digital Content, Chapter 4, http://links.lww.com/RLI/A877) do not indicate any major impact of ethnic factors either (Fig. 6). Accordingly, the population PK meta-analysis based on data from the present first-in-human study, a second phase 1 study in mostly White participants, and the study in Japanese men also showed no impact of ethnicity on the PK of gadoquatrane. These findings are not unexpected, as the typical PK behavior of extracellular GBCAs is determined by their physicochemical properties, such as high water solubility, high complex stability, negligible protein binding, and molecular structure. Individual differences in key PK parameters, such as CL and AUC, are known to be caused mainly by differences in glomerular filtration rate23—the only covariate identified in the population PK meta-analysis as significant for the Gd clearance.
TABLE 4.
Key Pharmacokinetic Parameters of Gadoquatrane, Gadobutrol, Gadoterate Meglumine, and Gadopiclenol Obtained in Different Studies After IV Bolus Injection of 0.1 mmol Gd/kg
| Contrast Agent | Cmax, μmol Gd/L | AUC, μmol Gd · h/L | CL/BW, L/h/kg | CLR/BW, L/h/kg | Vss/BW, L/kg | AE,urine (0–12 h), % of Dose | AE,urine (0–72 h), % of Dose |
|---|---|---|---|---|---|---|---|
| Gadoquatrane* | 948 (34.3) | 1020 (22.1) | 0.098 (22.1) | 0.095 (23.4) | 0.22 (7.91) | 94.4 (3.85) | 96.0 (3.43) |
| Gadobutrol† | 709 (23.1) | 1074 (8.93) | 0.093 (9.19) | 0.094 (11.5) | 0.21 (9.52) | 98.0 (3.40) | 100 (2.60) |
| Gadoterate meglumine‡ | ~1100 (N/A) | 987 (N/A) | ~0.08 (12.6) | 0.076 (♀) 0.084 (♂)¶ |
0.17 (11.5) | 80.1 (11.7) § | 86.6 (10.3)∥ |
| Gadopiclenol # | 1005 (23.5) | 1305 (14.3) | 0.083 (N/A) | 0.080 (N/A) | 0.21 (N/A) | N/A | 93.2% (N/A)∥ |
Data are arithmetic means and coefficients of variation in parentheses for AE, urine(0-…h) and geometric means and coefficients of variation in parentheses for the other parameters.
*For a direct comparison with other GBCAs, the gadoquatrane key PK parameters for the dose of 0.1 mmol Gd/kg BW administered by injection (2 mL/s) were selected (n = 6). At the anticipated clinical dose, Cmax and AUC will be dose-proportionally lower.
†Bayer, internal data, and data described by Staks et al.17
‡Data published by Le Mignon et al.18
§Collection period 0–6 hours after injection.
∥Collection period 0–48 hours after injection.
¶Data provided by Guerbet.20
#Data published by Hao et al.21 As the pharmacokinetic parameters were given in different units as historically done for GBCAs, the first author of this article (B.M.H.) converted them based on the molecular weight (970.11 g/L) provided by Robic et al.22 CLR/BW was calculated using an average BW of 73.3 kg based on the given median range per group 65.00–81.65 kg. Cmax and AUC are given for the dose of 0.1 mmol/kg BW; for dose-independent parameters (CL/BW, CLR/BW, Vss/BW) and AE (0–48 h), the mean over all dose groups is given.
AE,urine(0-…h), amount of Gd excreted into urine within the specified time interval; AUC, area under the concentration-time curve from time zero to infinity after single dose administration; CL/BW, total body clearance of drug per kg BW; CLR/BW, renal body clearance of drug per kg BW; Cmax, maximum observed drug concentration after single dose administration; Vss/BW, apparent volume of distribution at steady state per kg BW.
FIGURE 5.

Dose-normalized plasma gadolinium concentrations obtained after intravenous administration of gadoquatrane or gadobutrol to healthy study participants. The gadoquatrane concentration-time data shown in this figure were collected in the present study. The gadobutrol data shown include the data reported by Staks et al17 and data from another PK study of gadobutrol (Bayer, unpublished data). Gd, gadolinium.
FIGURE 6.
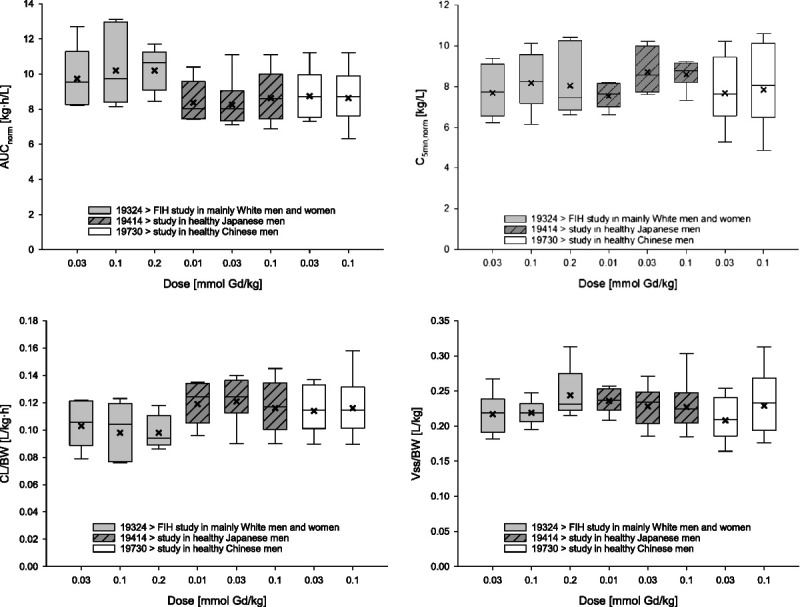
Pharmacokinetic parameters obtained in healthy study participants of different ethnicity after single intravenous bolus injection of gadoquatrane (across-study comparison). Boxes: 25th to 75th percentiles; horizontal lines: medians; crosses: geometric means; whiskers (error bars): 10th to 90th percentiles. AUCnorm, area under the concentration-time curve from time zero to infinity after single dose administration divided by dose/kg BW; CL/BW, total body clearance of drug per kg BW; C5min, norm, drug concentration observed at 5 minutes after single dose administration divided by dose/kg BW; FIH, first in human; Vss/BW, apparent volume of distribution at steady state per kg BW. Number of participants: 6 participants/group in the first-in-human study and the study in Japanese men; 8–9 participants in the study in Chinese men.
There were no relevant safety findings in this first-in-human study of gadoquatrane. The analysis of the Gd C-QTc interval relationship—which may be used as the primary basis for risk classification24—did not indicate a risk of exceeding the threshold of +10 milliseconds for QT/QTc interval prolongation with gadoquatrane at clinical dose levels.
A certain limitation of this study might be the length of the sampling period of 72 hours, as Gd was still quantifiable in plasma at the end of this period in all participants from the highest dose group. The concentrations, however, were only slightly above the very low lower limit of quantitation (0.0318 μmol Gd/L). This sensitive lower limit of quantitation, on the other hand, certainly represents a strength of this study, as it allowed the reliable determination of Gd in plasma and urine over the complete collection period of 72 hours. In other published studies of GBCAs, in contrast, where less sensitive bioanalytical methods were used, Gd concentrations were only reliably determined until 24 to 48 hours after the injection.17–19,21 The highly sensitive method was newly developed to reliably evaluate elimination of gadoquatrane from plasma. The method allows detection of Gd in plasma at concentrations of ~0.003% of the maximum concentrations after a dose of 0.1 mmol Gd/kg BW. For comparison, the European Medicines Agency guideline on bioanalytical method validation25 recommended a limit of quantitation of ≤5% of the Cmax for bioequivalence trials.
CONCLUSIONS
Overall, the results of this study suggest that gadoquatrane—with its 2- to 3-fold higher relaxivity per Gd compared with established macrocyclic GBCAs—is a very promising next-generation GBCA for MRI, which could address the demand for relevantly reduced Gd exposure per MRI scan without compromising image quality;
It was safe and very well tolerated at all doses tested.
Its PK profile proved to be essentially the same as that of other extracellular macrocyclic GBCAs. This profile is characterized by rapid distribution of gadoquatrane into the extracellular space and fast, almost exclusive, renal elimination in unchanged form. Due to the dose-proportional behavior, the systemic exposure after the anticipated clinical dose for gadoquatrane will be lower than that of the established GBCAs administered at the standard dose of 0.1 mmol Gd/kg BW.
ACKNOWLEDGMENTS
The principal investigator of this study was Dr Matthias Berse, CRS Clinical Research Services Berlin GmbH, Berlin, Germany. All safety laboratory determinations were performed by a central laboratory, Synlab Analytics and Services Germany GmbH, Berlin, Germany. Metabolite analyses (inductively coupled plasma mass spectrometry) were conducted at QPS Netherlands BV, Groningen, the Netherlands. Structure elucidation of metabolites by LC-MS/MS was conducted at Bayer AG, Berlin by Detlev Obst. The population PK analysis was conducted at qPharmetra, LLC, Nijmegen, the Netherlands. The C-QTc analysis was conducted by Matthias Frei, Bayer AG, Berlin, Germany. Graphs for PK analysis were prepared by Antonia Kohnke, Bayer AG, Berlin, Germany. Medical writing support was provided by C. Hilka Wauschkuhn, Bonn, Germany, on behalf of Bayer AG.
Footnotes
Conflicts of interest and sources of funding: The study was sponsored by Bayer AG. All authors are or were working at Bayer AG or on behalf of Bayer AG.
Supplemental digital contents are available for this article. Direct URL citations appear in the printed text and are provided in the HTML and PDF versions of this article on the journal’s Web site (www.investigativeradiology.com).
Contributor Information
Kai Riecke, Email: Kai.Riecke@Bayer.com.
Stefan Klein, Email: stefan.klein@bayer.com.
Matthias Berse, Email: Matthias.Berse@crs-group.de.
Antje Rottmann, Email: antje_metab.rottmann@bayer.com.
Gabriele Sutter, Email: gabriele.sutter@bayer.com.
Wolfgang Ebert, Email: wolfgang.ebert@bayer.com.
REFERENCES
- 1.McDonald RJ Levine D Weinreb J, et al. Gadolinium retention: a research roadmap from the 2018 NIH/ACR/RSNA workshop on gadolinium chelates. Radiology. 2018;289:517–534. [DOI] [PMC free article] [PubMed] [Google Scholar]
- 2.Grobner T. Gadolinium—a specific trigger for the development of nephrogenic fibrosing dermopathy and nephrogenic systemic fibrosis? Nephrol Dial Transplant. 2006;21:1104–1108. [DOI] [PubMed] [Google Scholar]
- 3.Kanda T Ishii K Kawaguchi H, et al. High signal intensity in the dentate nucleus and globus pallidus on unenhanced T1-weighted MR images: relationship with increasing cumulative dose of a gadolinium-based contrast material. Radiology. 2014;270:834–841. [DOI] [PubMed] [Google Scholar]
- 4.Anderhalten L Silva RV Morr A, et al. Different impact of gadopentetate and gadobutrol on inflammation-promoted retention and toxicity of gadolinium within the mouse brain. Invest Radiol. 2022;57:677–688. [DOI] [PMC free article] [PubMed] [Google Scholar]
- 5.Green C Jost G Frenzel T, et al. The effect of gadolinium-based contrast agents on longitudinal changes of magnetic resonance imaging signal intensities and relaxation times in the aging rat brain. Invest Radiol. 2022;57:453–462. [DOI] [PMC free article] [PubMed] [Google Scholar]
- 6.Strickler SE, Clark KR. Gadolinium deposition: a study review. Radiol Technol. 2021;92:249–258. [PubMed] [Google Scholar]
- 7.Gulani V Calamante F Shellock FG, et al. Gadolinium deposition in the brain: summary of evidence and recommendations. Lancet Neurol. 2017;16:564–570. [DOI] [PubMed] [Google Scholar]
- 8.Runge VM, Heverhagen JT. Advocating the development of next-generation high-relaxivity gadolinium chelates for clinical magnetic resonance. Invest Radiol. 2018;53:381–389. [DOI] [PubMed] [Google Scholar]
- 9.Lohrke J Berger M Frenzel T, et al. Preclinical profile of gadoquatrane: a novel tetrameric, macrocyclic high relaxivity gadolinium-based contrast agent. Invest Radiol. 2022;57:629–638. [DOI] [PMC free article] [PubMed] [Google Scholar]
- 10.Gadobutrol | The Merck Index Online. Available at: https://merckindex.rsc.org/monographs/m5623. Published August 11, 2023. Accessed August 20, 2023.
- 11.European Parliament and Council . Directive 2004/10/EC of the European Parliament and of the Council of 11 February 2004 on the harmonisation of laws, regulations and administrative provisions relating to the application of the principles of good laboratory practice and the verification of their applications for tests on chemical substances: current consolidated version: 20/04/2009. Available at: https://eur-lex.europa.eu/eli/dir/2004/10/oj. Accessed September 8, 2023.
- 12.U.S. Department of Health and Human Services, Food and Drug Administration, Center for Drug Evaluation and Research, Center for Veterinary Medicine. Guidance for Industry: Bioanalytical Method Validation: 2001. [Google Scholar]
- 13.Garnett C Bonate PL Dang Q, et al. Scientific white paper on concentration-QTc modeling. J Pharmacokinet Pharmacodyn. 2018;45:383–397. [DOI] [PubMed] [Google Scholar]
- 14.Garnett C Bonate PL Dang Q, et al. Correction to: scientific white paper on concentration-QTc modeling. J Pharmacokinet Pharmacodyn. 2018;45:399. [DOI] [PubMed] [Google Scholar]
- 15.Anderson BJ, Holford NHG. Mechanism-based concepts of size and maturity in pharmacokinetics. Annu Rev Pharmacol Toxicol. 2008;48:303–332. [DOI] [PubMed] [Google Scholar]
- 16.Gadavist. Package insert / prescribing information: Bayer HealthCare Pharmaceuticals Inc. Available at: https://www.drugs.com/pro/gadavist.html#s-34090-1. Published April 1, 2022. Accessed July 31, 2023.
- 17.Staks T Schuhmann-Giampieri G Frenzel T, et al. Pharmacokinetics, dose proportionality, and tolerability of gadobutrol after single intravenous injection in healthy volunteers. Invest Radiol. 1994;29:709–715. [DOI] [PubMed] [Google Scholar]
- 18.Le Mignon MM Chambon C Warrington S, et al. Gd-DOTA. Pharmacokinetics and tolerability after intravenous injection into healthy volunteers. Invest Radiol. 1990;25:933–937. [PubMed] [Google Scholar]
- 19.McLachlan SJ, Eaton S, de Simone DN. Pharmacokinetic behavior of gadoteridol injection. Invest Radiol. 1992;27(Suppl 1):S12–S15. [PubMed] [Google Scholar]
- 20.DOTAREM . Prescribing information. Revised 7/2019: Guerbet. Available at: https://www.accessdata.fda.gov/drugsatfda_docs/label/2019/204781s012lbl.pdf. Accessed July 31, 2023.
- 21.Hao J, Bourrinet P, Desché P. Assessment of pharmacokinetic, pharmacodynamic profile, and tolerance of gadopiclenol, a new high relaxivity GBCA, in healthy subjects and patients with brain lesions (phase I/IIa study). Invest Radiol. 2019;54:396–402. [DOI] [PubMed] [Google Scholar]
- 22.Robic C Port M Rousseaux O, et al. Physicochemical and pharmacokinetic profiles of gadopiclenol: a new macrocyclic gadolinium chelate with high T1 relaxivity. Invest Radiol. 2019;54:475–484. [DOI] [PMC free article] [PubMed] [Google Scholar]
- 23.Aime S, Caravan P. Biodistribution of gadolinium-based contrast agents, including gadolinium deposition. J Magn Reson Imaging. 2009;30:1259–1267. [DOI] [PMC free article] [PubMed] [Google Scholar]
- 24.U.S. Department of Health and Human Services, Food and Drug Administration, Center for Drug Evaluation and Research, Center for Biologics Evaluation and Research . E14 Clinical evaluation of QT/QTc interval prolongation and proarrhythmic potential for non-antiarrhythmic drugs—questions and answers (R3). Guidance for industry: June 2017, ICH, revision 2. Available at: https://www.fda.gov/media/71379/download. Accessed July 31, 2023.
- 25.European Medicines Agency . Guideline on bioanalytical method validation. 1 Feb 2012. Available at: https://www.ema.europa.eu/en/documents/scientific-guideline/guideline-bioanalytical-method-validation_en.pdf. Accessed July 31, 2023. [DOI] [PubMed]