Abstract
Key Points
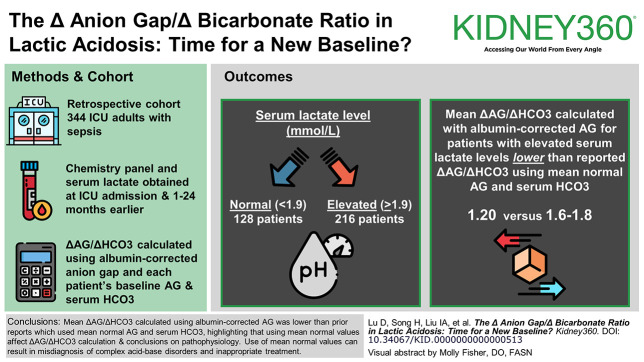
The mean delta anion gap (ΔAG)/delta bicarbonate (ΔHCO3) calculated using an albumin-corrected anion gap and each patient's individual baseline AG and serum HCO3 was 1.20.
The ΔAG/ΔHCO3 using mean normal AG and serum HCO3 was 1.6–1.8; use of mean normal values can result in misdiagnosis of complex acid-base disorders.
The elevated ΔAG/ΔHCO3 is likely due to unmeasured anions.
Background
The ratio of delta anion gap and delta bicarbonate (ΔAG/ΔHCO3) is used to detect coexisting acid-base disorders in patients with high anion gap metabolic acidosis. The ΔAG/ΔHCO3 ratio of 1.6–1.8:1 in lactic acidosis is derived from limited data using mean normal values for anion gap (AG) and serum HCO3. The objective of this study was to be the first to examine the ΔAG/ΔHCO3 using each patient's individual baseline AG and serum HCO3.
Methods
This was a retrospective cohort study of adult intensive care unit (ICU) patients with sepsis. Laboratory data from simultaneously drawn chemistry panel, including anion gap and serum lactate on admission to the ICU, were obtained. Baseline AG, HCO3, and albumin measurements were obtained 1–24 months before ICU admission. The ΔAG/ΔHCO3 was calculated using an albumin-corrected anion gap and each patient's individual baseline AG and serum HCO3.
Results
Three hundred forty-four patients were included. One hundred twenty-eight patients had normal serum lactate levels (≤1.9 mmol/L), and 216 patients had elevated serum lactate levels (>1.9 mmol/L). ΔAG/ΔHCO3 was calculated for the 216 patients who had elevated serum lactate levels (>1.9 mmol/L). The mean ΔAG/ΔHCO3 for all patients with elevated serum lactate levels was 1.20 (SD 1.50).
Conclusions
The mean ΔAG/ΔHCO3 calculated using an albumin-corrected anion gap and each patient's individual baseline AG and serum HCO3 was 1.20. The ΔAG/ΔHCO3 reported in prior literature that used mean normal AG and serum HCO3 was 1.6–1.8, highlighting that use of mean normal values affects the calculation of the ΔAG/ΔHCO3 and subsequent conclusions about underlying pathophysiology. The use of these mean normal values can result in misdiagnosis of complex acid-base disorders and inappropriate treatment. Our analysis indicates that the elevated ΔAG/ΔHCO3 is likely due to unmeasured anions contributing to an elevation in AG.
Keywords: acidosis
Visual Abstract
Introduction
The delta anion gap (ΔAG) and delta bicarbonate (ΔHCO3) ratio (ΔAG/ΔHCO3) is used to detect complex acid-base disorders in patients with high anion gap metabolic acidosis. In general, a fall in the bicarbonate concentration (ΔHCO3) accompanies an equivalent rise in the anion gap (ΔAG), and this apparent 1:1 stoichiometry has been used to identify coexisting acid-base disorders, such as metabolic alkalosis or normal anion gap metabolic acidosis; a ΔAG/ΔHCO3 <1 suggests a coexisting normal anion gap metabolic acidosis, whereas a ΔAG/ΔHCO3 >1–2 suggests a coexisting metabolic alkalosis.1
The traditional teaching in lactic acidosis is that lactate anions tend to remain in the extracellular fluid compartment, whereas protons that accompany the lactate are buffered outside of the extracellular fluid, primarily in cells and bone. In addition, lactate excretion by the kidney is usually decreased because of multiple factors, including hypoperfusion, kidney dysfunction, and lactate absorption by sodium-lactate transporters. The net result is a ΔAG/ΔHCO3 ratio of more than one in lactic acidosis, usually approximately 1.6–1.8.
The ΔAG/ΔHCO3 ratio of 1.6–1.8:1 in lactic acidosis is derived from limited animal2,3 and human data.2–9 Notably, these previous studies used mean normal values for anion gap (AG) and serum HCO3, which likely has an important effect on the calculation of the ratio and subsequent conclusions about the underlying pathophysiology. The objective of this study was to be the first to examine the ΔAG/ΔHCO3 in lactic acidosis using each patient's individual baseline AG and serum HCO3. A secondary objective was to examine potential pathophysiologic explanations for the observed ΔAG/ΔHCO3 ratio.
Methods
The study used a retrospective cohort of adult members of a large integrated health care system (Kaiser Permanente Southern California) admitted to intensive care unit (ICU) with sepsis, established for a previous study (Kaiser Permanente Southern California Institutional Review Board approval 12877).10 Five hundred twenty-six patients were included in the original cohort. Laboratory data from a simultaneously drawn chemistry panel, including anion gap and serum lactate on admission to the ICU (or within 7 days before or after the index date if not available on admission), were obtained. An albumin-corrected anion gap was determined using the formula: Anion gap+2.5 (4.0−serum albumin). The serum albumin used to determine the albumin-corrected anion gap was obtained within 7 days of the chemistry panel and serum lactate. Baseline AG, bicarbonate, and serum albumin measurements were obtained 1–24 months before ICU admission. By convention, the ΔAG/ΔHCO3 ratio uses the term HCO3 in the denominator. To maintain consistency with prior literature, this study uses the term HCO3. However, it should be noted that when using the terms HCO3 or bicarbonate, our study, as well as prior literature,9 are referring to measured total CO2, not calculated HCO3.
The ΔAG using each patient's individual baseline AG and serum HCO3 was determined by using the following formula: initial albumin-corrected anion gap (drawn on admission to ICU) − baseline albumin-corrected anion gap. The baseline albumin-corrected anion gap was determined by obtaining the average of up to three albumin-corrected anion gaps drawn as outpatient status between 1 and 24 months before the hospitalization resulting in ICU admission, using a serum albumin drawn as an outpatient within 12 months of the anion gaps. The ΔHCO3 was determined by using the following formula: baseline bicarbonate − initial bicarbonate (drawn on admission to ICU). The baseline bicarbonate was determined by obtaining the average of up to three bicarbonate values drawn as outpatient status between 1 and 24 months before the hospitalization resulting in ICU admission. The ΔAG/ΔHCO3 was also calculated using mean normal values for AG and HCO3. The ΔAG using mean normal values for AG was determined by using the following formula: initial albumin-corrected anion gap (drawn on admission to ICU) − mean albumin-corrected anion gap of the 128 patients with normal lactate levels (10.9 mEq/L). The delta HCO3 using mean normal values for HCO3 was determined by using the following formula: mean HCO3 of the 128 patients with normal lactate levels (26.9 mEq/L) − initial bicarbonate (drawn on admission to ICU). The delta lactate was determined by using the following formula: initial serum lactate (drawn on admission to ICU) − baseline lactate (mean lactate level of patients with normal serum lactate levels, 1.55 mmol/L).
Statistical Analysis
The association between ΔLactate and ΔAG, arterial pH and the ΔAG/ΔHCO3, serum chloride and the ΔAG/ΔHCO3, and systolic BP and the ΔAG/ΔHCO3 were examined using Pearson correlation (r), and linear regression models were constructed. Least squares regression lines were calculated and plotted. In addition, the association between ΔHCO3 and ΔAG was examined using Pearson correlation, a linear regression model was constructed, and 95% prediction intervals were computed.
Results
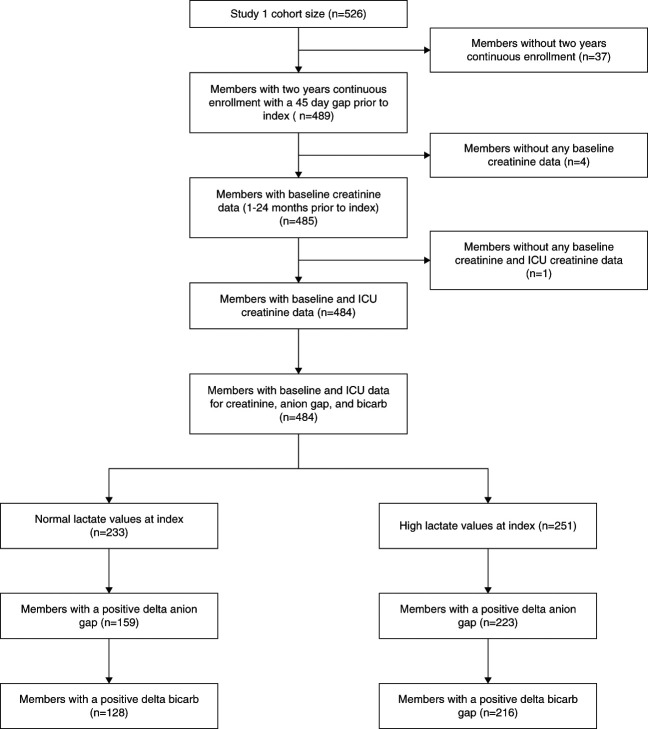
The study included 344 patients (Figure 1). One hundred twenty-eight patients had normal serum lactate levels (≤1.9 mmol/L), and 216 patients had elevated serum lactate levels (>1.9 mmol/L). Among 526 patients from the original cohort, 37 patients were excluded because they were not members of the health care system for 2 continuous years (the period during which baseline AG and serum HCO3 were obtained), five patients were excluded because of missing laboratory values, 102 patients were excluded because of a negative ΔAG, and 38 patients were excluded because of a negative ΔHCO3.
Figure 1.
Flow chart of patient inclusion and exclusion. ICU, intensive care unit.
The patients with normal serum lactate levels had a mean lactate level of 1.55 mmol/L, the values used to calculate subsequent ΔLactate values in the patients with elevated serum lactate levels. The mean lactate for the elevated lactate group was 4.9 mmol/L, with an SD of 2.99 mmol/L and range between 2.0 and 20.2 mmol/L. ΔAG/ΔHCO3 and ΔLactate/ΔHCO3 were then calculated for the 216 patients who had elevated serum lactate levels (>1.9 mmol/L). Table 1 shows the patient characteristics.
Table 1.
Patient characteristics
| Lactate Level | Normal (N=128) | High (N=216) | Total (N=344) | P Value |
|---|---|---|---|---|
| Age at index (yr) | 0.2303a | |||
| N | 128 | 216 | 344 | |
| Mean (SD) | 73.0 (13.03) | 71.1 (13.39) | 71.8 (13.27) | |
| Median | 73 | 73 | 73 | |
| Range | 20.0–99.0 | 22.0–97.0 | 20.0–99.0 | |
| Sex, n (%) | 0.9379b | |||
| Female | 61 (47.7) | 102 (47.2) | 163 (47.4) | |
| Male | 67 (52.3) | 114 (52.8) | 181 (52.6) | |
| Race and ethnicity, n (%) | 0.7884b | |||
| White | 48 (37.5) | 70 (32.4) | 118 (34.3) | |
| Black | 18 (14.1) | 29 (13.4) | 47 (13.7) | |
| Asian/Pacific Islander | 15 (11.7) | 30 (13.9) | 45 (13.1) | |
| Hispanic | 47 (36.7) | 86 (39.8) | 133 (38.7) | |
| Other/unknown | 0 (0.0) | 1 (0.5) | 1 (0.3) | |
| RRT during encounter, n (%) | 0.7947b | |||
| No | 98 (76.6) | 168 (77.8) | 266 (77.3) | |
| Yes | 30 (23.4) | 48 (22.2) | 78 (22.7) | |
| BMI | 0.0774a | |||
| N | 128 | 215 | 343 | |
| Mean (SD) | 28.7 (8.60) | 26.9 (7.03) | 27.6 (7.70) | |
| Median | 27.3 | 26 | 26.3 | |
| Range | 14.9–52.6 | 12.9–59.5 | 12.9–59.5 | |
| Diagnosis of COVID-19 during encounter, n (%) | 0.4964b | |||
| No | 122 (95.3) | 209 (96.8) | 331 (96.2) | |
| Yes | 6 (4.7) | 7 (3.2) | 13 (3.8) | |
| Diagnosis of AKI during encounter, n (%) | 0.6448b | |||
| No | 75 (58.6) | 132 (61.1) | 207 (60.2) | |
| Yes | 53 (41.4) | 84 (38.9) | 137 (39.8) | |
| Creatinine increased >0.3 mg/dl from baseline to encounter, n (%) | 0.0010b | |||
| No | 75 (58.6) | 87 (40.3) | 162 (47.1) | |
| Yes | 53 (41.4) | 129 (59.7) | 182 (52.9) | |
| Elixhauser index | 0.4918a | |||
| N | 128 | 216 | 344 | |
| Mean (SD) | 8.8 (3.34) | 8.5 (3.45) | 8.6 (3.41) | |
| Median | 9 | 9 | 9 | |
| Range | 2.0–17.0 | 1.0–19.0 | 1.0–19.0 | |
| Used any metformin in baseline and during encounter, n (%) | 0.4768b | |||
| No | 99 (77.3) | 174 (80.6) | 273 (79.4) | |
| Yes | 29 (22.7) | 42 (19.4) | 71 (20.6) | |
| Used any albuterol in baseline and during encounter, n (%) | 0.0413b | |||
| No | 37 (28.9) | 86 (39.8) | 123 (35.8) | |
| Yes | 91 (71.1) | 130 (60.2) | 221 (64.2) | |
| Used any linezolid in baseline and during encounter, n (%) | 0.4964b | |||
| No | 122 (95.3) | 209 (96.8) | 331 (96.2) | |
| Yes | 6 (4.7) | 7 (3.2) | 13 (3.8) | |
| Used any propofol in baseline and during encounter, n (%) | 0.3517b | |||
| No | 55 (43.0) | 104 (48.1) | 159 (46.2) | |
| Yes | 73 (57.0) | 112 (51.9) | 185 (53.8) | |
| Used any salmeterol in baseline and during encounter, n (%) | 0.1976b | |||
| No | 114 (89.1) | 201 (93.1) | 315 (91.6) | |
| Yes | 14 (10.9) | 15 (6.9) | 29 (8.4) | |
| SOFA | 0.0003a | |||
| N | 115 | 194 | 309 | |
| Mean (SD) | 5.2 (3.39) | 6.9 (4.15) | 6.3 (3.97) | |
| Median | 5 | 7 | 6 | |
| Range | 0.0–14.0 | 0.0–18.0 | 0.0–18.0 | |
| Temperature (F) | 0.8618a | |||
| N | 128 | 215 | 343 | |
| Mean (SD) | 97.9 (1.44) | 98.0 (1.76) | 97.9 (1.65) | |
| Median | 98.1 | 98 | 98 | |
| Range | 93.1–105.0 | 91.2–103.5 | 91.2–105.0 | |
| Systolic BP (mm Hg) | 0.1711a | |||
| N | 128 | 215 | 343 | |
| Mean (SD) | 113.0 (27.40) | 109.4 (27.25) | 110.8 (27.32) | |
| Median | 107.5 | 106 | 106 | |
| Range | 53.0–200.0 | 56.0–223.0 | 53.0–223.0 | |
| Diastolic BP (mm Hg) | 0.4590a | |||
| N | 128 | 215 | 343 | |
| Mean (SD) | 64.1 (18.13) | 63.8 (20.41) | 63.9 (19.56) | |
| Median | 63 | 60 | 62 | |
| Range | 26.0–155.0 | 0.0–195.0 | 0.0–195.0 | |
| Heart rate (BPM) | <0.0001a | |||
| N | 128 | 215 | 343 | |
| Mean (SD) | 92.5 (21.03) | 105.6 (23.80) | 100.7 (23.64) | |
| Median | 91 | 104 | 99 | |
| Range | 50.0–160.0 | 51.0–196.0 | 50.0–196.0 | |
| Respiration rate (BPM) | 0.1082a | |||
| N | 128 | 215 | 343 | |
| Mean (SD) | 23.4 (9.52) | 24.6 (9.08) | 24.2 (9.25) | |
| Median | 20.5 | 22 | 22 | |
| Range | 8.0–50.0 | 10.0–50.0 | 8.0–50.0 | |
| SpO2 (%) | 0.3568a | |||
| N | 128 | 215 | 343 | |
| Mean (SD) | 96.9 (3.61) | 96.4 (4.56) | 96.6 (4.23) | |
| Median | 98 | 98 | 98 | |
| Range | 80.0–100.0 | 66.0–100.0 | 66.0–100.0 | |
| Albumin-corrected anion gap, baseline (mEq/L) | 0.7004a | |||
| N | 128 | 216 | 344 | |
| Mean (SD) | 10.9 (2.65) | 10.9 (2.62) | 10.9 (2.63) | |
| Median | 10.6 | 10.8 | 10.8 | |
| Range | 5.1–22.8 | 4.5–17.8 | 4.5–22.8 | |
| Albumin-corrected anion gap, ICU (mEq/L) | <0.0001a | |||
| N | 128 | 216 | 344 | |
| Mean (SD) | 15.5 (3.79) | 17.7 (4.8) | 16.9 (4.58) | |
| Median | 14.9 | 16.5 | 16.0 | |
| Range | 8.3–30.5 | 8.3–33.3 | 8.3–33.3 | |
| Serum HCO 3 , baseline (mEq/L) | 0.0126a | |||
| N | 128 | 216 | 344 | |
| Mean (SD) | 26.9 (3.18) | 26.0 (2.96) | 26.3 (3.07) | |
| Median | 27.0 | 26.2 | 26.7 | |
| Range | 17.0–38.0 | 17.3–33.0 | 24.3–28.0 | |
| Serum HCO 3 , ICU (mEq/L) | <0.0001a | |||
| N | 128 | 216 | 344 | |
| Mean (SD) | 20.7 (4.43) | 18.4 (4.60) | 19.2 (4.67) | |
| Median | 20.0 | 18.5 | 20.0 | |
| Range | 9.0–35.0 | 6.0–29.0 | 6.0–35.0 | |
| Albumin, baseline (g/dl) | 0.7961a | |||
| N | 128 | 216 | 344 | |
| Mean (SD) | 3.4 (0.61) | 3.3 (0.62) | 3.4 (0.61) | |
| Median | 3.3 | 3.,3 | 3.3 | |
| Range | 1.5–4.9 | 1.7–5.2 | 1.5–5.2 | |
| Albumin, ICU (g/dl) | 0.6732a | |||
| N | 128 | 216 | 344 | |
| Mean (SD) | 2.4 (0.59) | 2.4 (0.69) | 2.4 (0.66) | |
| Median | 2.4 | 2.4 | 2.4 | |
| Range | 1.3–5.1 | 1.0–4.8 | 1.0–5.1 | |
| Blood glucose (mg/dl) | 0.0385a | |||
| N | 119 | 200 | 319 | |
| Mean (SD) | 141.6 (56.15) | 177.3 (117.12) | 164.0 (100.26) | |
| Median | 128 | 138 | 134 | |
| Range | 39.0–361.0 | 18.0–923.0 | 18.0–923.0 | |
| Hemoglobin (g/dl) | 0.6043a | |||
| N | 128 | 216 | 344 | |
| Mean (SD) | 9.9 (1.75) | 10.1 (2.52) | 10.1 (2.27) | |
| Median | 10.1 | 9.9 | 9.9 | |
| Range | 5.1–14.3 | 3.9–16.9 | 3.9–16.9 | |
| BUN (mg/dl) | 0.8300a | |||
| N | 128 | 214 | 342 | |
| Mean (SD) | 43.0 (31.92) | 43.8 (34.06) | 43.5 (33.23) | |
| Median | 35.5 | 33 | 34 | |
| Range | 4.0–171.0 | 4.0–218.0 | 4.0–218.0 | |
| Sodium (mEq/L) | 0.6374a | |||
| N | 128 | 216 | 344 | |
| Mean (SD) | 136.5 (5.97) | 136.6 (6.52) | 136.6 (6.31) | |
| Median | 136 | 137 | 137 | |
| Range | 120.0–159.0 | 113.0–165.0 | 113.0–165.0 | |
| Potassium (mEq/L) | 0.2601a | |||
| N | 128 | 216 | 344 | |
| Mean (SD) | 4.1 (0.88) | 4.2 (0.75) | 4.2 (0.80) | |
| Median | 4 | 4.1 | 4.1 | |
| Range | 2.5–8.4 | 2.4–7.3 | 2.4–8.4 | |
| Creatinine (mg/dl), baseline | 0.1310a | |||
| N | 128 | 216 | 344 | |
| Mean (SD) | 1.6 (1.55) | 1.4 (1.44) | 1.5 (1.48) | |
| Median | 1.1 | 1 | 1 | |
| Range | 0.4–9.9 | 0.3–10.5 | 0.3–10.5 | |
| Calcium (mg/dl) | 0.2669a | |||
| N | 114 | 188 | 302 | |
| Mean (SD) | 8.0 (0.99) | 7.8 (0.96) | 7.9 (0.97) | |
| Median | 7.9 | 7.9 | 7.9 | |
| Range | 4.9–11.2 | 5.2–11.8 | 4.9–11.8 | |
| Magnesium (mg/dl) | 0.1715a | |||
| N | 128 | 213 | 341 | |
| Mean (SD) | 1.9 (0.45) | 1.9 (0.50) | 1.9 (0.48) | |
| Median | 1.9 | 1.8 | 1.9 | |
| Range | 0.5–4.4 | 0.8–4.8 | 0.5–4.8 | |
| Phosphorus (mg/dl) | 0.0920a | |||
| N | 127 | 212 | 339 | |
| Mean (SD) | 4.1 (2.12) | 4.4 (1.99) | 4.3 (2.04) | |
| Median | 3.4 | 4 | 3.8 | |
| Range | 1.6–11.2 | 1.0–12.0 | 1.0–12.0 |
BMI, body mass index; BPM, breaths per minute; COVID-19, coronavirus disease 2019; ICU, intensive care unit; SOFA, sequential organ failure assessment.
Kruskal–Wallis P value.
Chi-squared P value.
The mean ΔAG/ΔHCO3 using each patient's individual baseline AG and serum HCO3 was 1.20 with a SD of 1.50, while the mean ΔAG/ΔHCO3 using mean normal AG and serum HCO3 was 1.6 with a SD of 3.76. The mean ΔLactate/ΔHCO3 was 0.6 with an SD of 0.67.
Figure 2 shows the linear regression model examining ΔLactate and ΔAG. The r = 0.65 with a P value of <0.001. The R-square (R2) is 0.42. Figure 3 shows the linear regression model examining arterial pH and the ΔAG/ΔHCO3 ratio. The r = 0.095 with a P value of 0.501. Figure 4 shows the linear regression model between serum chloride and the ΔAG/ΔHCO3 ratio. The r = 0.212 with a P value of 0.002. Figure 5 shows the linear regression model examining systolic BP and ΔAG/ΔHCO3. The r = 0.053 with a P value of 0.438. Figure 6 shows the linear regression model between ΔHCO3 and ΔAG. The r = 0.51 with a P value of <0.001. Dashed lines represent the 95% prediction interval.
Figure 2.
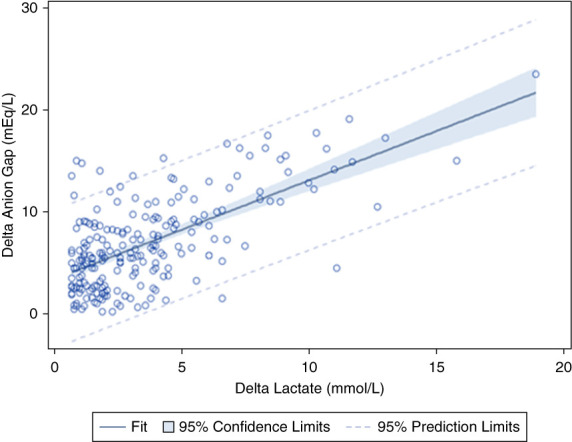
Pearson correlation between ΔLactate and ΔAG. r = 0.65, P < 0.001. ΔAG, delta anion gap.
Figure 3.
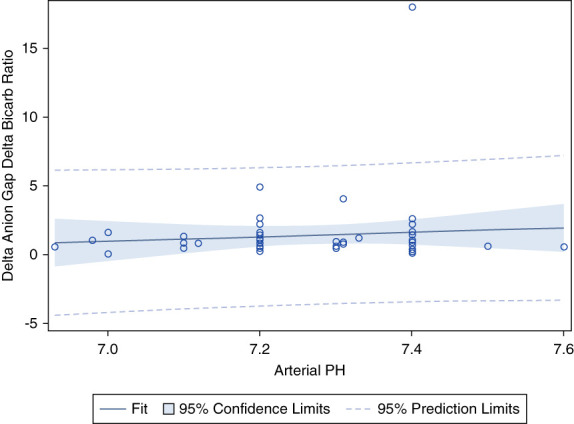
Pearson correlation between arterial pH and ΔAG/ΔHCO3. r = 0.095, P = 0.501. ΔHCO3, delta bicarbonate.
Figure 4.
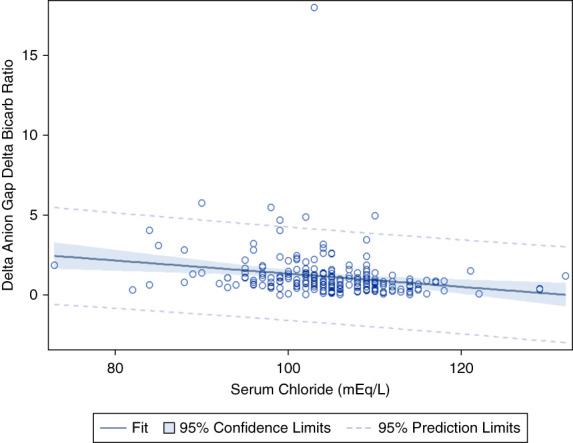
Pearson correlation between serum chloride and ΔAG/ΔHCO3. r = 0.212, P = 0.002.
Figure 5.
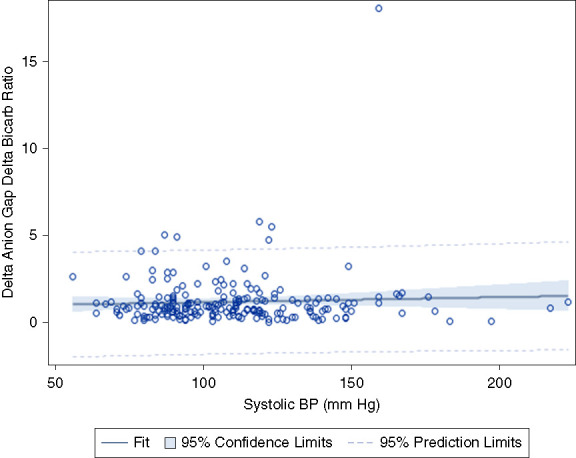
Pearson correlation between systolic BP and ΔAG/ΔHCO3. r = 0.053, P = 0.438
Figure 6.
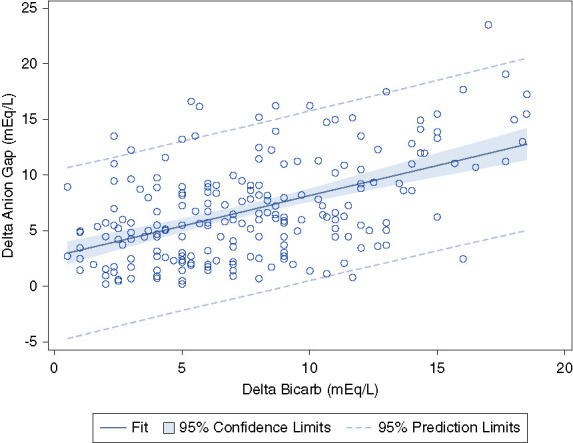
Pearson correlation between ΔHCO3 and ΔAG. r = 0.51, P < 0.001. Dashed lines represent the 95% prediction interval.
Discussion
This study is a retrospective cohort of 344 patients from a large integrated health care system admitted to the ICU with sepsis (Figure 1). The characteristics of the patients in this study are consistent with the characteristics typically seen in patients admitted to the ICU with sepsis (Table 1).
The ratio between the ΔAG, which signals alterations in the concentration of unmeasured anions, and ΔHCO3 has been used to evaluate for concurrent acid-base disorders in patients with underlying high anion gap metabolic acidosis.1 The accumulation of an organic acid, such as lactic acid, in the blood results in a reduction in serum HCO3. The accompanying anion, such as lactate, is conserved to maintain electroneutrality, resulting in a rise in the serum anion gap. Theoretically, the decrease in serum HCO3 corresponds to an equivalent increase in the anion gap, resulting in a ΔAG/ΔHCO3 ratio of 1. Consequently, any divergence from this 1:1 stoichiometry may reflect a concomitant acid-base disorder in addition to the anion gap metabolic acidosis. For example, a ΔAG/ΔHCO3 <1 may suggest a coexisting normal anion gap metabolic acidosis, whereas a ΔAG/ΔHCO3 >2 may suggest coexisting metabolic alkalosis.
There is variable stoichiometry of ΔAG/ΔHCO3 depending on the specific type of organic acidosis. In lactic acidosis, classic teaching holds that hydrogen ion buffering occurs in cells and bone, while only a small fraction of the lactate remains in the intracellular fluid space, preferentially residing within the extracellular fluid compartment. The lactate concentration in the extracellular fluid remains elevated because of decreased excretion from the kidney due to renal hypoperfusion, kidney dysfunction, and increased lactate absorption by sodium-lactate transporters. The net result is an increased ΔAG/ΔHCO3, with a mean ΔAG/ΔHCO3 ratio of 1.6–1.81 on the basis of the existing literature. However, the mean ΔAG/ΔHCO3 ratio of 1.6–1.8 described in lactic acidosis is based on limited animal and human data using mean normal values for anion gap and serum HCO3.1 This has an important effect on the calculation of the ratio and subsequent conclusions about the underlying pathophysiology.
To our knowledge, no previous study has determined the ΔAG/ΔHCO3 in lactic acidosis using each patient's individual baseline AG and serum HCO3. The main objective of this study was to examine the ΔAG/ΔHCO3 in lactic acidosis using each patient's individual baseline AG and serum ΔHCO3. Using each patient's individual baseline AG and serum ΔHCO3, the mean ΔAG/ΔHCO3 was 1.20 with a SD of 1.50. Notably, although the use of the actual normal AG baseline values of individual patients has been advocated for calculation of ΔAG/ΔHCO3 given wide interindividual variability in the anion gap,1 the mean ΔAG/ΔHCO3 ratio of 1.6–1.8 described in lactic acidosis is based on the existing literature which used mean normal values for AG and HCO3. Our study was consistent with prior literature when using mean normal anion gap and serum HCO3, yielding a mean ΔAG/ΔHCO3 of 1.6. This has important clinical implications; for example, if the ΔAG/ΔHCO3 using a patient's own baseline AG and serum HCO3 is 1.20 and the ΔAG/ΔHCO3 ratio in lactic acidosis is 1.6–1.8 on the basis of prior literature, an erroneous assumption may be made that there is a concurrent normal anion gap metabolic acidosis. The result may be misdiagnosis of complex acid-base disorders and inappropriate treatment.
In addition to establishing that the mean ΔAG/ΔHCO3 in lactic acidosis using each patient's individual baseline AG and serum ΔHCO3 is 1.2, our study helps elucidate the reasons for the high ΔAG/ΔHCO3 ratio. Five possible explanations for the deviation in 1:1 stoichiometry have been proposed. Our prior work examined these explanations, although use of mean normal values for AG and HCO3 had an important effect on the calculation of the ratio and subsequent conclusions about the underlying pathophysiology.9
First, it has been suggested that lactate preferentially resides in the extracellular fluid compartment, accumulating further because of decreased urinary excretion of lactate anion because of reduced renal function; in contrast, a significant proportion of hydrogen ions that accompany the lactate are buffered in cells and bone. The larger space of distribution of hydrogen ions compared with lactate anions has been proposed to result in a ΔAG/ΔHCO3 ratio of >1. The assumption underlying this theory is that the increase in AG relative to the decrease in HCO3 is a result of an increase in extracellular lactate. Our data demonstrate a mean ΔAG/ΔHCO3 of 1.2, differing from the mean ΔAG/ΔHCO3 ratio of 1.6–1.8 in previous studies of lactic acidosis in humans which used mean normal AG and HCO3.4,7–9 By contrast, the mean ΔLactate/ΔHCO3 was 0.60 (SD 0.67). In addition, Figure 2 demonstrates that the ΔLactate can only explain 42% of the observed variance in the ΔAG. Collectively, these data indicate that the high ΔAG that results in an increased ΔAG/ΔHCO3 ratio is not predominantly a result of increased extracellular lactate, as the traditional proposed model suggests. These results are consistent with our prior study examining the ΔAG/ΔHCO3 in trauma patients with lactic acidosis due to hypovolemic shock, although that study used mean normal values for serum AG and plasma HCO3.9
Second, theoretically, organic or inorganic anions or cations may demonstrate a pH-dependent contribution to the anion gap as the pH drops. For example, in metabolic alkalosis, the negative charge of albumin and the concentration of albumin (when accompanied by volume depletion) both increase with a rise in pH. Because albumin is the major contributor to the anion gap, the net result is an elevated anion gap in metabolic alkalosis. On the contrary, a drop in pH may alter the degree to which certain anions and cations contribute to the anion gap, resulting in a high AG and an elevated ΔAG/ΔHCO3 ratio. However, Figure 3 demonstrates that there is no statistically significant association between arterial pH and the ΔAG/ΔHCO3 ratio (P = 0.501). Consequently, the pH-dependent contribution of anions or cations does not explain the increased ΔAG/ΔHCO3 ratio observed in lactic acidosis. These results are again consistent with our previous study in patients with trauma.9
Third, based on an animal model, Madias et al.3 suggested that hypochloremia may account for 30%–50% of the rise in anion gap seen in lactic acidosis, resulting in a deviation from 1:1 stoichiometry and elevated ΔAG/ΔHCO3 ratio. The reduction of serum chloride results from extrusion of cellular cations and resultant expansion of the extracellular compartment during the buffering process in lactic acidosis. Figure 4 demonstrates that while there is a statistically significant association between serum chloride and the ΔAG/ΔHCO3 ratio (P = 0.002), serum chloride can only explain 4.5% of the ΔAG. Notably, our previous work examining the ΔAG/ΔHCO3 ratio in trauma patients with lactic acidosis due to hypovolemic shock did not show a significant correlation between serum chloride and ΔAG/ΔHCO3.9 However, that study only included 45 patients with elevated serum lactate levels and may have been underpowered to detect an association. Regardless, hypochloremia is not a major contributor to the increase in ΔAG/ΔHCO3. Conversely, in the presence of a superimposed hyperchloremic or normal AG metabolic acidosis, an increase in serum chloride (indicating hyperchloremic metabolic acidosis as can be seen with normal saline or diarrhea) would be expected to be associated with a decrease in the ΔAG/ΔHCO3. Figure 4 demonstrates a P value of 0.002 indicating that there is a statistically significant association between ΔAG/ΔHCO3 and serum chloride. However, the R2 is 0.045, suggesting that hyperchloremic metabolic acidosis does not play a clinically significant role in the variability seen in the ΔAG/ΔHCO3. Finally, if there was a concurrent non AG metabolic acidosis, the ΔAG/ΔHCO3 calculated using mean normal AG and HCO3 would be decreased. However, although the ΔAG/ΔHCO3 using baseline AG and HCO3 is 1.2, when calculated using mean normal values, it is 1.6, consistent with the previous literature.
Fourth, theoretically the severity of the shock and degree of hypoperfusion may affect the ΔAG/ΔHCO3. For example, the ΔAG/ΔHCO3 may be higher in profound lactic acidosis with severe septic shock and tissue hypoperfusion. However, Figure 5 demonstrates that there is no statistically significant association between systolic BP and the ΔAG/ΔHCO3 ratio (P = 0.438). This demonstrates that severe hypotension and organ hypoperfusion do not affect the ΔAG/ΔHCO3.
Fifth, given the absence of alternative explanations, it is likely that the increase in AG that results in an elevated ΔAG/ΔHCO3 ratio is comprised of unknown organic anions (or less likely because of decrease in unmeasured cations). Our data are consistent with the previous literature and demonstrates that in lactic acidosis, blood lactate only explains 42% of the observed variance in the anion gap.11–13 In other words, lactic acid does not entirely account for the anion gap metabolic acidosis. Some studies have identified increased concentrations of Krebs cycle intermediates, including citrate, isocitrate, and α-ketoglutarate.14,15 Importantly, these unmeasured anions may increase in response to less severe tissue hypoperfusion and increase earlier than the rise in serum lactate, allowing earlier detection and treatment of sepsis before the onset of lactic acidosis.10 This highlights the importance of carrying out further work to identify and characterize these unmeasured anions.
While attempts to identify the unmeasured anions in lactic acidosis are ongoing, the ΔAG/ΔHCO3 remains a widely used tool to detect complex acid-base disorders in patients with lactic acidosis and other high anion gap metabolic acidosis. The wide 95% prediction limits suggest that ΔAG/ΔHCO3 should be used cautiously in the diagnosis of mixed acid-base disorders (Figure 6). As an example, although the mean ΔAG/ΔHCO3 was 1.2, the SD was 1.5. In addition, it should be recognized that the AG is not a sensitive screening tool for hyperlactatemia.10,16
To our knowledge, our study was the first to determine the ΔAG/ΔHCO3 in lactic acidosis using each patient's individual baseline AG and serum HCO3. The strengths of the study are that the anion gaps were corrected for albumin, and this study contains the most precise data to date given that the ΔAG and ΔHCO3 were calculated using individual patient's own baseline values.
However, the study does have some limitations. First, our study is retrospective. However, our demographics are similar to a typical population of patients with sepsis admitted to the ICU, the ranges of laboratory values spanned the clinically important range, and the study used a pathophysiology-based approach (rather than examining patient outcomes), making it unlikely that systematic bias was introduced. Second, anion gap and lactate were only obtained on ICU admission. Sequential measurements may have provided additional information. Third, our study only examined patients with sepsis and septic shock. However, because most forms of type-A lactic acidosis are due to marked tissue hypoperfusion, it is likely that the results of this study will apply not just to sepsis and septic shock but also to other pathophysiologic states characterized by tissue hypoperfusion, including cardiac failure, hypovolemic shock, and cardiopulmonary arrest. Fourth, the analysis did not adjust for medications associated with lactic acidosis (including propofol, metformin, or linezolid) given that we used a pathophysiology-based approach and did not examine clinical outcomes. However, it is worth noting that there was not increased use of these medications associated with lactic acidosis in the high lactate group compared with the normal lactate group, suggesting that these medications did not play a significant role in the group that developed lactic acidosis (Table 1). Fifth, the delta lactate was determined using the mean lactate level of patients with normal serum lactate levels in the ICU because outpatient lactate levels are not routinely drawn. This may have introduced a degree of inaccuracy in calculating the ΔLactate/ΔHCO3. Finally, the study used a pathophysiology-based approach and did not examine clinical outcomes such as length of stay or in-hospital mortality.
The mean ΔAG/ΔHCO3 was 1.20 in patients with lactic acidosis because of sepsis and septic shock, using each patient's individual baseline AG and serum ΔHCO3. The classic teaching is that this deviation in 1:1 stoichiometry results from intracellular buffering of protons while lactate remains principally distributed in the extracellular space, although our study provides further support in implicating unmeasured anions as the cause.
Acknowledgments
Portions of this manuscript were presented as an oral abstract presentation (SA-OR45) at the American Society of Nephrology Kidney Week 2023.
Disclosures
Disclosure forms, as provided by each author, are available with the online version of the article at http://links.lww.com/KN9/A579.
Funding
R.M. Treger: Kaiser Permanente Division of Research (KP-RRC-20210504).
Author Contributions
Conceptualization: Richard M. Treger.
Data curation: Richard M. Treger.
Formal analysis: In-Lu Amy Liu, Jiaxiao Shi, Hubert Song, Richard M. Treger.
Investigation: Deborah Lu, Richard M. Treger.
Methodology: Richard M. Treger.
Resources: Richard M. Treger.
Supervision: Richard M. Treger.
Writing – original draft: Richard M. Treger.
Writing – review & editing: Deborah Lu, Richard M. Treger.
Data Sharing Statement
Previously published data were used for this study. Hussain M, Zaki KE, Asef MA, Song H, Treger RM: Unmeasured Organic Anions as Predictors of Clinical Outcomes in Lactic Acidosis due to Sepsis. J Intensive Care Med. 2023 Jun 2:8850666231177602. doi: 10.1177/08850666231177602. Epub ahead of print. PMID: 37264611.
References
- 1.Kraut JA, Madias NE. Serum anion gap: its uses and limitations in clinical medicine. Clin J Am Soc Nephrol. 2007;2(1):162–174. doi: 10.2215/CJN.03020906 [DOI] [PubMed] [Google Scholar]
- 2.Oster JR, Perz GO, Vaamonde CA. Relationship between blood pH and potassium and phosphorus during acute metabolic acidosis. Am J Physiol. 1978;235(4):F345–F351. doi: 10.1152/ajprenal.1978.235.4.F345 [DOI] [PubMed] [Google Scholar]
- 3.Homer SM, Johns CA, Cohen JJ, Cohen JJ. Hypochloremia as a consequence of anion gap metabolic acidosis. J Lab Clin Med. 1984;104(1):15–23. PMID: 6736748 [PubMed] [Google Scholar]
- 4.Orringer CE, Eustace JC, Wunsch CD, Gardner LB. Natural history of lactic acidosis after grand-mal seizures. A model for the study of an anion-gap acidosis not associated with hyperkalemia. N Engl J Med. 1977;297(15):796–799. doi: 10.1056/NEJM197710132971502 [DOI] [PubMed] [Google Scholar]
- 5.Brivet F, Bernardin M, Cherin P, Chalas J, Galanaud P, Dormont J. Hyperchloremic acidosis during grand mal seizure lactic acidosis. Intensive Care Med. 1994;20(1):27–31. doi: 10.1007/BF02425050 [DOI] [PubMed] [Google Scholar]
- 6.Kim HY Han JS Jeon US, et al. Clinical significance of the fractional excretion of anions in metabolic acidosis. Clin Nephrol. 2001;55(6):448–452. PMID: 11434355 [PubMed] [Google Scholar]
- 7.Waters WC, Hall JD, Schwartz WB. Spontaneous lactic acidosis. Am J Med. 1963;35(6):781–793. doi: 10.1016/0002-9343(63)90240-7 [DOI] [PubMed] [Google Scholar]
- 8.Oh MS, Carroll HJ, Goldstein DA, Fein IA. Hyperchloremic acidosis during the recovery phase of diabetic ketosis. Ann Intern Med. 1978;89(6):925–927. doi: 10.7326/0003-4819-89-6-925 [DOI] [PubMed] [Google Scholar]
- 9.Rudkin SE, Grogan TR, Treger RM. The Δ anion gap/Δ bicarbonate ratio in early lactic acidosis: time for another delta? Kidney360. 2021;2(1):20–25. doi: 10.34067/KID.0000842019 [DOI] [PMC free article] [PubMed] [Google Scholar]
- 10.Hussain M, Zaki KE, Asef MA, Song H, Treger RM. Unmeasured organic anions as Predictors of clinical outcomes in lactic acidosis due to sepsis. J Intensive Care Med. 2023;38(10):975–982. doi: 10.1177/08850666231177602 [DOI] [PubMed] [Google Scholar]
- 11.Levraut J Bounatirou T Ichai C, et al. Reliability of anion gap as an indicator of blood lactate in critically ill patients. Intensive Care Med. 1997;23(4):417–422. doi: 10.1007/s001340050350 [DOI] [PubMed] [Google Scholar]
- 12.Mikulaschek A, Henry SM, Donovan R, Scalea TM. Serum lactate is not predicted by anion gap or base excess after trauma resuscitation. J Trauma. 1996;40(2):218–224. doi: 10.1097/00005373-199602000-00008 [DOI] [PubMed] [Google Scholar]
- 13.Mecher C, Rackow EC, Astiz ME, Weil MH. Unaccounted for anion in metabolic acidosis during severe sepsis in humans. Crit Care Med. 1991;19(5):705–711. doi: 10.1097/00003246-199105000-00018 [DOI] [PubMed] [Google Scholar]
- 14.Forni LG, McKinnon W, Lord GA, Treacher DF, Peron J-MR, Hilton PJ. Circulating anions usually associated with the Krebs cycle in patients with metabolic acidosis. Crit Care. 2005;9(5):R591–R595. doi: 10.1186/cc3806 [DOI] [PMC free article] [PubMed] [Google Scholar]
- 15.Forni LG, McKinnon W, Hilton PJ. Unmeasured anions in metabolic acidosis: unravelling the mystery. Crit Care. 2006;10(4):220–224. doi: 10.1186/cc4954 [DOI] [PMC free article] [PubMed] [Google Scholar]
- 16.Iberti TJ, Leibowitz AB, Papadakos PJ, Fischer EP. Low sensitivity of the anion gap as a screen to detect hyperlactatemia in critically ill patients. Crit Care Med. 1990;18(3):275–277. doi: 10.1097/00003246-199003000-00005 [DOI] [PubMed] [Google Scholar]
Associated Data
This section collects any data citations, data availability statements, or supplementary materials included in this article.
Data Availability Statement
Previously published data were used for this study. Hussain M, Zaki KE, Asef MA, Song H, Treger RM: Unmeasured Organic Anions as Predictors of Clinical Outcomes in Lactic Acidosis due to Sepsis. J Intensive Care Med. 2023 Jun 2:8850666231177602. doi: 10.1177/08850666231177602. Epub ahead of print. PMID: 37264611.


