

Abstract
Key Points
Higher levels of IL-6, IL-8, monocyte chemoattractant protein-1, TNF-α, and IFN-γ in patients with autosomal dominant polycystic kidney disease highlight inflammation's role in disease progression.
Elevated inflammatory markers in autosomal dominant polycystic kidney disease could serve as biomarkers for progression and targets for therapy.
Background
Autosomal dominant polycystic kidney disease (ADPKD) is a genetic ciliopathy that causes adult-onset progressive renal failure. Inflammation and the resulting fibrosis play a crucial role in the pathogenesis. In recent years, an increasing number of inflammatory markers, such as monocyte chemoattractant protein-1 (MCP-1) and TNF-α, that are associated with the development and progression of ADPKD have been identified. The objective of this study was to identify and evaluate potential proinflammatory biomarkers in patients with ADPKD from the German AD(H)PKD registry.
Methods
In this exploratory pilot study, serum concentrations of IL-1β, IL-2, IL-6, IL-8, IL-10, IL-13, IFN-γ, MCP-1, and TNF-α were measured by multiplex immunoassay in 233 adults patients with ADPKD from the German AD(H)PKD registry and compared with an age- and sex-matched healthy control group (n=30).
Results
IL-6, IL-8, MCP-1, TNF-α, and IFN-γ concentrations were significantly higher in patients with ADPKD than in healthy controls. In addition, sex influenced the concentrations of MCP-1 and TNF-α in the ADPKD and control groups (MCP-1 male=134.8 pg/L, female=75.11 pg/L; P = 0.0055; TNF-α male=26.22 pg/L, female=21.08 pg/L; P = 0.0038).
Conclusions
Patients with ADPKD have significantly higher levels of IL-6, IL-8, MCP-1, TNF-α, and IFN-γ compared with healthy individuals. These findings underline that inflammation may play a crucial role in the pathogenesis of ADPKD and may be a potential target, both as biomarkers and for therapeutic interventions.
Clinical Trial registration number:
Visual Abstract

Introduction
Autosomal dominant polycystic kidney disease (ADPKD) is the most common genetic disorder leading to kidney failure.1 Although the primary cause of ADPKD is monogenic, with mutations in either the PKD1 or PKD2 gene in most cases,2 emerging evidence suggests that inflammatory and fibrotic processes may contribute to disease progression.3,4 Understanding the role of inflammation and fibrosis in ADPKD is crucial for the development of targeted therapeutic strategies aimed at slowing disease progression. While subclinical inflammation and advancement of CKD5 correlate in general, in-depth evidence regarding the progression of ADPKD is limited. Limits of detection are provided in Supplemental Table 1. Nonetheless, mounting evidence suggests that inflammation may manifest itself early on in the progression of the disease. A limited number of studies have documented the existence of an inflammatory component in both human subjects with polycystic kidney disease (PKD) and rodent models.6–9 Cytokines, which are crucial immune mediators, play a central role in regulating cell responses and the maturation of specific cell populations. Dysregulation of these complex signaling pathways often indicates the onset of pathological events. Hence, investigating the involvement of inflammation and cytokines in ADPKD is an important research question. Proinflammatory cytokines IL-1β, TNF-α, and IL-2 were identified in the cyst fluid of human kidneys affected by PKD.10,11 Furthermore, fibrosis has been implicated as a contributing factor to progression in ADPKD.12 As the cysts grow, they apply stress on adjacent tubules, which induces the synthesis of chemokines and cytokines.13 This sets off a positive feedback loop that sustains additional tubulointerstitial fibrosis. Consequently, beyond therapeutic opportunity, cytokines may be interesting biomarkers specific to ADPKD, which can provide valuable insights into disease severity and progression.
Although the use of cytokines and chemokines as biomarkers for ADPKD is still in its early stages, studies have demonstrated elevated levels of certain cytokines in the blood and urine of patients with ADPKD, suggesting their potential as diagnostic and prognostic markers. For instance, increased levels of IL-6 and IL-8 in urine have been correlated with disease severity and progression.14 In conclusion, while the primary cause of ADPKD lies in genetic mutations, emerging evidence suggests that inflammation and fibrosis contribute to disease progression and interindividual variation in outcome. Understanding the involvement of inflammatory and fibrotic processes, along with the identification of biomarkers, holds promise for the development of targeted interventions aimed at mitigating inflammation, reducing fibrosis, and ultimately slowing the progression of ADPKD. Consequently, we examined a panel of cytokines in a well-characterized cohort of patients with ADPKD and compared the results with healthy probands.
Methods
Study Population and Study Design
The German ADPKD registry (AD(H)PKD, NCT02497521), a prospective multicenter observational study that documents clinical and laboratory parameters, as well as imaging data of study participants on an annual basis, was used to select the study population. The AD(H)PKD study enrolls adult patients (18 years and older) with ADPKD presenting for tolvaptan therapy evaluation. The study population included 233 participants with AD(H)PKD between October 2015 and December 2017. Serum acquisition and analysis were performed in the framework of the “Elucidating the genetic pathomechanism underlying rare and hereditary kidney diseases” study (German Clinical Trials Register: DRKS00008910). Furthermore, 30 age- and sex-matched probands from a healthy control cohort (German Clinical Trials Register: DRKS00014637) were included in the analysis. All studies were approved by the local ethics committee and conducted in accordance with the Declaration of Helsinki and the International Conference on Harmonisation's guidelines for good clinical practice.
Serum Analysis and Multiplex Immunoassay
Blood samples were collected at the baseline or follow-up visit. Samples were centrifuged at 17,000×g and 4°C for 20 minutes. The serum samples were frozen at −80°C until further analysis. In collaboration with the Center for Molecular Medicine Cologne in Cologne, the concentrations of the cytokines IL-1β, IL-2, IL-4, IL-6, IL-8, IL-10, IL-13, IFN-γ, TNF-α, and monocyte chemoattractant protein-1 (MCP-1) were determined. Bio-Rad (Feldkirchen, Germany) Bio-Plex Pro Human Cytokine Assay on the Bio-Rad Bio-Plex 200 System was used to analyze 233 serum samples.
Calculation of the eGFR Slope
Baseline eGFR values were calculated using historical creatinine measurements from a period extending before and after the cytokine measurement dates. For each patient with at least three creatinine measurements, an eGFR slope was calculated. The models were developed using a robust linear modeling approach as implemented in the Modern Applied Statistics with S library.15 These models followed the simple equation shown in Equation (1) where Δdate was the time difference between the baseline cytokine measurement and the current creatinine measurement.
| (1) |
This slope represents the rate of eGFR change per year. Slopes were then extracted to be the parameter associated with Δdate (differences in days) and multiplied by 365 to retrieve an annual eGFR slope.
Statistical Analyses
A significance level of *(0.05), **(0.01), ***(0.001), and ****(0.0001) was used to classify P values < 0.05 as statistically significant. In the analysis, missing data were omitted. The data were subjected to a Shapiro–Wilk test to assess normality, unless otherwise specified, and the Levene test was used to examine equality of variance. The subsequent statistical tests were conducted in accordance with the quantities of tested groups, equality of variance, and normality: Mann–Whitney or Wilcoxon rank sum test (two groups deviating from normality), Tukey honest significant differences (two groups deviating from normality, equal variance), Games–Howell test (two groups deviating from normality, unequal variance), Dunn test of multiple comparisons (two groups deviating from normality), two-sample paired or unpaired Student t test (two groups with equal variance, and unequal variance), or Welch t test (two groups).
Results
Study Population
The study cohort consisted of 233 patients with ADPKD enrolled in the German AD(H)PKD registry. Figure 1 provides a summary of the study population.
Figure 1.
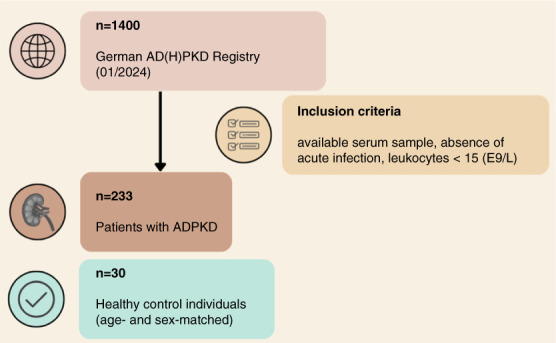
Study flow chart depicting patient flow, exclusion criteria, and subgroup analyses. ADPKD, autosomal dominant polycystic kidney disease.
Baseline Characteristics
The ADPKD cohort, with a median age of 45.42 years (range 18–69.90 years) and a slight female predominance (53.6%), had a mean eGFR of 69.24±27.19 ml/min per 1.73 m2 on the date of biosampling. The control group showed a median age of 43.71 years (range, 22.42–66.33 years) with a balanced gender distribution (Table 1). Kidney magnetic resonance imaging was available for all 233 patients. Kidney volume (height-adjusted total kidney volume [htTKV]) and eGFR levels varied within the ADPKD group, indicating a range of disease severities. A notable finding was the high prevalence of arterial hypertension (91.8%) and urological symptoms (72.5%) among patients with ADPKD.
Table 1.
Baseline characteristics of the autosomal dominant polycystic kidney disease cohort
| Parameter | ADPKD | Control |
|---|---|---|
| Age (yr), min/max | 18.0/69.90 | 22.42/66.33 |
| Median (Q1–Q3) | 45.42 (36.29–52.08) | 43.71 (31.11–53.98) |
| Total, N | 233 | 30 |
| Female, N (%) | 125 (53.6) | 15 (50) |
| Male, N (%) | 108 (46.4) | 15 (50) |
| Mayo classification | N (%) | n.a. |
| 1A | 3 (1.3) | |
| 1B | 55 (23.6) | |
| 1C | 88 (37.8) | |
| 1D | 60 (25.8) | |
| 1E | 27 (11.6) | |
| htTKV (ml/m), min/max | 229.70/5866.10 | n.a. |
| Median (Q1–Q3) | 883.60 (524.00–1334.50) | |
| eGFR | N (%) | n.a. |
| Mean | 69.24±27.19 | |
| 1 eGFR >90 ml/min per 1.73 m2 | 55 (23.6) | |
| 2 eGFR 60–89 ml/min per 1.73 m2 | 83 (35.6) | |
| 3a eGFR 45–59 ml/min per 1.73 m2 | 47 (20.2) | |
| 3b eGFR 30–44 ml/min per 1.73 m2 | 2 (0.9) | |
| 4 eGFR 15–29 ml/min per 1.73 m2 | 46 (19.7) | |
| 5 eGFR 15–0 ml/min per 1.73 m2 | — | |
| eGFR (ml/min per 1.73 m 2 ), min/max | 27/126 | n.a. |
| Median (Q1–Q3) | 64.00 (46.00–88.00) | |
| Genotype | N (%) | n.a. |
| PKD1 truncating | 71 (30.5) | |
| PKD1 nontruncating | 35 (15.0) | |
| PKD2 | 37 (15.8) | |
| Unknown | 90 (38.9) | |
| Arterial hypertension | N (%) | n.a. |
| Yes, no | 200 (85.8), 33 (14.2) | |
| <35 yr, ≥35 yr | 103 (44.2), 97 (41.6) | |
| Urological symptoms | N (%) | n.a. |
| Yes, no | 169 (72.5), 64 (27.5) | |
| <35 yr, ≥35 yr, age unknown | 97 (41.6), 71 (30.5), 1 (0.4) | |
| Tolvaptan intake | N (%) | n.a. |
| Yes, no | 33 (14.16), 200 (85.84) | |
| Antihypertensive medication | N (%) | n.a. |
| Yes, no | 214 (91.8), 19 (8.2) |
Urological symptoms consisted of hematuria, flank pain, cyst infection, or kidney stones. ADPKD, autosomal dominant polycystic kidney disease; htTKV, height-adjusted total kidney volume; n.a., not applicable.
We selected ten cytokines for our analysis panel on the basis of previous reports in the literature. Using the Bio-Plex Pro Human Cytokine Assay, these cytokines were compared in serum of patients with ADPKD and healthy control participants showing significant differences in four cytokines (Figure 2). Cytokines that did not exhibit significant differences among patients with ADPKD and controls are listed in Supplemental Table 2.
Figure 2.
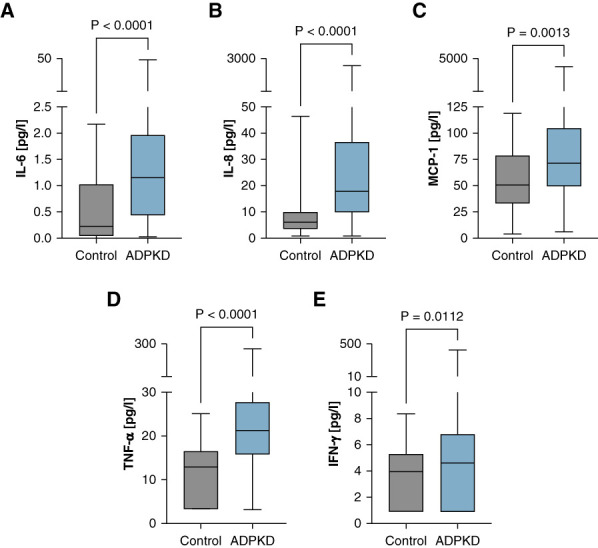
Patients with ADPKD show significantly higher levels of IL-6, IL-8, MCP-1, TNF-⍺, and IFN-γ. ADPKD (N=233) and control cohort (N=30). (A) IL-6, (B) IL-8, (C) MCP-1, (D) TNF-⍺, and (E) IFN-γ. The median is represented by the line within each box, the box defines the interquartile range, and the whiskers indicate the range of the data excluding outliers. The analysis used Mann–Whitney U test to assess the statistical significance of differences between the two groups. MCP-1, monocyte chemoattractant protein-1.
The cytokine profile analysis indicated a significant elevation of proinflammatory markers in the ADPKD cohort compared with the control group. Specifically, IL-6 levels were markedly higher in the ADPKD group, with the median concentration exceeding that of the control group (Figure 2A). IL-8 also showed a substantial increase in patients with ADPKD (Figure 2B). Both IL-6 and IL-8 are critical mediators in inflammation and immune response,16,17 and their elevated levels suggest a heightened state of immune activation in ADPKD. MCP-1, a cytokine involved in the recruitment of monocytes to sites of injury or inflammation,18 was significantly elevated in the ADPKD cohort (Figure 2C). TNF-α, a key regulator of the inflammatory response,19 was notably higher in patients with ADPKD (Figure 2D). The elevated levels of TNF-α align with previous research suggesting its involvement in cyst growth and progression in ADPKD. IFN-γ, a potent macrophage-activating factor that is secreted by immune cells in response to infections,20 was also found to be elevated in patients with ADPKD (Figure 2E). The inflammatory response was further corroborated by sex-based differences in cytokine levels (Figure 3).
Figure 3.

Sex-specific differences in ADPKD-associated cytokines. (A) IL-6, (B) IL-8, (C) MCP-1, (D) TNF-α, and (E) IFN-γ. The median is represented by the line within each box, the box defines the interquartile range, and the whiskers indicate the range of the data excluding outliers. The analysis used Mann–Whitney U test to assess the statistical significance of differences between the two groups and sexes. Only significant P values are depicted.
There were significant variations observed in the levels of IL-6, MCP-1, IL-8, TNF-α, and IFN-γ between both sexes and between patients with ADPKD and controls (Figure 3). Specifically, IL-6 levels were significantly higher in male controls compared with female controls (P = 0.0041) and in female patients with ADPKD compared with female controls (P = 0.0119) (Figure 3A). MCP-1 levels were significantly higher in male controls compared with female controls (P = 0.0408) and in both male (P = 0.0022) and female (P = 0.0055) patients with ADPKD compared with their respective controls (Figure 3B). IL-8 levels were significantly higher in male patients with ADPKD compared with female patients with ADPKD (P = 0.0037) and in female patients with ADPKD compared with female controls (P < 0.0001) (Figure 3C). TNF-α levels were significantly higher in male controls compared with female controls (P = 0.0079), in male patients with ADPKD compared with female patients with ADPKD (P < 0.0001), and in both male (P < 0.0001) and female (P = 0.0038) patients with ADPKD compared with their respective controls (Figure 3D). IFN-γ levels were significantly higher in male patients with ADPKD compared with female patients with ADPKD (P = 0.0364) (Figure 3E). These findings indicate that male participants exhibited notably elevated concentrations of MCP-1 and TNF-α in both cohorts. The correlation analysis between cytokines and age in patients with ADPKD showed a weak positive correlation for IL-6 (Supplemental Figure 1A), indicating that age might play a role in modulating certain aspects of inflammation in ADPKD. However, IL-8, MCP-1, TNF-α, and IFN-γ did not exhibit any significant age-related trends (Supplemental Figure 1, B–E), suggesting that the inflammatory state in ADPKD could be largely independent of the patient's age. No significant correlation was found between cytokine levels in the control group (Supplemental Figure 2).
Spearman correlation matrices (Supplemental Figure 3) demonstrated different patterns of cytokine inter-relationships between the ADPKD and control groups. The correlation matrix for the control group (Supplemental Figure 3A) illustrates a lack of strong intercytokine relationships, suggesting a relatively independent cytokine expression in the absence of disease. By contrast, the ADPKD group (Supplemental Figure 3B) exhibits more notable correlations among cytokines, such as between IFN-γ and MCP-1, indicating a more interconnected cytokine network that may reflect the complex inflammatory environment of ADPKD pathology.
When examining the relationship between cytokine levels and eGFR as a marker of renal function (Figure 4), only TNF-α demonstrated a significant negative correlation (Figure 4D). This finding suggests that TNF-α levels increase as eGFR declines, potentially reflecting an inflammatory response to kidney function impairment or a contributory role in renal function deterioration.
Figure 4.

TNF-α correlates with eGFR in the ADPKD cohort. (A) IL-6, (B) IL-8, (C) MCP-1, (D) TNF-α, and (E) IFN-γ. Each dot represents an individual patient's cytokine concentration, with a superimposed line indicating the trend on the basis of the Spearman correlation coefficient (r).
In addition, the htTKV-based Mayo classification, which is one of the most important classifiers of disease severity and future eGFR loss in ADPKD,21 showed that concentrations of IL-6 and TNF- were significantly higher in patients classified as 1C–E compared with 1A–B (Figure 5), suggesting an association between IL-6 and TNF-α levels and disease progression. To further understand the relationship between cytokine levels and disease severity, we analyzed the correlation of cytokine levels with htTKV and eGFR using both continuous (Supplemental Figure 4) and quintile-based (Supplemental Figure 5) approaches. The quintile-based analysis of cytokine levels demonstrated that higher quintiles of IL-6 and TNF-α were significantly associated with increased htTKV, indicating a higher risk of disease progression in patients with elevated cytokine levels. Specifically, IL-6 levels were significantly higher in the highest quintile compared with the lowest (P = 0.0240), and TNF-α levels showed a significant increase in the higher quintiles (P = 0.0210).
Figure 5.
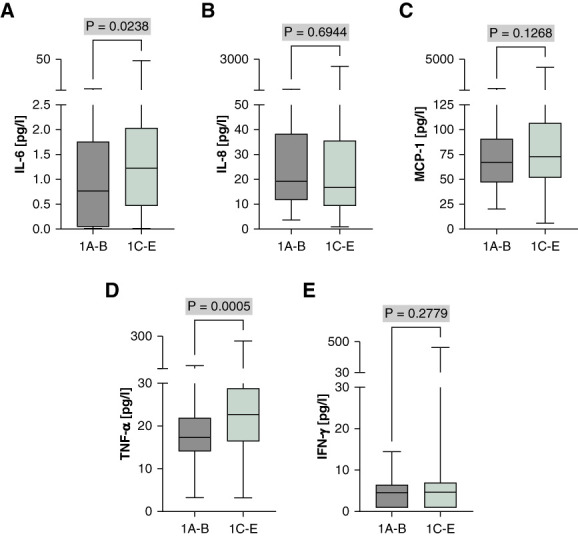
TNF-α and IL-6 show significantly higher levels in Mayo classes indicating rapid progression. (A) IL-6, (B) IL-8, (C) MCP-1, (D) TNF-α, and (E) IFN-γ. Individual cytokine levels were compared between Mayo classification groups 1A–B and 1C–E. The median is represented by the line within each box, the box defines the interquartile range, and the whiskers indicate the range of the data excluding outliers. The analysis used Mann–Whitney U test to assess the statistical significance of differences between the two groups.
Furthermore, to relate cytokine levels to actual kidney function loss over time, eGFR slope was evaluated (Figure 6). Notably, TNF-α demonstrated a significant negative correlation with the eGFR slope (displayed as quartiles), suggesting that higher TNF-α levels may be associated with a more rapid decline in renal function among patients with ADPKD. We further conducted this analysis for IL-6 not showing a clear relationship between eGFR slope and levels of this cytokine (Supplemental Figure 6).
Figure 6.
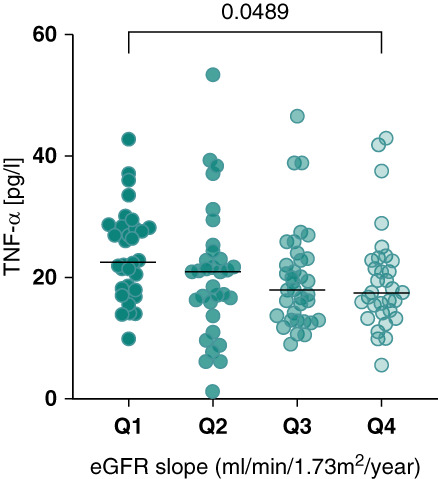
TNF-α in relation to the eGFR slope in patients with ADPKD. The eGFR slope was calculated using a robust linear model. Patients using tolvaptan were excluded from the analysis. Data points represent individual TNF-α measurements across the patient cohort, divided into quartiles on the basis of their eGFR slope: Q1 (highest eGFR slope, ranging from −7.777 to −3.861 ml/min per 1.73 m2 per year), Q2 (ranging from −3.734 to −2.263 ml/min per 1.73 m2 per year), Q3 (ranging from −2.197 to −0.936 ml/min per 1.73 m2 per year), and Q4 (lowest eGFR slope, ranging from −0.922 to 6.846 ml/min per 1.73 m2 per year). The range of the eGFR slope within the cohort is from −7.777 to 6.846 ml/min per 1.73 m2 per year, with a total range of 14.62 ml/min per 1.73 m2 per year. Only significant associations are shown with P value.
Discussion
ADPKD, which is characterized by the gradual formation of renal cysts, is caused by complex molecular pathways that extend beyond the underlying disease-causing genetic mutation. Inflammation, which is characteristic of a multitude of renal disorders, is progressively being acknowledged as a substantial factor in the progression of ADPKD.13,22 This study analyzed the cytokine milieu using a multiplex bead panel to gain a deeper insight into a set of ten cytokines.
Five of these—IL-6, IL-8, MCP-1, TNF-α, and IFN-γ—exhibited significant differences between the control group and patients diagnosed with ADPKD.
The pivotal role of TNF-α in the pathogenesis of ADPKD is increasingly evident,7,23 acting as an upstream regulator of inflammatory cascades that include key mediators such as MCP-1. The latter also emerges as a central figure in the inflammatory narrative of ADPKD.24 The multifaceted role of MCP-1 is evident in orchestrating macrophage accumulation around cysts through both proliferation-independent and proliferation-dependent mechanisms.25 Owing to this early involvement, MCP-1 may serve as a catalyst for the series of events that culminate in cyst enlargement.24 Consistent with previous studies that have highlighted the role of MCP-1 in cyst expansion dependent on macrophages, the results of this study underscore its importance in the pathophysiology of ADPKD. Notably, genetic knockout studies underline MCP-1's pivotal role by preventing pulmonary edema and extending survival in ADPKD mouse models.25 These insights highlight MCP-1 as a potential therapeutic target, given its influential position in the inflammatory pathways associated with ADPKD.26 The data from this study strengthen the hypothesis that TNF-α′s elevation precedes and potentially orchestrates the upregulation of MCP-1, which is substantiated by the significant correlations between these cytokines in both the control and ADPKD cohorts. This interconnected relationship underscores a sophisticated network of cytokine signaling that propels disease progression. Furthermore, the absence of a strong correlation between TNF-α levels and age suggests that the inflammatory milieu in ADPKD is driven by disease mechanisms rather than age-related immunological shifts, overshadowing the general age-related inflammatory increase observed in the broader population.27 This finding is crucial for understanding the disease's trajectory independent of the patient's age, indicating that targeted therapeutic strategies could focus primarily on disease-specific pathways. This is consistent with TNF-α′s established role in renal pathology and its potential as a therapeutic target.7,28–30
Gender disparities in cytokine levels, with higher concentrations of MCP-1 and TNF-α in male participants, point toward a sex-modulated inflammatory response in ADPKD. This is congruent with the observed variance in disease severity between male and female participants,21,31–33 potentially mediated by sex hormones, which may influence not only the immune response but also the therapeutic outcomes of interventions targeting these cytokines. Analysis of quintiles further supports these observations, showing significant associations of higher IL-6 and TNF-α levels with increased htTKV, suggesting a higher risk of disease progression in patients with elevated cytokine levels. Furthermore, several studies have reported cytokine levels among healthy individuals.34–38 While most studies show no sex differences in TNF-α at baseline, some report higher levels in women. In our control cohort, significant sex differences were observed, with male participants exhibiting higher levels of MCP-1 (P = 0.0408) and TNF-α (P = 0.0038) compared with female participants. These discrepancies may be attributed to differences in study populations, methodologies, or biological variability. Influencing factors include hormonal differences, genetic variability, lifestyle, environmental exposures, and underlying health conditions. The significant differences in cytokine levels in our study highlight the need for further research to elucidate the underlying mechanisms driving these variations and their implications for ADPKD progression and treatment strategies.
The correlation between cytokines further delineates the complex interplay among various cytokines, revealing potential synergistic or antagonistic relationships that could be leveraged to modulate the inflammatory landscape in ADPKD. The intricate patterns of cytokine interactions emphasize the necessity of a multifaceted approach to cytokine modulation. In addition, the bimodal distribution of IFN-γ levels could be attributed to inherent biological variability among patients with ADPKD because differences in individual immune responses influenced by genetic and environmental factors might contribute to this pattern. Although the sample handling was consistent, and patients did not have infections or take immunosuppressants, other factors influencing inflammatory status could play a role. In addition, there may be unidentified subgroups within the ADPKD population with distinct cytokine profiles, potentially characterized by specific genetic or molecular markers. Further analyses, including stratification by additional clinical or molecular parameters, could help identify the underlying causes of this bimodal distribution.
In conclusion, the present findings enrich our understanding of the inflammatory narrative in ADPKD. They reinforce the centrality of TNF-α as an upstream effector and highlight the consequential role of MCP-1 in disease progression. The findings derived from these analyses support the notion that ADPKD would benefit from a customized treatment strategy that targets particular cytokine profiles and takes patient demographics into account to mitigate the inflammatory response. Leveraging comprehensive knowledge of cytokine dynamics has the capacity to add new biomarkers to predict disease progression and transform therapeutic approaches in ADPKD toward precision medicine. Further research is necessary to understand these dynamics and the underlying mechanisms, which could provide deeper insights into the inflammatory processes in ADPKD.
The single time point measurement of cytokines does not capture their longitudinal behavior or response to disease progression. Variability in sample handling and storage conditions may have affected the stability and measurement of cytokines, potentially introducing bias into the data.
Besides, the analyses at hand are of explorative nature and not suited to answer the question whether these cytokines are independent contributors or biomarkers to disease progression. This would require the use of statistical models integrating eGFR, age, and other markers of disease progression on the basis of larger cohorts. While in this study serum samples were analyzed, future studies should address the importance of urinary cytokine levels. For eGFR slope associations, all available eGFR values have been used, whereas post-biomarker eGFR values could provide a clearer picture of the association between biomarker levels and future kidney function decline.
The smaller size of the control group may not provide a fully representative baseline for cytokine levels in the general population, which limits the strength of comparative analyses. Healthy controls provided a clear contrast to the ADPKD group, effectively isolating the effect of ADPKD on inflammatory cytokine levels. Future studies, however, should incorporate a broader range of control groups, including those with other kidney diseases, to provide a more comprehensive analysis. Furthermore, the study did not account for potential confounding factors, such as lifestyle, medication use, or other comorbidities that could influence cytokine levels.
Supplementary Material
Acknowledgments
We thank Cornelia Böhme for excellent technical support. Database generation was supported by “clinicalsurveys.net” (Sebastian Heimann, Jörg Janne Vehreschild).
Disclosures
Disclosure forms, as provided by each author, are available with the online version of the article at http://links.lww.com/KN9/A603.
Funding
R.-U. Müller: Ministerium für Innovation, Wissenschaft und Forschung des Landes Nordrhein-Westfalen (Nachwuchsgruppen.NRW 2015-2021), Deutsche Forschungsgemeinschaft (DI 1501/9, MU 3629/6-1, and MU 3629/10-1), Bundesministerium für Bildung und Forschung (RNA-STAB), Marga und Walter Boll-Stiftung, and PKD Foundation. F. Grundmann: Medizinische Fakultät, Universität zu Köln, Deutsche Forschungsgemeinschaft (GR 3932/2-2). S. Arjune: Medizinische Fakultät, Universität zu Köln, KfH-Stiftung Präventivmedizin, and CECAD-Rotations program. M.R. Späth: Deutsche Forschungsgemeinschaft (FI 773/15-1). This work was supported by Thermo Fisher Scientific, Otsuka Pharmaceutical, and Deutsche Forschungsgemeinschaft (491454339).
Author Contributions
Conceptualization: Roman-Ulrich Müller, Esther Mahabir.
Data curation: Sita Arjune, Franziska Grundmann, Katharina Lettenmeier, Esther Mahabir, Polina Todorova.
Formal analysis: Sita Arjune, Katharina Lettenmeier, Polina Todorova.
Funding acquisition: Franziska Grundmann, Roman-Ulrich Müller.
Investigation: Sita Arjune, Franziska Grundmann, Katharina Lettenmeier, Roman-Ulrich Müller, Esther Mahabir, Mohamed Majjouti, Martin Richard Späth, Polina Todorova.
Methodology: Sita Arjune, Katharina Lettenmeier, Esther Mahabir, Mohamed Majjouti, Polina Todorova.
Project administration: Roman-Ulrich Müller, Esther Mahabir.
Resources: Roman-Ulrich Müller.
Software: Sita Arjune, Katharina Lettenmeier.
Supervision: Sita Arjune, Roman-Ulrich Müller, Esther Mahabir.
Validation: Sita Arjune.
Visualization: Sita Arjune, Katharina Lettenmeier.
Writing – original draft: Sita Arjune, Roman-Ulrich Müller.
Writing – review & editing: Sita Arjune, Franziska Grundmann, Katharina Lettenmeier, Roman-Ulrich Müller, Esther Mahabir, Mohamed Majjouti, Martin Richard Späth, Polina Todorova.
Data Sharing Statement
All data are included in the manuscript and/or supporting information.
Supplemental Material
This article contains the following supplemental material online at http://links.lww.com/KN9/A602.
Supplemental Table 1. Limit of detection for tested cytokines using the Bio-Plex Pro human cytokine assay.
Supplemental Table 2. Comparison of individual cytokine level. The analysis used Mann–Whitney U test to assess the statistical significance of differences between the two groups.
Supplemental Figure 1. Cytokines among different age groups in patients with ADPKD.
Supplemental Figure 3. Spearman correlation matrix for cytokines in control individuals (A) versus patients with ADPKD (B).
Supplemental Figure 4. Correlation of cytokine levels with htTKV in patients with ADPKD.
Supplemental Figure 5. Association of htTKV with cytokines divided into quintiles in patients with ADPKD.
Supplemental Figure 6. IL-6 in relation to eGFR slope in patients with ADPKD.
References
- 1.Müller R-U, Benzing T. Management of autosomal-dominant polycystic kidney disease—state-of-the-art. Clin Kidney J. 2018;11(suppl 1):i2–i13. doi: 10.1093/ckj/sfy103 [DOI] [PMC free article] [PubMed] [Google Scholar]
- 2.Cornec-Le Gall E, Torres VE, Harris PC. Genetic complexity of autosomal dominant polycystic kidney and liver diseases. J Am Soc Nephrol. 2018;29(1):13–23. doi: 10.1681/ASN.2017050483 [DOI] [PMC free article] [PubMed] [Google Scholar]
- 3.Grantham JJ, Mulamalla S, Swenson-Fields KI. Why kidneys fail in autosomal dominant polycystic kidney disease. Nat Rev Nephrol. 2011;7(10):556–566. doi: 10.1038/nrneph.2011.109 [DOI] [PubMed] [Google Scholar]
- 4.Zimmerman KA, Hopp K, Mrug M. Role of chemokines, innate and adaptive immunity. Cell Signal. 2020;73:109647. doi: 10.1016/j.cellsig.2020.109647 [DOI] [PMC free article] [PubMed] [Google Scholar]
- 5.Rapa SF, Di Iorio BR, Campiglia P, Heidland A, Marzocco S. Inflammation and oxidative stress in chronic kidney disease—potential therapeutic role of minerals, vitamins and plant-derived metabolites. Int J Mol Sci. 2019;21(1):263. doi: 10.3390/ijms21010263 [DOI] [PMC free article] [PubMed] [Google Scholar]
- 6.Swenson-Fields KI Ward CJ Lopez ME, et al. Caspase-1 and the inflammasome promote polycystic kidney disease progression. Front Mol Biosci. 2022;9:971219. doi: 10.3389/fmolb.2022.971219 [DOI] [PMC free article] [PubMed] [Google Scholar]
- 7.Li X Magenheimer BS Xia S, et al. A tumor necrosis factor-alpha-mediated pathway promoting autosomal dominant polycystic kidney disease. Nat Med. 2008;14(8):863–868. doi: 10.1038/nm1783 [DOI] [PMC free article] [PubMed] [Google Scholar]
- 8.Roix J, Saha S. TNF-α blockade is ineffective in animal models of established polycystic kidney disease. BMC Nephrol. 2013;14:233. doi: 10.1186/1471-2369-14-233 [DOI] [PMC free article] [PubMed] [Google Scholar]
- 9.Park SK Yang WS Han NJ, et al. Dexamethasone regulates AP-1 to repress TNF-alpha induced MCP-1 production in human glomerular endothelial cells. Nephrol Dial Transplant. 2004;19(2):312–319. doi: 10.1093/ndt/gfg583 [DOI] [PubMed] [Google Scholar]
- 10.Anders HJ, Ryu M. Renal microenvironments and macrophage phenotypes determine progression or resolution of renal inflammation and fibrosis. Kidney Int. 2011;80(9):915–925. doi: 10.1038/ki.2011.217 [DOI] [PubMed] [Google Scholar]
- 11.Merta M, Tesar V, Zima T, Jirsa M, Rysava R, Zabka J. Inflammatory cytokine profile in autosomal dominant polycystic kidney disease. Contrib Nephrol. 1997;122:35–37. doi: 10.1159/000059888 [DOI] [PubMed] [Google Scholar]
- 12.Fragiadaki M, Macleod FM, Ong ACM. The controversial role of fibrosis in autosomal dominant polycystic kidney disease. Int J Mol Sci. 2020;21(23):8936. doi: 10.3390/ijms21238936 [DOI] [PMC free article] [PubMed] [Google Scholar]
- 13.Karihaloo A. Role of inflammation in polycystic kidney disease. Polycystic Kidney Dis. 2015:335–373. doi: 10.15586/codon.pkd.2015.ch14 [DOI] [PubMed] [Google Scholar]
- 14.Al-Eisa A, Al Rushood M, Al-Attiyah R. Urinary excretion of IL-1β, IL-6 and IL-8 cytokines during relapse and remission of idiopathic nephrotic syndrome. J Inflamm Res. 2017;10:1–5. doi: 10.2147/JIR.S124947 [DOI] [PMC free article] [PubMed] [Google Scholar]
- 15.Venables WN, Ripley BD, Ripley BD., SpringerLink. Modern Applied Statistics with S. Statistics and Computing, 4th ed. Springer; 2002. [Google Scholar]
- 16.Tanaka T, Narazaki M, Kishimoto T. IL-6 in inflammation, immunity, and disease. Cold Spring Harb Perspect Biol. 2014;6(10):a016295. doi: 10.1101/cshperspect.a016295 [DOI] [PMC free article] [PubMed] [Google Scholar]
- 17.Chen TK Estrella MM Appel LJ, et al. Serum levels of IL-6, IL-8 and IL-10 and risks of end-stage kidney disease and mortality. Nephrol Dial Transplant. 2021;36(3):561–563. doi: 10.1093/ndt/gfaa260 [DOI] [PMC free article] [PubMed] [Google Scholar]
- 18.Singh S, Anshita D, Ravichandiran V. MCP-1: function, regulation, and involvement in disease. Int Immunopharmacol. 2021;101(Pt B):107598. doi: 10.1016/j.intimp.2021.107598 [DOI] [PMC free article] [PubMed] [Google Scholar]
- 19.van Loo G, Bertrand MJM. Death by TNF: a road to inflammation. Nat Rev Immunol. 2023;23(5):289–303. doi: 10.1038/s41577-022-00792-3 [DOI] [PMC free article] [PubMed] [Google Scholar]
- 20.Darwich L Coma G Peña R, et al. Secretion of interferon-γ by human macrophages demonstrated at the single-cell level after costimulation with interleukin (IL)-12 plus IL-18. Immunology. 2009;126(3):386–393. doi: 10.1111/j.1365-2567.2008.02905.x [DOI] [PMC free article] [PubMed] [Google Scholar]
- 21.Irazabal MV Rangel LJ Bergstralh EJ, et al. Imaging classification of autosomal dominant polycystic kidney disease: a simple model for selecting patients for clinical trials. J Am Soc Nephrol. 2015;26(1):160–172. doi: 10.1681/ASN.2013101138 [DOI] [PMC free article] [PubMed] [Google Scholar]
- 22.Song CJ, Zimmerman KA, Henke SJ, Yoder BK. Inflammation and fibrosis in polycystic kidney disease. Results Probl cell Differ. 2017;60:323–344. doi: 10.1007/978-3-319-51436-9_12 [DOI] [PMC free article] [PubMed] [Google Scholar]
- 23.Pirson Y. Does TNF- enhance cystogenesis in ADPKD? Nephrol Dial Transplant. 2008;23(12):3773–3775. doi: 10.1093/ndt/gfn533 [DOI] [PubMed] [Google Scholar]
- 24.Janssens P Decuypere JP De Rechter S, et al. Enhanced MCP-1 release in early autosomal dominant polycystic kidney disease. Kidney Int Rep. 2021;6(6):1687–1698. doi: 10.1016/j.ekir.2021.03.893 [DOI] [PMC free article] [PubMed] [Google Scholar]
- 25.Cassini MF Kakade VR Kurtz E, et al. Mcp1 promotes macrophage-dependent cyst expansion in autosomal dominant polycystic kidney disease. J Am Soc Nephrol. 2018;29(10):2471–2481. doi: 10.1681/ASN.2018050518 [DOI] [PMC free article] [PubMed] [Google Scholar]
- 26.Zylberberg AK Cottle DL Runting J, et al. Modulating inflammation with interleukin 37 treatment ameliorates murine autosomal dominant polycystic kidney disease. Kidney Int. 2024;105(4):731–743. doi: 10.1016/j.kint.2023.12.006 [DOI] [PubMed] [Google Scholar]
- 27.Bruunsgaard H, Pedersen M, Pedersen BK. Aging and proinflammatory cytokines. Curr Opin Hematol. 2001;8(3):131–136. doi: 10.1097/00062752-200105000-00001 [DOI] [PubMed] [Google Scholar]
- 28.Gardner KD, Jr., Burnside JS, Elzinga LW, Locksley RM. Cytokines in fluids from polycystic kidneys. Kidney Int. 1991;39(4):718–724. doi: 10.1038/ki.1991.87 [DOI] [PubMed] [Google Scholar]
- 29.Vielhauer V, Mayadas TN. Functions of TNF and its receptors in renal disease: distinct roles in inflammatory tissue injury and immune regulation. Semin Nephrol. 2007;27(3):286–308. doi: 10.1016/j.semnephrol.2007.02.004 [DOI] [PubMed] [Google Scholar]
- 30.Zhou JX, Fan LX, Li X, Calvet JP, Li X. TNFα signaling regulates cystic epithelial cell proliferation through Akt/mTOR and ERK/MAPK/Cdk2 mediated Id2 signaling. PLoS One. 2015;10(6):e0131043. doi: 10.1371/journal.pone.0131043 [DOI] [PMC free article] [PubMed] [Google Scholar]
- 31.Chen D Ma Y Wang X, et al. Clinical characteristics and disease predictors of a large Chinese cohort of patients with autosomal dominant polycystic kidney disease. PLoS One. 2014;9(3):e92232. doi: 10.1371/journal.pone.0092232 [DOI] [PMC free article] [PubMed] [Google Scholar]
- 32.Di Florio DN, Sin J, Coronado MJ, Atwal PS, Fairweather D. Sex differences in inflammation, redox biology, mitochondria and autoimmunity. Redox Biol. 2020;31:101482. doi: 10.1016/j.redox.2020.101482 [DOI] [PMC free article] [PubMed] [Google Scholar]
- 33.Buskiewicz IA, Huber SA, Fairweather D. Sex hormone receptor expression in the immune System. Sex Diff Physiol. 2016:45–60. doi: 10.1016/b978-0-12-802388-4.00004-5 [DOI] [Google Scholar]
- 34.D'Esposito V Di Tolla MF Lecce M, et al. Lifestyle and dietary habits affect plasma levels of specific cytokines in healthy subjects. Front Nutr. 2022;9:913176. doi: 10.3389/fnut.2022.913176 [DOI] [PMC free article] [PubMed] [Google Scholar]
- 35.Zafar U, Khaliq S, Ahmad HU, Lone KP. Serum profile of cytokines and their genetic variants in metabolic syndrome and healthy subjects: a comparative study. Biosci Rep. 2019;39(2):BSR20181202. doi: 10.1042/BSR20181202 [DOI] [PMC free article] [PubMed] [Google Scholar]
- 36.Kapilevich LV, Zakharova AN, Kabachkova AV, Kironenko TA, Orlov SN. Dynamic and static exercises differentially affect plasma cytokine content in elite endurance- and strength-trained athletes and untrained volunteers. Front Physiol. 2017;8:35. doi: 10.3389/fphys.2017.00035 [DOI] [PMC free article] [PubMed] [Google Scholar]
- 37.Nieman DC Dumke CI Henson DA, et al. Immune and oxidative changes during and following the western states endurance run. Int J Sports Med. 2003;24(7):541–547. doi: 10.1055/s-2003-42018 [DOI] [PubMed] [Google Scholar]
- 38.Kurowski M Seys S Bonini M, et al. Physical exercise, immune response, and susceptibility to infections—current knowledge and growing research areas. Allergy. 2022;77(9):2653–2664. doi: 10.1111/all.15328 [DOI] [PubMed] [Google Scholar]
Associated Data
This section collects any data citations, data availability statements, or supplementary materials included in this article.
Supplementary Materials
Data Availability Statement
All data are included in the manuscript and/or supporting information.