

Abstract
This study evaluates the diagnostic efficacy of automated machine learning (AutoGluon) with automated feature engineering and selection (autofeat), focusing on clinical manifestations, and a model integrating both clinical manifestations and CT findings in adult patients with ambiguous computed tomography (CT) results for acute appendicitis (AA). This evaluation was compared with conventional single machine learning models such as logistic regression(LR) and established scoring systems such as the Adult Appendicitis Score(AAS) to address the gap in diagnostic approaches for uncertain AA cases. In this retrospective analysis of 303 adult patients with indeterminate CT findings, the cohort was divided into appendicitis (n = 115) and non-appendicitis (n = 188) groups. AutoGluon and autofeat were used for AA prediction. The AutoGluon-clinical model relied solely on clinical data, whereas the AutoGluon-clinical-CT model included both clinical and CT data. The area under the receiver operating characteristic curve (AUROC) and other metrics for the test dataset, namely accuracy, sensitivity, specificity, PPV, NPV, and F1 score, were used to compare AutoGluon models with single machine learning models and the AAS. The single ML models in this study were LR, LASSO regression, ridge regression, support vector machine, decision tree, random forest, and extreme gradient boosting. Feature importance values were extracted using the “feature_importance” attribute from AutoGluon. The AutoGluon-clinical model demonstrated an AUROC of 0.785 (95% CI 0.691–0.890), and the ridge regression model with only clinical data revealed an AUROC of 0.755 (95% CI 0.649–0.861). The AutoGluon-clinical-CT model (AUROC 0.886 with 95% CI 0.820–0.951) performed better than the ridge model using clinical and CT data (AUROC 0.852 with 95% CI 0.774–0.930, p = 0.029). A new feature, exp(-(duration from pain to CT)3 + rebound tenderness), was identified (importance = 0.049, p = 0.001). AutoML (AutoGluon) and autoFE (autofeat) enhanced the diagnosis of uncertain AA cases, particularly when combining CT and clinical findings. This study suggests the potential of integrating AutoML and autoFE in clinical settings to improve diagnostic strategies and patient outcomes and make more efficient use of healthcare resources. Moreover, this research supports further exploration of machine learning in diagnostic processes.
Keywords: Acute appendicitis, Computed tomography, Automated machine learning, Equivocal, Automated feature engineering
Subject terms: Computational biology and bioinformatics, Gastroenterology
Introduction
Surgical decision-making is a complex and challenging domain for both clinicians and patients1,2, particularly in emergency medical scenarios such as acute appendicitis (AA). The need to decide on the optimal treatment and diagnostic strategies within a limited timeframe highlights the urgency and significance of these decisions. Although studies have revealed promising results in evaluating the diagnostic performance of clinical findings for AA, abdominal computed tomography (CT) is widely used as an adjunctive or confirmatory tool to improve diagnostic accuracy, particularly in cases with atypical or nonspecific clinical findings3–6. Despite advancements in CT technology, accurately diagnosing AA remains a significant challenge, particularly when CT findings are inconclusive4–8. Approximately 8–13% of patients undergoing CT scans for suspected AA encounter these equivocal results9, and approximately one-third of these cases are diagnosed as AA7,8. These cases present a diagnostic dilemma for clinicians, highlighting the necessity for additional diagnostic tools to differentiate AA from other conditions in patients with equivocal CT findings4,6,10. Although studies have focused on the diagnosis and treatment of definitive AA, limited studies have investigated equivocal AA4,6,11–15. The scarcity of equivocal AA research is challenging but imperative because these cases present a critical medical dilemma because of the potential necessity for surgical decision-making4,6–8. The research on clinical decision support systems (CDSS) and diagnostic decision support systems (DDSS) should be developed to better understand and manage such ambiguous cases, ensuring appropriate and timely medical intervention. Specifically, CDSS tailored for clinical diagnosis are referred to as DDSS16.
Machine learning (ML) techniques have demonstrated high accuracy across a wide range of applications, including disease diagnosis and prognosis17. Automated ML (AutoML) has revolutionized ML model development by automating tasks such as data preprocessing, feature selection/engineering, and hyperparameter tuning, thereby enhancing model performance, reducing time and costs, and rendering advanced ML accessible to those without in-depth algorithmic or coding expertise18–20. Although AutoML streamlines model development, it has limitations, including limited domain-specific knowledge, constrained customization for unique projects, operational complexity in smaller organizations, opaque modelling, data quality dependency, and diagnostic challenges20. Moreover, it may underperform in specific contexts, evidenced by reduced efficacy in specialized medical diagnostics and multilabel classification tasks, possibly because of restricted domain expertise or data idiosyncrasies21–23. Despite these limitations, AutoML is particularly effective for structured data, efficiently automating feature engineering and model building20. It excels in supervised learning with small to medium-sized structured datasets, rapidly exploring numerous model options20. This renders AutoML highly beneficial for proof-of-concept and prototype development, facilitating swift iteration and validation, especially in structured data environments20. In various clinical scenarios, studies have applied ML for the diagnosis of definitive AA but not equivocal AA11,12,24–29. To the best of our knowledge, limited studies have focused on the application of ML to equivocal AA; notably, studies have yet to use AutoML and automated feature engineering (AutoFE). Additionally, although most studies have focused on using clinical findings, an AutoML model that incorporates both clinical manifestations and CT findings as parameters is yet to be devised to diagnose equivocal AA. To address these gaps, this study enhanced modeling for diagnosing equivocal AA by using AutoGluon and the autofeat AutoML framework. AutoGluon, Amazon’s advanced open-source AutoML framework, provides the modeling backbone, whereas autofeat, specifically designed for automated feature engineering (AutoFE), optimizes model performance by focusing on the most influential variables. These tools form the foundational pillars of our approach in the expansive landscape of ML platforms29,30.
In this study, we aim to make several key contributions to the field of medical diagnosis and specifically to the diagnostic strategies of AA with equivocal CT findings. First, we intend to provide evidence for the diagnosis and treatment of this uncommon, yet clinically significant condition. Accordingly, we contribute to filling a critical gap in the current medical literature, where the focus has primarily been on definitive AA. Second, our approach leverages both clinical findings and CT interpretation results. This dual-faceted approach is in contrast to those of previous studies, which have predominantly relied on one or the other, offering a holistic and accurate diagnostic strategy. Third, we proposed a novel methodology that utilizes AutoML techniques—a subset of ML. This methodology is designed to be accessible and implementable by clinicians across various settings, including those with limited expertise in ML or coding. By providing a streamlined, efficient, and effective diagnostic tool, we enhanced the diagnostic process for AA, particularly in cases in which CT findings are ambiguous, thus facilitating more informed and timely clinical decision making.
The aim of this study was to compare the diagnostic accuracy and performance of an AutoML model, enhanced with AutoFE for clinical manifestations, against a comprehensive model integrating clinical and CT findings, compared with a single ML model and the conventional adult appendicitis score (AAS)13. Considering the limitations of feature importance in AutoML (AutoGluon), we investigated the importance of features used in the AutoML analysis.
Methods
Study design
This study was conducted as a single-center, observational, retrospective analysis from April 2011 to November 2019, with approval from the Institutional Review Board of Ajou University Hospital (IRB no. AJOUIRB-MDB-2021-291). Due to the retrospective nature of the study, the requirement for informed consent was waived by the Institutional Review Board of Ajou University Hospital.
To investigate the capabilities of AutoML models in predicting AA in patients with ambiguous CT findings, we followed the TRIPOD guidelines (as detailed in Online Supplementary Table S1) and established an AutoML framework31. All methods were performed in accordance with the ethical standards of the Declaration of Helsinki and TRIPOD guidelines.
Enrolled patients
The study population comprised patients aged 15 years and older who underwent intravenously enhanced abdominal CT scans for the differential diagnosis of AA. AA was considered a differential diagnosis in the CT reports due to ambiguous (equivocal) CT findings, totaling 335 patients. The CT report system classified the likelihood of AA into five categories, namely definitive “appendicitis,” “probable appendicitis,” “indeterminate” (equivocal CT findings), “probably not appendicitis,” and “normal appendix.” Of the 335 patients, 303 were included in the study, and 32 patients were excluded for incomplete medical records (Fig. 1).
Fig. 1.

Study flowchart. AG appendicitis group, CT computed tomography, NAG non-appendicitis group.
Imaging methods and interpretation
In this study, all CT scans were performed using a 16-slice multidetector CT scanner (Brilliance 16, Philips Healthcare, Eindhoven, Netherlands), with intravenous contrast material administration. No oral contrast medium was used. The scans covered the abdomen from the diaphragm to the symphysis pubis. The technical parameters for the scans included a collimation of 1.5 mm, rotation time of 0.75 s, and a pitch of 1.188. The images were reconstructed into axial and coronal sections with a thickness ranging from 3 to 5 mm. The tube voltage and current settings were 120 kVp and 150–300 mA, respectively. Contrast enhancement was achieved using iohexol (Omnipaque 350, GE Healthcare, Princeton, NJ, USA) and iopamidol (Pamiray 370, Dongkook Pharmaceutical, Seoul, Korea), administered 60 s post an initial dose of 2 mL/kg body weight. The contrast medium was infused at a rate of 4 mL/s through an antecubital vein. A retrospective analysis of abdominal CT scans with equivocal findings was performed by an experienced abdominal radiologist, who had over 15 years of expertise. The radiologist searched for CT signs indicative of AA, which included cross-sectional appendix outer diameter measurements, peri-appendiceal fat stranding or fluid, appendiceal wall enhancement, appendiceal and cecal wall thickening, intraluminal air, peri-cecal lymph nodes, and fluid filled small bowel. The measurement of the appendix diameter was conducted on the axially enhanced sections, specifically from the appendix’s largest visible portion.
Clinical data and conventional scoring system (AAS)
The present study conducted a detailed examination of patient demographics, clinical presentations, and laboratory findings, including blood and urine analyses, sourced from electronic medical records. Data collection was performed systematically by a single emergency medicine physician unrelated to this study. Patients with ambiguous CT results were divided into two cohorts based on their ultimate diagnosis: the appendicitis group (AG, N = 115) and the non-appendicitis group (NAG, N = 188).
Final diagnoses were determined as follows: for patients who underwent surgical intervention, the diagnosis of appendicitis was confirmed through histopathological examination, which showed transmural infiltration by neutrophils in the appendix. For those who did not undergo surgery, a review of their medical records over a two-week period was conducted to establish a diagnosis. Patients who sought treatment at other facilities were contacted by telephone. Similarly, patients who were referred to other medical centers received follow-up calls to verify their diagnostic outcomes.
The AAS was selected for its superior performance in terms of the area under the receiver operating characteristic curve (AUROC) compared with other traditional scoring systems in prior research4,32. The criteria for the AAS included migratory pain to the right lower quadrant (RLQ) (2 points), direct RLQ tenderness (3 points for men and those over 50 years, 1 point for women aged 16–49 years), rebound tenderness (2 points for mild; 4 points for moderate to severe), elevated white blood cell (WBC) count (1 point for 7.2 ≤ WBC < 10.9 [× 109/L]; 2 points for 10.9 ≤ WBC < 14.0 [× 109/L]; 3 points for ≥ 14.0 [× 109/L]), and increased C-reactive protein (CRP) levels, with scores adjusted for symptom duration (< 24 h: 2 points for 4 ≤ CRP < 11; 3 points for 11 ≤ CRP < 25; 5 points for 25 ≤ CRP < 83; 1 point for CRP ≥ 83, and for symptoms lasting ≥ 24 h: 2 points for 12 ≤ CRP < 152; 1 point for CRP ≥ 152)13.
Data preprocessing and feature engineering
Before the development of the models, all variables, with the exception of age and the duration from onset of pain to CT scan, were converted into nominal categories to enhance their practicality and comprehensibility. The AutoGluon model utilizing only clinical findings incorporated 10 clinical and 4 laboratory variables as input. When integrating clinical and CT findings, the model included 10 clinical variables, 4 laboratory variables, and 8 radiologic CT variables. Prior to the training phase for all algorithms, numerical data were standardized. One-hot encoding was used for handling categorical variables within the ML algorithms. A body temperature equal to or higher than 37.3 ℃ was classified as elevated. Laboratory reference values specific to our hospital were used, defining leukocytosis as a WBC count exceeding 10.3 (× 109/L), an elevated neutrophil count as above 80% of the total WBC count, and an elevated C-reactive protein (CRP) level as above 8 (mg/L). Additionally, an appendix diameter of 6 mm or more was considered significant.
In this study, the autofeat library was methodically utilized through three stages of the automatic feature engineering process to generate a comprehensive set of features, encapsulating complex non-linear relationships and interactions between variables. This procedure was executed using the AutoFeatRegressor class, with the verbose parameter set to 1 to enable real-time progress logging. The feateng_steps parameter was adjusted to 3, facilitating in-depth feature engineering across three distinct steps. This methodology allows the model to efficiently identify and assimilate important non-linear patterns and interactions present within the data, thereby enhancing the accuracy of disease diagnosis and prediction, particularly within structured data environments. Such an approach markedly broadens its utility in medical data analysis. (Supplementary code) Datasets are available in the supplementary information files. (Supplementary data and model information: Supplementary_model_information.zip). The supplementary file “Supplementary_model_information.zip” contains a pkl file storing global variables from the model development phase, the dataset used, and detailed information about the AutoGluon model. The README.txt file within the zip file explains the usage instructions and important variables.
AutoML model development
In this study, we utilized AutoGluon, an advanced open-source AutoML framework developed by Amazon, to develop two models for diagnosing equivocal AA. The first model, named “AutoGluon-clinical,” was based solely on clinical findings, while the second model, “AutoGluon-clinical-CT,” integrated both clinical and CT findings. Several key factors justified the choice of AutoGluon:
(1) AutoGluon automates essential aspects of ML, such as data preprocessing, feature engineering, model selection, and hyperparameter tuning. This significantly reduces the time and effort required for model development, enabling researchers without extensive expertise in ML algorithms or coding to construct high-performance models.
(2) The AutoGluon framework is designed to achieve high predictive performance by leveraging advanced ensemble techniques and comprehensive model evaluation. These models are particularly suited for clinical settings where diagnostic accuracy is paramount. AutoGluon efficiently handles various data types, making it suitable for the complex and diverse datasets typically encountered in medical research. Furthermore, AutoGluon performed extensive hyperparameter optimization and model evaluation, training various algorithms such as neural networks, random forests (RF), and gradient boosting, and combining them into a robust ensemble model. This approach maximized the predictive performance and generalization capability of the model.
(3) AutoGluon’s automated approach to feature engineering, particularly through the use of the autofeat library, allows for the creation of sophisticated and non-linear features that can enhance model performance. This capability is crucial for capturing complex patterns and interactions within the data, thereby improving the accuracy and robustness of diagnostic models.
Prior to model development, we standardized numerical data and applied one-hot encoding to categorical variables to ensure compatibility with ML algorithms. Additionally, clinical and laboratory variables were transformed into nominal categories to enhance practical applicability and comprehensibility. Specific preprocessing steps included classifying body temperatures ≥ 37.3 ℃ as elevated, defining “leukocytosis” as a WBC count > 10.3 × 10⁹/L, marking neutrophil counts > 80% of total WBC count as elevated, considering CRP levels > 8 mg/L as elevated, and treating an appendix diameter ≥ 6 mm as significant.
During the model development process, we used the TabularPredictor class from AutoGluon to build models optimized for tabular data analysis. The presets parameter was set to “best_quality” to leverage the most advanced modeling capabilities of the framework, and the auto_stack parameter was enabled to facilitate model stacking. Additionally, we used the autofeat library for automated feature engineering, which generates novel features by capturing complex non-linear relationships and interactions between variables. This process was conducted in three stages using the AutoFeatRegressor class, enhancing the model’s ability to detect intricate patterns within the data. The optimization process, by using the k-rule bootstrap aggregation algorithm with k values usually between 5 and 1029, aimed to improve the model’s generalizability and prevent overfitting, ensuring the experimental results were both reliable and precise.
For the analysis, individual ML models, including logistic regression (LR), least absolute shrinkage and selection operator (LASSO) regression, ridge regression, support vector machine (SVM), decision tree (DT), RF, and extreme gradient boosting (XGBoost), were used. The implementation of these models was facilitated through specific R packages: “glmnet” for LR, LASSO, and ridge regression; “e1071” for SVM; “rpart” for DT; “randomForest” for RF; and “xgboost” for XGBoost.
The dataset was partitioned into training and test sets at a 7:3 ratio, comprising 213 individuals in the training set and 90 in the test set. The training set was dedicated to model training, while the test set was used to evaluate the model’s performance without modifying its parameters or effects. A tenfold cross-validation (k = 10) technique was applied within the training set to develop and gauge the performance of the ML models.
Evaluation of performance of autoML models, single ML model, and conventional scoring system
To determine the most effective modeling approach, the single ML model with the highest AUROC was identified. This model was subsequently compared with the AutoGluon-clinical model, AutoGluon-clinical-CT model, and AAS. A comprehensive assessment of each model’s performance was conducted using a range of established evaluation metrics, including AUROC, accuracy, sensitivity, specificity, positive predictive value (PPV), negative predictive value (NPV), and the F1 score. These metrics were calculated and depicted through AUROC. The development of the AutoGluon models was performed using Python version 3.10.13. For the comparative analysis of models based on probabilities derived from the AutoGluon models, the R software (version 4.4.1) and its packages, including caret, epiR, and pROC, were used.
Feature importance
To evaluate feature importance in the model, the feature_importance attribute of AutoGluon’s TabularPredictor was used, employing permutation importance. This method assesses the decrease in prediction performance of the model when the values of a single column are randomly shuffled row-wise. Features ranked highly in this assessment contribute significantly to the accuracy of AutoGluon. Features with non-positive importance scores contribute minimally to the model’s accuracy or may even detrimentally affect it if included in the dataset. Therefore, these scores do not explicitly reveal the directional impact of each feature on predictions. Assessing the effect of each variable on the model’s accuracy is crucial. However, feature-importance scores provide insights into the importance of features. Although the absolute value of the importance score is significant, the contributions from variables should be evaluated in terms of their relative magnitudes. The resulting DataFrame includes the feature names (index), estimated importance scores (importance), standard deviations of the scores (stddev), p-values indicating the statistical significance of feature importance, number of estimations used for scoring (n), and percentiles defining confidence intervals (p95_high, p95_low).
Statistical analysis
For the development and evaluation of AutoML and autoFE models, Python version 3.10.13 was used along with AutoGluon (version 1.1.1) and autofeat (version 2.1.2). Single ML models were developed using R (version 4.4.1). The analyses were conducted on a computer system operating on Windows 11, powered by a 13th Generation Intel(R) Core(TM) i9-13900 K CPU, and equipped with an NVIDIA GeForce RTX 2080 Ti GPU. For continuous variables, descriptive statistics such as mean ± standard deviation or median (interquartile range) were reported, contingent upon the results of normality tests. Categorical data were presented as counts and percentages. Continuous data comparison between the appendicitis group (AG) and the non-appendicitis group (NAG) was conducted using the Mann–Whitney U test or the independent t-test, based on normal distribution analysis results. The chi-square test was applied to compare the distribution of categorical data between the two groups. Statistical significance was established at a P-value less than 0.05. Odds ratios and their 95% confidence intervals (CIs) were calculated using the R-package “stats.” ROC curves and AUROC analyses were performed using the R-package “pROC.” The optimal threshold for each model was determined using Youden’s index; the P values for the AUROC were calculated using the bootstrap resampling method with 1000 replicates. Additionally, accuracy, sensitivity, specificity, PPV, NPV, and the F1 score were determined using the R-packages “caret” and “epiR.”
A prior study indicated that a sample size of 230 subjects was necessary to achieve a precision of 0.10 for either sensitivity or specificity, with an alpha error of 0.05 and a power of 80%, assuming a sensitivity of 82.0%, a specificity of 53.9%, and an incidence of appendicitis of 24.8% at a cut-off value for the AAS4,32. In this study, a total sample size of 303 subjects was deemed sufficient to satisfy the desired statistical power requirements.
Results
General characteristics of enrolled patients
The patient demographics, clinical findings, radiologic CT findings, and evaluations using the conventional scoring system (AAS) are detailed in (Table 1), presenting a comparative analysis across the total enrolled patients, training set, and test set. The median age among the NAG was 32 years (interquartile range [IQR]: 24–41), and in the AG, it was 35 years (IQR: 25–43). In the NAG, male patients constituted 61 (32.4%), and in the AG, 47 (40.9%).
Table 1.
Demographic and general characteristics.
| Total (n = 303) | Train (n = 213) | Test (n = 90) | |||||||
|---|---|---|---|---|---|---|---|---|---|
| NAG (n = 188) | AG (n = 115) | p | NAG (n = 132) | AG (n = 81) | p | NAG (n = 56) | AG (n = 34) | p | |
| Age | 32 (24, 41) | 35 (25, 43) | 0.366 | 32 (24, 42) | 35 (25, 43) | 0.375 | 32 (25, 42) | 35 (25, 40) | 0.819 |
| Gender(M, n[%]) | 61 (32.4) | 47 (40.9) | 0.173 | 35 (26.5) | 32 (39.5) | 0.067 | 26 (46.4) | 15 (44.1) | > 0.999 |
| Duration from pain to CT(min) | 1617 (585, 3201) | 760 (411, 1589) | < 0.001 | 1631 (572, 3481) | 680 (378, 1519) | < 0.001 | 1417 (655, 3088) | 879 (450, 2916) | 0.166 |
| Nausea, n(%) | 92 (48.9) | 48 (41.7) | 0.271 | 63 (47.7) | 36 (44.4) | 0.745 | 29 (51.8) | 12 (35.3) | 0.192 |
| Anorexia, n(%) | 31 (16.5) | 20 (17.4) | 0.964 | 21 (15.9) | 13 (16.0) | > 0.999 | 10 (17.9) | 7 (20.6) | 0.966 |
| Migration, n(%) | 37 (19.7) | 47 (40.9) | < 0.001 | 29 (22.0) | 33 (40.7) | 0.006 | 8 (14.3) | 14 (41.2) | 0.009 |
| Direct Tenderness on RLQ, n (%) | 167 (88.8) | 112 (97.4) | 0.014 | 117 (88.6) | 79 (97.5) | 0.039 | 50 (89.3) | 33 (97.1) | 0.247 |
| Guarding, n (%) | 2 (1.1) | 9 (7.8) | 0.003 | 2 (1.5) | 6 (7.4) | 0.056 | 0 (0) | 3 (8.8) | 0.051 |
| Rebound tenderness, n (%) | < 0.001 | < 0.001 | 0.002 | ||||||
| Absence | 154 (81.9) | 54 (47.0) | 110 (83.3) | 37 (45.7) | 44 (78.6) | 17 (50) | |||
| 1 | 29 (15.4) | 33 (28.7) | 18 (13.6) | 25 (30.9) | 11 (19.6) | 8 (23.5) | |||
| 2 | 4 (2.1) | 17 (14.8) | 3 (2.3) | 12 (14.8) | 1 (1.8) | 5 (14.7) | |||
| 3 | 1 (0.5) | 11 (9.6) | 1 (0.8) | 7 (8.6) | 0 (0) | 4 (11.8) | |||
| Body temperature (℃) | 36.6 (36.5, 36.9) | 36.6 (36.5, 37.0) | 0.667 | 36.6 (36.5, 36.9) | 36.6 (36.5, 37) | 0.785 | 36.6 (36.5, 37.1) | 36.8 (36.5, 37.0) | 0.732 |
| Fever, n (%) | 28 (14.9) | 16 (13.9) | 0.947 | 20 (15.2) | 12 (14.8) | > 0.999 | 10 (17.9) | 4 (11.8) | > 0.999 |
| WBC (× 109/L) | 8.9 (6.6, 12.2) | 12.1 (8.0, 14.5) | < 0.001 | 8.9 (6.7, 12.2) | 12.7 (9.5, 15.6) | < 0.001 | 9.3 (6.5, 12.1) | 9.2 (6.9, 13.8) | 0.194 |
| Leukocytosis, n (%) | 64 (34.0) | 70 (60.9) | < 0.001 | 46 (34.8) | 53 (65.4) | < 0.001 | 18 (32.1) | 17 (50) | 0.144 |
| Neutrophil (%) | 68.2 (57.1, 79.6) | 76.2 (63.4, 83.2) | < 0.001 | 67.6 (55.6, 79.2) | 77.7 (66.0, 83.7) | < 0.001 | 70.4 (58.2, 79.8) | 72.4 (62.2, 82) | 0.196 |
| Elevated neutrophil, n (%) | 69 (36.7) | 64 (55.7) | 0.002 | 47 (35.6) | 49 (60.5) | < 0.001 | 22 (39.3) | 15 (44.1) | 0.818 |
| CRP (mg/L) | 3.0 (1.0, 15.8) | 2.3 (1.0, 12.7) | 0.292 | 3.8 (1.0, 13.3) | 3.6 (1.0, 12.9) | 0.427 | 2.5 (1.0, 23.0) | 1.2 (1.0, 7.8) | 0.554 |
| Elevated CRP, n (%) | 66 (35.1) | 37 (32.2) | 0.691 | 42 (31.8) | 23 (28.4) | 0.709 | 24 (42.9) | 14 (41.2) | > 0.999 |
| Abnormal UA, n (%) | 91 (48.4) | 37 (32.2) | 0.008 | 66 (50) | 28 (34.6) | 0.039 | 25 (44.6) | 9 (26.5) | 0.134 |
| Dilated appendix, n (%) | 125 (66.5) | 107 (93.0) | < 0.001 | 86 (65.2) | 75 (92.6) | < 0.001 | 39 (69.6) | 32 (94.1) | 0.013 |
| Enhancement appendiceal wall, n (%) | 122 (64.9) | 79 (68.7) | 0.579 | 81 (61.4) | 54 (66.7) | 0.526 | 41 (73.2) | 25 (73.5) | > 0.999 |
| Appendiceal wall thickening, n (%) | 92 (48.9) | 72 (62.6) | 0.028 | 72 (54.5) | 52 (64.2) | 0.214 | 20 (35.7) | 20 (58.8) | 0.055 |
| Intraluminal air, n (%) | 70 (37.2) | 29 (25.2) | 0.042 | 47 (35.6) | 24 (29.6) | 0.454 | 23 (41.1) | 5 (14.7) | 0.017 |
| Peri-appendiceal fat stranding, n (%) | 21 (11.2) | 16 (13.9) | 0.598 | 16 (12.1) | 13 (16) | 0.545 | 5 (8.9) | 3 (8.8) | > 0.999 |
| Cecal wall thickening, n (%) | 15 (8.0) | 22 (19.1) | 0.007 | 11 (8.3) | 15 (18.5) | 0.047 | 4 (7.1) | 7 (20.6) | 0.094 |
| Peri-cecal lymph node, n (%) | 59 (31.4) | 57 (49.6) | 0.002 | 45 (34.1) | 44 (54.3) | 0.006 | 14 (25) | 13 (38.2) | 0.275 |
| Fluid-filled small bowel, n(%) | 56 (29.8) | 28 (24.3) | 0.371 | 41 (31.1) | 19 (23.5) | 0.298 | 15 (26.8) | 9 (26.5) | > 0.999 |
| AAS score | 8.0 (5.0, 10.0) | 11.0 (9.0, 14.0) | < 0.001 | 7.0 (5.0, 10.0) | 11.0 (9.0, 14.0) | < 0.001 | 8.5 (6.0, 10.0) | 11.0 (8.0, 13.0) | 0.003 |
AAS adult appendicitis score, CRP C-reactive protein, CT computed tomography, AG appendicitis group, NAG non-appendicitis group, RLQ right lower quadrant, UA urine analysis, WBC white blood cell.
Significant differences were observed between the NAG and AG in terms of AAS scores (85–10 vs. 119–14, p < 0.001). Additionally, statistically significant differences were noted in five clinical indicators (duration from pain to CT, migration to the right lower quadrant [RLQ], direct RLQ tenderness, guarding, and rebound tenderness), three laboratory findings (elevated white blood cell count, elevated neutrophil percentage, and abnormal urinalysis), and five radiologic findings (appendix diameter, appendiceal wall thickening, intraluminal air, cecal apical thickening, and peri-cecal lymph node) with p < 0.001, p < 0.001, p = 0.014, p = 0.003, p < 0.001, p < 0.001, p < 0.001, p = 0.002, p = 0.008, p < 0.001, p = 0.028, p = 0.042, p = 0.007, and p = 0.002, respectively.
Of the 139 surgeries performed, 24 (17.3%) in the NAG were negative for appendicitis upon histological examination. The alternative diagnoses for those with a negative appendectomy included acute gastroenteritis (25.0%, n = 6), pelvic inflammatory disease (8.3%, n = 2), diverticulitis (8.3%, n = 2), appendiceal mucocele (8.3%, n = 2), mesenteric lymphadenopathy (12.5%, n = 3), and non-specific findings (37.6%, n = 9). Among the 164 patients who did not undergo surgery, diagnoses included acute gastroenteritis (36.0%, n = 59), non-specific findings (31.7%, n = 52), pelvic inflammatory disease (17.1%, n = 28), mesenteric lymphadenopathy (6.1%, n = 10), diverticulitis (3.7%, n = 6), ovarian cystic rupture (2.4%, n = 4), acute pyelonephritis (1.8%, n = 3), and ureteric stones (1.2%, n = 2).
In the training set (n = 213) and test set (n = 90), the distributions of participants in the NAG and AG were 132 (62.0%):81 (38.0%) and 56 (62.2%):34 (37.8%), respectively. The median ages in the training and test sets were 32 years (IQR: 24–42) and 32 years (IQR: 25–42), respectively, with males constituting 35 (26.5%) of the training set and 26 (46.4%) of the test set.
AutoGluon-clinical, AutoGluon-clinical-CT, and single ML models
The evaluation of both AutoML models—AutoGluon-clinical and AutoGluon-clinical-CT—involved ranking according to their performance metrics, including the AUROC, accuracy, F1 score, recall, and precision, utilizing the test dataset as detailed in Supplementary Table S2. Table 2 highlights the top five models for both AutoGluon-clinical and AutoGluon-clinical-CT, tailored for diagnosing equivocal AA. Notably, the leading AutoGluon-clinical model, identified as “NeuralNetFastAI_r111_BAG_L1,” achieved the highest AUROC (0.785) on the leaderboard. In the AutoGluon-clinical-CT category, the model “NeuralNetFastAI_r143_BAG_L1” exhibited an AUROC of 0.886, indicating superior predictive capability. The NeuralNetFastAI_r143_BAG_L1 model was utilized for binary classification tasks. This model, which is of the StackerEnsembleModel type, primarily evaluates using accuracy. The ensemble comprises eight child models of the NNFastAiTabularModel type and utilizes 23 features, including demographic, clinical, and imaging parameters. These child models were trained with a variety of hyperparameters, commonly set to layers of sizes [200, 100, 50], an embedding dropout rate of 0.6239, a probability of 0.6708, a batch size of 1024, a learning rate of 0.0717, and a maximum of 39 epochs, with early stopping parameters set to a min delta of 0.0001 and patience of 20 epochs. This configuration enabled the model to effectively capture complex patterns in the data, contributing to its robust performance in the binary classification task. Detailed information can be found in the supplementary file “Supplementary Best model information”. Additionally, in file model_information.zip, best model information can be accessed in “model_info.”
Table 2.
Summary of the top five AutoML models for clinical and CT findings (AutoGluon-clinical-CT) and clinical findings alone (AutoGluon-clinical).
| Model | AUROC | Accuracy | F1 score | Recall | Precision |
|---|---|---|---|---|---|
| AutoGluon-clinical-CT models | |||||
| NeuralNetFastAI_r143_BAG_L1 | 0.886 | 0.778 | 0.655 | 0.559 | 0.792 |
| NeuralNetFastAI_r160_BAG_L1 | 0.859 | 0.767 | 0.667 | 0.618 | 0.724 |
| ExtraTrees_r126_BAG_L1 | 0.850 | 0.744 | 0.582 | 0.471 | 0.762 |
| NeuralNetFastAI_r102_BAG_L1 | 0.850 | 0.767 | 0.677 | 0.647 | 0.710 |
| NeuralNetFastAI_BAG_L1 | 0.838 | 0.744 | 0.635 | 0.588 | 0.690 |
| AutoGluon-clinical models | |||||
| NeuralNetFastAI_r111_BAG_L1 | 0.785 | 0.722 | 0.615 | 0.588 | 0.645 |
| NeuralNetFastAI_r11_BAG_L1 | 0.782 | 0.667 | 0.595 | 0.647 | 0.550 |
| NeuralNetFastAI_r194_BAG_L1 | 0.782 | 0.700 | 0.609 | 0.618 | 0.600 |
| NeuralNetFastAI_r100_BAG_L1 | 0.779 | 0.678 | 0.603 | 0.647 | 0.564 |
| NeuralNetFastAI_r143_BAG_L1 | 0.778 | 0.767 | 0.667 | 0.618 | 0.724 |
AUROC area under the receiver operating characteristic curve.
Among the single ML models evaluated, the ridge model recorded the highest AUROC, with a value of 0.852 (CI: 0.774–0.930). The performance metrics for the remaining single ML models are summarized in Supplementary Table S3. The ridge models were selected for further comparative analysis against the conventional scoring system (AAS) and the respective AutoML models to assess their diagnostic efficacy.
Evaluative comparison between AutoGluon-clinical, AutoGluon-clinical-CT models, single ML model, and conventional scoring systems
The test dataset’s performance metrics, including accuracy, sensitivity, specificity, PPV, NPV, F1 score, and AUROC, for the AutoGluon-clinical, AutoGluon-clinical-CT, ridge model, and the AAS in predicting equivocal AA, are presented in (Table 3 and Fig. 2). The AAS demonstrated the lowest values in AUROC (0.687, with a 95% CI of 0.573–0.800). The AUROC for the AutoGluon-clinical model, specifically the NeuralNetFastAI_r111_BAG_L1, was 0.785 ((95% CI 0.684–0.887), whereas the ridge model, utilizing only clinical findings, recorded an AUROC of 0.755 (95% CI 0.649–0.861). The AutoGluon-clinical-CT model achieved an AUROC of 0.886 (95% CI 0.820–0.951). By contrast, the ridge model that included both clinical and CT findings had an AUROC of 0.852 (95% CI 0.774–0.930) with p = 0.029.
Table 3.
Performance metrics of the AutoGluon-clinical, AutoGluon-clinical-CT, ridge regression model, and AAS.
| Model | AUROC (95% CI) | P-value | Sensitivity (95% CI) | Specificity (95% CI) | PPV (95% CI) | NPV (95% CI) | Accuracy (95% CI) | F1 score |
|---|---|---|---|---|---|---|---|---|
| NeuralNetFastAI_r143_BAG_L1 (AutoGluon-clinical-CT) | 0.886 (0.82–0.951) | Reference | 0.882 (0.725–0.967) | 0.768 (0.636–0.87) | 0.811 (0.715–0.886) | 0.698 (0.539–0.828) | 0.915 (0.796–0.976) | 0.779 |
| Ridge regression (clinical + CT) | 0.852 (0.774–0.93) | 0.029 | 0.912 (0.763–0.981) | 0.679 (0.54–0.797) | 0.767 (0.666–0.849) | 0.633 (0.483–0.766) | 0.927 (0.801–0.985) | 0.747 |
| NeuralNetFastAI_r111_BAG_L1 (AutoGluon-clinical) | 0.785 (0.684–0.887) | 0.023 | 0.559 (0.379–0.728) | 0.946 (0.851–0.989) | 0.8 (0.702–0.877) | 0.864 (0.651–0.971) | 0.779 (0.662–0.871) | 0.679 |
| Ridge regression (clinical) | 0.755 (0.649–0.861) | 0.002 | 0.647 (0.465–0.803) | 0.786 (0.656–0.884) | 0.733 (0.63–0.821) | 0.647 (0.465–0.803) | 0.786 (0.656–0.884) | 0.647 |
| AAS | 0.687 (0.573–0.8) | < 0.001 | 0.647 (0.465–0.803) | 0.696 (0.559–0.812) | 0.678 (0.571–0.772) | 0.564 (0.396–0.722) | 0.765 (0.625–0.872) | 0.603 |
AAS adult appendicitis score, AUROC area under the receiver operating characteristic curve, CI confidence interval, CT computed tomography, NPV negative predictive value, PPV positive predictive value.
Fig. 2.
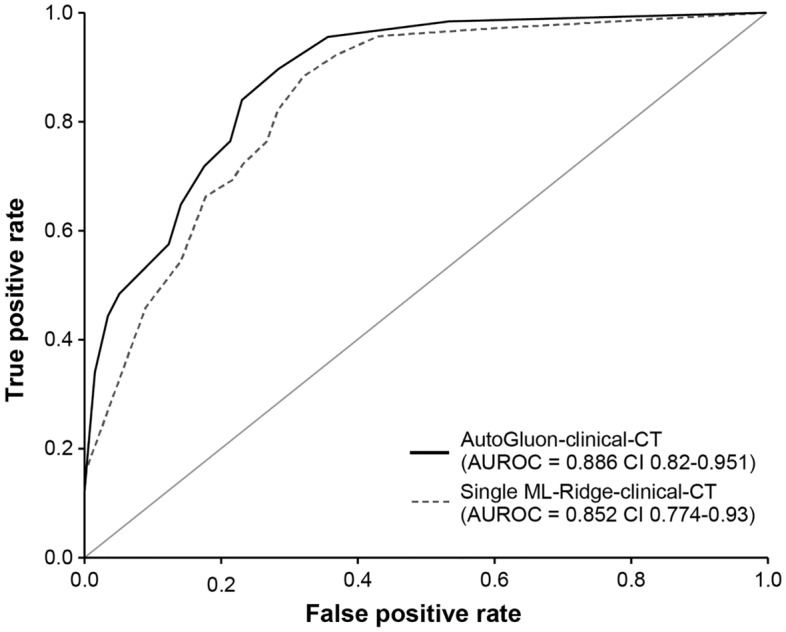
Receiver operating characteristic (ROC) curve and area under the ROC curve (AUROC). Comparisons between the AutoGluon-clinical-CT model and the ridge model with clinical and CT findings. The solid line represents the AutoGluon-clinical-CT model named NeuralNetFastAI_r143_BAG_L1 exhibiting an AUROC of 0.886 (95% confidence interval: 0.850–0.951). The dashed line illustrates the ridge regression model utilizing a single set of clinical and CT findings, with an AUROC of 0.852 (95% confidence interval: 0.774–0.930).
Feature importance
Feature importance evaluation in equivocal appendicitis was conducted using Autogluon’s “feature_importance” attribute, prioritizing variables based on both their importance and statistical significance, denoted by p-values rounded to three decimal places. If the importance value is positive, the variable is considered to improve the model’s performance, whereas a negative importance value indicates that the variable decreases the model’s performance. It is important to consider the relative magnitude of importance values rather than solely focusing on the absolute significance indicated by p-values. Notably, the newly engineered variable exp(-(Duration from pain to CT)3 + rebound tenderness) (importance = 0.047, p < 0.001), appendix diameter (importance = 0.049, p-value = 0.001), age (importance = 0.013, p-value = 0.002), peri-cecal lymph node (importance = 0.016, p-value = 0.002), RLQ migration (importance = 0.027, p-value = 0.005), cecal wall thickening (importance = 0.013, p-value = 0.016), Intraluminal air (importance = 0.024, p-value = 0.015), nausea (importance = 0.013, p-value = 0.035), and appendiceal wall thickening (importance = 0.013, p-value = 0.035) emerged as top contributors. Detailed results for each variable are provided in Table S4, with relative differences visualized in Fig. 3 to facilitate comparative analysis.
Fig. 3.

Feature importance. exp(-(Pain_CT Interval)3 + RT) means exp(-Duration from pain to CT3 + rebound tenderness). Pain_CT Interval means duration from pain to CT. Coefficients with their importance values and statistically significant p-values (p < 0.05): appendix diameter (0.049, p = 0.0015), exp(-Duration from pain to CT3 + rebound tenderness) (0.047, p = 0.00018), migration (0.027, p = 0.0046), Intraluminal air (0.024, p = 0.0147), peri-cecal lymph node (0.016, p = 0.0023), cecal wall thickening (0.013, p = 0.0163), age (0.013, p = 0.0019), appendiceal wall thickening (0.013, p = 0.0352), and nausea (0.013, p = 0.0352). Detailed information is presented in Supplementary (Table S4).
Discussion
In this study, equivocal AA was defined as a condition in patients who underwent CT imaging for AA differentiation and were subsequently diagnosed with definitive AA following surgery, despite having equivocal CT findings. The presence of ambiguous cases, even with the use of a powerful diagnostic tool such as CT, presents a challenging and undesirable situation for clinicians and patients, particularly true for a disease that, although rare, can lead to critical outcomes. Our research aimed to enhance diagnostic accuracy for equivocal AA by using DDSS using AutoML techniques (AutoGluon, autofeat). Notably, this study conducted analyses using only clinical findings and in conjunction with CT findings, subsequently assessing the accuracy of each model. This dual approach not only highlights the versatility of the diagnostic process but also suggests the potential for implementing DDSS in various contexts. Given that CT findings are not always interpreted in isolation, this approach maintains the potential for applying DDSS under any circumstances. This flexibility ensures that the developed models can be adapted and applied in a manner that is consistent with the real-world complexities of medical diagnostics. The results demonstrated that the AutoGluon-clinical-CT model, which combines clinical and CT findings, achieved a higher diagnostic performance, with an AUROC of 0.886, compared with single-modality models and models using only clinical findings with statistically significance. To the best of our knowledge, this is the first study to incorporate AutoML and automatic feature engineering techniques to leverage clinical or CT findings for diagnosing equivocal AA.
In literature, cases of ambiguous findings on CT scans were reported in 10% (10 out of 100) of patients33,34, 9.2% (37 out of 401)35, 7% (19 out of 261)36, and 13.1% (176 out of 1344)7. The incidence of AA, characterized by ambiguous CT findings, has been reported as follows: 50% (5 out of 10)33,34, 73% (14 out of 19)36, 41% (15 out of 37)35, 30% (53 out of 176)7, 33% (80 out of 244)4, 23% (27 out of 115)10, and 30% (31 out of 103)6. In our study, the rate was found to be 40% (115 out of 303). Upon analysis, the observations reveal that while ambiguous CT scan findings are present in 7–13.1% of cases, among these, the incidence of being diagnosed with equivocal AA falls within the range of approximately 23–73%. In previous research, AAS, originally designed for definitive AA, demonstrated an AUROC of 0.749 (95% CI: 0.690–0.802), indicating reduced performance in equivocal AA cases compared to its intended use for definitive AA. Despite this, AAS outperformed other conventional scoring systems for definitive AA that have been evaluated, including the Alvarado score and Eskelinen score4. Given the imperative for clinicians to make expert medical decisions that lead to accurate diagnoses for the best clinical outcomes37, the application of DDSS is considered essential for improving accuracy in the diagnosis of equivocal AA. In previous research utilizing conventional ML techniques for equivocal AA, the DT model with only the training set reported an AUROC of 0.850 (95% CI 0.799–0.893)4. Although not using ML techniques, another study that predicted outcomes based on a combination of the Alvarado score and CT findings reported that an appendiceal wall thickness of ≥ 2 mm and an Alvarado score of ≥ 7 were independent predictors of appendicitis, with adjusted odds ratios of 2.76 (95% CI, 1.09–7.02) and 1.47 (95% CI 1.12–1.94), respectively6. The outcomes of this study, using AutoML and AutoFE, produced a model that outperformed those in previous studies.
Despite the advantages of DDSS and AutoML, as demonstrated by our study’s results, their widespread impact remains limited due to negative perceptions and biases from physicians, accuracy issues due to data gaps, system integration challenges that requires manual data entry, complexity, and the opaque nature of “black box” models20,38,39. In this study, we addressed the diagnosis of equivocal AA, a condition that, although rare in occurrence, poses a significant risk of leading to critical outcomes. The AutoGluon framework provides feature importance. In our study, the statistically significant factors were appendix diameter, exp(-(duration from pain to CT)3 + rebound tenderness), RLQ migration, intraluminal air, peri-cecal lymph node, age, cecal wall thickening, nausea, and appendiceal wall thickening. The variables used in this study are composed of factors that have already been shown in other studies to aid in the diagnosis of definitive AA10,13–16; it is extremely likely that these factors also help in diagnosing equivocal AA. For instance, intraluminal air strongly suggests a normal appendix10. Although its significance has been debated, appendix diameter is generally recognized as a factor in diagnosing AA6,10. In one study on equivocal AA, the appendix diameter was larger in the AA group but did not play a decisive role in prediction; appendiceal wall thickening improved diagnostic accuracy6. The variable exp(-(duration from pain to CT)3 + rebound tenderness), newly derived from autoFE, takes the negative of the duration from pain to CT and adds the rebound tenderness value. Equivocal AA is occasionally considered early-stage AA5,6,10,16. Therefore, assuming AA progresses over time, the duration from pain to CT could influence the model. Moreover, rebound tenderness is a symptom of peritoneal irritation that appears as AA progresses. Because the new variable considers both the effect of time and the signs that may appear over time, its interpretation leads to plausible speculation. When the time is short, the value of “duration from pain to CT” is small, resulting in a larger negative value for -(duration from pain to CT)3. If the rebound tenderness value is also small, the overall value of the expression “exp(-(duration from pain to CT)3 + rebound tenderness)” remains large due to the properties of the exponential function. Consequently, this suggests that the likelihood of equivocal AA occurring is higher when the time is short. However, because this is an artificial interpretation of the variables already selected by the model, it should not be generalized. Further studies on the influencing factors should be conducted separately, particularly as the feature-importance scores provided by AutoGluon do not explicitly reveal the directional impact of each feature on predictions. Thus, studies should be conducted not only on the influence of the factors but also on their directional impact. To facilitate the successful implementation of DDSS for this challenging diagnosis, we adopted the following methodology: 1) We used information readily available from Electronic Medical Records, categorizing it into normal/abnormal states to construct a workflow that leverages tabular data in a tabular form, rendering it easily interpretable. 2) Furthermore, we used the use of AutoML (AutoGluon), to simplify the implementation of tabular data and reduce the traditional manual iterative processes. AutoGluon Tabular, a component of the AutoGluon suite, is designed for predictive modeling of tabular data. This framework automatically classifies problem types and performs data regression from structured format files40. AutoGluon boasts a diverse algorithmic arsenal, encompassing neural networks, random forest, extreme random trees, K-nearest neighbors, CatBoost, and LightGBM. Unlike conventional ML that uses a single model, it further harnesses ensemble learning techniques to amplify prediction accuracy29. In conventional deep learning processes, several single models such as those used in this study are selected and evaluated. To improve performance, hyperparameters are adjusted and multiple experiments are conducted. To achieve even higher performance, data analysts typically perform feature selection based on statistical methods. Subsequently, to develop an ensemble model with higher performance, an ensemble method is selected and experiments are conducted while changing hyperparameters. This process is labor-intensive, rendering exploring all possible models and hyperparameter adjustments difficult; the process can result in missing potential optimal solutions and introducing human errors. However, AutoML automates these processes, reducing the human resources required for model search, tuning, optimization, and hyperparameter adjustments and also minimizes the risk of missing optimal solutions and introducing human errors. In our study, AutoGluon evaluated and presented approximately 111 ensemble models with simple code. This phenomenon demonstrates that even when excluding data preprocessing and feature selection, the accessibility of model optimization is high. This accessibility not only applies to model optimization but also provides a comfortable approach for clinicians without extensive knowledge of code, algorithms, or hyperparameters. Additionally, the hyperparameter optimization algorithms and data processing methods used by AutoML are documented, clearly revealing the major factors affecting research results and enhancing the understanding of why the model behaves in certain ways. This easy approach can identify models that achieve superiority or non-inferiority. In this study, we found models that achieved superiority among many ensemble models. This approach effectively lowers the barrier to entry for clinicians and data scientists alike. 3) Additionally, through AutoFE, we could generate latent features, thereby creating the most performant predictive model as evidenced by our research findings. By automating the identification and creation of impactful features, AutoFE significantly enhances model performance, transforming raw data into a dataset that is far more conducive to effective learning and prediction30,41.
This study represents a significant advancement in the field of medical diagnostics for AA, particularly in cases with equivocal CT findings. Unlike studies that primarily focus on definitive AA and do not focus on equivocal AA, this study uniquely employed AutoML and AutoFE to diagnose equivocal AA by integrating both clinical findings and CT interpretations. We have directly addressed three critical areas of contribution that set our work apart from existing literature. First, we provided robust evidence for the diagnosis of AA under uncommon conditions, where conventional diagnostic tools could be ineffective due to ambiguity in clinical presentations and imaging results. Second, this study uniquely integrated clinical findings with CT interpretations, employing a comprehensive approach not widely explored in previous studies. This integration harnesses the strengths of both diagnostic methods, providing a nuanced and accurate diagnostic tool for clinicians. Influential factors were identified by leveraging the “feature_importance” attribute of AutoGluon, addressing concerns about the transparency of AutoML. Third, by utilizing AutoML techniques through AutoGluon and autofeat, we introduced a methodology that simplifies the complex data analysis process. This approach not only enhances diagnostic accuracy but also makes cutting-edge diagnostic tools accessible and user-friendly for clinicians across various healthcare environments. Unlike conventional methods that require extensive manual input and expertise, our automated approach significantly reduces the time and effort required for accurate diagnosis. We anticipate that this framework will encourage research in the medical field, particularly in utilizing tabular data, which is commonly used in medical practice, enhancing the accuracy and efficiency of diagnoses across various conditions. These contributions emphasize the potential of our methodology to significantly impact clinical practice by improving the accuracy of AA diagnoses, thereby reducing the risk of adverse outcomes for patients with this condition.
However, our research has certain limitations. Notably, our study did not address the transparency issues commonly associated with DDSS and AI-based models, including the provision of explanations for their decisions. The complexity introduced by feature engineering through AutoFE, which has been recognized for its performance across various domains29,30,40–42, can limit the DDSS applicability in this study. Nevertheless, we made a strategic decision to prioritize enhancing diagnostic capabilities in ambiguous situations as a countermeasure to these limitations. Additionally, despite focusing on equivocal AA, the limited number of cases and the retrospective nature of our study pose challenges to generalization. Further research incorporating a larger number of cases is essential. We did not conduct an interobserver correlation study for CT findings, which could affect the generalizability of diagnostic interpretations due to potential variability among observers. This is considered a significant shortcoming of our study. However, the impact of interobserver variance is presumed to be minimal, given the involved radiologist’s extensive experience of over 15 years. Further research that includes interobserver correlation is necessary. Future studies should aim to automatically generate tabular data forms from Electronic Medical Records in real-world settings and use this tabular data to facilitate the implementation of an easily accessible AutoML-based DDSS workflow.
Conclusion
Our study highlights the potential benefits of using AutoML via AutoGluon and autoFE via autofeat in diagnosing equivocal AA. By combining CT findings with clinical data, we achieved improved diagnostic accuracy, demonstrating a promising application of ML in medical diagnostics. These results suggest that integrating autoML tools could enhance clinical decision-making and reduce misdiagnosis and unnecessary surgeries. In the future, the exploration of diverse AutoML platforms and the inclusion of a broader spectrum of diagnostic data represent crucial steps toward realizing the potential of ML in healthcare. Addressing the challenges of model transparency and interpretability will also be vital in facilitating the adoption of these technologies in clinical practice. Our work lays the groundwork for future studies that aim to refine, validate, and implement AI-driven diagnostic tools, promising significant contributions to patient care and outcomes.
Supplementary Information
Acknowledgements
This work was supported by ETRI grant funded by the Korean government (24ZD1120, Regional Industry IT Convergence Technology Development and Support Project).
Abbreviations
- AA
Acute appendicitis
- AG
Appendicitis group
- AAS
Adults appendicitis score
- AUROC
Area under the receiver operating characteristic
- CI
Confidence interval
- CRP
C-reactive protein
- CT
Computed tomography
- DT
Decision tree
- LASSO
Least absolute shrinkage and selection operator
- LR
Logistic regression
- NAG
Non-appendicitis group
- RLQ
Right lower quadrant
- RF
Random forest
- RT
Rebound tenderness
- SVM
Support vector machine
- XGBoost
Extreme gradient boosting
- WBC
White blood cell
Author contributions
Dr. Juho An: Checked missing data, reviewed the collected data and played a crucial role in drafting the manuscript and interpreting the observational data. Dr. Il seok Kim: Was instrumental in formulating the research questions and objectives, revising the manuscript, and providing critical clinical insights. Kwang-Ju Kim, PhD: Conducted statistical analyses, drafted significant portions of the manuscript, and ensured adherence to observational study methodologies. Ji Hyun Park, MS: Assisted in data curation and played a significant role in the primary data analysis, ensuring the integrity and accuracy of the data. Hyuncheol Kang, PhD: Supervised the retrospective data extraction process, ensured data quality, and was instrumental in the alignment of the study with observational research standards. Dr. Hyuk Jung Kim: Data collection, assisted in patient data identification, validated the clinical relevancy of the findings, and contributed to the manuscript’s clinical sections. Dr. Young Sik Kim: Engaged in the review of observational findings, contributed expert knowledge on clinical implications, and played a role in manuscript finalization. Dr. Jung Hwan Ahn: Served as corresponding author, assuming overall responsibility for the research direction, ensuring the study’s robustness, and providing final approval for the manuscript’s content. Juho An and Il Seok Kim contributed equally to this work.
Data availability
Data is provided within supplementary information files. The data provided in this study are available only for the purpose of verification and cannot be used for any publication or other related activities without prior permission. Any other use of the data must be reviewed and approved by the Institutional Review Board (IRB) of our institution. The file session_variables_240628_886_ag111_seed42.pkl can be found within the Supplementary_model_information.zip file. For detailed information about the structure of the session_variables_240628_886_ag111_seed42.pkl file, please refer to the README.txt file included in the zip archive. The global variables include datasets as follows: train, representing the training dataset with dimensions 213 × 26, and test, representing the test dataset with dimensions 90 × 26, both provided in a dataframe format.
Code availability
Supplementary code.
Declarations
Competing interests
The authors declare no competing interests.
Ethics approval
Approval from the Institutional Review Board (IRB no. AJOUIRB-MDB-2021-291).
Consent to participate
Informed consent was waived for the current research because it is a retrospective study.
Footnotes
Publisher's note
Springer Nature remains neutral with regard to jurisdictional claims in published maps and institutional affiliations.
These authors contributed equally: Juho An and Il Seok Kim.
Supplementary Information
The online version contains supplementary material available at 10.1038/s41598-024-72889-9.
References
- 1.Chhabra, K. R., Sacks, G. D. & Dimick, J. B. Surgical decision making: challenging dogma and incorporating patient preferences. JAMA317, 357–358 (2017). [DOI] [PubMed] [Google Scholar]
- 2.Latifi, R. Surgical decision-making process: more questions than answers. Scand. J. Surg.102, 139–140 (2013). [DOI] [PubMed] [Google Scholar]
- 3.Vadeboncoeur, T. F., Heister, R. R., Behling, C. A. & Guss, D. A. Impact of helical computed tomography on the rate of negative appendicitis. Am. J. Emerg. Med.24, 43–47 (2006). [DOI] [PubMed] [Google Scholar]
- 4.Kang, H. J. et al. Evaluation of the diagnostic performance of a decision tree model in suspected acute appendicitis with equivocal preoperative computed tomography findings compared with Alvarado, Eskelinen, and adult appendicitis scores: a STARD compliant article. Medicine98, e17368 (2019). [DOI] [PMC free article] [PubMed] [Google Scholar]
- 5.Lastunen, K. S., Leppäniemi, A. K. & Mentula, P. J. DIAgnostic iMaging or observation in early equivocal appeNDicitis (DIAMOND): open-label, randomized clinical trial. Br. J. Surg.109, 588–594 (2022). [DOI] [PMC free article] [PubMed] [Google Scholar]
- 6.Krisem, M., Jenjitranant, P., Thampongsa, T. & Wongwaisayawan, S. Appendiceal wall thickness and alvarado score are predictive of acute appendicitis in the patients with equivocal computed tomography findings. Sci. Rep.13, 998 (2023). [DOI] [PMC free article] [PubMed] [Google Scholar]
- 7.Daly, C. P. et al. Incidence of acute appendicitis in patients with equivocal CT findings. AJR Am. J. Roentgenol.184, 1813–1820 (2005). [DOI] [PubMed] [Google Scholar]
- 8.Levine, C. D., Aizenstein, O., Lehavi, O. & Blachar, A. Why we miss the diagnosis of appendicitis on abdominal CT: evaluation of imaging features of appendicitis incorrectly diagnosed on CT. AJR Am. J. Roentgenol.184, 855–859 (2005). [DOI] [PubMed] [Google Scholar]
- 9.Webb, E. M. et al. The equivocal appendix at CT: prevalence in a control population. Emerg. Radiol.17, 57–61 (2010). [DOI] [PMC free article] [PubMed] [Google Scholar]
- 10.Kim, H. C., Yang, D. M., Kim, S. W. & Park, S. J. Reassessment of CT images to improve diagnostic accuracy in patients with suspected acute appendicitis and an equivocal preoperative CT interpretation. Eur. Radiol.22, 1178–1185 (2012). [DOI] [PubMed] [Google Scholar]
- 11.Pati, A., Parhi, M. & Pattanayak, BK. An ensemble approach to predict acute appendicitis. In: 2022 International Conference on Machine Learning, Computer Systems and Security (MLCSS) p. 183–8 (IEEE, 2022).
- 12.Park, S. Y. & Kim, S. M. Acute appendicitis diagnosis using artificial neural networks. Technol. Health Care23, S559–S565 (2015). [DOI] [PubMed] [Google Scholar]
- 13.Sammalkorpi, H. E., Mentula, P. & Leppäniemi, A. A new adult appendicitis score improves diagnostic accuracy of acute appendicitis—A prospective study. BMC Gastroenterol.14, 114 (2014). [DOI] [PMC free article] [PubMed] [Google Scholar]
- 14.Alvarado, A. A practical score for the early diagnosis of acute appendicitis. Ann. Emerg. Med.15, 557–564 (1986). [DOI] [PubMed] [Google Scholar]
- 15.Erdem, H. et al. Alvarado, Eskelinen, Ohhmann and Raja Isteri Pengiran Anak Saleha appendicitis scores for diagnosis of acute appendicitis. World J. Gastroenterol.19, 9057–9062 (2013). [DOI] [PMC free article] [PubMed] [Google Scholar]
- 16.Sutton, R. T. et al. An overview of clinical decision support systems: benefits, risks, and strategies for success. NPJ Digit. Med.3, 17 (2020). [DOI] [PMC free article] [PubMed] [Google Scholar]
- 17.Fralick, M., Colak, E. & Mamdani, M. Machine learning in medicine. N. Engl. J. Med.380, 2588–2589 (2019). [DOI] [PubMed] [Google Scholar]
- 18.Ferreira, L., Pilastri, A., Martins, C., Santos, P. & Cortez P. A scalable and automated machine learning framework to support risk management. In: Rocha AP, Steels L, van den Herik J, editors. International Conference on Agents and Artificial Intelligence. ICAART 2020. Lecture Notes in Computer Science, p. 291–307, (Springer, 2021).
- 19.Celik, B. & Vanschoren, J. Adaptation strategies for automated machine learning on evolving data. IEEE Trans. Pattern. Anal. Mach. Intell.43, 3067–3078 (2021). [DOI] [PubMed] [Google Scholar]
- 20.Azevedo, K., Quaranta, L., Calefato, F. & Kalinowski, M. A multivocal literature review on the benefits and limitations of automated machine learning tools. ArXiv10.48550/arXiv.2401.11366 (2024). [Google Scholar]
- 21.Luo, S. & Kindratenko, V. Hands-on with IBM visual insights. Comput. Sci. Eng.22, 108–112 (2020). [DOI] [PMC free article] [PubMed] [Google Scholar]
- 22.Faes, L. et al. Automated deep learning design for medical image classification by health-care professionals with no coding experience: a feasibility study. Lancet Digit. Health1, e232–e242 (2019). [DOI] [PubMed] [Google Scholar]
- 23.Krauß, J., Pacheco, B. M., Zang, H. M. & Schmitt, R. H. Automated machine learning for predictive quality in production. Procedia CIRP93, 443–448 (2020). [Google Scholar]
- 24.Mijwil, M. M. & Aggarwal, K. A diagnostic testing for people with appendicitis using machine learning techniques. Multimed. Tools Appl.81, 7011–7023 (2022). [DOI] [PMC free article] [PubMed] [Google Scholar]
- 25.Katiyanont, A., Jaroensutasinee, K. & Jaroensutasinee, M. Machine learning for diagnosis of acute abdominal pain in adults at Suratthani hospital. Int. J. Adv. Sci. Eng. Technol.7, 65–71 (2019). [Google Scholar]
- 26.Rajpurkar, P. et al. AppendiXNet: deep learning for diagnosis of appendicitis from a small dataset of CT exams using video pretraining. Sci. Rep.10, 3958 (2020). [DOI] [PMC free article] [PubMed] [Google Scholar]
- 27.Akmese, O. F., Dogan, G., Kor, H., Erbay, H. & Demir, E. The use of machine learning approaches for the diagnosis of acute appendicitis. Emerg. Med. Int.2020, 7306435 (2020). [DOI] [PMC free article] [PubMed] [Google Scholar]
- 28.Su, D. et al. Prediction of acute appendicitis among patients with undifferentiated abdominal pain at emergency department. BMC Med. Res. Methodol.22, 18 (2022). [DOI] [PMC free article] [PubMed] [Google Scholar]
- 29.Lin, C. et al. Prediction of compressive strength and elastic modulus for recycled aggregate concrete based on AutoGluon. Sustainability15, 12345 (2023). [Google Scholar]
- 30.Horn, F., Pack, R. & Rieger, M. The autofeat python library for automated feature engineering and selection. In Machine Learning and Knowledge Discovery in Databases (eds Cellier, P. & Driessens, K.) (Springer, 2020). [Google Scholar]
- 31.Collins GS, Reitsma JB, Altman DG, Moons KG; TRIPOD Group. Transparent reporting of a multivariable prediction model for individual prognosis or diagnosis (TRIPOD): the TRIPOD statement. The TRIPOD Group. Circulation. 131:211–9, (2015). [DOI] [PMC free article] [PubMed]
- 32.Chae, M. S. et al. Can clinical scoring systems improve the diagnostic accuracy in patients with suspected adult appendicitis and equivocal preoperative computed tomography findings?. Clin. Exp. Emerg. Med.4, 214–221 (2017). [DOI] [PMC free article] [PubMed] [Google Scholar]
- 33.Balthazar, E. J., Megibow, A. J., Siegel, S. E. & Birnbaum, B. A. Appendicitis: prospective evaluation with high-resolution CT. Radiology180, 21–24 (1991). [DOI] [PubMed] [Google Scholar]
- 34.Balthazar, E. J. et al. Acute appendicitis: CT and US correlation in 100 patients. Radiology190, 31–35 (1994). [DOI] [PubMed] [Google Scholar]
- 35.Peck, J., Peck, A., Peck, C. & Peck, J. The clinical role of noncontrast helical computed tomography in the diagnosis of acute appendicitis. Am. J. Surg.180, 133–136 (2000). [DOI] [PubMed] [Google Scholar]
- 36.Weyant, M. J. et al. Interpretation of computed tomography does not correlate with laboratory or pathologic findings in surgically confirmed acute appendicitis. Surgery128, 145–152 (2000). [DOI] [PubMed] [Google Scholar]
- 37.Thammasitboon, S. & Cutrer, W. B. Diagnostic decision-making and strategies to improve diagnosis. Curr. Probl. Pediatr. Adolesc. Health Care43, 232–241 (2013). [DOI] [PubMed] [Google Scholar]
- 38.Berner, E. S. Diagnostic decision support systems: why aren’t they used more and what can we do about it?. AMIA Annu. Symp. Proc.2006, 1167–1168 (2006). [PMC free article] [PubMed] [Google Scholar]
- 39.Segal, M. M. et al. Experience with integrating diagnostic decision support software with electronic health records: benefits versus risks of information sharing. EGEMS5, 23 (2017). [DOI] [PMC free article] [PubMed] [Google Scholar]
- 40.Qi, W., Xu, C. & Xu, X. AutoGluon: a revolutionary framework for landslide hazard analysis. Nat. Hazards Res.1, 103–108 (2021). [Google Scholar]
- 41.Verghese DC, Arshu M, Subin T. Autofhm: a python library for automated machine learning. In: 2021 Third International Conference on Inventive Research in Computing Applications (ICIRCA). p. 860–7, (IEEE, 2021)
- 42.Ikemura, K. et al. Using automated machine learning to predict the mortality of patients with COVID-19: prediction model development study. J. Med. Internet Res.23, e23458 (2021). [DOI] [PMC free article] [PubMed] [Google Scholar]
Associated Data
This section collects any data citations, data availability statements, or supplementary materials included in this article.
Supplementary Materials
Data Availability Statement
Data is provided within supplementary information files. The data provided in this study are available only for the purpose of verification and cannot be used for any publication or other related activities without prior permission. Any other use of the data must be reviewed and approved by the Institutional Review Board (IRB) of our institution. The file session_variables_240628_886_ag111_seed42.pkl can be found within the Supplementary_model_information.zip file. For detailed information about the structure of the session_variables_240628_886_ag111_seed42.pkl file, please refer to the README.txt file included in the zip archive. The global variables include datasets as follows: train, representing the training dataset with dimensions 213 × 26, and test, representing the test dataset with dimensions 90 × 26, both provided in a dataframe format.
Supplementary code.