Abstract
Wall Shear Stress (WSS) is one of the most important parameters used in cardiovascular fluid mechanics, and it provides a lot of information like the risk level caused by any vascular occlusion. Since WSS cannot be measured directly and other available relevant methods have issues like low resolution, uncertainty and high cost, this study proposes a novel method by combining computational fluid dynamics (CFD), fluid-structure interaction (FSI), conditional generative adversarial network (cGAN) and convolutional neural network (CNN) to predict coronary artery occlusion risk using only noninvasive images accurately and rapidly. First, a cGAN model called WSSGAN was developed to predict the WSS contours on the vessel wall by training and testing the model based on the calculated WSS contours using coupling CFD-FSI simulations. Then, an 11-layer CNN was used to classify the WSS contours into three grades of occlusions, i.e. low risk, medium risk and high risk. To verify the proposed method for predicting the coronary artery occlusion risk in a real case, the patient’s Magnetic Resonance Imaging (MRI) images were converted into a 3D geometry for use in the WASSGAN model. Then, the predicted WSS contours by the WSSGAN were entered into the CNN model to classify the occlusion grade.
Keywords: Coronary artery occlusion, CFD-FSI, Conditional generative adversarial network (cGAN), Convolution neural network (CNN), Noninvasive images, Cardiovascular
Subject terms: Computational biology and bioinformatics, Computational models, Image processing, Machine learning, Software
Introduction
Cardiovascular complications, such as heart attacks, are often linked to the long-term accumulation of blood cholesterol within coronary arteries. This accumulation contributes to the formation of atherosclerotic plaque, and can constrict blood flow; consequently, heart muscles are deprived of oxygen1–6. Numerous factors, including blood density, residence time, and vessel geometry, can influence plaque formation and its progression. Hemodynamic factors like low or fluctuating values of shear stress applied to vessel walls, play a significant role in the occlusions progression and plaque detachment7–9.
Given the high mortality rate associated with coronary artery disease (CAD), researchers from various scientific fields seek accurate prediction methods to prevent disease progression and develop novel treatments. Wall shear stress (WSS) as a crucial in vivo parameter, is a tangential force exerted by blood on the vessel walls, reflects the frictional force experienced by endothelial cells. WSS can impact plaque formation and its progression in various ways; for example, low WSS levels may promote plaque formation while high WSS levels can cause plaque detachment from vessel surfaces, leading to obstruction10–14.
Modeling methods and numerical simulations offer unique insights into blood flow behavior and hemodynamic properties, facilitating the detection of in vivo parameters contributing to congestion or plaque separation. These computational approaches complement traditional medical techniques, like imaging, by revealing information about changes in vessel shape and blood flow patterns that may be difficult to assess directly15–19. Consequently, these methods have gained attention as new tools for predicting blood flow behavior and hemodynamic characteristics20–23.
Computational fluid dynamics (CFD) and its coupling with fluid-structure interaction (FSI) are two primary methods for simulating blood flow. The vessel wall is considered rigid in CFD, whereas FSI accounts for wall elasticity24. While CFD is computationally less expensive, most studies utilize this method despite FSI providing more accurate and realistic simulations25,26. Notably, considering the vessel wall as rigid in CFD can overestimate blood flow velocity and WSS27. Straughan et al.6 presented an algorithmic method for the automatic generation of 3D simulations of optical coherence tomography images using the finite element method. Their method allows large-scale clinical analysis and personalized diagnoses and treatment planning.
Carvalho et al.28 employed CFD and FSI coupling to evaluate the influence of arterial wall compliance on hemodynamic outcomes by examining blood flow in coronary arteries. Their findings demonstrated that CFD-FSI provides significantly more accurate blood flow simulations and revealed that wall compliance significantly affects WSS distribution while having a minor impact on other parameters.
Malvè et al.29 investigated the effects of wall compliance on WSS distribution by comparing left coronary artery WSS simulations using both FSI and rigid wall models. They found that WSS distribution is affected by wall compliance, leading to substantial differences in minimum and maximum WSS values. Lopes et al.20 performed carotid blood flow simulations using FSI and rigid wall models for specific geometries and transient boundary conditions. Their study further emphasized the importance of using FSI models, whereas rigid wall models tend to overestimate flow velocity and WSS.
Simulation methods are appropriate alternatives for examining coronary artery occlusion compared to high-risk and expensive medical methods like angiography, that carries risks such as death, heart attack, and stroke30,31. However, the time-consuming nature of these simulations poses a challenge, as each individual’s unique vessel geometry necessitates repeating the entire process for every new case, making CAD predictions cost-prohibitive32–34. Moreover, other technologies, like four-dimensional phase-contrast magnetic resonance imaging (4D flow MRI), which is used to determine the quantity of WSS, have a shallow resolution. This can be resolved by replacing artificial intelligence-based methods35,36. Consequently, there is a need for an alternative technique to overcome these limitations.
Although there are no definitive early signs for the diagnosis of CAD, image-processing systems have emerged as powerful tools for prediction and noninvasive20,37–40. Given that machine learning (ML) algorithms have already shown significant potential in medical imaging and disease prediction, their importance and application in advancing modern medicine and improving healthcare services continue to grow41–44.
Jordanski et al.45 presented an ML-based approach to reduce computational time for CFD-based WSS distribution calculations. They accurately predicted WSS distribution at various time points using multivariate linear regression (MLR), multilayer perceptron neural network (MLPNN), and Gaussian conditional random fields (GCRF). Tesche et al.46 compared CFD results with an ML algorithm for determining fractional flow reserve (FFR) values, verifying their findings against several reference standards. Both methods yielded comparable results with minimum differences. Building on this, Wang et al.47 developed the DEEPVESSEL-FFR platform using an automatic quantification method and deep learning (DL), enabling efficient evaluation of coronary artery stenosis.
Coenen et al.48 evaluated their proposed method by comparing FFR results from CFD and ML methods using data from 525 vessels, with invasive coronary angiography (ICA) as the reference. Both methods performed equally well. In another study, Koo et al.49 combined machine learning and CFD simulations to assess the impact of various parameters on the performance of a machine learning-based computed FFR diagnostic method. Despite the close agreement between the two methods in statistical analysis, the ML method was more appropriate for lesion-specific ischemia prediction.
Deep learning and artificial neural networks have recently demonstrated remarkable progress50,51. These techniques have revealed meaningful insights by uncovering complex, non-linear relationships between parameters that shallow machine learning approaches cannot capture52–55. DL algorithms have successfully bridged this gap, demonstrating the ability to quickly identify and categorize cases prone to CAD with high accuracy56–58.
Gharleghi et al.59 analyzed blood flow in coronary arteries by applying DL for the time-averaged wall shear stress (TAWSS) hemodynamic index as a predictive measure based on vessel geometry. By combining CFD simulations and DL, they achieved highly accurate TAWSS predictions. Li et al.60 employed CFD and DL for the prediction of 3D cardiovascular hemodynamic in bypass surgery and successfully reproduced the relationship between cardiovascular geometry and in vivo hemodynamic for FFR. Suk et al.61 used mesh convolutional neural networks to estimate WSS in a 3D artery model. Their DL model achieved 90.5% accuracy with a 1.6% absolute average error in predicting WSS.
Raissi et al.62 employed a DL-based method as an alternative to Navier-Stokes equation-based approaches for visualizing flow patterns in biological systems. This innovative method successfully extracted quantitative information that could not be directly measured. Using physical simulations and machine learning, Feiger et al.63 examined the influences of stenosis degree, blood flow velocity, and blood viscosity on pressure gradient and WSS. They proposed a model to predict these parameters, achieving a pressure gradient estimation error of 1.18 mmHg and a WSS estimation error of 0.99 Pa. Arzani et al.64 explored near-wall blood flow and calculated WSS using a physics-informed neural networks (PINNs) model, by incorporating information from governing equations. Their results revealed the potential of DL models to improve WSS quantification.
Chen et al.65 presented an effective image inpainting algorithm via partial multi-scale channel attention mechanism and deep neural networks to deal with problems such as fuzzy images, texture distortion and semantic inaccuracy, which are solved by using deep learning modules (the Res-U -Net module). This approach can adequately represent multi-scale features with many irregular defects.
Generative adversarial networks (GANs) are a class of powerful machine learning models that have revolutionized many fields including medical imaging and diagnostics. Researchers have used the ability of GANs to generate high-quality, and realistic medical images to address challenges in diagnosing and treating CAD66–68. Gurusubramani and Latha66 introduced a novel hybrid GAN with semantic resonance for generating and analyzing synthetic cardiac images, addressing the crucial need for accuracy and clinical relevance in cardiac image synthesis. Their method achieved high accuracy by incorporating pre-trained CNN classifiers and optimizing adversarial and classification losses.
Another application of GAN is data augmentation. Ahmadi Golilarz et al.68 introduced a deep learning model called generative adversarial networks-multi discriminator (GAN-MD) as a noninvasive method to diagnose myocarditis using cardiac magnetic resonance (CMR) images. GAN-MD addresses the challenges of imbalanced classification and image generation by incorporating a reconstruction loss, regularization techniques, and focal loss-based training. This research results in superior performance compared to other methods and makes it a promising tool for detecting and monitoring myocarditis. Also, anomaly detection (AD) is one of the applications of GAN. Saeeda et al.69 provided an extensive survey on using GANs for AD in various applications like Digital Healthcare. Their study discussed state-of-the-art approaches, available datasets for evaluation, challenges, and future research directions to enhance the effectiveness of GANs-based AD techniques further.
Although there have been many studies on predicting and classifying occlusion in coronary arteries using DL and combining it with numerical simulations, none of them have been able to predict the risk of each patient’s unique vascular occlusion with high accuracy and speed. Therefore, the motivation of this study is to develop a method to overcome uncertainty in computational models as well as low resolution and experimental quantification of hemodynamic.
In this study, 350 fluid-structure interaction (FSI)-coupled computational fluid dynamics (CFD) simulations were performed to closely replicate blood flow behavior in coronary arteries under various occlusion scenarios. These scenarios included different occlusion percentages, different occlusion locations, different occlusion lengths, and combinations of multiple occlusions with various percentages. Each simulation’s hemodynamic features were used to label the corresponding wall shear stress (WSS) contour as data. To enhance the accuracy of the employed algorithms, the dataset was expanded while maintaining the label for each data point. Subsequently, a conditional generative adversarial network (cGAN) model was employed to predict WSS distribution as a crucial parameter in CAD analysis on inside surfaces of the arteries. An 11-layer convolutional neural network (CNN) model was employed to classify the WSS data into three trained grades for CAD risk predictions. Finally, we used a practical case as untrained data to demonstrate the efficacy of the proposed methods in this study.
In this paper, the main contributions are as follows: (1) proposing a novel method by using cGAN called WSSGAN to predict WSS contours accurately from noninvasive images, (2) developing a neural network model, WSSGAN, to generate WSS contour images, enhancing data generation capabilities, (3) designing the cGAN model architecture with an encoder-decoder network for WSS prediction, showcasing the technical advancements in image processing, (4) utilizing an 11-layer CNN model to classify WSS contours into three grades, enabling accurate patient classification.
Methodology
Simulation details
To better understand the study process, the flow-process diagram is shown in Fig. 1.
Fig. 1.
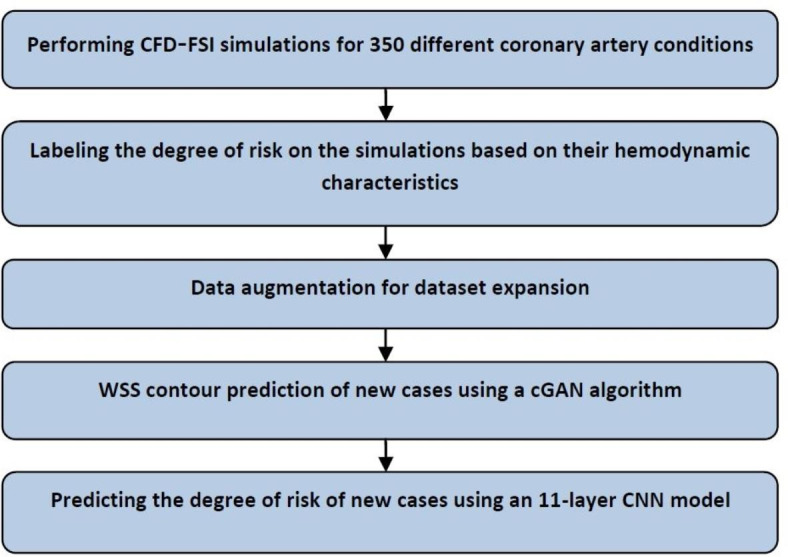
Flow-process diagram for predicting the risk of each patient’s unique vascular occlusion.
Since one of the most essential parts of this study is performing coupling CFD with FSI simulations of blood flow in coronary vessels, the following sections give the simulation details.
Geometry
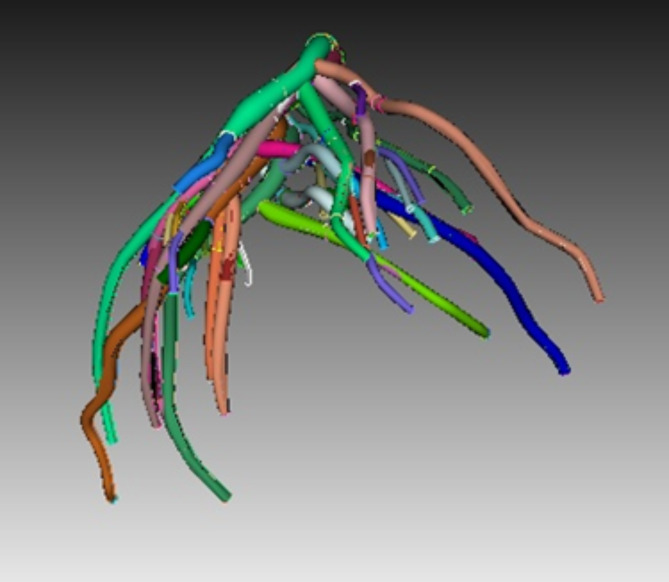
The under-study geometry was a part of the exact and detailed geometry of the human left coronary artery and bifurcation regions, which was made in a study at the University of Colorado70 (Fig. 2). The models consist of major bifurcation regions (diagonal, circumflex, obtuse marginal (OM) and other regions) and vessel segments. To study most of the possible states, 350 separate CFD-FSI simulations were run in each branch with different conditions, including occlusion in percentages (i.e., the ratio of the area resulting from obstruction to the cross-sectional area of the vessel) of 80, 60, 40, and 20 at different places of the left coronary artery (in various vessels and at different distances from each other and at the junction), and different occlusion lengths (i.e.,the same diameter, twice the diameter, and three times the diameter), as well as the combination of two or three consecutive occlusions with different percentages, along the vessel length or around the multi-branch points (Fig. 2).
Fig. 2.
The geometry of the human left coronary artery and bifurcation regions.
Governing equations
This research tried to apply the characteristics of blood flow in simulations as closely as possible to the actual conditions of the body. Therefore, the blood was assumed to be incompressible, non-Newtonian, unsteady, and laminar flow7,71–73. The average Reynolds number was 320 for the blood flow inside the artery. The density and the specific heat capacity of blood were considered to be 1050  and 3470
 , respectively. To bring the results closer to the actual conditions, the numerical simulations were run in coupling CFD with FSI using ANSYS Fluent software 17.274, which FSI applies the wall elasticity. Equations 1 and 2 give continuity and Navier-Stokes equations, respectively:
 |
1 |
 |
2 |
where  is the velocity vector,
  is the static pressure,
  is the fluid density and
  is the dynamic viscosity73. In addition, since the blood is considered to be a non-Newtonian fluid, it is necessary to use the CARREAU model for its behavior, which is as follows75:
 |
3 |
where the infinite shear viscosity ( and the viscosity at a shear rate of 0 (
 are 0.00345 and 0.0565 Pa.s, respectively,
 is the instantaneous shear rate. Also,
  is the time constant, and n is the power-law index; their values are considered to be 3.313 and 0.3568, respectively75.
The solid part of the simulation, i.e., the artery wall, is considered to be an incompressible and isotropic linear elastic solid. The interaction and stress tensor are given in Eqs. 4 and 5, respectively.
 |
4 |
 |
5 |
where  is solid density,
  is solid displacement vector,
  is the forces entering the solid,
  is the Cauchy stress tensor,
  is the first Lamé parameter,
  is the second Lamé parameter.
  is the strain tensor,
  is the trace function and
  is the identity matrix68. WSS in 3D form is required in this study that is obtained from Eq. 6, where
  and
and  are the deformation rate and the dynamic viscosity, respectively76,77.
 |
6 |
Boundary conditions
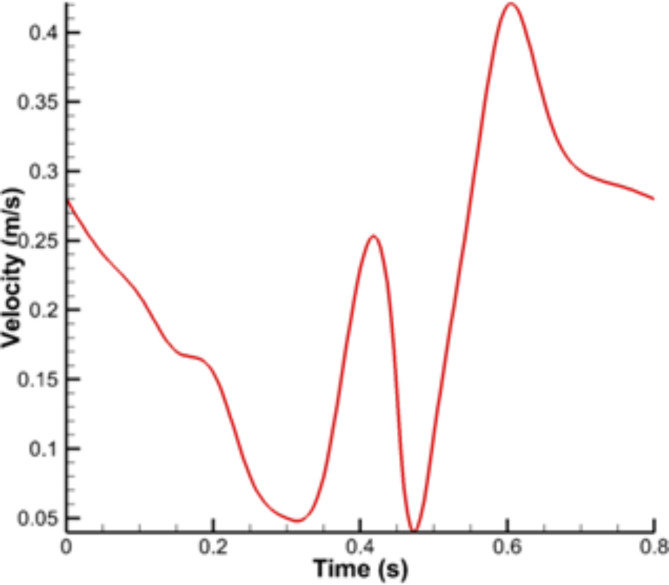
The pulsatile velocity profile was applied using a user-defined function (UDF) code as the boundary condition at the vessel inlet. This profile is shown in Fig. 3. The pressure was considered to be 90 mm Hg at the vessel outlet. While considering a constant outlet pressure may not account for the pressure variability across different branches of the coronary tree, the simulation methodology of this study provides valuable insights into the hemodynamic consequences of occlusions in specific branches. This approach offers a controlled framework for assessing the impact of localized disease and serves as a foundation for future studies incorporating more complex physiological conditions. All inlet and outlet boundaries were considered to be fixed, and other fluids and solid boundaries were defined as fluid-structure interfaces78,79.
Fig. 3.
Pulsatile velocity profile at the inlet of vessel.
Solution details
Simulations were performed in coupling CFD with FSI using ANSYS Fluent software based on the finite volume method. CFD-FSI stands for computational fluid dynamics with fluid-structure interaction, a method used to obtain WSS in vessels. It involves running numerical simulations using software like ANSYS Fluent to simulate the effect of flow on the vessel wall. CFD-FSI simulations are essential for accurately simulating blood flow in coronary arteries and understanding the impact of wall compliance on parameters like WSS distribution. This method is crucial for predicting unique vascular occlusions in individual patients with high accuracy and speed using noninvasive photographs. CFD-FSI simulations provide a more realistic representation of blood flow than rigid wall models, ensuring that flow velocity and WSS are not overestimated.
The SIMPLE method was used for pressure and velocity coupling with a time step of 0.01 s. A time step of 0.01s is appropriate for simulating blood flow in the coronary arteries using the FSI method, as it can capture the relevant hemodynamic and structural changes over the cardiac cycle. The CFD method was applied to the fluid domain, and this part was divided into several control volumes. Conservation equations were applied to each of them. The governing equations for the solid boundary (i.e., vessel wall) were solved using the Finite Element Method (FEM). The one-way FSI method was used. First, the fluid flow simulation was performed and then the resulting fluid forces were applied as boundary conditions to the deformable vessel wall. The fluid and solid mesh were properly coupled at the fluid-solid interface using techniques such as overset meshing. The vessel wall was assumed as a hyperelastic material used in the Ogden model. After that, the calculated changes were transferred to the fluid. These steps were repeated until the difference between the changes in the last two iterations was less than 0.5%80.
An unstructured mesh was used for geometry meshing in both fluid and solid domains. To ensure the mesh quality, blood flow simulation was done for one of the branches with different number of elements to find the most optimal number of elements.
The maximum volume of flow occurs in 20% occlusion, which means a larger control volume and more mesh were used in calculations; if the results of this percentage of occlusion were independent from the number of elements, it can assure that the other occlusion results with this number of elements are independent of the number of the elements. For this purpose, the velocity profiles at the beginning, middle, and end of the occlusion were calculated. In this way, five meshes with different numbers of elements were generated. The velocity profiles for these meshes at the three cross-sectional areas are compared in Fig. 4. As one can see, “mesh 3” with 650,928 elements was the best because there is little difference between the velocity profile of this mesh and that of finer meshes.
Fig. 4.
Mesh independency for velocity profiles at (a) beginning, (b) middle, and (c) end of the occlusion.
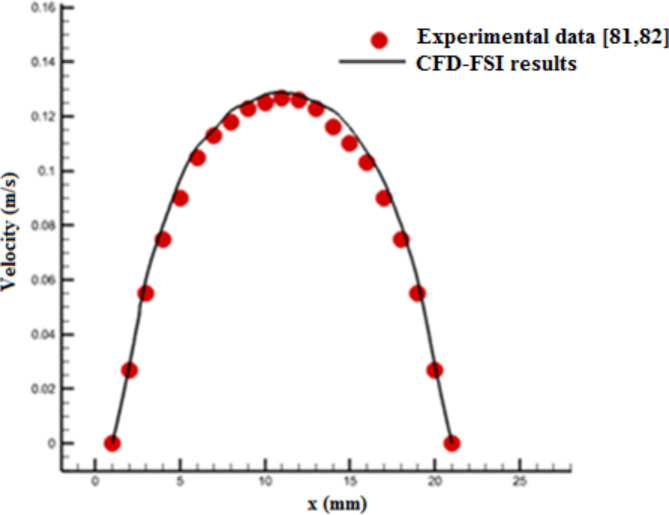
The experimental data of Gijsen et al.81,82 for axial blood velocity profile in a vessel were used to validate CFD-FSI results. These experimental data are related to a carotid bifurcation for unsteady and non-Newtonian blood flow and the vessel length is six times its diameter (L = 6D). This bifurcation also is a part of coronary vessels in Fig. 2. Figure 5 compares the calculated velocity profile from CFD-FSI method with the corresponding values of experimental data. There is a good agreement between the simulation results and experimental data81,82.
Fig. 5.
Comparison of the calculated velocity profile based on CFD-FSI coupling and the corresponding values of experimental data81,82.
Dataset
Building the dataset
Building a dataset is one of the essential steps to reach this study’s final purpose. It consists of collecting the numerical simulations results, normalizing and labelling of them and generating artificial data. The dataset used consists of 3D contours of the WSS of each numerical simulation. Normalization is necessary to maintain the value and stability of the dataset before using them in the models. It is known as one of the essential measures for data pre-processing. With this step, the learning speed of the proposed model increases significantly. In this study, the value of each image pixel is normalized according to the minimum and maximum WSS values in the range between 0 and 1. Since all the data are obtained by simulation, no data in this collection is missing, repetitive, or has problems that need to be removed.
Data labeling
Since the purpose of this study is to provide a method to detect the risk of coronary artery occlusion, proper labeling and identification for data classification are very important. Necessary information was collected from reliable scientific sources83–91 that quantitatively examine the relationship between WSS and the risk of atherosclerotic plaques as well as the relationship between WSS with velocity and pressure contours in different situations. The effect of vascular anatomy on WSS and the classification of coronary arteries using quantitative and qualitative parameters were studied.
The data labeling is manually determined based on the parameters that describe the anatomy of coronary arteries (occlusion location, occlusion length and vessel radius in the occlusion region), minimum and maximum WSS, pressure, velocity, blood rheological properties, and other parameters. Data labeling was done in such a way that all data were classified into three groups based on their characteristics: Grade 1 (low risk), Grade 2 (medium risk), and Grade 3 (high risk). Figure 6 shows an example of the members of each classification.
Fig. 6.
Samples of three grades: (a) low risk, (b) medium risk and (c) high risk.
To facilitate a comprehensive understanding of the data generation process, a flowchart was provided to illustrate the key steps in creating a representative dataset sample. This flowchart gives a clear and structured overview of the data generation process (Fig. 7).
Fig. 7.
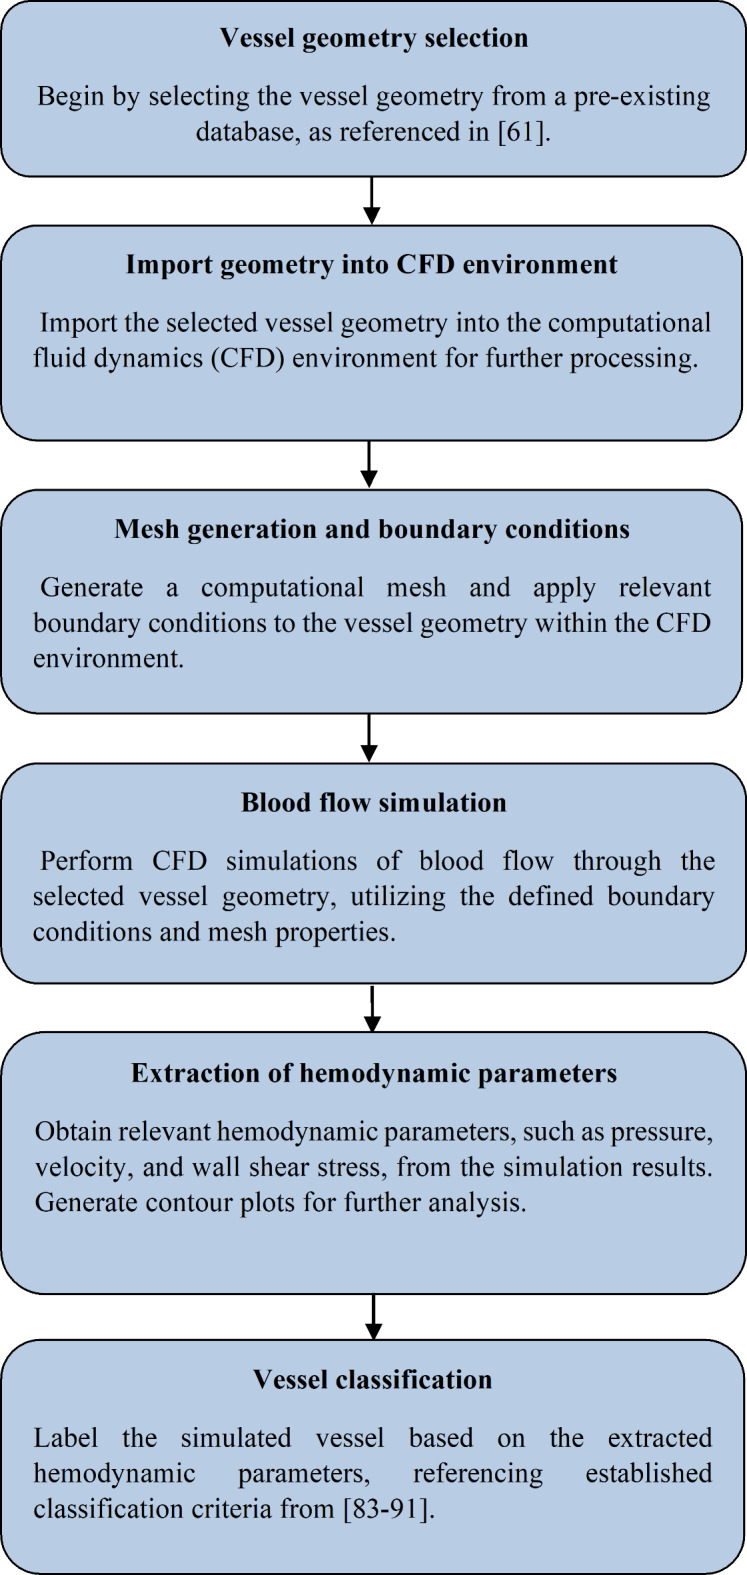
Flow-process diagram for generating a data sample.
Increasing the number of data
In deep learning strategies, the amount of data plays an essential role in training the model and the accuracy of final results because having a large amount of data gives the model enough information for correct training92,93. In some issues like this study, obtaining a large amount of data requires spending a lot of money and time, so in such cases, some techniques are used to get a dataset that provides reliable and acceptable results. These new data are added to the dataset to increase the training data by making changes such as rescaling, rotation, lighting changes, and adding noise to the primary data. They are also added by keeping the class label and the number of pixels of the original image.
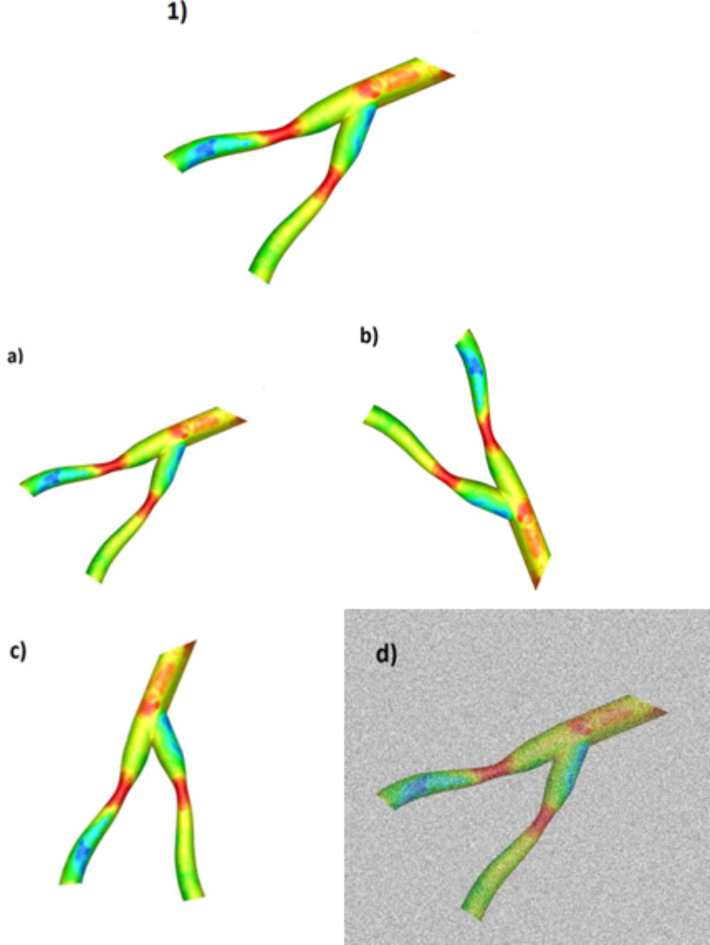
Figure 8 shows four different techniques for data enhancement, those are: (a) shrinking the image by 20%, (b) rotating the original image by 90 degrees to the right, (c) rotating the original image by 45 degrees counterclockwise, and (d) adding Gaussian noise with mean and variance of 0 and 0.5, respectively. These four techniques were applied to all 350 data and finally the total number of data increased by four times.
Fig. 8.
Four techniques to increase the amount of data in a sample. 1) original data, (a) shrinking the image by 20%, (b) rotating the original image by 90 degrees to the right, (c) rotating the original image by 45 degrees counterclockwise, (d) adding Gaussian noise.
WSSGAN model
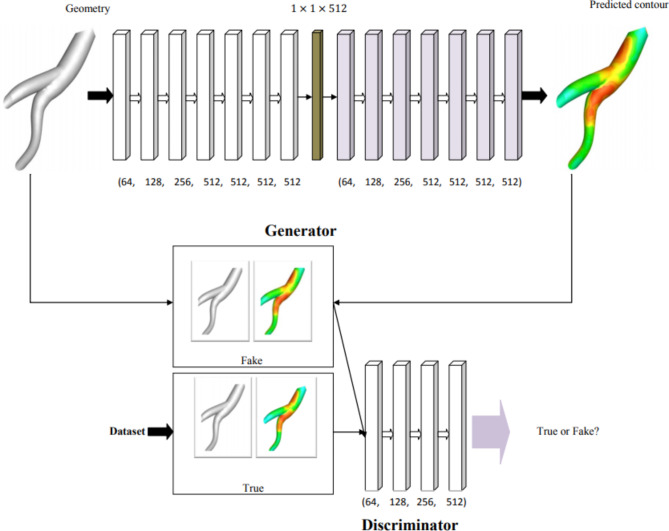
Generative adversarial networks (GANs) were proposed for the first time by Goodfellow et al.94 in 2014. It is a generative model that produces new data similar to the training dataset; in this study, the algorithm’s output is an image of the WSS contour. GANs consist of two different neural networks, generator and discriminator, which can automatically discover and learn the patterns in the input data95. A widely used model based on the GANs algorithm is the conditional generative adversarial network (cGAN) that has improved the performance of these networks by conditioning the generator and the discriminator to control the input and output images96–99. The wall shear stress generative adversarial networks (WSSGAN), as of the cGAN type, are evaluated on two datasets so that the created dataset is randomly divided into two parts.
In the first part, only their geometry is used as input to the generator, and in the second part, their WSS contours are directly entered into the discriminator. These two networks compete to check, record and repeat the changes in the dataset. The generator network produces fake data so that they can train the discriminator and also the generator learns to create acceptable data. These samples produced by the generator are considered negative training samples for the discriminator. The primary purpose of the generator is to trick the discriminator into classifying its output as true samples. The task of the discriminator is to identify and classify the true data from the generated fake data. During training, the discriminator is connected to two loss functions, which ignore the generative loss and only use the discriminator loss.
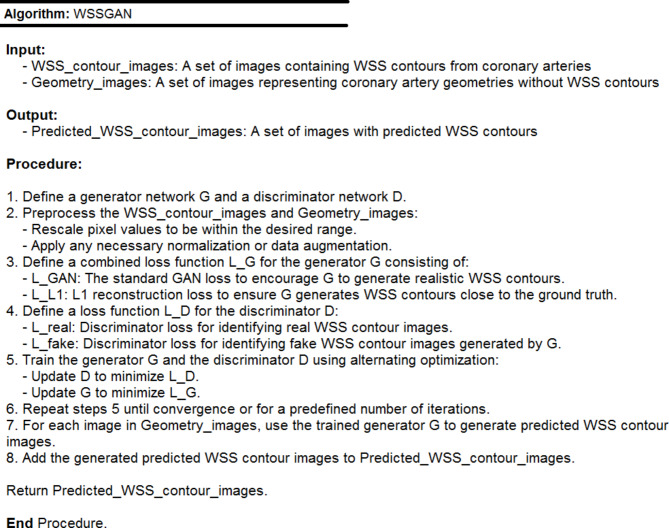
The architecture of the cGAN model is shown in Fig. 9. The WSSGAN architecture was designed as an encoder-decoder network and generates a feature vector with size of 512 at the bottleneck. The input to the generator was a geometry modeled with a 128 × 128 meshes and void regions were modeled applying an infinitesimally small Young’s modulus. The generated output is a 128 × 128 mesh that shows the WSS distribution. The encoder includes log2(m) sampling blocks with a convolutional layer, a batch normalization layer and a LeakyReLU layer. The decoder consists of log2(m) sampling blocks with a deconvolutional layer, a batch normalization layer and a ReLU layer. Both convolutional and deconvolution layers had a kernel size of 5 × 5 and a step size of 2. WSSGAN was trained with a learning rate of 0.001 using the Adam optimizer100 with a batch size of 64. To better understand the working process of WSSGAN algorithm, its pseudocode is shown in Fig. 10.
Fig. 9.
WSSGAN architecture, the generator (top) and the discriminator (bottom).
Fig. 10.
The pseudocode of WSSGAN algorithm.
Evaluating the performance of each model is very important. Four criteria are used to evaluate the performance of WSSGAN: Mean Absolute Error (MAE), Percentage Mean Absolute Error (PMAE), Peak Absolute Error (PAE) and Percentage Peak Absolute Error (PPAE).
MAE as defined in Eq. 7 is used to evaluate the overall quality of the predicted shear stress distribution. In this equation n is the total number of samples, yj and y*j are the actual and predetermined values, respectively101. The lower value of these criteria is the better performance of the model.
 |
7 |
PMAE measures the model prediction accuracy as a percentage, which is given in Eq. 8. In this equation, y is the sample value; whereas, min(y) and max(y) are the minimum and maximum sample values, respectively101.
 |
8 |
PAE and PPAE measure the local WSS critical value and are defined in the form of Eqs. 9 and 10101.
 |
9 |
 |
10 |
CNN model
Convolutional neural networks (CNNs) are a type of neural network architectures usually used for image recognition102. Since two-dimensional convolutional filters can detect the edges of images, it is suitable for generalizing of image patterns103. CNNs perform excellently in many applications, like image classification, object detection and medical image analysis104–106.
This study employed a CNN to predict vessel occlusion risk, categorizing it into three classes: high, medium, and low. The WSS contour from the cGAN model was used as input, with the output being the risk prediction for vessel occlusion. The CNN model proposed in this study consists of four layers for feature detection, four layers for Max pooling, one flattened layer and two fully connected layers for classifying data into three classes. The specifications and values of the used parameters and the network architecture are shown in Fig. 11. The convolution operation is performed in the first layer, which contains 32 kernels with a size of 5 × 5. Its activation function is selected to be the Rectified Linear Unit (ReLu), and then max pooling of size 2 × 2 and stride is 2. The kernel was considered in the following layers with a size of 3 × 3. The second stage convolution was done with 64 kernels using ReLu and again max-pooling of size 2 × 2, stride 2, and the Stochastic Gradient Descent (SGD) optimizer. The same values were repeated for the third and fourth convolutions. The last fully connected layer consists of two hidden layers with the neuron numbers 3823 and 492, respectively. The activation function and optimizer in the output layer were considered to be softmax and hyperparameter, respectively. Figure 12 also shows a pseudocode for this network.
Fig. 11.
CNN model architecture including inputs, feature maps, hidden units and outputs.
Fig. 12.
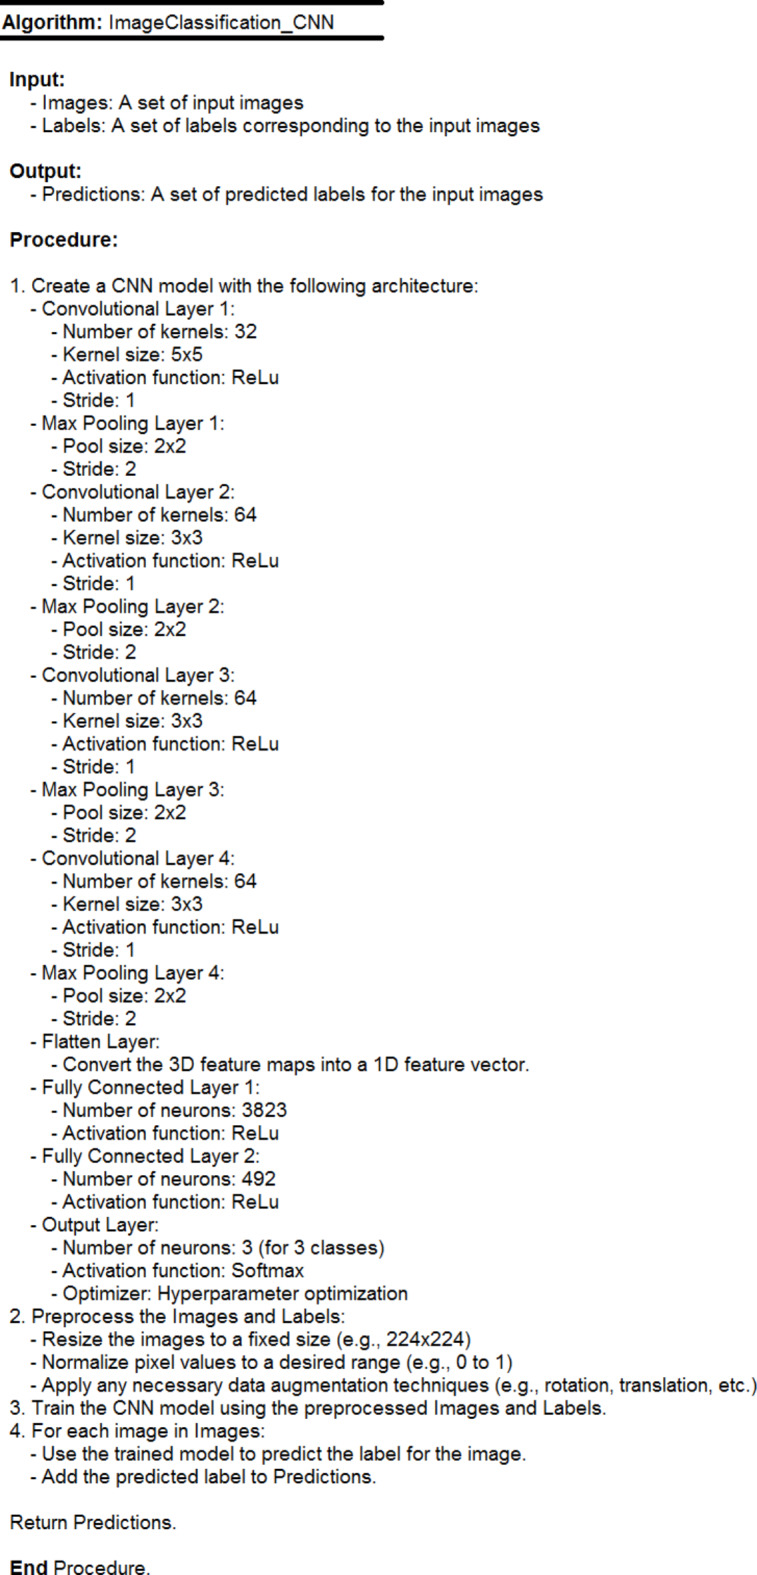
The pseudocode of CNN algorithm.
To check the proposed model accuracy and validity, some criteria were calculated by the Confusion Matrix107. This matrix consists of the information of real and predicted values for a two-class classification problem (positive and negative) according to Table 1.
Table 1.
Confusion matrix for checking the proposed model accuracy and validity.
| Predicted class | ||
|---|---|---|
| Actual class | True positive1 (TP) | False negative3 (FN) |
| False positive2 (FP) | True negative4 (TN) | |
1 Correctly placed in the positive class 2 Wrongly placed in the positive class.
3 Wrongly placed in the negative class 4 Correctly placed in the negative class.
In general, accuracy means how much the model has correctly predicted the output and it indicates the number of classifications that have been correctly identified107. According to Table 1, the accuracy is defined as Eq. 11.
 |
11 |
The sensitivity parameter means the ratio of favorable cases that the model has correctly identified as positive samples and is calculated as follows107:
 |
12 |
Precision is the ratio of the number of correct cases classified by the model from a particular class to the total number of positive cases the model has classified, either correctly or incorrectly107.
 |
13 |
In the cases where identifying a negative class is important, using Specificity along with sensitivity is a suitable criterion. It is the ratio of the number of correct cases classified by the algorithm from one class to the number of cases in the desired class107:
 |
14 |
False positive rate or miss rate is the probability of missing a true positive in classification. This criterion can be positive or negative107.
 |
15 |
Results
WSSGAN performance
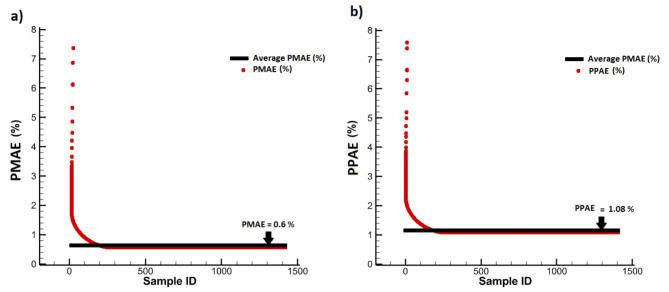
To evaluate the model accuracy, 80% of half of the dataset was randomly used as training data and the other 20% for testing data. To assess the proposed model performance, the results of WSS prediction were compared with those of in Ref61. Table 2 gives the errors for WSSGAN and the model of Ref61. based on evaluation criteria. It can be seen that the WSSGAN model performed better for all four criteria compared to Suk et al.‘s model61. In addition, the statistical accuracy of WSSGAN based on PMAE and PPAE values in each sample and its mean value in the entire training data is shown in Fig. 13. From that, it can be concluded that WSSGAN model has a very high statistical accuracy.
Table 2.
Comparison of the errors for the WSSGAN model and the model of ref61.
| MAE | PMAE | PAE | PPAE | |
|---|---|---|---|---|
| WSSGAN (present work) | 1.64 | 0.6% | 17.15 | 1.08% |
| Suk et al. [61] | 9.25 | 1.43% | 81.46 | 18.60% |
Fig. 13.
The statistical accuracy of WSSGAN: (a) PMAE of all data and average PMAE on the testing data, (b) PPAE of all data and average PPAE on the testing data.
A new geometry was used to visually show the prediction results of the WSSGAN model by comparing it with the ground truth model and ensuring the prediction correctness. The new geometry, which does not include a WSS contour but reflects the fluid shape of the input model, was employed to predict WSS contours for the intended flow geometry. Figure 14 shows the ground truth and the predicted contour using two models, the WSSGAN and Suk et al.61. The proposed model effectively captures the WSS contour in the new geometry and reduces the computational time for this geometry by 800 times.
Fig. 14.
WSS contours in (a) ground truth model, (b) WSSGAN model, and (c) Suk et al.‘s model61.
CNN performance
In this section, the results of applying the CNN model to the dataset are given, and then its performance is evaluated based on two well-known classification algorithms, i.e. K-Nearest Neighbors (KNN) and Support Vector Machine (SVM). The proposed CNN model was trained by dividing the dataset into 75% and 25% as training and testing data with 20 epochs, respectively. The CNN model performance based on evaluation criteria is given in Table 3. From this table, the proposed CNN model performed well due to the high values of accuracy, sensitivity, specificity and precision and the low value of FPR.
Table 3.
CNN model performance based on evaluation criteria.
| Accuracy | Sensitivity | Specificity | False positive rate (FPR) | Precision | |
|---|---|---|---|---|---|
| CNN | 0.885 | 0.940 | 0.824 | 0.0927 | 0.842 |
Comparison of CNN performance with machine learning algorithms
To check further the performance and accuracy of the proposed CNN model, its results were compared with those of two algorithms, i.e. SVM and KNN. For this purpose, these two algorithms were trained with 70% of the data and tested with the remaining 30% of them. For the KNN model, two values of 4 and 8 were considered for K. The parameters indicating its performance are provided in Table 4. The accuracy, sensitivity and precision of K = 8 proved that its performance was better than that of K = 4. However, K = 4 performed better in the two criteria of specificity and FPR. In total, because the two criteria of accuracy and sensitivity have a more important role than other criteria in the data classification, it can be concluded that K = 8 has been able to classify the data better.
Table 4.
KNN model performance based on evaluation criteria.
| Parameter | K = 4 | K = 8 |
|---|---|---|
| Accuracy | 0.75 | 0.83 |
| Sensitivity | 0.825 | 0.887 |
| Specificity | 0.728 | 0.692 |
| False positive rate (FPR) | 0.110 | 0.144 |
| Precision | 0.75 | 0.81 |
Two different kernels, Sigmoid and Linear, were considered for SVM to check and analyze its performance. Table 5 gives its performance, proving that despite the Sigmoid kernel being weaker in specificity compared to Linear, it performs better due to more accuracy, sensitivity, and precision and less FPR. Since the two criteria of accuracy and sensitivity are more important than other criteria in this research, the performance of Sigmoid kernel is better.
Table 5.
SVM model performance based on evaluation criteria.
| Parameters | Sigmoid | Linear |
|---|---|---|
| Accuracy | 0.837 | 0.795 |
| Sensitivity | 0.892 | 0.764 |
| Specificity | 0.748 | 0.814 |
| False positive rate (FPR) | 0.153 | 0.177 |
| Precision | 0.706 | 0.662 |
Table 6 compares the performance of SVM and KNN. This table shows that KNN with K = 8 has performed better in this issue because it has more sensitivity, accuracy, precision and specificity and lower FPR than that of SVM. Therefore, the results of the KNN algorithm (K = 8) were compared with those of the proposed CNN model.
Table 6.
Comparison of the performances of SVM and KNN.
| Parameter | Sigmond)) SVM | KNN (K = 8) |
|---|---|---|
| Accuracy | 0.83 | 0.837 |
| Sensitivity | 0.887 | 0.892 |
| Specificity | 0.692 | 0.748 |
| False positive rate (FPR) | 0.153 | 0.144 |
| Precision | 0.706 | 0.81 |
Table 7 compares the classification performance on the same dataset for CNN and KNN models. Considering the excellent sensitivity and accuracy of CNN, it can be concluded that the proposed deep learning model performs much better in the classification of the used dataset.
Table 7.
Comparison of the performance of the proposed CNN model with that of KNN algorithm (K = 8).
| Parameter | CNN | KNN (K = 8) |
|---|---|---|
| Accuracy | 0.885 | 0.83 |
| Sensitivity | 0.940 | 0.887 |
| Specificity | 0.824 | 0.692 |
| False positive rate (FNR) | 0.0927 | 0.144 |
| Precision | 0.842 | 0.81 |
Evaluation of the proposed CNN model for a real case
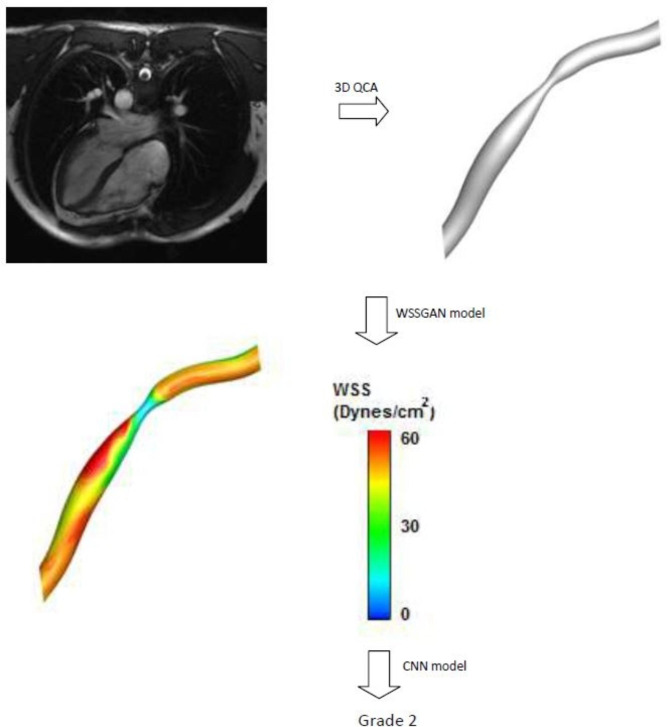
The ability of the proposed CNN model was evaluated for a real case for detecting the grade of coronary artery occlusion. First, it is necessary to convert the patient’s MRI images into a 3D geometry that is recognizable for the WSSGAN model using 3D software, like ITK-SNAP. This software has a collection of algorithms that can detect edges in coronary artery images obtained by MRI and computed tomography angiography. It can detect vessel diameter changes and occlusions as 3D images along the vessel. These images were entered as input to the WSSGAN model, and the model’s output was the predicted WSS contour (Fig. 15). To determine the class of occlusion in this sample, the obtained contour was entered into the CNN model, and after classification, it was classified as grade 2, which was the class of medium-risk coronary artery occlusion.
Fig. 15.
An example of the classification of a real case to detect its coronary artery occlusion’s grade.
Discussion
The accuracy of the proposed model was evaluated through detailed evaluation criteria and experimental data, which provided strong evidence for its statistical reliability. The proposed cGAN algorithm demonstrates its ability to predict the WSS contour for new cases, with minimum deviation from the ground truth and Suk et al.61 models. This also confirms its performance. Moreover, comparing the CNN results with those of KNN and SVM algorithms reveals its superior accuracy and sensitivity in the classification of used dataset. Confidence in the predictive accuracy of the proposed model to determine risk levels in new cases was determined by using an MRI image for a coronary artery occlusion.
Conclusions and recommendations
In this study, an alternative method to other available methods for determining risk levels for coronary artery occlusions was used. This method can be used to overcome the problems of other methods, including low resolution and uncertainty, and also the limitations of CFD-FSI simulations in terms of time and cost. A unique dataset was generated from blood flow simulations based on CFD-FSI coupling under three different occlusion conditions in coronary vessels.
A WSSGAN model was trained on this dataset to predict WSS contours for each individual vessel geometry, and its accuracy was verified by comparisons of its prediction with simulation results and Suk et al.‘s model. Furthermore, an 11-layer CNN was employed for risk classification into high, medium, and low grades. The CNN model outperformed KNN and SVM algorithms, achieving a sensitivity and accuracy of 0.940 and 0.885, respectively. The proposed method demonstrates significant potential for highly accurate and rapid WSS contours prediction. This innovative method has the potential to enhance significantly accurate and timely diagnosis of vascular occlusion, thereby providing valuable assistance in the field of cardiology.
The limitations of this study include the bad performance of the cGAN algorithm when faced with images containing occlusions at an inappropriate and illegible angle. In future works, a two-phase model can be used in simulations to consider fat particles. Applying this model creates challenges, like the changes in occlusions and blood flow behavior.
Author contributions
“M.N. wrote the main manuscript, conducted the investigation, and handled the software and methodology. A.M. supervised and edited the manuscript, as well as contributed to conceptualization. All authors reviewed the manuscript.”
Data availability
The authors declare that the data supporting the findings of this study are available within the paper. Should any raw data files be needed in another format they are available from the corresponding author upon reasonable request.
Declarations
Competing interests
The authors declare no competing interests.
Footnotes
Publisher’s note
Springer Nature remains neutral with regard to jurisdictional claims in published maps and institutional affiliations.
Contributor Information
Mozhdeh Nikpour, Email: mozhdehnikpour7@gmail.com.
Ali Mohebbi, Email: amohebbi@uk.ac.ir, Email: amohebbi2002@yahoo.com.
References
- 1.Mineo, R. et al. A Convolutional-Transformer Model for FFR and iFR Assessment from Coronary Angiography. IEEE Transactions on Medical Imaging. (2024). [DOI] [PubMed]
- 2.Zhong, C., Yang, D., Wang, S. & Zhang, L. Towards heart infarction detection via image-based dataset and three-stream fusion framework. Comput. Commun.215, 21–28 (2024). [Google Scholar]
- 3.Bakhshian Nik, A., Hutcheson, J. D. & Aikawa, E. Extracellular vesicles as mediators of cardiovascular calcification. Front. Cardiovasc. Med.4, 78 (2017). [DOI] [PMC free article] [PubMed] [Google Scholar]
- 4.Brown, A. J. et al. Role of biomechanical forces in the natural history of coronary atherosclerosis. Nat. Reviews Cardiol.13 (4), 210–220 (2016). [DOI] [PubMed] [Google Scholar]
- 5.Shah, P. K. Inflammation, infection and atherosclerosis. Trends Cardiovasc. Med.29 (8), 468–472 (2019). [DOI] [PubMed] [Google Scholar]
- 6.Straughan, R., Kadry, K., Parikh, S. A., Edelman, E. R. & Nezami, F. R. Fully automated construction of three-dimensional finite element simulations from optical coherence tomography. Computers in Biology and Medicine, 165, p.107341. (2023). [DOI] [PMC free article] [PubMed]
- 7.Yilmaz, F. & Gundogdu, M. Y. A critical review on blood flow in large arteries; relevance to blood rheology, viscosity models, and physiologic conditions. Korea-Australia Rheology J.20 (4), 197–211 (2008). [Google Scholar]
- 8.Cheng, C. et al. Atherosclerotic lesion size and vulnerability are determined by patterns of fluid shear stress. Circulation. 113 (23), 2744–2753 (2006). [DOI] [PubMed] [Google Scholar]
- 9.Zhou, J. et al. Regulation of vascular smooth muscle cell turnover by endothelial cell-secreted microRNA. Circul. Res.113 (1), 40–51 (2013). [DOI] [PMC free article] [PubMed] [Google Scholar]
- 10.Slager, C. J. et al. The role of shear stress in the generation of rupture-prone vulnerable plaques. Nat. Clin. Pract. Cardiovasc. Med.2 (8), 401–407 (2005). [DOI] [PubMed] [Google Scholar]
- 11.Stone, P. H. et al. Prediction of progression of coronary artery disease and clinical outcomes using vascular profiling of endothelial shear stress and arterial plaque characteristics: the prediction study. Circulation. 126 (2), 172–181 (2012). [DOI] [PubMed] [Google Scholar]
- 12.Samady, H. et al. Coronary artery wall shear stress is associated with progression and transformation of atherosclerotic plaque and arterial remodeling in patients with coronary artery disease. Circulation. 124 (7), 779–788 (2011). [DOI] [PubMed] [Google Scholar]
- 13.Chatzizisis, Y. S. et al. Role of endothelial shear stress in the natural history of coronary atherosclerosis and vascular remodeling: molecular, cellular, and vascular behavior. J. Am. Coll. Cardiol.49 (25), 2379–2393 (2007). [DOI] [PubMed] [Google Scholar]
- 14.Eshtehardi, P. et al. Association of coronary wall shear stress with atherosclerotic plaque burden, composition, and distribution in patients with coronary artery disease. J. Am. Heart Association. 1 (4), e002543 (2012). [DOI] [PMC free article] [PubMed] [Google Scholar]
- 15.Zhang, M. et al. Haemodynamic effects of stent diameter and compaction ratio on flow-diversion treatment of intracranial aneurysms: a numerical study of a successful and an unsuccessful case. J. Biomech.58, 179–186 (2017). [DOI] [PubMed] [Google Scholar]
- 16.Zhang, M., Anzai, H., Chopard, B. & Ohta, M. Towards the patient-specific design of flow diverters made from helix-like wires: an optimization study. Biomed. Eng. Online. 15 (2), 371–382 (2016). [DOI] [PMC free article] [PubMed] [Google Scholar]
- 17.Hoi, Y. et al. Effects of arterial geometry on aneurysm growth: three-dimensional computational fluid dynamics study. J. Neurosurg.101 (4), 676–681 (2004). [DOI] [PubMed] [Google Scholar]
- 18.Qiao, A., Liu, Y., Li, S. & Zhao, H. Numerical simulation of physiological blood flow in 2-way coronary artery bypass grafts. J. Biol. Phys.31 (2), 161–182 (2005). [DOI] [PMC free article] [PubMed] [Google Scholar]
- 19.Fu, Y., Qiao, A., Yang, Y. & Fan, X. Numerical simulation of the effect of pulmonary vascular resistance on the hemodynamics of reoperation after failure of one and a half ventricle repair. Frontiers in Physiology, 11, p.207. (2020). [DOI] [PMC free article] [PubMed]
- 20.Lopes, D., Puga, H., Teixeira, J. C. & Teixeira, S. F. Influence of arterial mechanical properties on carotid blood flow: comparison of CFD and FSI studies. Int. J. Mech. Sci.160, 209–218 (2019). [Google Scholar]
- 21.Karimi, A., Navidbakhsh, M., Razaghi, R. & Haghpanahi, M. A computational fluid-structure interaction model for plaque vulnerability assessment in atherosclerotic human coronary arteries. Journal of Applied Physics, 115(14), p.144702. (2014).
- 22.Rammos, S. et al. A computer model for the prediction of left epicardial coronary blood flow in normal, stenotic and bypassed coronary arteries, by single or sequential grafting. Cardiovasc. Surg.6 (6), 635–648 (1998). [DOI] [PubMed] [Google Scholar]
- 23.Pincombe, B. & Mazumdar, J. The effects of post-stenotic dilatations on the flow of a blood analogue through stenosed coronary arteries. Math. Comput. Model.25 (6), 57–70 (1997). [Google Scholar]
- 24.Siogkas, P. K. et al. Patient-specific simulation of coronary artery pressure measurements: an in vivo three-dimensional validation study in humans. Biomed. Res. Int. (2015). [DOI] [PMC free article] [PubMed]
- 25.Bukač, M., Čanić, S., Tambača, J. & Wang, Y. Fluid–structure interaction between pulsatile blood flow and a curved stented coronary artery on a beating heart: a four stent computational study. Comput. Methods Appl. Mech. Eng.350, 679–700 (2019). [Google Scholar]
- 26.Arefin, M. S. Hemodynamic and structural effects on bypass graft for different levels of stenosis using fluid structure interaction: a prospective analysis. J. Vasc. Nurs.37 (3), 169–187 (2019). [DOI] [PubMed] [Google Scholar]
- 27.Lopes, D., Puga, H., Teixeira, J. & Lima, R. Blood flow simulations in patient-specific geometries of the carotid artery: A systematic review. Journal of Biomechanics, 111, p.110019. (2020). [DOI] [PubMed]
- 28.Carvalho, V. et al. Comparison of CFD and FSI Simulations of Blood Flow in Stenotic Coronary Arteries. In Computational Fluid Dynamics. IntechOpen. (2022).
- 29.Malvè, M., García, A., Ohayon, J. & Martínez, M. A. Unsteady blood flow and mass transfer of a human left coronary artery bifurcation: FSI vs. CFD. Int. Commun. Heat Mass Transfer. 39 (6), 745–751 (2012). [Google Scholar]
- 30.Vikström, A. et al. Establishing the distribution of cerebrovascular resistance using computational fluid dynamics and 4D flow MRI. Sci. Rep.14 (1), 14585 (2024). [DOI] [PMC free article] [PubMed] [Google Scholar]
- 31.Zhuang, B., Wang, S., Zhao, S. & Lu, M. Computed tomography angiography-derived fractional flow reserve (CT-FFR) for the detection of myocardial ischemia with invasive fractional flow reserve as reference: systematic review and meta-analysis. Eur. Radiol.30 (2), 712–725 (2020). [DOI] [PubMed] [Google Scholar]
- 32.Yang, Z., Lian, X., Savari, C. & Barigou, M. Evaluating the effectiveness of CFD-DEM and SPH-DEM for complex pipe flow simulations with and without particles. Chemical Engineering Science, 288, p.119788. (2024).
- 33.Faza, N. N. et al. Physical and computational modeling for transcatheter structural heart interventions. Cardiovasc. Imaging. 17 (4), 428–440 (2024). [DOI] [PubMed] [Google Scholar]
- 34.Otero-Cacho, A. et al. Validation of a new model of noninvasive functional assessment of coronary lesions by computer tomography fractional flow reserve. REC: CardioClinics. 59 (1), 35–45 (2024). [Google Scholar]
- 35.Chen, Y., Xia, R., Yang, K. & Zou, K. MICU: Image super-resolution via multi-level information compensation and U-net. Expert Systems with Applications, 245, p.123111. (2024).
- 36.Chen, Y., Xia, R., Yang, K. & Zou, K. MFMAM: Image inpainting via multi-scale feature module with attention module. Computer Vision and Image Understanding, 238, p.103883. (2024).
- 37.Alghamdi, A. et al. A.A., Detection of myocardial infarction based on novel deep transfer learning methods for urban healthcare in smart cities. Multimedia Tools Appl., pp.1–22. (2024).
- 38.Cao, Y. et al. CMAR: A pipeline for cross-modal alignment and 3D reconstruction of coronary arteries based on key bifurcation vessel measurements. IEEE Transactions on Instrumentation and Measurement. (2024).
- 39.Hamdia, K. M., Marino, M., Zhuang, X., Wriggers, P. & Rabczuk, T. Sensitivity analysis for the mechanics of tendons and ligaments: investigation on the effects of collagen structural properties via a multiscale modeling approach. Int. J. Numer. Methods Biomed. Eng.35 (8), e3209 (2019). [DOI] [PubMed] [Google Scholar]
- 40.Rößle, D. et al. Efficient noninvasive FHB estimation using RGB images from a novel multiyear, multirater dataset. Plant Phenomics, 5, p.0068. (2023). [DOI] [PMC free article] [PubMed]
- 41.Ranjbarzadeh, R. et al. Breast tumor localization and segmentation using machine learning techniques: Overview of datasets, findings, and methods. Computers in Biology and Medicine, 152, p.106443. (2023). [DOI] [PubMed]
- 42.Zhu, M. et al. sEMG-based lower limb motion prediction using CNN-LSTM with improved PCA optimization algorithm. J. Bionic Eng.20 (2), 612–627 (2023). [Google Scholar]
- 43.Yu, H. et al. An intent classification method for questions in Treatise on Febrile diseases based on TinyBERT-CNN fusion model. Computers in Biology and Medicine, 162, p.107075. (2023). [DOI] [PubMed]
- 44.Ahmed, S., Groenli, T. M., Lakhan, A., Chen, Y. & Liang, G. A reinforcement federated learning based strategy for urinary disease dataset processing. Computers in Biology and Medicine, 163, p.107210. (2023). [DOI] [PubMed]
- 45.Jordanski, M., Radovic, M., Milosevic, Z., Filipovic, N. & Obradovic, Z. Machine learning approach for predicting wall shear distribution for abdominal aortic aneurysm and carotid bifurcation models. IEEE J. Biomedical Health Inf.22 (2), 537–544 (2016). [DOI] [PubMed] [Google Scholar]
- 46.Tesche, C. et al. Coronary CT angiography–derived fractional flow reserve: machine learning algorithm versus computational fluid dynamics modeling. Radiology. 288 (1), 64–72 (2018). [DOI] [PubMed] [Google Scholar]
- 47.Wang, Z. Q. et al. Diagnostic accuracy of a deep learning approach to calculate FFR from coronary CT angiography. Journal of Geriatric Cardiology: JGC, 16(1), p.42. (2019). [DOI] [PMC free article] [PubMed]
- 48.Coenen, A. et al. Diagnostic accuracy of a machine-learning approach to coronary computed tomographic angiography–based fractional flow reserve: result from the MACHINE consortium. Circ. Cardiovasc. Imaging. 11 (6), e007217 (2018). [DOI] [PubMed] [Google Scholar]
- 49.Koo, H. J. et al. Impact of coronary calcium score and lesion characteristics on the diagnostic performance of machine-learning-based computed tomography-derived fractional flow reserve. Eur. Heart Journal-Cardiovascular Imaging. 22 (9), 998–1006 (2021). [DOI] [PubMed] [Google Scholar]
- 50.Kaydani, H., Mohebbi, A. & Baghaie, A. Neural fuzzy system development for the prediction of permeability from wireline data based on fuzzy clustering. Pet. Sci. Technol.30 (19), 2036–2045 (2012). [Google Scholar]
- 51.Mohebbi, A., Kamalpour, R., Keyvanloo, K. & Sarrafi, A. The prediction of permeability from well logging data based on reservoir zoning, using artificial neural networks in one of an Iranian heterogeneous oil reservoir. Pet. Sci. Technol.30 (19), 1998–2007 (2012). [Google Scholar]
- 52.Li, G. et al. Pulse-wave-pattern classification with a convolutional neural network. Sci. Rep.9 (1), 1–11 (2019). [DOI] [PMC free article] [PubMed] [Google Scholar]
- 53.Huang, G. B., Lee, H. & Learned-Miller, E. June. Learning hierarchical representations for face verification with convolutional deep belief networks. In 2012 IEEE Conference on Computer Vision and Pattern Recognition (pp. 2518–2525). IEEE. (2012).
- 54.Tao, Y. et al. Image recognition of carbonate fossils and abiotic particles based on deep convolutional neural network mode. (2024). http://researchsquare.com/
- 55.Jha, D. et al. Enhancing materials property prediction by leveraging computational and experimental data using deep transfer learning. Nat. Commun.10 (1), 1–12 (2019). [DOI] [PMC free article] [PubMed] [Google Scholar]
- 56.Varadarajan, A. V. et al. Predicting optical coherence tomography-derived diabetic macular edema grades from fundus photographs using deep learning. Nat. Commun.11 (1), 1–8 (2020). [DOI] [PMC free article] [PubMed] [Google Scholar]
- 57.Sapra, V. et al. Integrated approach using deep neural network and CBR for detecting severity of coronary artery disease. Alex. Eng. J.68, 709–720 (2023). [Google Scholar]
- 58.D’Ancona, G. et al. Deep learning to detect significant coronary artery disease from plain chest radiographs AI4CAD. Int. J. Cardiol.370, 435–441 (2023). [DOI] [PubMed] [Google Scholar]
- 59.Gharleghi, R., Samarasinghe, G., Sowmya, A. & Beier, S. April. Deep learning for time averaged wall shear stress prediction in left main coronary bifurcations. In 2020 IEEE 17th International Symposium on Biomedical Imaging (ISBI) (pp. 1–4). IEEE. (2020).
- 60.Li, G. et al. Prediction of 3D Cardiovascular hemodynamics before and after coronary artery bypass surgery via deep learning. Communications Biology, 4(1), pp.1–12. (2021). [DOI] [PMC free article] [PubMed]
- 61.Suk, J., Haan, P. D., Lippe, P., Brune, C. & Wolterink, J. M. September. Mesh convolutional neural networks for wall shear stress estimation in 3D artery models. In International Workshop on Statistical Atlases and Computational Models of the Heart (pp. 93–102). Springer, Cham. (2021).
- 62.Raissi, M., Yazdani, A. & Karniadakis, G. E. Hidden fluid mechanics: learning velocity and pressure fields from flow visualizations. Science. 367 (6481), 1026–1030 (2020). [DOI] [PMC free article] [PubMed] [Google Scholar]
- 63.Feiger, B. et al. Accelerating massively parallel hemodynamic models of coarctation of the aorta using neural networks. Sci. Rep.10 (1), 1–13 (2020). [DOI] [PMC free article] [PubMed] [Google Scholar]
- 64.Arzani, A., Wang, J. X. & D’Souza, R. M. Uncovering near-wall blood flow from sparse data with physics-informed neural networks. Physics of Fluids, 33(7), p.071905. (2021).
- 65.Chen, Y., Xia, R., Yang, K. & Zou, K. DNNAM: Image inpainting algorithm via deep neural networks and attention mechanism. Applied Soft Computing, 154, p.111392. (2024).
- 66.Gurusubramani, S. & Latha, B. Enhancing Cardiac Diagnostics through semantic-driven Image Synthesis: A Hybrid GAN Approach (Neural Computiong & Application, 2024).
- 67.Showrov, A. A. et al. Generative adversarial networks (GANs) in medical imaging: advancements, applications and challenges. IEEE Access. (2024).
- 68.Ahmadi Golilarz, H., Azadbar, A., Alizadehsani, R. & Gorriz, J. M. GAN-MD:a myocarditis detection using multi‐channel convolutional neural networks and generative adversarial network‐based data augmentation (CAAI Transactions on Intelligence Technology, 2024).
- 69.Saeeda, U. et al. Generative adversarial networks-enabled anomaly detection systems: A survey. http://researchgate.net/
- 70.Carroll, J. D., Chen, S. J. & Chikoore., T. FDA Collaboration., (2020). https://medschool.cuanschutz.edu/cardiology/research/clinical-research/3d-coronary-imaging/fda-collaboration
- 71.Chen, J. & Lu, X. Y. Numerical investigation of the non-newtonian pulsatile blood flow in a bifurcation model with a non-planar branch. J. Biomech.39 (5), 818–832 (2006). [DOI] [PubMed] [Google Scholar]
- 72.Wu, X. et al. Simultaneous evaluation of plaque stability and ischemic potential of coronary lesions in a fluid–structure interaction analysis. Int. J. Cardiovasc. Imaging. 35 (9), 1563–1572 (2019). [DOI] [PubMed] [Google Scholar]
- 73.Boujena, S., El Khatib, N. & Kafi, O. Generalized Navier–Stokes equations with non-standard conditions for blood flow in atherosclerotic artery. Appl. Anal.95 (8), 1645–1670 (2016). [Google Scholar]
- 74.Ansys, I. ANSYS FLUENT theory guide. Canonsburg, Pa 794 (2011).
- 75.Ansys, I. ANSYS®Fluent Theory Guide, Release 2020 R2 (ANSYS, Inc, 2020).
- 76.Han, D. et al. Relationship between endothelial wall shear stress and high‐risk atherosclerotic plaque characteristics for identification of coronary lesions that cause ischemia: a direct comparison with fractional flow reserve. J. Am. Heart Association. 5 (12), e004186 (2016). [DOI] [PMC free article] [PubMed] [Google Scholar]
- 77.Pinto, S. I. S. & Campos, J. B. L. M. Numerical study of wall shear stress-based descriptors in the human left coronary artery. Comput. Methods Biomech. BioMed. Eng.19 (13), 1443–1455 (2016). [DOI] [PubMed] [Google Scholar]
- 78.Rabbi, M. F., Laboni, F. S. & Arafat, M. T. Computational analysis of the coronary artery hemodynamics with different anatomical variations. Informatics in Medicine Unlocked, 19, p.100314. (2020).
- 79.Kamangar, S. et al. Effect of stenosis on hemodynamics in left coronary artery based on patient-specific CT scan. Biomed. Mater. Eng.30 (4), 463–473 (2019). [DOI] [PubMed] [Google Scholar]
- 80.Ferziger, J. H., Perić, M. & Street, R. L. Computational Methods for Fluid Dynamics (Vol3pp. 196–200 (Springer, 2002).
- 81.Gijsen, F. J., van de Vosse, F. N. & Janssen, J. D. The influence of the non-newtonian properties of blood on the flow in large arteries: steady flow in a carotid bifurcation model. J. Biomech.32 (6), 601–608 (1999). [DOI] [PubMed] [Google Scholar]
- 82.Gijsen, F. J. H., Allanic, E., Van De Vosse, F. N. & Janssen, J. D. The influence of the non-newtonian properties of blood on the flow in large arteries: unsteady flow in a 90 curved tube. J. Biomech.32 (7), 705–713 (1999). [DOI] [PubMed] [Google Scholar]
- 83.Markl, M. et al. In vivo wall shear stress distribution in the carotid artery: effect of bifurcation geometry, internal carotid artery stenosis, and recanalization therapy. Circ. Cardiovasc. Imaging. 3 (6), 647–655 (2010). [DOI] [PubMed] [Google Scholar]
- 84.Markl, M., Frydrychowicz, A., Kozerke, S., Hope, M. & Wieben, O. 4D flow MRI. J. Magn. Reson. Imaging. 36 (5), 1015–1036 (2012). [DOI] [PubMed] [Google Scholar]
- 85.Morbiducci, U. et al. Atherosclerosis at arterial bifurcations: evidence for the role of haemodynamics and geometry. Thromb. Haemost.115 (03), 484–492 (2016). [DOI] [PubMed] [Google Scholar]
- 86.Andreini, D. et al. Coronary plaque features on CTA can identify patients at increased risk of cardiovascular events. JACC: Cardiovasc. Imaging. 13 (8), 1704–1717 (2020). [DOI] [PubMed] [Google Scholar]
- 87.Gnasso, A. et al. In vivo association between low wall shear stress and plaque in subjects with asymmetrical carotid atherosclerosis. Stroke. 28 (5), 993–998 (1997). [DOI] [PubMed] [Google Scholar]
- 88.Cecchi, E. et al. Role of hemodynamic shear stress in cardiovascular disease. Atherosclerosis. 214 (2), 249–256 (2011). [DOI] [PubMed] [Google Scholar]
- 89.Pyke, K. E. & Tschakovsky, M. E. The relationship between shear stress and flow-mediated dilatation: implications for the assessment of endothelial function. J. Physiol.568 (2), 357–369 (2005). [DOI] [PMC free article] [PubMed] [Google Scholar]
- 90.Weber-Mzell, D., Kotanko, P., Schumacher, M., Klein, W. & Skrabal, F. Coronary anatomy predicts presence or absence of renal artery stenosis. A prospective study in patients undergoing cardiac catheterization for suspected coronary artery disease. Eur. Heart J.23 (21), 1684–1691 (2002). [DOI] [PubMed] [Google Scholar]
- 91.Sianos, G. et al. The SYNTAX score: an angiographic tool grading the complexity of coronary artery disease. EuroIntervention. 1 (2), 219–227 (2005). [PubMed] [Google Scholar]
- 92.Hao, X., Zhang, G. & Ma, S. Deep learning. Int. J. Semantic Comput.10 (03), 417–439 (2016). [Google Scholar]
- 93.Brownlee, J. How To Improve Deep Learning Performance (/Deep Learning Performance, 2019). https://machinelearningmastery.com/improve-deep-learning-performance
- 94.Goodfellow, I. et al. Generative adversarial nets. Adv. Neural. Inf. Process. Syst., 27. (2014).
- 95.Goodfellow, I. Nips 2016 tutorial: Generative adversarial networks. arXiv preprint arXiv:1701.00160. (2016).
- 96.Isola, P., Zhu, J. Y., Zhou, T. & Efros, A. A. Image-to-image translation with conditional adversarial networks. In Proceedings of the IEEE Conference on Computer Vision and Pattern Recognition (pp. 1125–1134). (2017).
- 97.Ledig, C. et al. Photo-realistic single image super-resolution using a generative adversarial network. In Proceedings of the IEEE Conference on Computer Vision and Pattern Recognition (pp. 4681–4690). (2017).
- 98.Guo, J., Qian, Z., Zhou, Z. & Liu, Y. Mulgan: Facial attribute editing by exemplar. arXiv preprint arXiv:1912.12396. (2019).
- 99.Chrysos, G. G., Kossaifi, J. & Zafeiriou, S. Robust conditional generative adversarial networks. arXiv preprint arXiv:1805.08657. (2018).
- 100.Kingma, D. P. & Ba, J. Adam: A method for stochastic optimization. arXiv preprint arXiv:1412.6980. (2014).
- 101.Upton, G. & Cook, I. A Dictionary of Statistics 3e (Oxford University Press, 2014).
- 102.Badr, B. E., Altawil, I., Almomani, M., Al-Saadi, M. & Alkhurainej, M. Fault diagnosis of three-phase induction motors using convolutional neural networks. Math. Modelling Eng. Probl., 10(5). (2023).
- 103.Zhang, W., Tanida, J., Itoh, K. & Ichioka, Y. August. Shift-invariant pattern recognition neural network and its optical architecture. In Proceedings of Annual Conference of the Japan Society of Applied Physics (pp. 2147–2151). (1988).
- 104.Collobert, R. & Weston, J. July. A unified architecture for natural language processing: Deep neural networks with multitask learning. In Proceedings of the 25th International Conference on Machine Learning (pp. 160–167). (2008).
- 105.Tsantekidis, A. et al. July. Forecasting stock prices from the limit order book using convolutional neural networks. In 2017 IEEE 19th Conference on Business Informatics (CBI) (Vol. 1, pp. 7–12). IEEE. (2017).
- 106.Kosko, B. & Mitaim, S. Stochastic resonance in noisy threshold neurons. Neural Netw.16 (5–6), 755–761 (2003). [DOI] [PubMed] [Google Scholar]
- 107.Stehman, S. V. Selecting and interpreting measures of thematic classification accuracy. Remote Sens. Environ.62 (1), 77–89 (1997). [Google Scholar]
Associated Data
This section collects any data citations, data availability statements, or supplementary materials included in this article.
Data Availability Statement
The authors declare that the data supporting the findings of this study are available within the paper. Should any raw data files be needed in another format they are available from the corresponding author upon reasonable request.


