Abstract
The adult human breast is comprised of an intricate network of epithelial ducts and lobules that are embedded in connective and adipose tissue1–3. Although most previous studies have focused on the breast epithelial system4–6, many of the non-epithelial cell types remain understudied. Here we constructed the comprehensive Human Breast Cell Atlas (HBCA) at single-cell and spatial resolution. Our single-cell transcriptomics study profiled 714,331 cells from 126 women, and 117,346 nuclei from 20 women, identifying 12 major cell types and 58 biological cell states. These data reveal abundant perivascular, endothelial and immune cell populations, and highly diverse luminal epithelial cell states. Spatial mapping using four different technologies revealed an unexpectedly rich ecosystem of tissue-resident immune cells, as well as distinct molecular differences between ductal and lobular regions. Collectively, these data provide a reference of the adult normal breast tissue for studying mammary biology and diseases such as breast cancer.
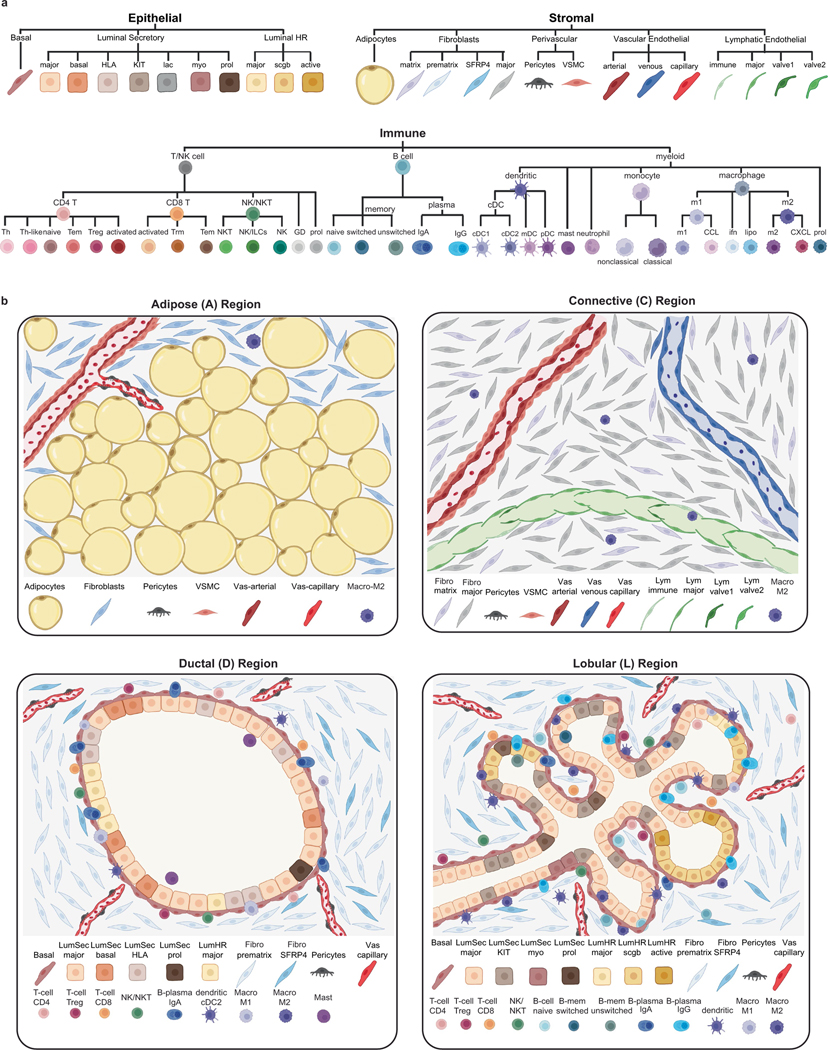
The human breast is an apocrine organ that has an important physiological role in producing milk to nourish an infant after birth1. This glandular function is mediated by highly branched lobular units that produce milk, which is transported through the ductal network. The mammary epithelial system is embedded into an adipose-rich tissue and surrounded by a dense web of vasculature and lymphatic vessels (Fig. 1a). Human breast tissue is composed of four major spatial regions: (1) terminal ductal lobular units (TDLUs) and lobules of densely packed, branched epithelium; (2) tubular ducts of mostly bilayered epithelium; (3) extracellular matrix (ECM)-rich connective tissue; and (4) adipose-rich regions (Fig. 1a). These areas consist of their own cellular neighbourhoods that have previously been described in histopathological studies1,3,7. However, a comprehensive and systematic unbiased map of their cellular expression programmes and spatial organizations is lacking.
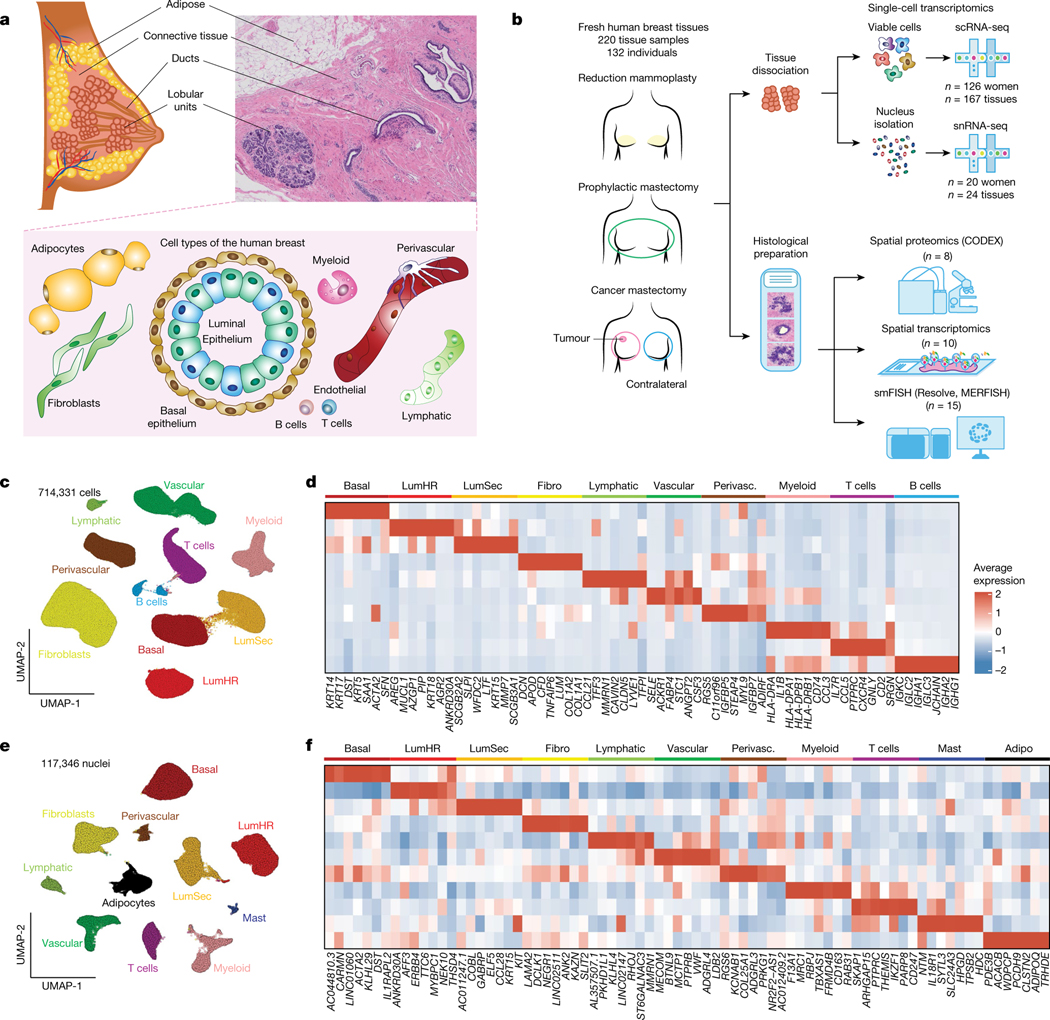
Fig. 1 |. Major cell types of the adult human breast.
a, Anatomy of the adult human breast and a pathological haematoxylin and eosin (H&E) section, with illustrations of the major breast cell types. b, The workflow of the HBCA project. c, Uniform manifold approximation and projection (UMAP) projection of scRNA-seq data from 714,331 cells integrated across 167 tissues from 126 women, showing 10 clusters that correspond to the major cell types. d, Consensus heat map of the top 7 genes expressed in each cell type cluster from averaged scRNA-seq data. e, UMAP representation of snRNA-seq data from 117,346 nuclei integrated across 24 tissues from 20 women, showing 11 cell type clusters. f, Consensus heat map of the top 7 genes expressed in each cell cluster from averaged snRNA-seq data. Adipo., adipocytes; perivasc., perivascular cells.
Previous studies have mainly focused on the epithelial cells, which comprise the inner layer of luminal cells and the outer layer of basal-myoepithelial cells within the ducts and lobules4–6 (Fig. 1a). The focus on epithelium is mainly due to its implication in breast cancer8,9, mammary stem cell and progenitor functions10,11 and its changes during menstruation, pregnancy and lactation12,13. Previous studies using single-cell RNA sequencing (scRNA-seq) have identified three mammary epithelial cell types, laying the groundwork for this study4,6,14–16. Increasing evidence suggests that the microenvironment contains numerous stromal cells that actively crosstalk with the epithelial cells17–20. However, the intense focus on epithelial cells has left a major gap in knowledge concerning the non-epithelial cell types. The goal of the HBCA is to create a comprehensive atlas of all cell types and cell states in normal breast tissues using unbiased single-cell and spatial genomic methods, and is part of the larger Human Cell Atlas (HCA) project21.
Major cell types in adult human breast
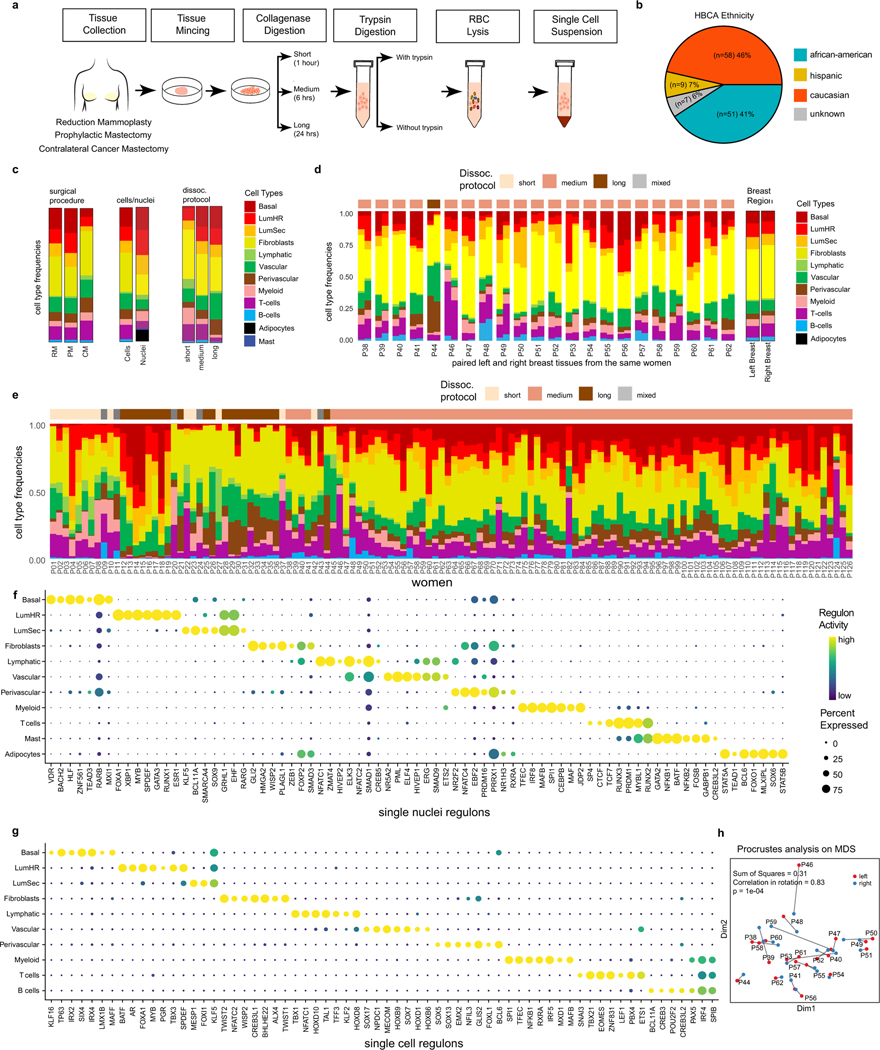
In total, the HBCA project collected 220 fresh breast tissue samples from 132 women, of which a subset was used for single-cell and spatial genomic profiling (Fig. 1b). To identify the breast major cell types, we performed unbiased 3′ scRNA-seq (10x Genomics) analysis of 167 tissue samples collected from 126 women (Fig. 1b and Supplementary Table 1). Fresh breast tissue samples were obtained from disease-free women through reduction mammoplasties (n = 111) and prophylactic bilateral mastectomies (n = 18), as well as from patients with breast cancer using the contralateral mastectomies (n = 38) from the unaffected breast. The fresh tissue samples were collected at the four institutions within 1–2 h after surgery to generate viable cell suspensions from large (50–100 g) tissue samples (Methods). The tissues were dissociated using three protocols (short, ~1 h; medium, ~6 h; long, ~24 h) that differed mainly in their enzymatic dissociation times (Methods and Extended Data Fig. 1a). The women enrolled in this study were predominantly of Caucasian (46%) and African American (41%) ethnicity, but also included other (13%) ethnic backgrounds (Extended Data Fig. 1b and Supplementary Table 1).
We sequenced an average number of 9,954 cells per sample at 46,000 average reads per cell (Supplementary Table 2). After filtering, scRNA-seq data from 714,331 cells was integrated revealing 10 major cell type clusters (Fig. 1c and Methods). These cell types included three epithelial components: luminal hormone-responsive (LumHR), luminal secretory (LumSec) and basal-myoepithelial (basal); two endothelial (lymphatic and vascular); three immune (T cells, B cells and myeloid cells) and two mesenchymal cell types (fibroblasts (fibro) and perivascular cells). Although the frequency of the cell types varied across women, all of the cell types were detected in most women, irrespective of the surgical procedure, anatomical region and dissociation protocol (Extended Data Fig. 1c–e). Many cell types identified were consistent with histopathological1,7 and molecular studies14,15; however, the detection of a high number of perivascular cells (7.4% total cells) and immune cells (16.7% total cells) was unexpected. Many of the top expressed genes represented canonical cell type markers; however, more than half have not previously been reported widely, providing a valuable resource for future studies (Fig. 1d and Supplementary Table 3).
Notably, the scRNA-seq data did not identify any adipocytes, which represent a major component on the basis of histopathological data7,22. This issue was mainly due to the large cell size of adipocytes (>50 μm), preventing their encapsulation on the scRNA-seq microdroplet platform23. To identify adipocytes, we performed single-nucleus RNA-seq (snRNA-seq) analysis of 117,346 cells from 20 women using 24 tissue samples (Fig. 1e). Our snRNA-seq analysis detected most major cell types identified by scRNA-seq (except for B cells) and also included clusters of adipocytes and mast cells (Fig. 1e). Many of the top cell type marker genes in the snRNA-seq data differed from the scRNA-seq data, possibly reflecting biological differences in the cytoplasmic and nuclear RNA pools (Fig. 1f and Supplementary Tables 3 and 4). To identify transcription factors of cell types, we performed regulatory network analysis24 using both scRNA-seq and snRNA-seq datasets (Extended Data Fig. 1f,g). These data identified many known25 and previously undescribed transcription factors that regulate breast cell type identities.
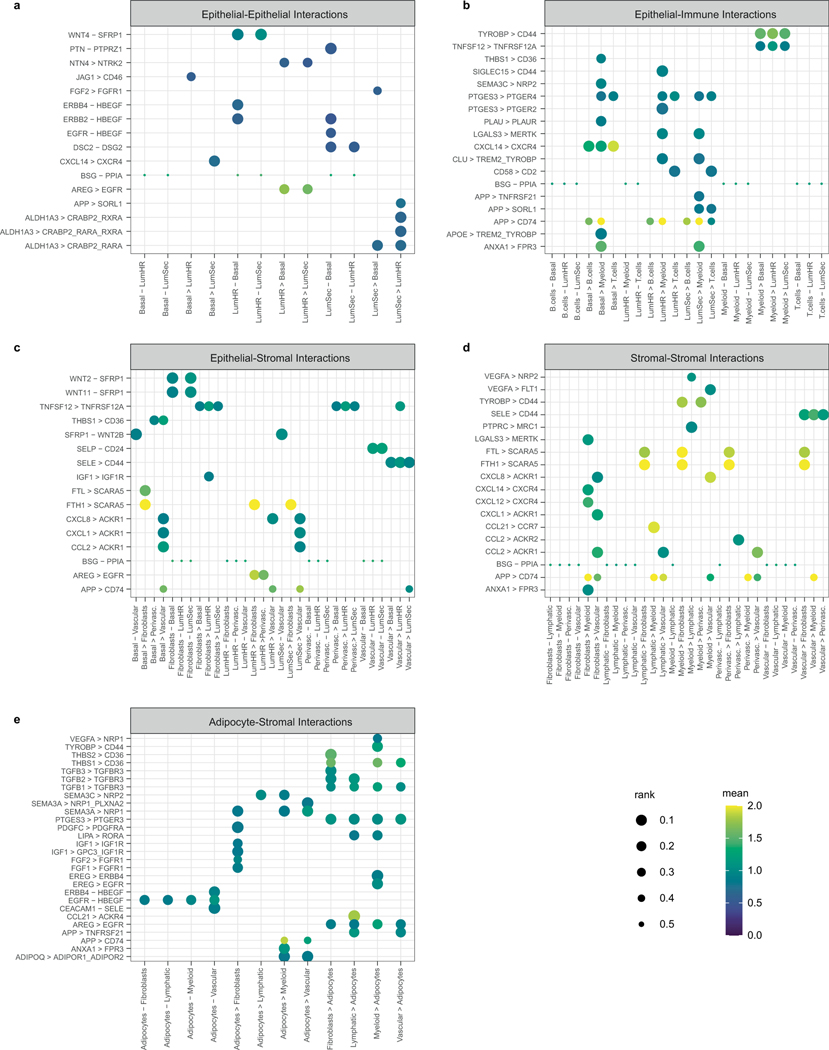
One potential concern was that sampling different spatial areas could potentially lead to differences in cell type compositions. To investigate this issue, we compared the cell type frequencies from matched (left–right) breasts from 22 women, which showed high concordance based on Procrustes analysis (R = 0.83, P = 1.5 × 10⁻⁶; Methods and Extended Data Fig. 1d,h). We also compared cell type frequencies across the three main surgical procedures, which showed only minor differences (Extended Data Fig. 1c). Finally, we performed a cell–cell interaction analysis, which showed substantial crosstalk between the major breast cell types through ligand–receptor interactions (Methods and Extended Data Fig. 2). Collectively, these data identified 12 major cell types in adult mammary breast tissues.
Spatial mapping of cell neighbourhoods
By histopathology, the human breast tissue can be divided into four major topographic regions: adipose tissue, connective tissue and epithelial-rich regions, which are further subclassified into TDLUs, referred to here as lobules and ductal regions3,7 (Fig. 1a). We used three orthogonal technologies to investigate the spatial organization of cell types in situ, including unbiased spatial transcriptomics (ST, 10x Genomics)26, targeted single-molecule RNA fluorescence in situ hybridization (smFISH) (Resolve Biosciences) and co-detection by indexing (CODEX, Akoya Biosciences) for proteomic analysis27 (Fig. 1b).
ST was performed on ten patients and the data were integrated, revealing nine major clusters (Fig. 2a–c, Extended Data Fig. 3a,b and Supplementary Table 5). Although each ST spot is large (55 μm), a direct comparison to the scRNA-seq clusters showed that most ST clusters corresponded to a single prevalent breast cell type (Extended Data Fig. 3c). Importantly, ST-clustered differential genes showed a high concordance (mean r = 0.8, Pearson correlation) with the cell type marker genes defined by scRNA-seq, validating many of the markers in situ (Fig. 2b, Methods and Extended Data Fig. 3d). The frequency of the ST clusters corresponded to the four different tissue areas that were annotated by histopathology. The adipose region had a high proportion of ST1-adipocytes, whereas the connective region had elevated ST3-fibroblasts and ST9-vascular cell clusters. Furthermore, the ductal region contained higher proportions of the ST6-LumSec/basal cells, while the lobular region contained a higher proportion of the ST4-LumHR and ST5-LumSec cells (Fig. 2c).
Fig. 2 |. Spatial analysis of major breast cell types.
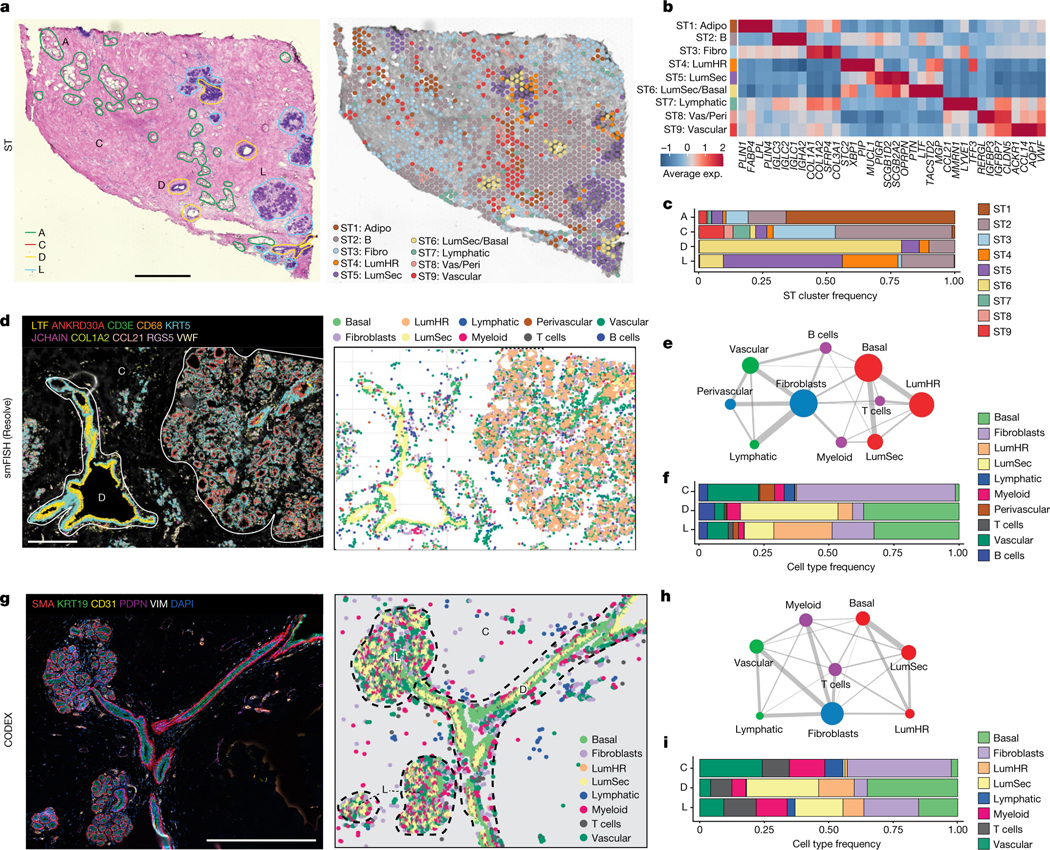
a, ST experiment from patient P35 showing the H&E image with histopathological regions annotated (left) and clustering results (right). A, adipose tissue; C, connective tissue; D, ductal tissue; L, lobule. b, Consensus heat map of the top four marker genes in each ST cluster from ten integrated tissue samples. Exp., expression. c, The frequencies of the ST clusters from ten tissue samples across the four topographic tissue regions. d, smFISH experiments (Resolve) using a custom 100-gene panel, showing a subset of 10 genes that mark different cell types in sample 1 of P46 (P46-S1) (left) and cell segmentation using combinations of markers to identify cell types, with topographic areas annotated (right). e, Spatial colocalization graph of the cell types in smFISH (Resolve) data from 12 tissue samples. The node size represents the cell number and the edge width represents the probability of colocalization. f, Cell type frequencies across 3 topographic regions from 12 smFISH (Resolve) tissue samples. g, CODEX data from P130 showing ductal–lobular structure with five protein markers (left) and cell segmentation using combinations of markers to identify cell types, with topographic areas annotated (right). h, Spatial colocalization graph of the cell types in the CODEX data from eight tissue samples. The node size represents the cell number and the edge width represents the probability of colocalization. i, Cell type frequencies across three topographic regions from eight CODEX tissue samples. Scale bars, 1 mm (a) and 500 μm (d and g).
As ST spots contain mixtures of cells, we applied smFISH (Resolve) using a custom 100-gene panel based on the top marker genes from the scRNA-seq data (Methods and Supplementary Table 6). The smFISH analysis of 12 breast tissues from 5 women validated many top marker genes in situ (Fig. 2d–f, Extended Data Fig. 4a–c and Supplementary Table 7). We performed cell segmentation and cell type annotation using combinations of the top gene markers (Fig. 2d, Methods and Extended Data Fig. 4a). We computed a cell neighbourhood proximity graph, which showed that the three epithelial cell types co-localized with B cells and T cells, whereas fibroblasts co-localized with vascular and lymphatic cells (Fig. 2e and Methods). We quantified the cell type frequencies in three major tissue regions, showing that the connective region was composed mainly of fibroblasts and vascular endothelial cells, whereas the ductal region comprised mainly basal cells and high levels of LumSec cells, and the lobular region was composed of basal cells as well as high levels of LumHR cells (Fig. 2f and Extended Data Fig. 4a). The smFISH data also showed that the overall cell density was low in the connective regions and high in the ductal and lobular regions (Extended Data Fig. 4b).
We further investigated the spatial distribution of breast cell types in 8 women at the protein level using CODEX with a 34-antibody panel, which resolved 8 major cell types (Supplementary Tables 8 and 9). One advantage of CODEX is that large tissue areas (approximately 1 cm2) can be imaged (Fig. 2g and Extended Data Fig. 4d–f). To perform a quantitative analysis, we performed cell segmentation and unsupervised clustering, followed by label transfer from the scRNA-seq data (Fig. 2g and Methods). This analysis showed that most cell types were consistent between the eight tissue samples in the CODEX data (Extended Data Fig. 4d). Consistent with the smFISH data, the proteomic data showed that connective tissue areas have low cell density, ductal regions have intermediate densities and lobular regions have high cell density (Extended Data Fig. 4e). We performed a cell proximity analysis, which was consistent with the smFISH data (Fig. 2h). Overall, these data were used to define the cellular composition of the topographic regions at the protein level and were consistent with the smFISH data (Fig. 2i).
Epithelial cells in ducts and lobules
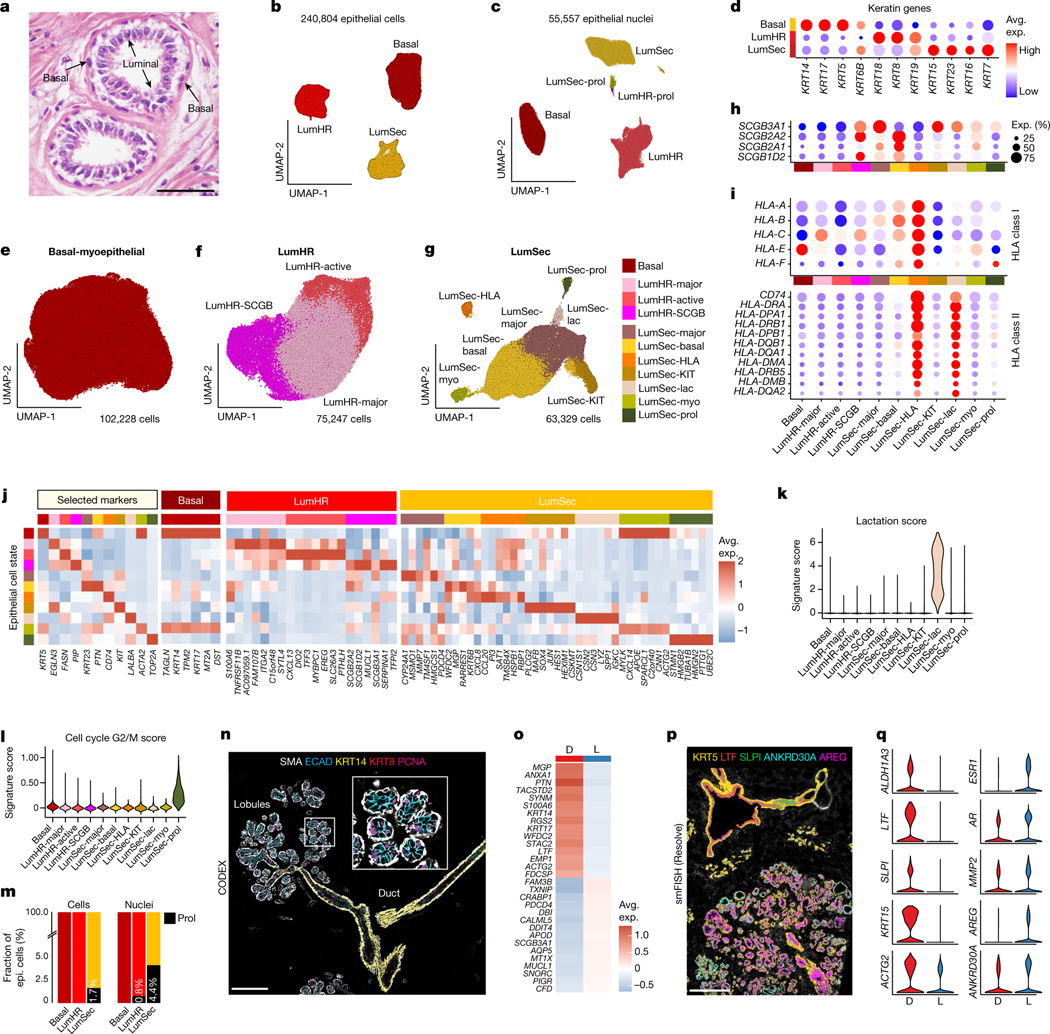
On the basis of histopathology, the bilayered breast epithelium consists of an outer layer of basal-myoepithelial cells (basal) and an inner layer of luminal cells1,2 (Fig. 3a). Unbiased clustering of 240,804 epithelial cells and 55,557 epithelial nuclei (33.7% of cells, 50.5% of nuclei) identified three major epithelial cell types: Basal, LumSec and LumHR, consistent with previous studies4,6,14,15 (Fig. 3b,c). As expected, nuclear expression of the hormone receptors (ESR1, AR and PGR) was specific to the LumHR cells (Extended Data Fig. 5a). We performed an unbiased analysis of cytokeratin gene expression, which revealed Basal LumSec- and LumHR-specific cytokeratins (Fig. 3d).
Fig. 3 |. Epithelial cells of the human breast.
a, H&E section of breast tissue showing the epithelial bilayer of two ducts. b, UMAP representation of scRNA-seq data from 240,804 epithelial cells, showing three major epithelial types. c, UMAP representation of snRNA-seq data from 55,557 epithelial nuclei, showing three major epithelial types and two proliferating clusters. d, The keratin genes expressed across the three major epithelial cell types. e, UMAP representation of 102,228 basal epithelial cells. f, UMAP representation of 75,247 LumHR epithelial cells showing 3 cell states. g, UMAP representation of 63,329 LumSec epithelial cells showing 7 cell states. h, Expression of secretoglobin genes across the epithelial cell states. i, Expression of HLA class I and HLA class II genes for the epithelial cell states. j, The top genes expressed for each epithelial cell state averaged across the scRNA-seq data. k, Lactation gene signature scores for the epithelial cell states. l, G2/M cell cycle scores across different epithelial cell states. m, The fraction of proliferating epithelial cells in the scRNA-seq and snRNA-seq data. n, CODEX data from patient P130 showing proliferating cells in ducts and lobules labelled with PCNA. o, The top ST differentially expressed genes between ducts versus lobules from ten integrated tissue samples. Avg., average. p, smFISH (Resolve) data from patient P46 showing genes that are expressed specifically in ductal and lobular regions. q, smFISH (Resolve) data in the ducts and lobules. Scale bars, 100 μm (a), 200 μm (n) and 500 μm (p).
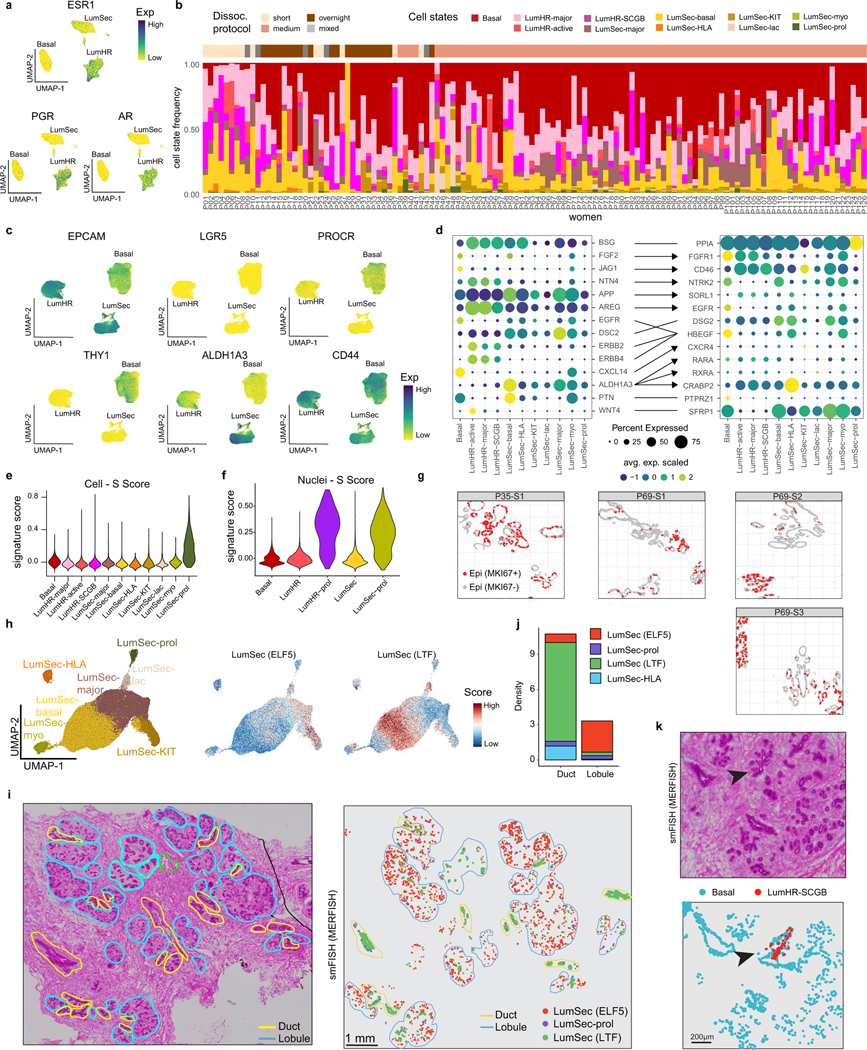
To resolve epithelial diversity, we performed subclustering for each epithelial cell type independently, showing cell states that varied across women (Fig. 3e–j and Extended Data Fig. 5b). The basal cells were highly homogenous, expressing ACTA2 and TP63, as well as low levels of EPCAM, consistent with their role in basement membrane production and myoepithelial functions (Fig. 3j and Extended Data Fig. 5c). Within the LumHR cells, three distinct cell states were identified. LumHR-major was characterized by high EGLN3 expression, whereas LumHR-SCGB showed high expression of secretory genes, including MUCL1, prolactin-inducible protein (PIP) and secretoglobins. The LumHR-active cluster had abundant FASN28 and EREG29 expression, which are both associated with hormone-dependent proliferation (Fig. 3j).
LumSec cells displayed the largest degree of diversity, with seven distinct cell states (Fig. 3g,j). The LumSec-major state was marked by MMP7 expression (Fig. 3j). LumSec-HLA expressed genes encoding MHC class I and MHC class II molecules, as well as the chemokine CCL20, suggesting a role in immune cell signalling (Fig. 3i,j). LumSec-lac was marked by genes encoding caseins (CSN2 and CSN1S1) and showed a high lactation signature16 score (Fig. 3k). The LumSec-prol state was characterized by cell-cycle-related genes and showed an elevated G2/M score (Fig. 3l). The LumSec-KIT state showed elevated expression of KIT, as well as transcription factors including SOX4, HES1 and MAFB (Fig. 3j). We also detected two cell states with basal-luminal intermediate features: LumSec-basal, which expressed both luminal and basal markers (for example, KRT5, KRT14) as reported previously15, and LumSec-myo, which expressed genes related to myo-contractile functions such as MYLK (Fig. 3j). Together, 11 epithelial cell states were identified and our analysis of cell–cell interactions suggested an active crosstalk between these epithelial cell states (Extended Data Fig. 5d).
Previous studies have reported stem and progenitor populations within both the basal and luminal compartments11,14–16. Here we found that cell proliferation (as an indicator of active amplifying progenitor function) was restricted to the two luminal compartments, whereas basal cell proliferation was not detected. These data are consistent with previous research studying telomere length in basal and luminal cells30. Small percentages of proliferating cells were identified in the scRNA-seq and snRNA-seq data within the LumSec (1.7% of cells, 4.4% of nuclei) and LumHR (0.8% of nuclei) clusters (Fig. 3c,m). Consistent with S-phase activity, high levels of PCNA protein expression was detected in luminal cells (Fig. 3n), along with elevated S-phase signature scoring within the LumSec-prol and LumHR-prol clusters in the scRNA-seq and snRNA-seq data (Extended Data Fig. 5e,f). Luminal cell proliferation occurred in both the ductal and lobular regions, as revealed by in situ PCNA staining (CODEX) and MKI67 transcript detection using smFISH (Fig. 3n and Extended Data Fig. 5g). We investigated our dataset for several previously reported stem and progenitor cell markers, including LGR5, PROCR, ALDH1A3, THY1 and CD4411,14–16, which showed only diffuse expression across the majority of cells in the epithelial clusters (Extended Data Fig. 5c).
To resolve the spatial distribution of the epithelial cell states, we applied MERFISH (MERSCOPE, Vizgen) using a custom panel of 266 genes (Extended Data Fig. 5h–k and Supplementary Tables 11 and 12). Although many epithelial cell states did not have specific ductal–lobular localization (for example, LumSec-prol), other cell states, including LumSec-basal (marked by LTF) and LumSec-HLA (AQP3, CCL20 and RBP1), mainly localized to the ducts, while LumSec-KIT and LumSec-major (ELF5) were predominantly localized to the lobules (Extended Data Fig. 5h–j). Moreover, the LumHR-SCGB cell state (SERPINA1 and TFPI2) was found in discrete clusters in the lobular regions (Extended Data Fig. 5k).
We further compared ductal and lobular regions using additional spatial technologies (Fig. 3o–q and Extended Data Fig. 6). Using ST, we found that ductal regions were associated with LumSec-related genes (for example, KRT17, LTF and KRT23), whereas lobular regions showed increased expression of LumHR-specific genes (such as MUCL1 and DBI) (Fig. 3o and Extended Data Fig. 6a). Similarly, smFISH analysis revealed that ductal regions with increased expression of LumSec-related genes (such as LTF, SLPI and KRT15), whereas lobular regions were enriched for LumHR-associated genes (ANKRD30A, AR, ESR1 and PGR) (Fig. 3p,q and Extended Data Fig. 6b). Using CODEX, we found elevated levels of KRT5 and KRT19 in ducts versus lobules (Extended Data Fig. 6c). We found KRT5/KRT19 double-positive cells that are enriched in ductal structures and probably represent the cell state defined as LumSec-basal in our scRNA-seq data and other studies15. Previous studies referred to the two luminal cell types (LumHR and LumSec) as alveolar and ductal15,17; however, our analysis indicates that, although the abundance of LumHR and LumSec cells differs between ducts and lobules, both cell types exist within ducts and alveolar structures of lobules (Fig. 2c,f,i and Extended Data Fig. 6b–e).
Immune ecosystem of the normal breast
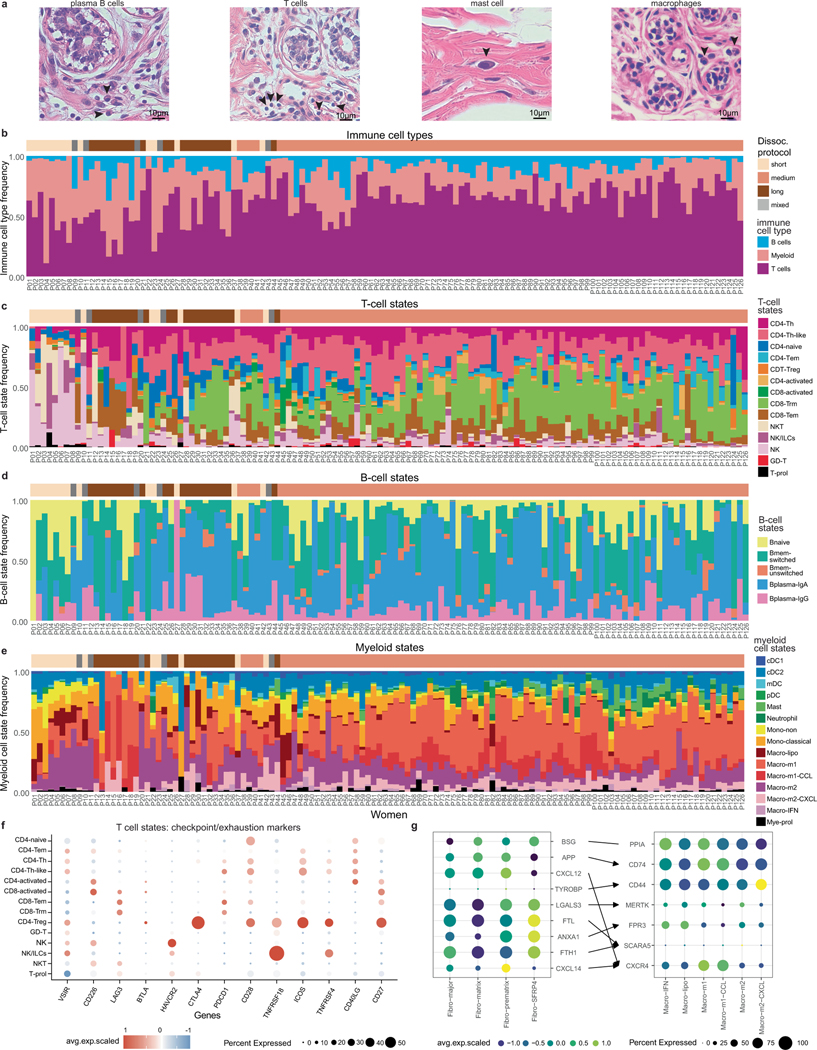
On the basis of histopathology, immune cells in the breast tissue including plasma B cells, T cells, mast cells and macrophages can be identified (Extended Data Fig. 7a). The scRNA-seq dataset of 119,866 cells from 126 women and 16,339 nuclei from 20 women showed that immune cells were organized into three major populations (myeloid, natural killer (NK), T and B cells) and were unexpectedly abundant (16.7% of total cells, 13.9% of total nuclei) in tissues from all three different breast surgical procedures (Fig. 4a,b and Extended Data Fig. 7b–e). The abundance of immune cells was validated in situ using CODEX and smFISH (Fig. 4c–e). To investigate immune cell diversity, we clustered cells within the myeloid, NK, T and B cell clusters and annotated them using both unbiased and canonical immune marker genes31–33 (Fig. 4f–k).
Fig. 4 |. Immune cell ecosystem in human breast tissues.
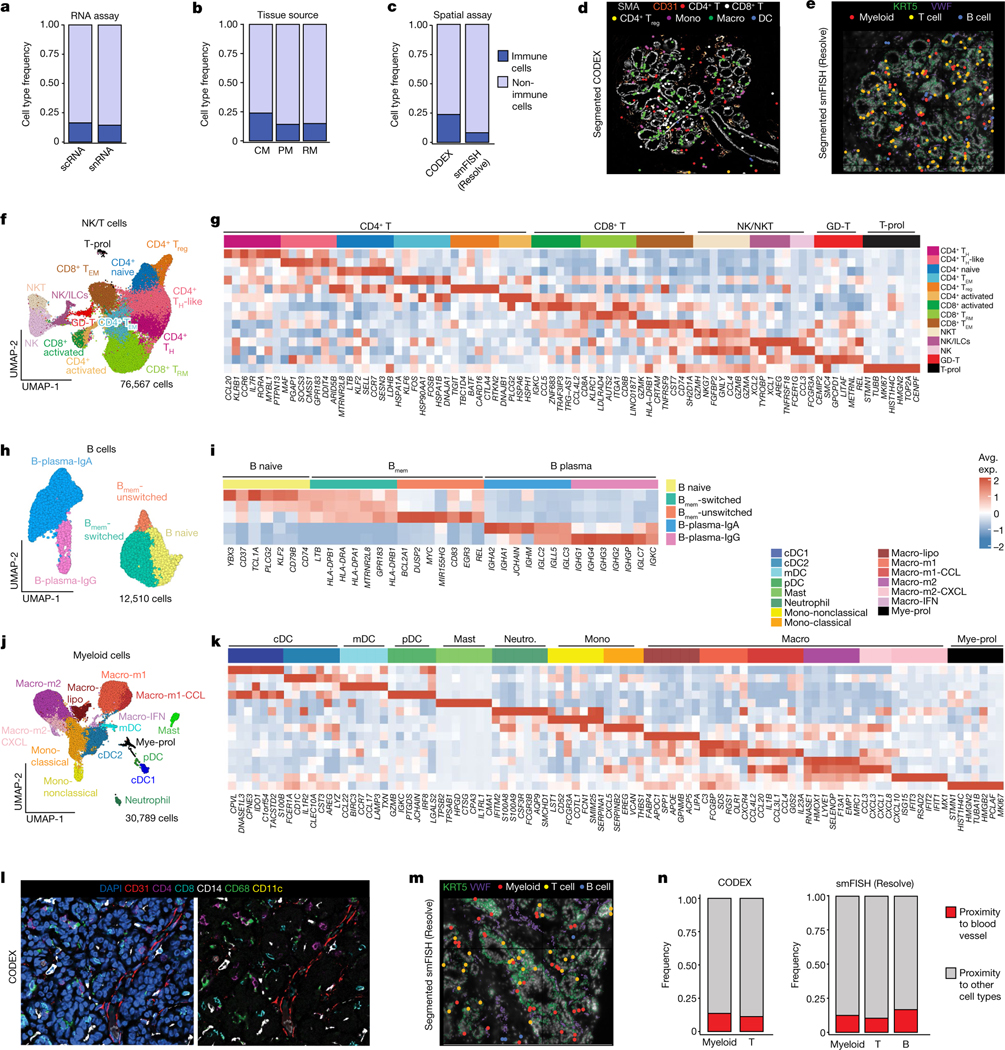
a, Immune and non-immune cell type frequencies in the scRNA-seq and snRNA-seq data. b, Immune and non-immune cell type frequencies by tissue source in the scRNA-seq data. CM, contralateral mastectomies; PM, prophylactic mastectomies; RM, reduction mammoplasties. c, Immune cell type frequencies in the CODEX (n = 8) and smFISH (Resolve) (n = 12) data. d, CODEX data from patient P130 showing a TDLU region with localization of six immune cell types/states. Segmented cells are shown as coloured dots over immunofluorescence staining of SMA (myoepithelial) and CD31 (vessel) for spatial reference. e, smFISH (Resolve) data (P46-S1) showing a TDLU region with localization of three immune cell types. Segmented cells are shown as coloured dots over immunofluorescence staining of KRT5 (basal epithelial) and VWF (endothelial) for spatial reference. f, UMAP representation of 76,567 NK and T cells from scRNA-seq data showing 14 cell states. g, The top genes expressed for each NK and T cell cluster using average values across single cells. h, UMAP representation of 12,510 B cells from scRNA-seq data showing five cell states. Bmem, memory B. i, The top genes expressed for each B cell state using average values across single cells. j, UMAP representation of 30,789 myeloid cells from scRNA-seq data showing of 15 cell types and states. k, The top genes expressed for each myeloid cell cluster using averaged scRNA-seq values. l, CODEX data from patient P130 showing localization of immune cells and a vascular marker (CD31). m, smFISH (Resolve) segmented data (P46-S1) showing localization of immune cells and a vascular marker (VWF). n, The frequency of immune cells that are in the proximity of vascular endothelial cells versus other cell types as determined by neighbourhood analysis of the CODEX and smFISH (Resolve) data.
Within the NK and T cells, the scRNA-seq dataset of 76,567 cells identified 14 subsets (Fig. 4f,g and Supplementary Table 10). The CD4+ T cells included naive T cells (SELL), T helper (TH) and TH-like (IL7R, CCR6, CCL20), T effector memory (TEM) (LMNA) and T regulatory (Treg) (FOXP3, CTLA4) cells. Two populations of CD8+ T cells were identified, T resident memory (TRM; ITGA1) and TEM (GZMK). We detected clusters of activated CD4+ and CD8+ T cells that displayed upregulation of genes associated with TCR engagement (PLCG2, ZNF683). We also observed a cluster of γδ T cells (TRDC, TRGC2). Our subclustering further resolved populations of NK (GNLY), NKT (GNLY, CD3D) and innate lymphoid cells (ILCs; IL7R). A small proliferating cluster (MKI67) that contained cells from many NK and T cell subsets was also detected. The T cells displayed low levels of checkpoint and exhaustion markers34, which is consistent with a homeostatic, rather than disease phenotype (Extended Data Fig. 7f). Clustering of the 12,510 B cells from the scRNA-seq dataset showed three main subpopulations, including memory, plasma and naive (Fig. 4h,i and Supplementary Table 10). Among the memory B cells, both switched (MYC) and unswitched (no MYC expression) cells were identified. We also identified two populations of plasma B cells (IgG or IgA).
Within the myeloid cells, the scRNA-seq data of 30,789 cells resolved distinct subsets of dendritic cells (DCs), monocytes, macrophages and mast cells (Fig. 4j,k and Supplementary Table 10). Four subpopulations of DCs were identified, including mature (mDC) (LAMP3), plasmacytoid (pDC) (LILRA4) and two conventional cell states (cDC1 (CLEC9A) and cDC2 (CLEC10A)). Among the macrophages, we detected classical (macro-m1) (IL1B) and alternatively (macro-m2) (MRC1) activated subsets, which further subclustered by chemokines (macro-m1-CCL and macro-m2-CXCL). Macrophages also included a population expressing interferon response genes (macro-IFN) (IFIT1, IFIT2) and a lipid-associated macrophage subcluster (macro-lipo) (APOC, LIPA, LPL). We identified populations of classical (EREG) and non-classical (FCGR3A) monocytes, as well as mast cells (TPSAB1). This analysis also identified a heterogenous cluster of proliferating myeloid cells (Mye-prol; MKI67). Although the NK, T, B and myeloid cell states showed variable frequencies, they were consistently identified across the 126 women, suggesting a role in normal breast homeostasis (Extended Data Fig. 7b–e).
The spatial organization of seven immune cell types (monocytes, macrophages, CD4+ T, CD8+ T, CD4+ Treg, DCs and B cells) was resolved using a total of 18 markers on the smFISH (Resolve) platform and 8 markers on the CODEX platform (Supplementary Tables 6 and 9, respectively). These analyses showed that all seven immune cell types were present in three major tissue regions (connective, ductal, lobular), excluding adipose, which could not be assessed (Fig. 4l–n and Extended Data Fig. 8a–h). The ductal and lobular regions contained a much higher density of immune cells relative to the connective tissue regions (Extended Data Fig. 8d). Most immune cells were found in the breast tissue parenchyma rather than in blood vessels, consistent with a tissue-resident phenotype (Fig. 4l–n). Furthermore, many T cells had elevated levels of RUNX3, indicative of a tissue-resident phenotype35(Extended Data Fig. 8a,b).
Further spatial analysis of selected immune cell states was performed by smFISH (MERSCOPE) (Extended Data Fig. 8i–l). These data revealed differences in the distribution of macrophage and B cell subsets between the four tissue regions. Although macro-m2 (MRC1, RNASE1, SELENOP) cells were identified in both the connective and epithelial regions, macro-m1 (C3, RGS1) were predominantly found in the ductal and lobular regions (Extended Data Fig. 8i,j). B cells were also enriched in the epithelial regions and rarely observed in the connective areas (Extended Data Fig. 8k,l). While plasma B cells (IGA and IGG) were found in both ductal and lobular regions, the naive and memory B cells (CD37, LTB, IGHD) were predominantly found in lobular areas (Extended Data Fig. 8k,l). However, in contrast to T cells, B cells were mainly localized to the stroma around the ductal and lobular regions (Extended Data Fig. 8g). Informed by the spatial co-localization of the macro-m2 cells and fibroblasts in the connective tissue regions, we predicted cellular interactions, which identified BSG–PPIA (fibroblast/macro-m2) and APP–CD74 (fibroblast/macro-m2) as putative ligand–receptor interactions (Extended Data Fig. 7g).
Fibroblast diversity in the breast
Fibroblasts represented an abundant breast cell type in our patient cohort (29.2% of cells, 15.1% of nuclei). Previous histopathological studies have classified breast fibroblasts as intralobular or interlobular on the basis of their tissue localization1,7 (Fig. 5a). Reclustering of the scRNA-seq data from 208,390 fibroblasts across 126 women identified four distinct cell states that varied across women (Fig. 5b,c and Extended Data Fig. 9a). The fibro-major (MMP3, CXCL1 and CXCL2) state was associated with ECM remodelling and immune signalling, whereas the fibro-matrix cells showed high expression of collagen genes (COL1A1, COL3A1) and scored high for a collagen gene signature, suggesting a role in ECM production (Fig. 5d and Extended Data Fig. 9b). The fibro-prematrix cells (GPX3, WISP2, PCOLE2) were associated with pre-collagen formation and vasculogenesis, whereas the fibro-SFRP4 cell state (SFRP4, MGP) was associated with tissue remodelling and WNT signalling (Fig. 5c and Extended Data Fig. 9b). We further investigated the expression of the cancer-associated fibroblast marker FAP, which showed very low expression, but was slightly elevated in the fibro-SFRP4 cell state (Fig. 5d).
Fig. 5 |. Breast fibroblasts and adipocytes.
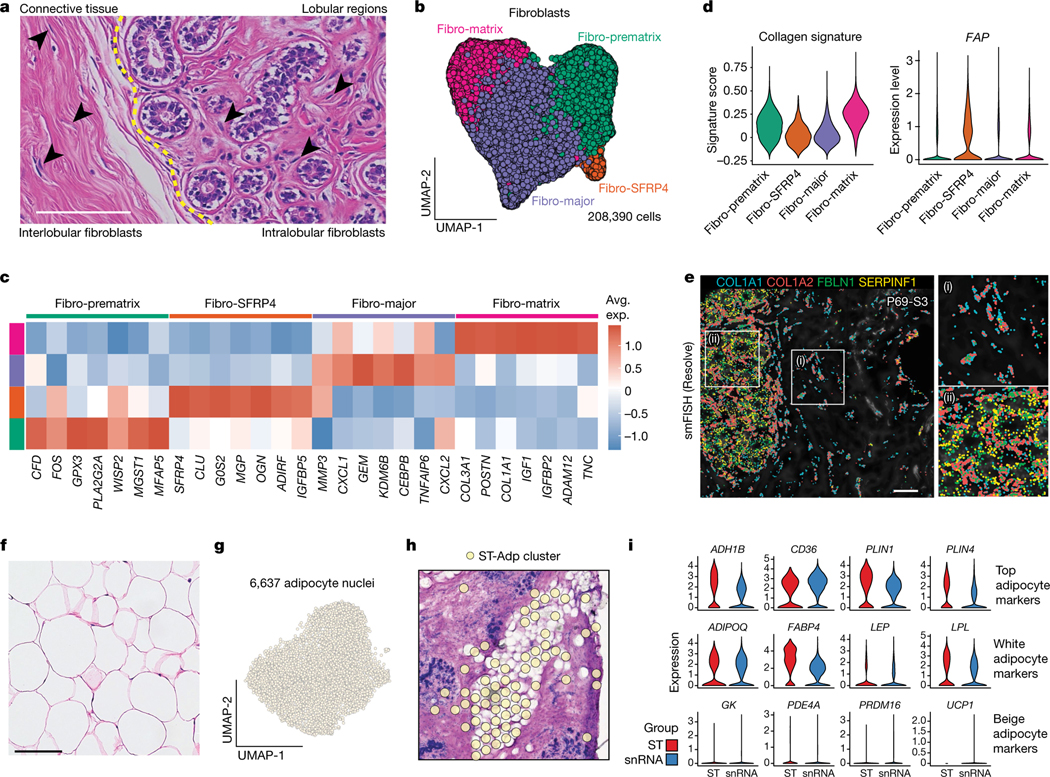
a, Histopathological sections showing regions with intralobular and interlobular fibroblasts (arrowheads) in the breast. b, UMAP representation of 208,390 fibroblast cells, showing 4 cell states. c, The top genes expressed for each fibroblast cell state, averaged from the scRNA-seq data. d, The collagen gene signature scores (left) and expression of FAP (right) across different fibroblast cell states in the scRNA-seq data. e, smFISH data (Resolve) from patient P69 (P69-S3) showing a subset of four fibroblast genes and their distribution in the connective tissue (i) and intralobular (ii) areas. f, Histopathological section of breast adipose tissue. g, UMAP representation of 6,637 adipocytes from snRNA-seq data. h, ST data showing an adipocyte cluster in P46. i, Expression of top adipocyte genes, white adipocyte markers and beige adipocyte markers in the ST data and snRNA data. For a, e and f, scale bars, 100 μm.
To investigate the spatial distributions, we used vimentin (VIM) in our CODEX analysis, which revealed two locations of fibroblasts in the interlobular and intralobular regions (Extended Data Fig. 9c). To distinguish between the two fibroblast cell states, we used four genes from the spatial smFISH panel (Resolve), including COL1A1 (fibro-matrix), as well as FBLN1 and SERPINF1 (fibro-prematrix, fibro-SFRP4), showing that these markers were expressed predominantly in the lobular regions (Fig. 5e and Extended Data Fig. 9d). To further quantify this finding, we classified the smFISH genes into three groups (epi-proximal, epi-middle and epi-distal), which confirmed that SERPINF1 and FBLN1 was elevated in the intralobular regions (Methods and Extended Data Fig. 9e,f). We also used RNAscope to investigate the expression of MMP3 in the fibro-major cell state, which showed higher levels in the fibroblasts proximal to lobular regions (Methods and Extended Data Fig. 9g).
Adipose tissues of the breast
Adipose tissue represents a large proportion of the human breast and has an important role as a source of energy and hormones13,23,36. Adipocytes are the main cell type in adipose tissues and are readily identified by histopathology (Fig. 5f). However, adipocytes have been notoriously difficult to profile using single-cell genomics methods owing to their large cell size, high lipid content and fragile nature6. Indeed, adipocytes were not captured using our scRNA-seq methods (Fig. 1c). We therefore used snRNA-seq to capture the transcriptomic profiles of 6,637 breast adipocytes (Fig. 1e) and ST data from 10 women (Fig. 5g,h). Collectively, these methods identified ADH1B, CD36, PLIN1, PLIN4, ADIPOQ, FABP4, LEP and LPL as the top genes expressed in breast adipocytes, which was consistent across the two orthogonal platforms (Fig. 5i). Both the snRNA-seq and ST data showed that most adipocyte markers were expressed uniformly across all adipocytes, with limited cell-state heterogeneity. The dataset was analysed for brown/beige and white adipocyte markers, showing that breast adipocytes exclusively corresponded to white adipocytes (Fig. 5i). We further investigated potential receptor–ligand interactions between the adipocytes and fibroblasts with the myeloid cell states, identifying many putative interactions between these cell types (Extended Data Fig. 9h).
Vascular and lymphatic cells
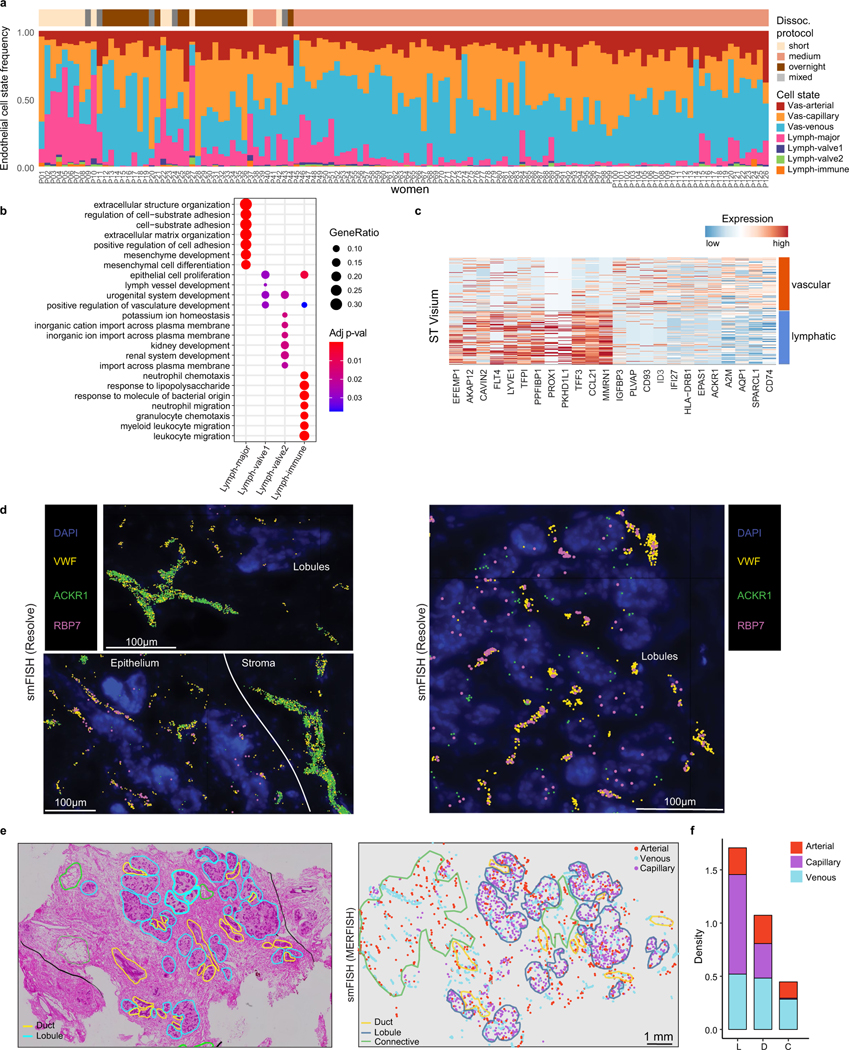
The human breast is a highly vascularized organ containing a network of veins and arteries that are often detected in histopathological sections (Fig. 6a). Our scRNA-seq analysis of 83,651 endothelial cells across 126 women showed that vascular endothelial cells (expressing PECAM1 and VWF) represent an abundant cell type (11.7% of cells, 7.2% of nuclei) in normal breast tissue (Fig. 6b). Reclustering of the scRNA-seq vascular endothelial cells identified three major cell states that varied across women and corresponded to arterial endothelial (SOX17, GJA4), venous endothelial (ACKR1, SELP) and capillary endothelial (RGCC, CA4) cells on the basis of canonical markers37,38, and further revealed many new top marker genes (Fig. 6b,c and Extended Data Fig. 10a).
Fig. 6 |. Vascular, perivascular and lymphatic cells in the human breast.
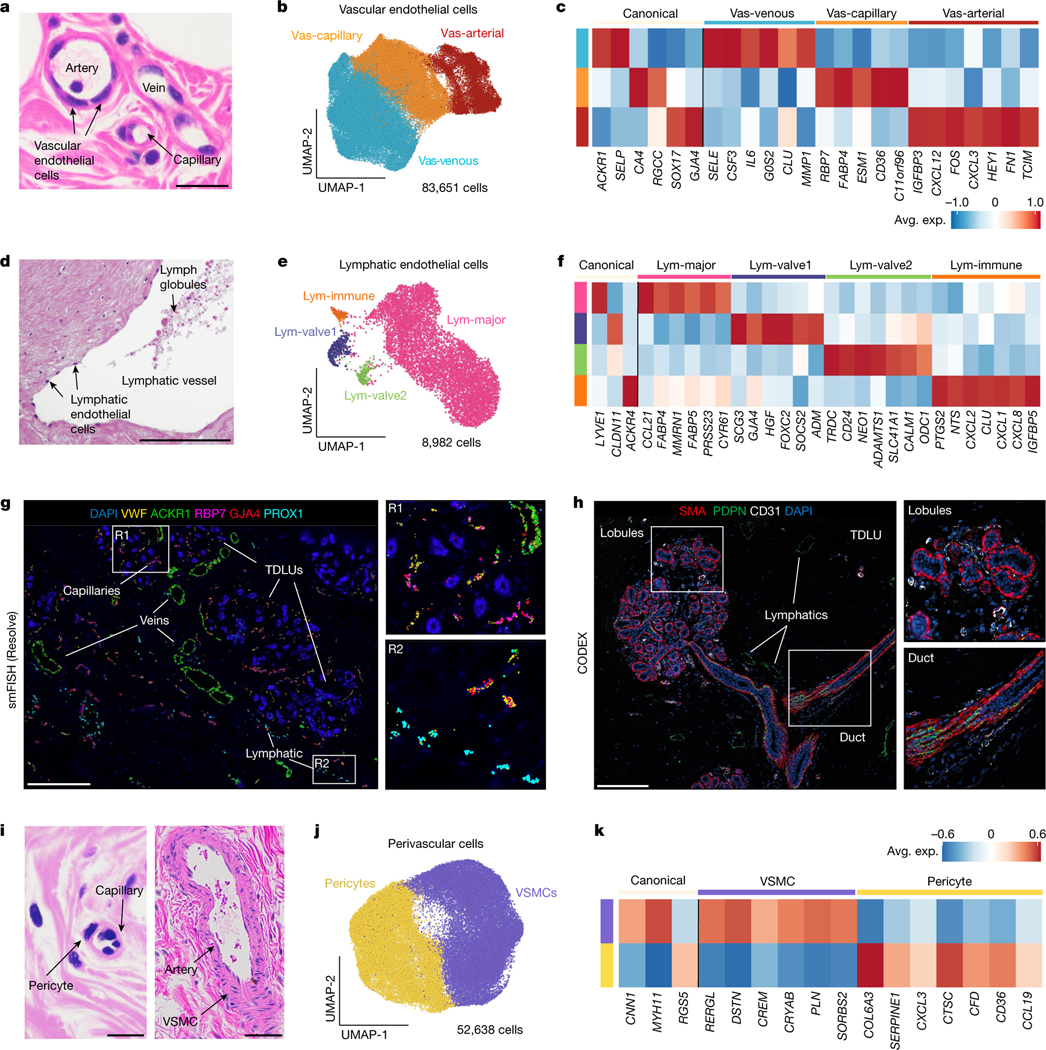
a, Histopathological section showing an artery, vein and capillary structure in normal breast tissue. b, UMAP representation of 83,651 vascular endothelial cells showing 3 major cell states. c, Canonical and top genes expressed for each vascular endothelial cell state, using averaged values from the scRNA-seq data. d, Histopathological section showing a lymphatic duct in the breast tissue. e, UMAP representation of 8,982 lymphatic endothelial cells, showing 4 major cell states. f, Expression of canonical and top genes for each lymphatic cell state, averaged from the scRNA-seq data. g, smFISH (Resolve) data from patient P47 (P47-S1) showing a subset of vascular gene markers (VWF, ACKR1, RBP7 and GJA4) and lymphatic markers (PROX1), with two enlarged regions (R1 and R2). h, CODEX data from patient P130 showing a TDLU region with vascular cells (anti-CD31) and lymphatic cells (anti-PDPN) cells, and basal cells labelled (anti-SMA) with two enlarged regions. i, Histopathological sections showing a pericyte and capillary structure, as well as an artery and VSMCs in normal breast tissue. j, UMAP projection and clustering of 52,638 perivascular cells, showing 2 cell states. k, Canonical markers and the top genes expressed for each perivascular cell state from averaged scRNA-seq data. Scale bars, 50 μm (a, d and i) and 500 μm (g and h).
The lymphatic network is a passive system for removing cellular waste and can be identified in histopathological tissue sections, along with lymph globules (Fig. 6d). Our data show that lymphatic endothelial cells (PROX1 and PDPN) occur at low frequencies (1.3% of cells, 3.5% of nuclei) in breast tissue. Clustering of 8,982 lymphatic cells from the scRNA-seq data identified four major cell states that varied across women (Fig. 6e,f and Extended Data Fig. 10a). The Lym-major cells (LYVE1 and CCL21) represented the most abundant component of the lymphatic vessels. The Lym-immune cells (ACKR4 and NTS) resemble cells on the ceiling of subcapsular sinus in human lymph nodes38 and expressed chemotaxis signatures, suggesting a role in immune cell signalling (Extended Data Fig. 10b). The two other cell states (Lym-valve1 and Lym-valve2) are lymphatic valve cells that express CLDN11 and are important for preventing lymphatic fluid backflow39.
Using four spatial platforms, we investigated the localization of the vascular and lymphatic cell states. The ST data showed two distinct clusters for vascular and lymphatic cells that corresponded to the histopathological vessel structures and validated many scRNA-seq cell type markers in situ (Extended Data Fig. 10c). The smFISH data (Resolve) showed that larger venous structures expressing ACKR1 and the vascular marker VWF are typically found in the connective tissues, whereas smaller capillary structures (RBP7) were closely integrated within lobular and ductal regions (Fig. 6g and Extended Data Fig. 10d). Spatial analysis using smFISH (Resolve) showed that the lymphatic cells (PROX1) are located predominantly in connective tissues regions (Fig. 6g). This was also reflected in the CODEX analysis using anti-PDPN antibodies (Fig. 6h). Moreover, smFISH (MERFISH) analysis showed that capillary endothelial cells are highly localized to the ductal and lobular regions, whereas arterial and venous endothelial cells are more enriched in the connective regions (Extended Data Fig. 10e,f).
Perivascular cells of the breast
In addition to the blood vessels, the perivascular cells support and regulate the blood flow in vasculature (Fig. 6i). Clustering of the 52,638 cells from scRNA-seq data identified two major cell subtypes: the pericytes that regulate blood flow from capillaries into tissues40,41 and the vascular smooth muscle cells (VSMCs) that regulate arterial contraction42 (Fig. 6j). These cells were abundant (7.4% of cells, 1.4% of nuclei) and varied in their frequencies across the 126 women (Extended Data Fig. 11a). Both pericytes and VSMCs can be identified in histopathological H&E sections (Fig. 6i). Pericytes expressed canonical markers such as RGS5, but also genes involved in immune signalling (such as CXCL3) and matrix production (COL6A3) (Fig. 6k). The VSMCs expressed the canonical markers CNN1 and MYH11, in addition to other smooth muscle (SYNM, ACTG2) marker genes (Fig. 6k and Extended Data Fig. 11b). Spatial analysis using smFISH (Resolve) showed that pericytes (RGS5) were highly abundant in the lobular regions, in which they often co-localized with vascular cells (VWF positive) (Extended Data Fig. 11c–e). Similarly, CODEX showed that pericytes (LIF positive) were often located in lobular regions and co-localized with vascular markers (CD31 positive) (Extended Data Fig. 11f). Moreover, smFISH (MERFISH) showed that pericytes were co-localized with capillary structures in the ductal and lobular regions, whereas VSMCs (SYNM, ACTG2) were spatially organized around arteries (SOX17) in the connective regions (Extended Data Fig. 11g,h).
Clinical metadata correlations
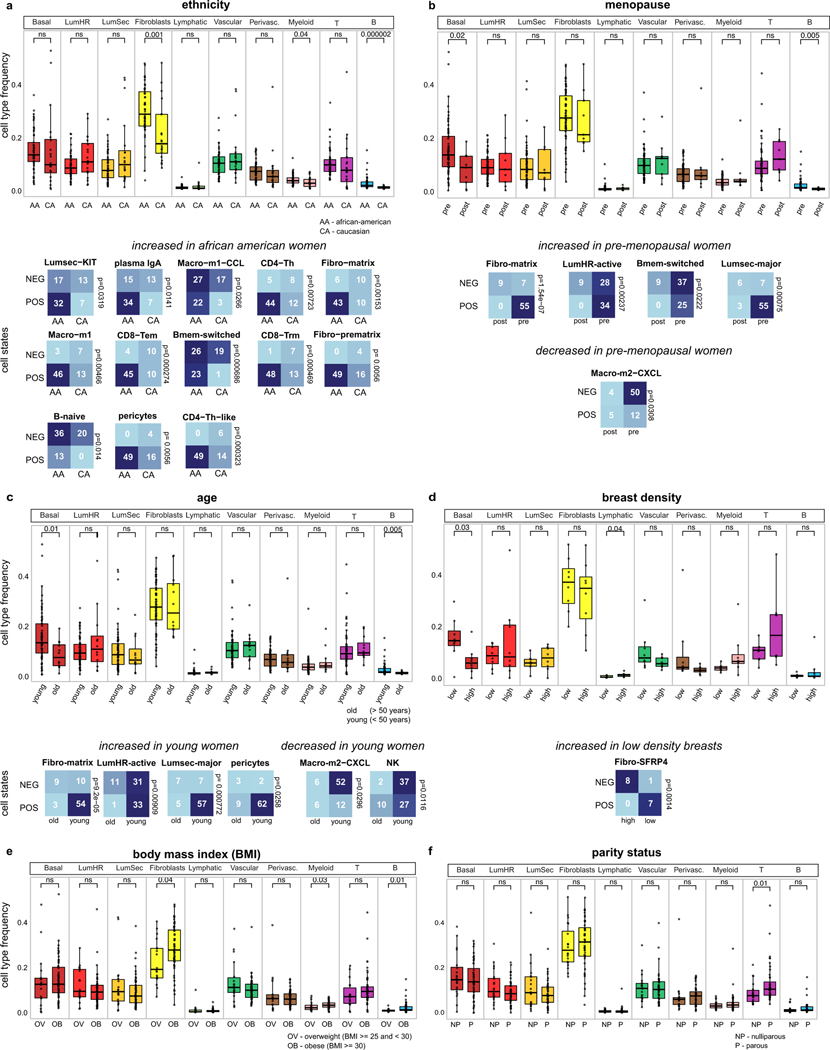
We investigated the association of the breast cell type and cell state frequencies with the clinical metadata (Extended Data Fig. 12 and Supplementary Table 1). To avoid potential complications due to the impact of different tissue types, we restricted this analysis to tissue samples from reduction mammoplasty surgeries (n = 76 women). The ethnicity analysis compared Caucasian (n = 20, 29%) and African American (n = 49, 71%) women, showing that fibroblasts and myeloid and B cells were elevated in African American women (P < 0.05, Wilcoxon rank-sum test) (Extended Data Fig. 12a). Compared with Caucasian women, African American women were associated with significant increases in 13 cell states (P < 0.05, Fisher’s exact test) (Extended Data Fig. 12a). In post-menopausal women, these data show significant decreases in the basal epithelial cell type (P < 0.05, Wilcoxon rank-sum test), whereas pre-menopausal women were associated with increases in the LumSec-major, fibro-matrix, B-memory-switched and LumHR-active cell states, as well as decreases in macro-m2-CXCL (P < 0.05, Fisher’s exact test) (Extended Data Fig. 12b). Younger women (aged less than 50 years) were correlated with significant increases in basal cell types (P < 0.05, Wilcoxon rank-sum test) and increases in LumHR-active, LumSec-major, fibro-matrix and pericyte cell states (P < 0.05, Fisher’s exact test), as well as decreases in the macro-m2-CXCL and NK cell states (P < 0.05, Fisher’s exact test) (Extended Data Fig. 12c). High levels of breast density were correlated with decreased levels of basal epithelial cells and increased levels of lymphatic cell types (P < 0.05, Wilcoxon rank-sum test), as well as decreases in the fibro-SFRP4 cell state (P < 0.05, Fisher’s exact test) (Extended Data Fig. 12d). Furthermore, obesity or high levels of body mass index was correlated with increased fibroblasts and myeloid cells, while parity status was significantly associated with increased levels of T cells (P < 0.05, Wilcoxon rank-sum test) (Extended Data Fig. 12e,f). Overall, this analysis shows that ethnicity, age and menopause were associated with the greatest changes in the breast cell type and cell state compositions.
Discussion
Here we report an unbiased atlas of the adult human breast tissues from 126 women, comprising 12 major cell types and 58 unique cell states organized into 4 major spatial tissue domains (Extended Data Fig. 13). In the epithelial cells, our data show limited basal cell-state diversity, whereas the two luminal epithelial cell types comprise 10 cell states with diverse biological functions. Our data estimate that only 1–4% of the LumSec breast epithelial cells are proliferative, which is consistent with their previous classification as luminal progenitors43. However, we also identified a small number (0.8%) of proliferating cells in the snRNA-seq data of the LumHR population. Notably, no proliferating cells were detected in the basal cells or cell states with stem cell markers, raising questions about the concept of a basal stem cell fuelling epithelial homeostasis11. Our detailed spatial comparison between epithelial ducts and lobules identified the presence of luminal cells with basal-like features (LumSec-basal, LumSec-myo) consistent with another scRNA-seq study15.
In the non-epithelial compartment, we identified an unexpectedly abundant (15.6%) and diverse milieu of tissue-resident immune cells that congregate in both the lobules and ducts. Only a small number of immune cells overlapped with vascular structures, and large proportions express the tissue residency marker RUNX3(ref. 35). Understanding the diversity of the immune cells is important for breast cancer, for which immunotherapy has recently become the standard of care for some subtypes44. The genomic profiles of lymphatic endothelial cells are also of biomedical relevance owing to their wide use in the clinical evaluation of lymph-node-positive breast cancers45. Furthermore, the snRNA-seq and ST data provide one of the first genomic references of breast adipocytes and show that they are exclusively white fat cells46.
Our metadata analysis identified significant changes in the breast tissue architecture that corresponded to ethnicity, age and menopause, consistent with a few pathological studies47,48. Owing to the known technical challenges in obtaining accurate measurements of the menstrual cycle49, our study could not investigate any associated changes. However, another study using scRNA-seq has reported menstrual-cycle-related changes in the epithelial cell types50. Overall, these data highlight the critical need to match the correct normal reference breast tissue dataset when studying disease states. A notable drawback of our current HBCA is the lack of ethnic and ancestral diversity, as this atlas comprised mainly Caucasian (46%) and African American (41%) women (Extended Data Fig. 1b). This bias should be addressed in future studies to advance our understanding of diseases and improve the outcomes for women from all backgrounds. Although our atlas has identified a large number of cell states and validated them in situ, future studies will be needed to validate their functional roles in experimental systems. In closing, the HBCA significantly advances our knowledge of the epithelial and non-epithelial cell types in adult human breast tissues, providing a comprehensive reference for studying mammary biology, development and diseases such as breast cancer.
Methods
Protocol availability
The breast tissue dissociation protocols for preparing cell suspensions and nuclear suspensions that were developed for the HBCA project have been deposited at protocols.io (https://www.protocols.io/view/dissociation-of-single-cell-suspensions-from-human-bp2l641bkvqe/v1 (dissociation of viable cell suspensions from human breast tissues) and https://www.protocols.io/view/dissociation-of-nuclear-suspensions-from-human-bre-x54v98ym4l3e/v1 (dissociation of nuclear suspensions from human breast tissues)).
Collection of normal breast tissue samples
Fresh breast tissue samples were collected from the University of California, Irvine, Baylor College of Medicine, MD Anderson Cancer Center, St Luke’s Medical Center and the Cooperative Human Tissue Network (CHTN). The study was approved by the Institutional Review Boards at the respective institutions using mirror protocols, including MD Anderson Cancer Center (PA17–0503), Baylor College of Medicine (H-46622) and UC Irvine (HS-2017–3552). Reduction mammoplasty tissues were collected mainly at Baylor St Luke’s Medical Center, while prophylactic mastectomies and contralateral mastectomies from the other breast of patients with cancer were collected at MD Anderson and UC Irvine. With the exception of the CHTN samples, all of the fresh breast tissue samples were collected 1–2 h after the surgical procedures and dissociated into viable cell suspensions using 1 h (short), 6 h (medium) or 24 h (long) enzymatic dissociation protocols. All of the tissue samples at the respective institutions were analysed for normal pathology at the time of collection and any women within incidental tissues with pre-cancer diagnosis (such as ADH or DCIS) were excluded.
Breast tissue dissociation for scRNA-seq
Detailed protocols for breast tissue mechanical and enzymatic digestion for scRNA-seq were developed and optimized for the HBCA project and can be found with step-by-step instructions at protocols.io (www.protocols.io). In brief, surgical tissue was transported in sterile DMEM medium (Sigma-Aldrich, D5796) on ice. Excess adipose tissue was removed before dissociation. Large breast tissue pieces were divided into individual 1–2 g preparations, which were subjected to dissociation solution consisting of collagenase A (1 mg ml−1 working solution, Sigma-Aldrich, 11088793001) dissolved in DMEM F12/HEPES medium (Gibco, 113300) and BSA fraction V solutions (Gibco, 15260037) mixed at a 3:1 ratio, respectively or, 20 ml of 4 mg ml−1 collagenase type 1 (in 5% FBS DMEM). For each preparation, a 10 cm dish with 2 ml dissociation solution was used to mince tissue into homogenous suspension with paste-like consistency. Minced tissue was transferred into a 50 ml conical tube with 40 ml of dissociation solution in a rotating hybridization oven for 1 to 6 h at 37 °C until completely digested (short digestion protocol: 30 min to 1 h; medium digestion protocol: 3–6 h). The cell suspension was centrifuged at 500g for 5 min and the supernatant was removed. The pellet was resuspended in 5 ml trypsin (Corning, 25053CI) at room temperature and incubated in a rotating hybridization oven at 37 °C for 5 min. Trypsin was neutralized with 10 ml DMEM containing 10% heat-inactivated FBS (Sigma-Aldrich, F0926). The solution was mixed by pipetting up and down, and then filtered through a 70 μm strainer (Falcon, 352350). A sterile syringe plunger flange was used to grind the leftover unfiltered tissue and DMEM was used to wash the remaining single cells off the filter. The flow-through was centrifuged at 500g for 5 min and the supernatant was removed. The resulting pellet was nutated at room temperature for 10 min in 20 ml 1× MACS RBC lysis buffer (MACS, 130–094-183) to remove red blood cells (RBCs). To stop RBC lysis, 20 ml DMEM was added and then centrifuged at 500g for 5 min. The cell pellet was washed in 10 ml of cold DMEM and centrifuged at 500g for 5 min. The pellet was then resuspended in cold PBS (Sigma-Aldrich, D8537) + 0.04% BSA solution (Ambion, AM2616) and filtered through a 40 μm Flowmi (Bel-Art, h13680–0040). Trypan-Blue-stained cells were counted in the Countess II FL automated cell counter (Thermo Fisher Scientific) and their concentration was adjusted to 700–1,200 cells per μl.
For overnight digestions (long digestion protocol: 24 h), after digestion, the enzymatic tissue digestion mixture was centrifuged at 400g for 5 min. The supernatant was removed and the tissue pellet was washed with 50 ml of PBS. The supernatant was removed and 2 ml of 0.05% trypsin was used to break up tissues into single-cell suspensions in a 15 ml conical flask and placed into a 37 °C water bath. Dissociation was accelerated by pipetting with a p1000 set at 1 ml, pipetting up and down 10 times every 2 min. A total of 10 ml of 10% FBS + DMEM was used to neutralize the enzymatic digestion, and the sample was centrifuged for 5 min at 400g. The resulting pellet was resuspended in 100 μl in 20 U ml−1 DNase I (Sigma-Aldrich, D4263–5VL) and incubated at 37 °C for 5 min to liberate cells from DNA. A total of 10 ml of 10% FBS + DMEM was added and the tissue was centrifuged at 400g for 5 min. The resulting single-cell suspension was passed through a 100 μm strainer filter. Cells were then stained for fluorescence-activated cell sorting (FACS) using fluorescently labelled antibodies for CD31 (eBioscience, 48–0319-42), CD45 (eBioscience, 48–9459-42), EPCAM (eBioscience, 50–9326-42) and CD49f (eBioscience, 12–0495-82), and SytoxBlue (Life Technologies, S34857). Only samples with at least 80% viability as assessed using SytoxBlue with FACS were included in this study. For scRNA-seq, we excluded doublets and dead cells (SytoxBlue+) for FACS isolation. Flow-cytometry-sorted cells were washed with 0.04% BSA in PBS and suspended at approximately 1,000 cells per μl.
scRNA-seq
Single-cell suspensions were immediately processed for scRNA-seq using the Chromium platform (10x Genomics). Single-cell capture, barcoding and library preparation were performed by following the 10x Genomics Single Cell Chromium 3′ protocols (V2: CG00052, V3: CG000183, V3.1: CG000204). The final libraries were sequenced on the NovaSeq 6000 system S2–100 flowcell (Illumina). Data were processed using the CASAVA v.1.8.1 pipeline (Illumina), and sequencing reads were converted to FASTQ files and UMI read counts using the CellRanger software (10x Genomics).
snRNA-seq
The detailed protocol for overnight breast tissue mechanical isolation for snRNA-seq can be found at protocols.io (www.protocols.io). To isolate single nuclei, 0.5–1 g fresh breast tissue was placed into a 10 cm dish with 2 ml lysis buffer. Nucleus lysis buffer consists of NST-DAPI buffer with 0.1 U μl−1 RNase Inhibitor (NEB, M0314L)51,52. Tissue was minced until tissue chunks were no longer visible. The suspension was filtered through a 40 μm cell strainer (Falcon, 352340). A sterile syringe plunger flange was used to gently grind the leftover tissue on the filter and then rinsed with 3 ml of lysis buffer. The flow-through was transferred into 5 ml DNA LoBind tubes and incubated on ice for 10 min. The tube was centrifuged at 500g for 5 min at 4 °C. The supernatant was removed, and nuclei were washed with 1 ml cold lysis buffer and centrifuged again. The nucleus pellet was resuspended in 1% BSA (Sigma-Aldrich, SRE0036) in PBS supplemented with 0.2 U μl−1 RNase inhibitor. Nuclei were filtered through a 40 μm Flowmi cell strainer, counted using a haemocytometer under the DAPI channel and the concentration was adjusted to 700–1,200 nuclei per μl. 10x Genomics RNA experiments were performed immediately to avoid nucleus aggregation. Single-cell capture, barcoding, library preparation and sequencing were the same as described above. For nucleus preparations that were sorted using flow cytometry, a 10 ml dounce tissue homogenizer was placed onto ice, and 40 g of breast tissue was placed into a 10 cm tissue culture dish on ice. Approximately 10 g of tissue was minced into fine (~2 mm × 2 mm) pieces, and the sample was then added to the dounce homogenizer. A total of 10 ml of nuclear isolation buffer (400 μl 1 M Tris-HCL pH 7.5, 80 μl 5 M NaCl, 120 μl 1 M MgCl2, 400 μl 10% NP-40, 39 ml DNase/RNase-free sterile H2O) was pipetted over the tissue into the dounce homogenizer. Tissue was dounce-homogenized with the piston until running smoothly. Homogenization was repeated until all 40 g of tissue was digested. The nucleus suspension was then centrifuged at 500g for 5 min at 4 °C, washed in 1% BSA in PBS and stained with Hoechst for flow-cytometry-based sorting of high-quality nuclei to be sequenced using snRNA-seq.
ST profiling of normal breast tissues
ST experiments were performed using the Visium Platform (10x Genomics) with the following modifications to the manufacturer’s protocols. Fresh breast tissues from four patients were embedded in cryomolds with OCT compound (Thermo Fisher Scientific, NC9542860, 1437365) over dry ice. The tissue blocks were stored at −80 °C in sealed bags. Sectioning (thickness, 12 μm) was performed on a cryomicrotome (Cryostar NX70, Thermo Fisher Scientific) with chuck and blade temperatures set at −17 °C and −15 °C, respectively. The tissue section was placed within the capture area of the Visium spatial slide (10x Genomics PN-1000184). The protocol was optimized for normal breast tissue according to manufacturer’s tissue optimization protocol (10x protocol, CG000238) and the slides were permeabilized for 12 min. The sectioned slides were fixed and stained as described by manufacturer (10x protocol, CG000160). Imaging was conducted using the Nikon Eclipse Ti2 system according to the imaging guidelines (10x protocol, CG000241). The final libraries were constructed according to the user guide (10x protocol, CG000239) and sequenced on the Illumina NovaSeq 6000 system S1–200 flowcell.
Resolve highly multiplexed in situ RNA profiling using smFISH
Resolve Biosciences probes were designed to target 100 genes based on the top expressed genes in each of the breast cell types from the scRNA-seq data and are listed in Supplementary Table 6. To prepare the tissue for Resolve smFISH analysis, OCT-embedded tissues were cut to 12 μm sections in a microtome with the chuck and blade temperatures set at −17 °C and −15 °C, respectively. The tissue sections were thawed and fixed with 4% (v/v) formaldehyde (Sigma-Aldrich, F8775) in 1× PBS for 30 min at 4 °C. After fixation, the sections were washed for 1 min in 50% ethanol and then 70% ethanol at room temperature. The fixed samples were used for Molecular Cartography according to the manufacturer’s instructions (protocol 3.0; www.resolvebiosciences.com ), starting with the aspiration of ethanol and the addition of buffer BST1 (step 6 and 7 of the tissue priming protocol). In brief, tissues were primed followed by overnight hybridization of all probes specific for the target genes (see below for probe design details and the target list). The samples were washed the next day to remove excess probes and fluorescently tagged in a two-step colour development process. Regions of interest were imaged as described below and fluorescent signals were removed during decolourization. Colour development, imaging and decolourization were repeated for cycles to build a unique combinatorial code for every target gene that was derived from raw images as described below. The samples were imaged on the Zeiss Celldiscoverer 7, using the ×50 Plan Apochromat water-immersion objective with an NA of 1.2 and the ×0.5 magnification changer, resulting in a ×25 final magnification. Standard CD7 LED excitation light source, filters and dichroic mirrors were used together with customized emission filters optimized for detecting specific signals. Excitation time per image was 1,000 ms for each channel (DAPI was 20 ms). A z-stack was taken at each region with a distance per z-slice according to the Nyquist–Shannon sampling theorem. The custom CD7 CMOS camera (Zeiss Axiocam Mono 712, 3.45 μm pixel size) was used.
For each region, a z-stack per fluorescent colour (two colours) was imaged per imaging round. A total of 8 imaging rounds were performed for each position, resulting in 16 z-stacks per region. The completely automated imaging process per round (including water immersion generation and precise relocation of regions to image in all three dimensions) was realized using a custom Python script using the scripting API of the Zeiss ZEN software (open application development).
Highly multiplexed immunostaining using CODEX
Formalin-fixed paraffin-embedded human breast tissue was analysed using CODEX (PhenoCycler, Akoya Biosciences). The experiments were performed according to the manufacturer’s protocols. In brief, the tissue was sectioned at 5–7 μm and mounted onto 22 mm × 22 mm glass coverslips, previously coated with 0.1% poly-l-lysine. The tissue section was dewaxed and stained with a mixture of oligonucleotide-barcoded PhenoCycler antibodies and post-fixed according to the PhenoCycler user manual. The tissue was then imaged on the PhenoCycler-Open platform, whereby three fluorescent oligo reporters with spectrally distinct dyes were applied to the tissue in iterative imaging cycles. Imaging data were acquired using the Keyence BZ-X800 fluorescent microscope at ×20 magnification. The tissue was stained with a 34-antibody panel targeting the proteins listed in Supplementary Table 10.
RNAscope in situ hybridization combined with immunofluorescence
To simultaneously detect MMP3 mRNA and vimentin and pancytokeratin (PanCK) protein in situ in human breast FFPE tissue sections, the RNAscope Multiplex Fluorescent Reagent Kit V2 (ACD Biotechne, Cat. 323100) was combined with immunofluorescence analysis. The manufacturer’s instructions were followed for RNAscope in situ hybridization unless otherwise indicated using a probe targeting human MMP3 gene (Hs-MMP3 RNAscope Probe, 403421). FFPE tissue sections (thickness, 5 μm) were baked at 60 °C for 1 h 20 min, followed by deparaffinization using Histoclear (twice for 10 min) and 100% ethanol (twice for 2 min). After pretreatment, hydrogen peroxide incubation and target retrieval for 15 min, a barrier was created using a hydrophobic pen and dried at room temperature for 40 min. After MMP3 probe hybridization for 2 h at 40 °C and washing, three signal-amplification steps were performed and the HRP signal was developed using Opal 570 at a 1:1,500 dilution (Akoya Biosciences, FP1488001KT). Immunofluorescence was performed after the HRP blocker step with all of the steps conducted in the dark. The tissue was washed twice in TBST and blocked in 10% FBS in TBS + 0.1% BSA at 4 °C overnight. Anti-vimentin antibodies (R&D, raised in goat, AF2105) and anti-PanCK antibodies (GeneTex, raised in mouse, GTX26401) were used at 1:200 and 1:500 dilution, respectively, in TBS + 0.1% BSA for 2 h at room temperature. After three washes with TBS, donkey anti-goat-AF488 (for Vim) and donkey anti-mouse-AF647 (for PanCK) antibodies were used as secondary antibodies at a 1:500 dilution in TBS for 2 h at room temperature. Tissues were washed three times in TBS and mounted with Vectashield Antifade Mounting Medium with DAPI (Vector laboratories, H-1200). Images were acquired on the Keyence BZ-X700 using the DAPI, Cy3, Cy5 and GFP filter sets.
MERFISH experimental procedures
The MERFISH custom panel of 266 genes was designed on the basis of the top marker genes from the scRNA-seq 10x Genomics dataset (Supplementary Table 12). Fresh tissue from normal human breast samples was embedded in OCT and frozen, then used to prepare cryosections that were cut to 12 μm and placed onto the Merscope slide (VizGene). Tissue fixation, permeabilization, cell boundary staining, encoding probe hybridization and gel embedding were performed according to Vizgen Merscope User Guide (v.91600002 RevB). Autofluorescence quenching was not performed for normal breast tissue processing. The frozen tissue clearing protocol was followed by incubation for 4–6 h in digestion mixture and in clearing solution overnight in a humidified incubator at 47 °C. The clearing solution was replenished and the slide was incubated for three additional days at 37 °C until the tissue section became transparent under microscopy examination. After the tissue clearing was completed, imaging was performed according to the Merscope Instrument User Guide, with minor modifications. The slide was quickly rinsed twice with 5 ml sample prep wash and then incubated for 15 min in diluted DAPI and Poly(T) staining reagent while rocking (staining reagent was diluted 1/3 in sample prep wash buffer). The slide was quick rinsed twice in 5 ml formamide wash buffer and then incubated in 5 ml formamide wash buffer for 10 min. The stained slide was checked under the ×10 objective (Evos FL microscope) with 100% DAPI power to verify that there was no DAPI signal saturation. When necessary, formamide washes were repeated for 5–10 min until the DAPI signal was no longer saturated. The slide then was washed twice with 5 ml sample prep wash buffer and kept in the last wash until ready for imaging. After preparing the thawed imaging cartridge with RNase inhibitor and imaging buffer activator, 3 ml of the prepared mixture was transferred into a 3 ml Luer lock syringe to load the Merscope flow chamber. In the MERSCOPE Instrument software v.230–231, the sample verification protocol was run after modifying the instrumentConfiguration.json file on the instrument (rna ilm405 was set to 3 and protein medium ilm405 was set to 8). DAPI images were evaluated for saturation areas in the results panel. If needed, formamide washes were repeated. Once the appropriate DAPI intensity was reached, mineral oil was added to the imaging cartridge and the MERFISH run was initiated.
Computational methods
Single-cell RNA and nucleus RNA data preprocessing and filtering.
Sequencing reads from single cells and single nuclei from the 10x Genomics Chromium were demultiplexed, aligned to the GRCh38.p12 human genome reference53,54 using the default parameters of the CellRanger pipeline (v.3.1.0, 10x Genomics). Count matrices were generated for both datasets that were further analysed using Seurat (v.3.2.3)55. Cells from each sample were further filtered for low quality by removing cells with fewer than 500 UMIs or 200 genes detected. Potential doublets and multiplets were classified as cells expressing more than 20,000 UMIs or 5,000 genes and were removed. Cells with higher than 10% mitochondrial or 50% ribosomal transcripts were also filtered as they represented low-quality or dying cells. Similarly, for single-cell nuclei, the same filtering metrics were used for the single-cell data, except the minimum number of genes used for filtering cells was 150, as nucleus data express fewer genes.
Clustering of major cell types in scRNA-seq and snRNA-seq data
Clustering of the major cell types in the scRNA-seq data and nuclei in the snRNA-seq data was performed by integrating all of the samples together using canonical-correlation-analysis-based integration from the Seurat package. The filtered gene matrices from each sample were normalized using the NormalizeData function. To identify highly variable genes, we used FindVariableFeatures, which models the mean-variance relationship of the normalized counts of each gene across cells, and identified 5,000 genes per sample. We further identified anchors using FindIntegrationAnchors to integrate all patients using following parameters: dims = 20, k.filter = 30, anchor. features = 3000 and k.score = 30, which were used for the IntegrateData function with dims=20. The integrated dataset was then used for downstream analysis, which included scaling and centring the data using ScaleData, finding the most significant principal components using RunPCA and using the ElbowPlot to determine the number of principal components used for clustering. Different resolution parameters for unsupervised clustering were then examined to determine the optimal number of clusters. For the major cell type and nucleus clustering, the first 20 principal components were used for unsupervised clustering with a resolution = 0.2, yielding a total of 21 cell clusters, and for nuclei the resolution = 0.3, yielding 21 nucleus clusters using the FindNeighbours and FindClusters functions. For visualization, the dimensionality was further reduced using the UMAP methods with Seurat function RunUMAP. The principal components that were used to calculate the UMAP embedding were the same as those used for clustering. Each resulting cluster was further analysed for potential doublets or low-quality cells using a three-step process: (1) we calculated quality metrics such as nCount_RNA and mitochondrial content, and clusters with any outlier values (greater or less than 2 s.d. than the average of all clusters) were removed; (2) we checked the top 15 differentially expressed genes of each cluster and removed the clusters in which genes were predominantly mitochondrial, ribosomal or haemoglobin genes; (3) using the canonical cell type markers for each cell type, we determined whether any cluster had cells expressing canonical markers from a different cell type, suggesting they are doublets with another cell types. On the basis of the above criteria, we identified 10 major cell type clusters and 11 nucleus clusters that were well-separated in UMAP space.
Assignment of cell type annotations to clusters
To annotate the major cell type of each single cell or nucleus, FindAllMarkers was used to find differentially expressed genes in each cluster using the Wilcoxon rank-sum test statistical framework. The top 12 most significant differentially expressed genes (ranked by average log-transformed fold change; adjusted P < 0.05) were then carefully reviewed. Furthermore, we checked each cluster using the known canonical markers such as EPCAM for epithelial cells, PTPRC for immune cells, CD3D/E/G for T cells, CD19/MS4A1/CD79A for B cells, LUM/DCN/COL6A1 for fibroblasts, PECAM1 for endothelial cells and RGS5 for pericytes. We also applied SingleR56 to annotate the clusters. The three approaches were combined to infer major cell types for each cell and nucleus cluster according to the resulting annotation designated by SingleR and the enrichment of canonical marker genes and top-ranked differentially expressed genes in each cell cluster.
Identification of cell states by reclustering of cell type data
Each cell cluster was further extracted and underwent clustering and filtering as described above with different parameters. The different parameters used for clustering the expression states of major cells were as follows: B cells (dims = 12; k.param = 20, scaled by nCount_RNA, resolution = 0.3), T cells (dims = 20; k.param = 20, scaled by nCount_RNA, resolution = 0.4), myeloid cells (dims = 30; k.param = 20, scaled by nCount_RNA, resolution = 0.4), fibroblasts (dims = 30, k.param = 20, scaled by nCount_RNA, resolution = 0.4), LumHR (dims = 35; k.param = 20, resolution = 0.075, scaled by nCount_RNA), LumSec (dims = 35; k.param = 20, resolution = 0.2 scaled by nCount_RNA), perivascular (dims = 25; k.param = 20, scaled by nCount_RNA, resolution = 0.4), lymphatic cells (dims = 30; resolution = 0.05) and vascular endothelial cells (dims = 30; resolution = 0.1). Each round of clustering was followed by filtering for low-quality and doublet cells. Differentially expressed genes were calculated for each cell cluster relative to other cells within its cell type compartment using the FindMarkers function in Seurat with the Wilcoxon rank-sum test for statistical significance. Expression states were further annotated by investigating the top 200 genes of each cluster and performing pathway enrichment on the cell states as described in the ‘Pathway enrichment analysis’ section. For each cell type, we showed top genes of each cell state in the heatmaps based on the average log fold change.
Cell cycle analysis
We used the CellCycleScoring function from the Seurat package that is based on the cell cycle phase genes described previously57. Each cell and nuclei were given a quantitative score for G1, G2/M and S scores on the basis of the scoring of marker genes at each stage of the cell cycle.
Pathway enrichment analysis
For gene set enrichment analysis, ranked genes were selected on the basis of the above test filtered for an adjusted P ≤ 0.05 and arranged by average log-transformed fold change values between each cluster and fed into the fgsea R package58 using 1,000 permutations. Curated gene sets of KEGG, Biological Processes and Reactome were downloaded from the Molecular Signature Database (MSigDB, http://software.broadinstitute.org/gsea/msigdb/index.jsp) and were used to calculate enrichment scores. Significantly enriched gene sets were identified with a Benjamini–Hochberg adjusted P ≤ 0.05. For the identified cell states, we also selected top 200 genes and performed GO and KEGG enrichment analysis using the clusterProfiler package59.
Regulatory network analysis
For the RNA regulatory network analysis, we used SCENIC24 to inference the regulatory networks from the scRNA-seq and snRNA-seq data following the instructions available online (https://scenic.aertslab.org/). For the regulon score matrix, we performed differential expression analysis using a similar approach to the gene differential expression analysis and identified top regulons for each cell type.
Spatial analysis of smFISH Resolve data
We used QuPath (v.0.3.0)60 to segment cells on the basis of their DAPI images, then used ImageJ (v.1.52n)61 and the Molecular Cartography plug-in (Resolve Biosciences) to count genes in each cell. For the DAPI image, we also manually annotated different regions (duct, lobule, connective tissue and fibrocysts) by matched pathology H&E sections using ImageJ. The cell-gene count matrix was then input into Seurat (v.3.2.3)55 for downstream analysis. For the 12 samples of Resolve spatial data, cells with less than 10 gene counts were filtered. Counts data were then normalized using NormalizeData with the default LogNormalize method. Afterwards, normalized counts were scaled and centred using the ScaleData function. All of the genes were used for principal component analysis using RunPCA with the default parameters. ElbowPlot was used to determine the number of principal components for the downstream analyses and RunUMAP was applied to reduce data to a 2D space. We applied a two-step approach to annotate cells. First, we curated a marker list of each cell type and used AddModuleScore from Seurat to calculate the cell type scores of each cell (Supplementary Table 6). By comparing cell type scores, we took the largest score to assign the cell types and assigned cells with all scores less than 0.5 as low confident cells. Then, a random-forest machine learning model with a default of 500 trees was trained on the data while setting the cell type assignment as output and top 20 principal components as predictors using the randomForest package62 (CRAN). Out-of-bag predictions were used as our final cell type annotation while cells with a largest voting rate of less than 0.5 were assigned to the low-confidence group and were filtered for the downstream analysis. Cell type differentially expressed genes were identified using FindAllMarkers. The cell spatial colocalization graph was calculated using the scoloc function with the DT method in the CellTrek package63.
ST data analysis
Sequencing reads from Visium ST (10x Genomics) experiments were first preprocessed with Space Ranger (v.1.2.0; 10x Genomics) and mapped to the GRCh38 reference genome. The count matrices were subsequently analysed using Seurat (v.3). We filtered out spots with total counts of less than 100. The UMI counts were normalized using SCTransform. Similar to the scRNA-seq analysis, we then used Seurat anchor-based integration with the default parameters for the four samples. After integration, dimensionality reduction was performed using the RunPCA function. Clustering was performed using the FindClusters function. Differentially expressed genes for each ST cluster were identified using FindAllMarkers with two-sided Wilcoxon rank-sum test. P values were adjusted by Bonferroni correction and genes with adjusted P < 0.05 were retained. For the correlation analysis between ST and scRNA-seq data, we first selected markers (pct.1 > 0.25 and avg_logFC > 0.25) for each cell type on the basis of our scRNA-seq differential gene list. Then, for the markers of each cell type, we calculated the mean expression in the corresponding scRNA-seq and ST data, respectively. We performed the Pearson correlation analysis between these two data modalities.
Procrustes analysis between the left and right breast
In contralateral samples, we calculated Bray–Curtis dissimilarity between samples using the vegdist function from the vegan package (v.2.5–6) based on the cell type count matrix and then performed multi-dimensional scaling using cmdscale. To compare the cell type composition between the left and right breast, we applied Procrustes analysis using the protest function from the vegan package and performed a permutation test with 9,999 permutations. A Pearson’s correlation test was used to measure the similarities on the top two dimensions between the left and right breast after Procrustes rotations.
Metadata statistical analysis
Wilcoxon rank-sum tests were used to evaluate the associations between clinical metavariables for comparing cell type frequencies. Fisher’s exact tests were used to compare the counts of patients with a minimum of 20 cells of each cell state. The P values from the two-tailed tests are reported for each comparison and only the significant ones are shown in Extended Data Fig. 12.
Computational analysis of CODEX data
StarDist trained on TissueNet dataset (https://datasets.deepcell.org/data) was used for cell segmentation. The average intensity of each protein was then calculated for individual cells using the segmentation masks and the protein images. If the protein was localized in nuclei, for example, Ki-67, PCNA, FOXP3, then the average intensity was calculated from the nuclear mask obtained using StarDist. Otherwise, if the protein was localized in the cell membrane, for example, CD4, CD3, E-cadherin, then the average intensity was calculated from the membrane mask. The average protein intensities were then z-scored across all cells. Unsupervised clustering using Leiden algorithm was performed based on the normalized average protein intensities to assign cluster labels for all cells in each sample individually. The average intensity of each protein was then recalculated for each cluster and displayed on a heat map to identify cell types manually on the basis of marker expression, for example, basal, luminal, fibroblast, T cells, myeloid, endothelial cells. Tissue regions were manually annotated into lobules, ducts and connective tissue on the basis of their histological structure and morphology. The number of cell types in each annotated region was counted, and the relative cell percentages and densities (cell counts per area unit) were compared between the different regions. For the immune-cell-specific analysis, we took out the previously identified myeloid and T cells clusters and increased the clustering resolution and identified CD8+ T cells, CD4+ T cells, T regulatory cells, monocytes, macrophages and DCs. RUNX3-positive cells were defined by examining the gene expression distribution.
Merscope data analysis
For each tissue section, the tissue was annotated and divided into different spatial regions (duct, lobule, adipose, connective tissue, adipose/connective tissue) by a pathologist. We performed cell segmentation using CellPose64 based on the co-staining of nuclear DAPI signal and the cell membrane staining. The output cell gene count and cell coordinate matrices were then loaded into Seurat65. Cells were filtered with fewer than 20 UMIs or 10 genes detected. Similar to our smFISH Resolve data analysis, gene count matrices were processed using the NormalizeData, ScaleData, RunPCA and RunUMAP functions in Seurat. For the cell type and cell state identification, we used a supervised classification approach to predict cell labels on the basis of a curated list of gene markers (Supplementary Table 12). In brief, for each cell, we calculated cell type/state scores using the AddModuleScore function and assigned each cell to a cell type/state label based on the largest score. Cells with scores of less than 0.5 were annotated as low-confidence assignments. To further refine the cell annotations, a random-forest model with a default of 500 trees was trained on the data while setting the cell assignment as output and top 20 PCs as predictors using the randomForest package (CRAN). These predictions were used as final cell annotations, while cells with largest voting rate less than 0.5 or prediction scores between the largest and the second largest less than 0.1 were annotated as low confident cells.
CellPhoneDB analysis
To identify potential cell–cell interactions within the human breast tissue, we used CellPhoneDB v3 (https://github.com/ventolab/CellphoneDB)66. Our single-cell and single-nucleus adipocyte data were downsampled to include a minimum of 2,000 cells in each cell type and 100 cells in each cell state, resulting in a total of 23,584 cells. We conducted a differential gene expression analysis on the cell type level and applied CellPhoneDB using a threshold of 0.1 (expression greater than 10% cells within a cell type) for the degs_analysis and the default parameters for the statistical_analysis modules. To organize and determine the direction of ligand–receptor interactions, we used custom scripts and excluded integrin interactions. The results were then grouped into five categories: epithelium, epithelium-immune, epithelium-stroma, stroma-stroma and adipocytes-stroma. From each category, we selected the top 50 interactions between cell types with P < 0.05 and mean > 0.5. For specific cell-type/cell-state analysis, we generated dot plots with the direction of interaction pairs indicated with arrows using custom functions.
Extended Data
Extended Data Fig. 1 |. Frequency of Major Breast Cell Types Across Women and Sample Types.
a, Experimental workflow for breast tissue processing for scRNA-seq, showing different conditions used for digestion times and trypsin treatments. b, Pie chart showing ethnic backgrounds of women who provided tissue samples for the breast atlas. c, Cell type frequencies for different tissue sources (reduction mammoplasties - RM, prophylactic mastectomies - PM and contralateral mastectomies - CM), cells vs nuclei single cell RNA-seq protocols, and experimental dissociation protocol. d, Major cell type frequencies of matched left and right breasts from 22 women (left) and averages across all left and all right breast tissues (right). e, Stacked barplot showing the variation of cell type frequencies across the 126 women in scRNA-seq data. The top annotation bar shows the experimental workflow used (short/medium/long). f, Top regulons identified with SCENIC for each cell type cluster from the snRNA-seq data. g, Top regulons identified with SCENIC for each cell type cluster from the scRNA-seq data. h, Multi-dimensional scaling and Procrustes analysis to determine the concordance of left and right breast cell type frequencies and Pearson correlations for 22 women with matched breast tissue samples. P-value was calculated based on a two-sided test.
Extended Data Fig. 2 |. Ligand-receptor Interaction Analysis Between Cell Types.
Ligand-receptor interaction plots predicted from scRNA-seq data using CellPhoneDB between the major breast cell types. a, Interaction plot between the epithelial (Basal, LumHR and LumSec) cell types. b, Interaction plot between the epithelial and immune (B-cells, T-cells, Myeloid cells) cell types. c, Interaction plot between the epithelial and stromal (Fibroblasts, Perivascular and Vascular endothelial cells) cell types. d, Interaction plot within the stromal (Fibroblasts, Myeloid, Lymphatic, Vascular and Perivascular cells) cell types. e, Interaction plot between adipocytes and stromal cell types.
Extended Data Fig. 3 |. Spatial Transcriptomic Analysis of Breast Cell Types.
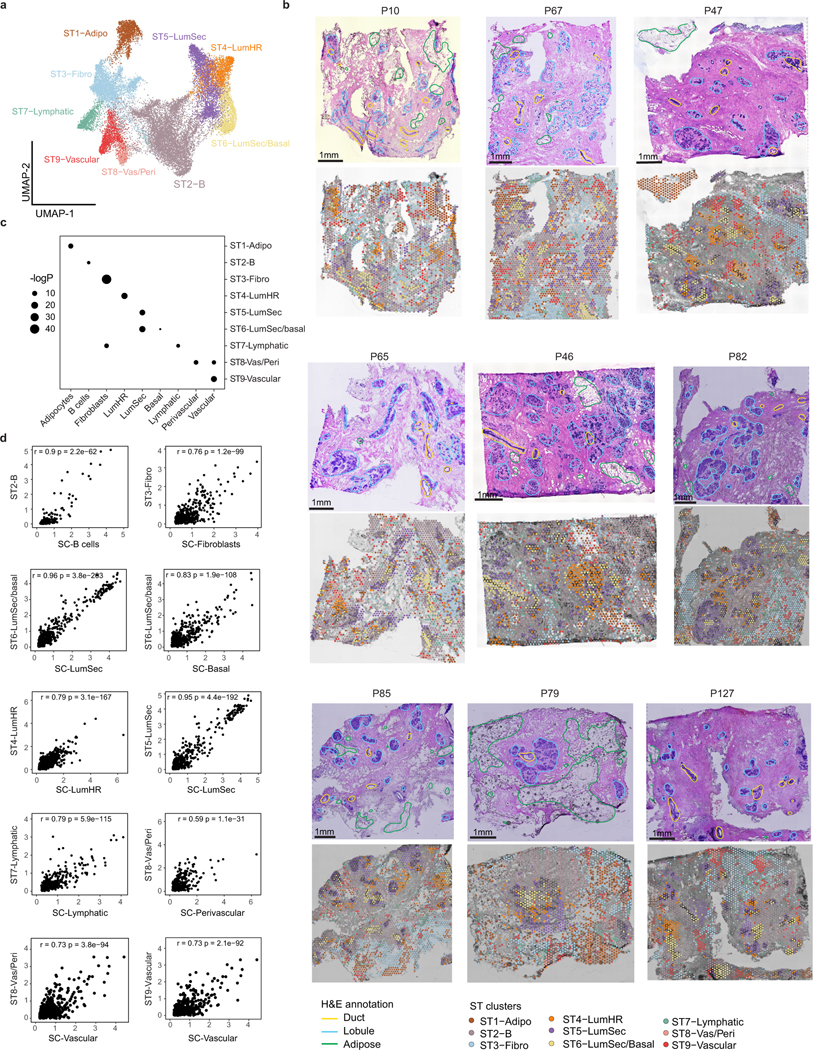
a, Integrated UMAP and unbiased clustering of ST data from 10 breast samples, showing 9 ST clusters. b, Histopathological images, and spatial distribution of ST clusters in the ST data from the breast tissues. c, Concordance of ST clusters and the scRNA-seq clusters of the major cell types using Fisher’s exact test. d, Pearson correlation analysis of marker gene expression levels between the ST clusters and the scRNA-seq data for different cell types. All p-values were calculated based on two-sided tests.
Extended Data Fig. 4 |. Spatial Analysis of Breast Cell Types with CODEX and smFISH.
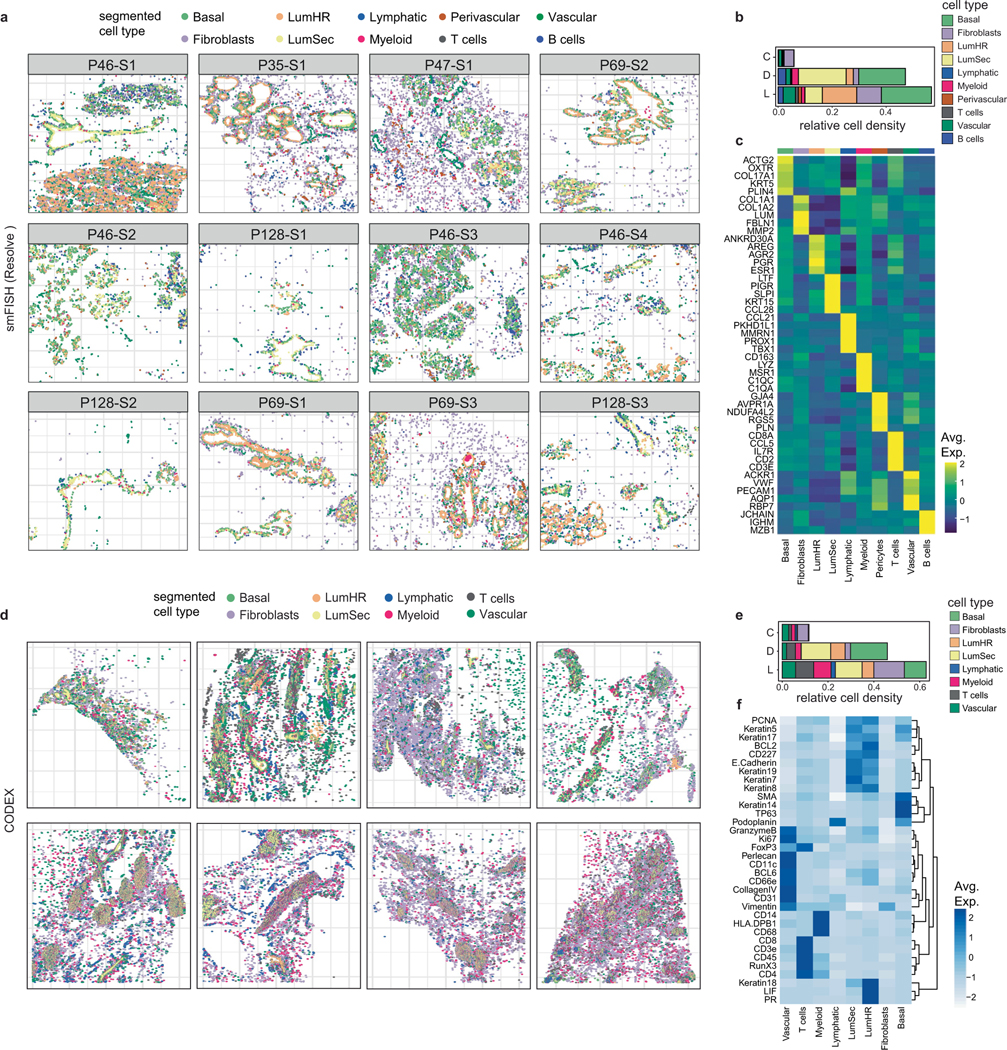
a, Cell segmentation results of smFISH (Resolve) data across 12 tissue samples profiled from 5 different women. Cells were annotated based on combinations of markers for each cell type as described in Supplementary Table 6. b, Densities of cell types across three topographic areas using 12 tissues profiled by smFISH (Resolve). c, Heatmap of the top 5 targeted maker genes for each cell type in the smFISH (Resolve) data from 12 combined tissue samples. d, Cell segmentation results of CODEX data from 8 different women. Cells were annotated based on combinations or single protein markers to identify different cell types. e, Densities of cell types across three topographic areas from 8 different women by CODEX. f, Heatmap showing protein levels for markers that were used to identify different cell types in the CODEX data. (D: ducts, L: lobules and C: connective regions).
Extended Data Fig. 5 |. Analysis of Single Cell and Spatial Epithelial Data.
a, UMAPs of snRNA-seq data showing the expression of hormone receptor genes. b, Epithelial cell state frequencies across the 126 women in scRNA-seq data, where the top annotation bar represents the dissociation protocol. c, UMAP feature plots showing the expression of previously reported stem cell marker genes in the scRNA-seq epithelial dataset. d, Ligand-receptor interactions within the epithelial cell states predicted with CellPhoneDB. e, Cell cycle scoring of S-phase for different epithelial cell states detected in the scRNA-seq data. f, Cell cycle scoring for S-phase in the epithelial cell type clusters detected in the snRNA-seq data. g, smFISH (Resolve) data showing the expression of the MKI67 proliferation marker in the epithelial cells of the ducts and lobules from 4 different breast tissues. h, UMAP of different LumSec cell states and ELF5, LTF signature scores, respectively. i, Histopathological image of adjacent H&E section showing the anatomic annotation of ducts and lobules (left) and smFISH MERFISH (right panel) from P101 showing the spatial distribution of different LumSec cell states across different regions. j, Stacked barplot showing the distribution of different LumSec cell proportions in ducts and lobules across 3 MERFISH samples. k, Histopathological image (left panel) and smFISH MERFISH (right panel) from P101 showing the spatial distribution of the LumHR-SCGB population in a specific region of epithelium.
Extended Data Fig. 6 |. Spatial analysis of epithelial cells in ductal and lobular structures.
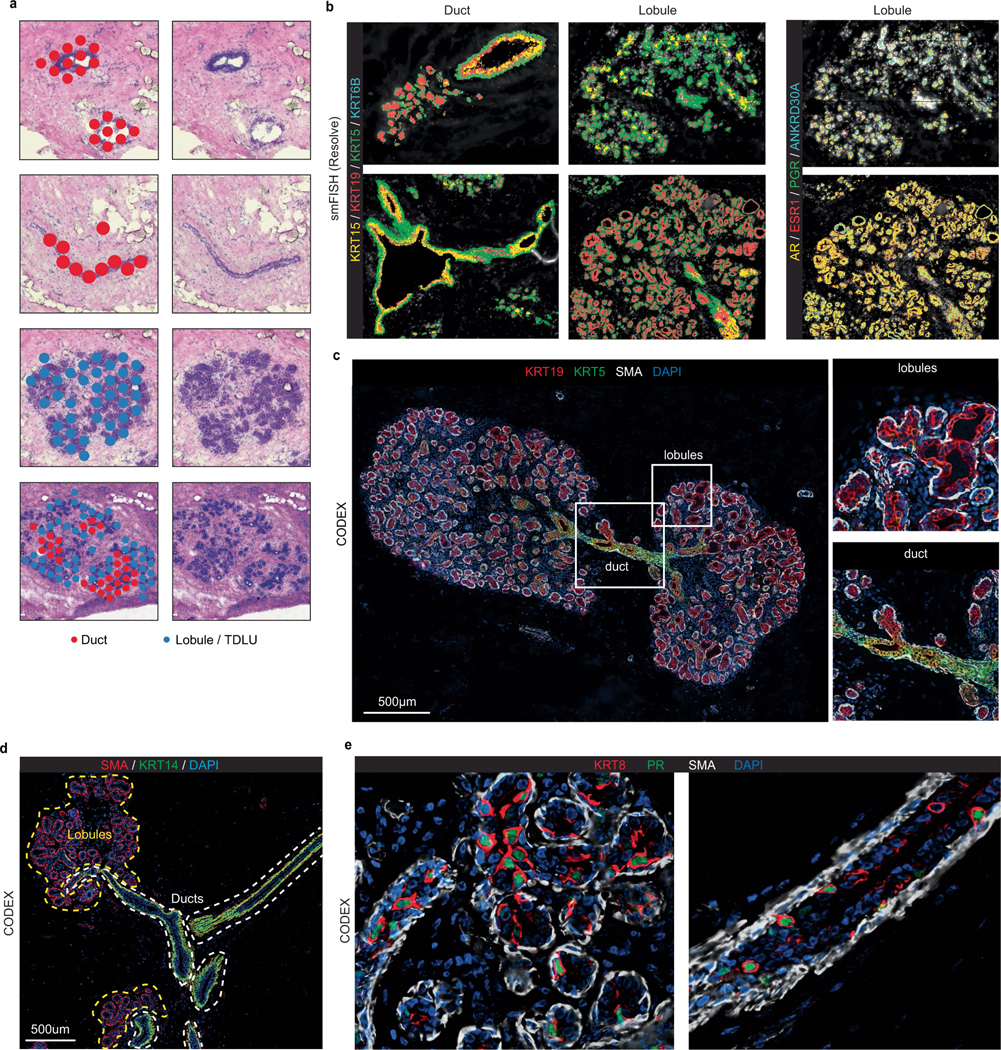
a, Spatial transcriptomic analysis showing clusters labelled as duct or lobule/TDLU from 3 breast tissues (P10, P35 and P47). b, smFISH (Resolve) data (P46-S1 and P46-S4) showing a subset of Keratin markers (left) and hormone receptor genes (right) and their localization to different breast tissue regions annotated as either duct or lobule/TDLU. c, CODEX data from P131 showing KRT5 in ducts and KRT19 in lobules/TDLU regions, with enlarged panels of the right. d, CODEX analysis from P130 of ductal and lobular/TDLU regions, showing differences for KRT14 levels in ducts and lobules. e, CODEX data from P131 showing protein levels of KRT8 and progesterone receptor (PR) in epithelial cells in the ducts and lobular/TDLU regions.
Extended Data Fig. 7 |. Immune cell subtypes in the breast and their variation in women.
a, H&E staining of plasma B-cells, T-cells, mast cell and macrophages (arrows) in human breast tissues. b, Stacked barplot showing the cell type frequencies of T, B and myeloid cells across 126 women in scRNA-seq data. Top annotation bar represents different tissue dissociation protocols that were utilized. c-e, Stacked barplots showing the cell state frequencies of T, B and myeloid cells across 126 women in scRNA-seq data respectively. f, Dot plot showing expression of checkpoint/exhaustion markers in NK and T cell states from the scRNA-seq data of 126 women. g, Ligand-receptor interaction analysis predicted with CellPhoneDB between the fibroblasts cell states and macrophage cell states.
Extended Data Fig. 8 |. Spatial analysis of immune cells in human breast tissues.
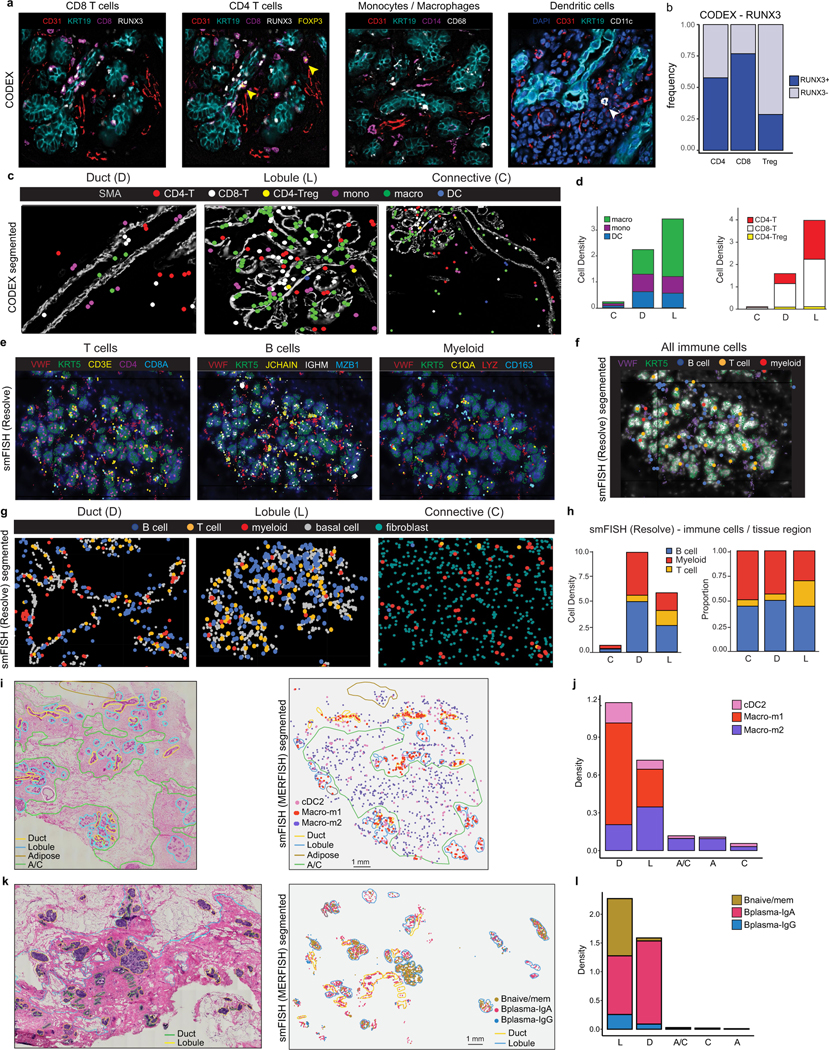
a, CODEX data from patient P130 and P131 showing localization of different immune cells with epithelial marker KRT19 and vascular marker CD31. Yellow and white arrows indicate CD4 Tregs and DCs, respectively. b, Frequency of T cells with the RUNX3 tissue residency marker in CODEX data. c, CODEX data (P130) showing immune cells in ductal, lobular and connective regions. d, Stacked barplots of CODEX data showing the density of immune cell types in each spatial region in 8 women. e, smFISH (Resolve) data (P46-S1) showing RNA localization of T, B and myeloid cells. f, Segmented smFISH (Resolve) data (P46-S1) showing cell localization of T, B and myeloid cells. g, smFISH (Resolve) data (P46-S1 and P47-S1) showing immune cell localization of B, T and myeloid cells across ducts, lobules and connective regions. h, Stacked barplots of smFISH (Resolve) data showing the density and proportion of immune cell types in different spatial regions. i, Adjacent histopathological tissue section (left) and segmented smFISH MERFISH data (right) from patient P91 showing the spatial distribution of m1, m2 macrophages and cDC2 populations in different regions of human breast tissue. j, Stacked barplot showing the density of m1, m2 macrophages and cDC2 populations in different regions across 3 smFISH MERFISH samples. k, Adjacent histopathological tissue section (left) and segmented smFISH MERFISH data (right) from patient P96 showing the spatial distribution of different B-cell states in different regions of human breast tissue. l, Stacked barplot showing the density of different B-cell states in different regions across three smFISH MERFISH samples.
Extended Data Fig. 9 |. Fibroblast cell states in the human breast.
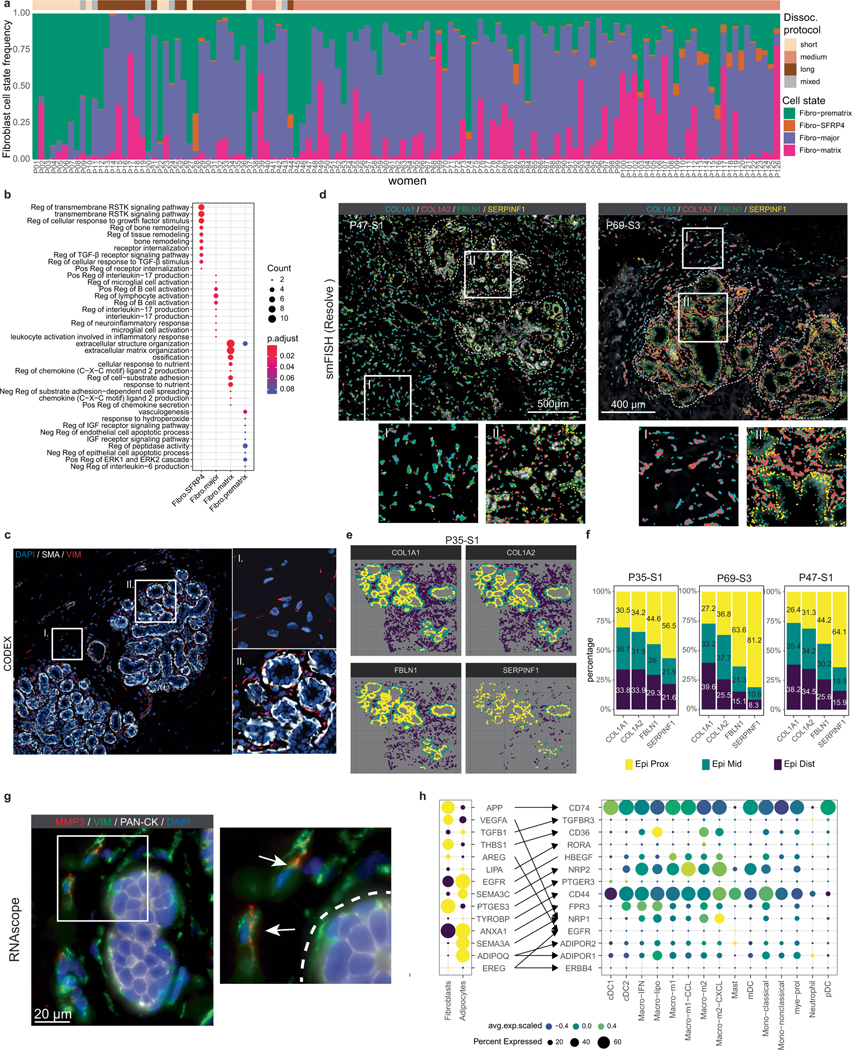
a, Stacked barplot showing the fibroblasts cell state frequencies across 126 women in scRNA-seq data with top annotation bar representing the tissue dissociation protocol. b, Gene ontology enrichment analysis showing top enriched biological process gene sets associated with each cell state (Pos: positive; Neg: negative; Reg: regulation; RSTK: receptor protein serine/threonine kinase; TGF: transforming growth factor; IGF: insulin-like growth factor). c, CODEX data from P132 showing fibroblasts marked by VIM in the connective tissue (I) and interlobular (II) regions. d, smFISH (Resolve) data showing fibroblast markers in areas of connective tissue regions (I) and epithelial regions (II) from two women (P47-S1 and P69-S3). e, smFISH (Resolve) data (P35-S1) indicating spatial proximity regions with epithelial-proximal (Epi-prox), epithelial-middle (Epi-mid) and epithelial-distant (Epi-Dist) regions for 4 marker genes. f, Percentages of 4 markers that are proximal, middle or distant to the epithelial cells, quantified from the smFISH (Resolve) data. g, RNAscope in situ hybridization of breast tissues using an MMP3 probe in combination with anti-Vimentin and anti-PanCK immunofluorescent staining, with enlarged panel (right). h, Ligand-receptor interactions between fibroblasts, adipocytes and myeloid cell states predicted using CellPhoneDB.
Extended Data Fig. 10 |. Endothelial cell diversity in the Human Breast.
a, Stacked barplot showing the endothelial cell state frequencies across the 126 women in scRNA-seq data, with top annotation bar showing the tissue dissociation protocol. b, Dot plot of gene ontology enrichment results for 4 lymphatic cell states. c, Heatmap showing top gene expression for vascular and lymphatic endothelial clusters detected in the ST data. d, smFISH (Resolve) data showing veins (ACKR1) and capillaries (RBP7), as well as a canonical vascular marker (VWF) in two different HBCA samples (P46-S3 and P69-S3). e, Adjacent H&E tissue section with pathological annotations (left panel) and segmented smFISH MERFISH data (right panel) from P101 showing the spatial distribution of vascular endothelial cell states in different regions of human breast tissue. f, Stacked barplot showing the density of vascular endothelial states in different regions across 3 smFISH MERFISH samples.
Extended Data Fig. 11 |. Perivascular cells in Human Breast Tissues.
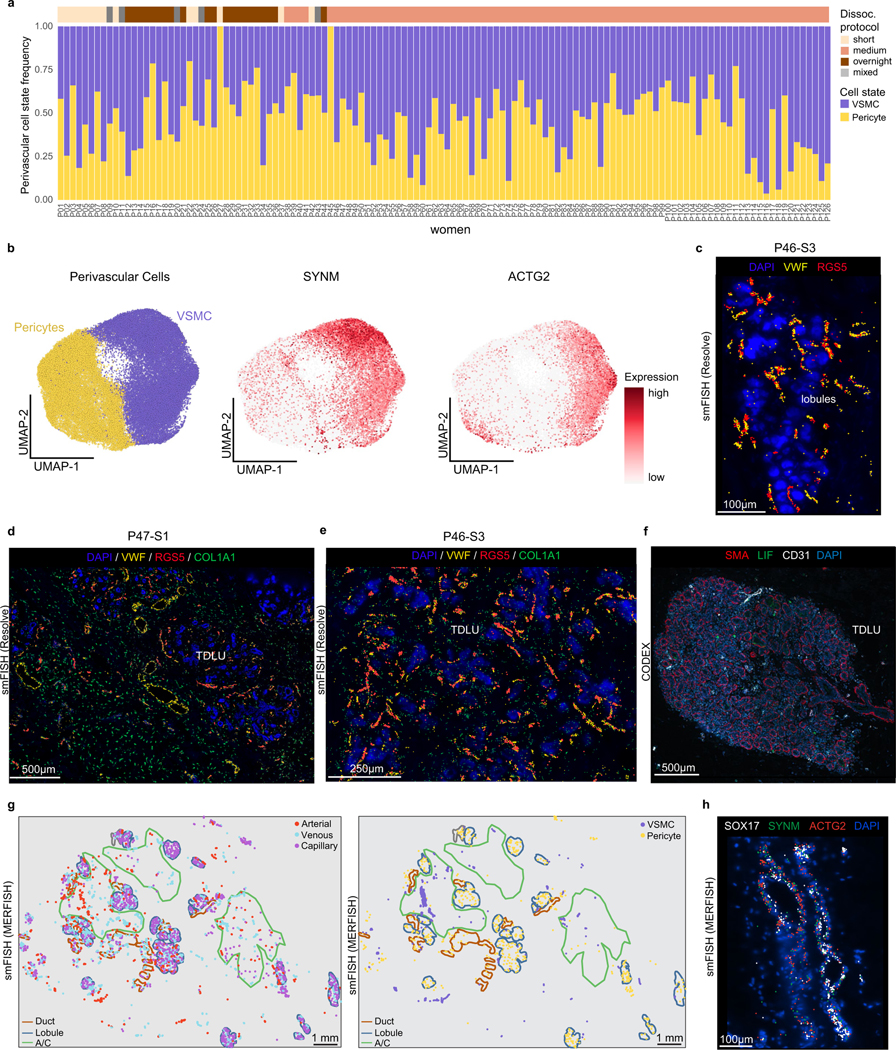
a, Stacked barplot showing the perivascular cell state frequencies across the 126 women in scRNA-seq data with top annotation bars indicating the tissue dissociation protocol. b, UMAPs of pericytes and vascular smooth muscle cells (VSMCs) and feature plots of the VSMCs marker genes (SYNM and ACTG2). c-e, smFISH (Resolve) data showing expression of pericyte marker RGS5, together with vascular marker VWF and fibroblast marker COL1A1 in lobular and ductal regions from 2 different breast tissue samples (P47-S1 and P46-S3). f, CODEX results from P131 showing vascular cells (anti-CD31) and pericytes (anti-LIF) in a TDLU region. g, smFISH MERFISH from P96 showing the spatial distribution of vascular endothelial cell states (left panel) and perivascular cell states (right panel) in different regions of human breast tissue. h, smFISH (MERFISH) data showing arteries (SOX17) and VSMCs (ATCG2 and SYNM) in breast tissue.
Extended Data Fig. 12 |. Metadata correlations with breast cell types and states.
a, Boxplots showing the major cell type frequencies across ethnicity status in the n = 69 women using Wilcoxon rank sum test (top). Significant associations of cell states with ethnicity status using Fisher’s exact test (bottom). b, Boxplots showing the major cell type frequencies across pre- and post-menopause status in the n = 71 women using Wilcoxon rank sum test (top). Significant associations of cell states with menopause status using Fisher’s exact test (bottom). c, Boxplots showing the major cell type frequencies across different age groups using Wilcoxon rank sum test, young (<50 years) and old (>50 years) for n = 76 women (top). Significant associations of cell states with age groups using Fisher’s exact test (bottom). d, Boxplots showing the major cell type frequencies across different breast density (high, low) groups in the n = 16 women using Wilcoxon rank sum test (top). Significant associations of cell states with breast density using Fisher’s exact test (bottom). e, Boxplots showing the major cell type frequencies across different BMI status in 73 women using Wilcoxon rank sum test, overweight (BMI >= 25 and < 30) and obese (BMI >= 30). f, Boxplots showing the major cell type frequencies across different parity status (nulliparous, parous) status in the n=64 women using Wilcoxon rank sum test. All p-values were calculated based on two-sided tests. Boxplots show the median with interquartile ranges (25–75%), while whiskers extend to 1.5× the interquartile range from the box.
Extended Data Fig. 13 |. Summary of the Major Cell Types and States in Breast Tissues.
This illustration summarizes all of the breast cell types and cell states that were identified in the HBCA study. a, Summary of cell lineages from cell types to cell states. b, Mapping of cell types and cell states to the four major spatial regions (Adipose, Connective, Ductal, Lobular) that were supported by the spatial technologies. Not all cell states were assigned to specific spatial regions, in cases where the data did not support their assignment. Individual figures were created with BioRender.com.
Supplementary Material
Acknowledgements
This work was supported by major funding from the Chan-Zuckerberg Initiative (CZI) SEED Network Grant (CZF2019-002432); and grants to N. Navin from the NIH National Cancer Institute (RO1CA240526, RO1CA236864, 1R01CA234496, F30CA243419), the CPRIT Single Cell Genomics Center (RP180684), the American Cancer Society (132551-RSG-18-194-01-DDC). N. Navin is an AAAS Fellow, AAAS Wachtel Scholar, Damon-Runyon Rachleff Innovator, Andrew Sabin Fellow and Jack & Beverly Randall Innovator. T.K. is funded by the NCI T32 Translational Genomics Fellowship and Rosalie B. Hite fellowship. This study was supported by the MD Anderson Sequencing Core Facility Grant (CA016672). M.P. is supported by a fellowship from the CIRM Training Grant (EDUC4-12822). The work was also supported by a Damon-Runyon Quantitative Biology Postdoctoral Fellow to R.W. We thank B. Marshall, N. Tavares and J. Cool for their guidance and support; J. Waters, S. Stingley and L. Vann from for their support on this project; J. Wiley, A. Wood, A. Alexander and A. Contreras for clinical support; A. Longworth, S. Mallya and M. Curran for their advice; Y. Lin and R. Ye at MD Anderson for help with experiments; J. Zamanian and J. Yu-Sheng Chien for assistance with data depositing; and all of the women who participated in the HBCA and donated their breast tissue to this project. We thank Enable Medicine for their help with CODEX data generation. This publication is part of the HCA (www.humancellatlas.org).
N. Navin previously served on the scientific advisory board for Resolve Biosciences (2020–2022) but did not receive any compensation. O.B., B.B.C. and N. Nikulina are employees at Akoya Biosciences. B.N. and N.K. are employees of Resolve Biosciences.
Footnotes
Reporting summary
Further information on research design is available in the Nature Portfolio Reporting Summary linked to this article.
Code availability
The scripts associated with the analysis are available at GitHub (https://github.com/navinlabcode/HumanBreastCellAtlas).
Online content
Any methods, additional references, Nature Portfolio reporting summaries, source data, extended data, supplementary information, acknowledgements, peer review information; details of author contributions and competing interests; and statements of data and code availability are available at https://doi.org/10.1038/s41586-023-06252-9.
Competing interests The other authors declare no competing interests.
Additional information
Supplementary information The online version contains supplementary material available at https://doi.org/10.1038/s41586-023-06252-9.
Data availability
The HBCA website can be viewed at http://www.breastatlas.org. The data are available at the Gene Expression Omnibus (GSE195665). The data are also available from CZI in the CELLxGENE database (https://cellxgene.cziscience.com/collections/4195ab4c-20bd-4cd3-8b3d-65601277e731).
References
- 1.Hassiotou F. & Geddes D. Anatomy of the human mammary gland: current status of knowledge. Clin. Anat 26, 29–48 (2013). [DOI] [PubMed] [Google Scholar]
- 2.Russo J, Rivera R. & Russo IH Influence of age and parity on the development of the human breast. Breast Cancer Res. Treat 23, 211–218 (1992). [DOI] [PubMed] [Google Scholar]
- 3.Gusterson BA & Stein T. Human breast development. Semin. Cell Dev. Biol 23, 567–573 (2012). [DOI] [PubMed] [Google Scholar]
- 4.Nguyen QH et al. Profiling human breast epithelial cells using single cell RNA sequencing identifies cell diversity. Nat. Commun 9, 2028 (2018). [DOI] [PMC free article] [PubMed] [Google Scholar]
- 5.Bach K. et al. Differentiation dynamics of mammary epithelial cells revealed by single-cell RNA sequencing. Nat. Commun 8, 2128 (2017). [DOI] [PMC free article] [PubMed] [Google Scholar]
- 6.Bhat-Nakshatri P. et al. A single-cell atlas of the healthy breast tissues reveals clinically relevant clusters of breast epithelial cells. Cell Rep. Med 2, 100219 (2021). [DOI] [PMC free article] [PubMed] [Google Scholar]
- 7.Russo J. & Russo IH Toward a physiological approach to breast cancer prevention. Cancer Epidemiol. Biomarkers Prev 3, 353–364 (1994). [PubMed] [Google Scholar]
- 8.Crawford YG et al. Histologically normal human mammary epithelia with silenced p16(INK4a) overexpress COX-2, promoting a premalignant program. Cancer Cell 5, 263–273 (2004). [DOI] [PubMed] [Google Scholar]
- 9.Wu SZ et al. A single-cell and spatially resolved atlas of human breast cancers. Nat. Genet 53, 1334–1347 (2021). [DOI] [PMC free article] [PubMed] [Google Scholar]
- 10.Shackleton M. et al. Generation of a functional mammary gland from a single stem cell. Nature 439, 84–88 (2006). [DOI] [PubMed] [Google Scholar]
- 11.Visvader JE & Stingl J. Mammary stem cells and the differentiation hierarchy: current status and perspectives. Genes Dev. 28, 1143–1158 (2014). [DOI] [PMC free article] [PubMed] [Google Scholar]
- 12.Ewald AJ, Brenot A, Duong M, Chan BS & Werb Z. Collective epithelial migration and cell rearrangements drive mammary branching morphogenesis. Dev. Cell 14, 570–581 (2008). [DOI] [PMC free article] [PubMed] [Google Scholar]
- 13.Zwick RK et al. Adipocyte hypertrophy and lipid dynamics underlie mammary gland remodeling after lactation. Nat. Commun 9, 3592 (2018). [DOI] [PMC free article] [PubMed] [Google Scholar]
- 14.Pal B. et al. A single-cell RNA expression atlas of normal, preneoplastic and tumorigenic states in the human breast. EMBO J. 40, e107333 (2021). [DOI] [PMC free article] [PubMed] [Google Scholar]
- 15.Gray GK et al. A human breast atlas integrating single-cell proteomics and transcriptomics. Dev. Cell 10.1016/j.devcel.2022.05.003 (2022). [DOI] [PMC free article] [PubMed]
- 16.Twigger AJ et al. Transcriptional changes in the mammary gland during lactation revealed by single cell sequencing of cells from human milk. Nat. Commun 13, 562 (2022). [DOI] [PMC free article] [PubMed] [Google Scholar]
- 17.Azizi E. et al. Single-cell map of diverse immune phenotypes in the breast tumor microenvironment. Cell 174, 1293–1308 (2018). [DOI] [PMC free article] [PubMed] [Google Scholar]
- 18.Pullan S. et al. Requirement of basement membrane for the suppression of programmed cell death in mammary epithelium. J. Cell Sci 109, 631–642 (1996). [DOI] [PubMed] [Google Scholar]
- 19.Polyak K. & Kalluri R. The role of the microenvironment in mammary gland development and cancer. Cold Spring Harb. Perspect. Biol 2, a003244 (2010). [DOI] [PMC free article] [PubMed] [Google Scholar]
- 20.Hanasoge Somasundara AV et al. Parity-induced changes to mammary epithelial cells control NKT cell expansion and mammary oncogenesis. Cell Rep. 37, 110099 (2021). [DOI] [PMC free article] [PubMed] [Google Scholar]
- 21.Rozenblatt-Rosen O, Stubbington MJT, Regev A. & Teichmann SA The Human Cell Atlas: from vision to reality. Nature 550, 451–453 (2017). [DOI] [PubMed] [Google Scholar]
- 22.Hovey RC. & Aimo L. Diverse and active roles for adipocytes during mammary gland growth and function. J. Mammary Gland Biol. Neoplasia 15, 279–290 (2010). [DOI] [PMC free article] [PubMed] [Google Scholar]
- 23.Emont MP et al. A single-cell atlas of human and mouse white adipose tissue. Nature 603, 926–933 (2022). [DOI] [PMC free article] [PubMed] [Google Scholar]
- 24.Aibar S. et al. SCENIC: single-cell regulatory network inference and clustering. Nat. Methods 14, 1083–1086 (2017). [DOI] [PMC free article] [PubMed] [Google Scholar]
- 25.Pellacani D, Tan S, Lefort S. & Eaves CJ Transcriptional regulation of normal human mammary cell heterogeneity and its perturbation in breast cancer. EMBO J. 38, e100330 (2019). [DOI] [PMC free article] [PubMed] [Google Scholar]
- 26.Stahl PL et al. Visualization and analysis of gene expression in tissue sections by spatial transcriptomics. Science 353, 78–82 (2016). [DOI] [PubMed] [Google Scholar]
- 27.Goltsev Y. et al. Deep profiling of mouse splenic architecture with CODEX multiplexed imaging. Cell 174, 968–981 (2018). [DOI] [PMC free article] [PubMed] [Google Scholar]
- 28.Menendez JA & Lupu R. Fatty acid synthase regulates estrogen receptor-α signaling in breast cancer cells. Oncogenesis 6, e299 (2017). [DOI] [PMC free article] [PubMed] [Google Scholar]
- 29.Riese DJ 2nd & Cullum, R. L. Epiregulin: roles in normal physiology and cancer. Semin. Cell Dev. Biol 28, 49–56 (2014). [DOI] [PMC free article] [PubMed] [Google Scholar]
- 30.Kannan N. et al. The luminal progenitor compartment of the normal human mammary gland constitutes a unique site of telomere dysfunction. Stem Cell Rep. 1, 28–37 (2013). [DOI] [PMC free article] [PubMed] [Google Scholar]
- 31.Zheng L. et al. Pan-cancer single-cell landscape of tumor-infiltrating T cells. Science 374, abe6474 (2021). [DOI] [PubMed] [Google Scholar]
- 32.Cheng S. et al. A pan-cancer single-cell transcriptional atlas of tumor infiltrating myeloid cells. Cell 184, 792–809 (2021). [DOI] [PubMed] [Google Scholar]
- 33.Hu Q. et al. Atlas of breast cancer infiltrated B-lymphocytes revealed by paired single-cell RNA-sequencing and antigen receptor profiling. Nat. Commun 12, 2186 (2021). [DOI] [PMC free article] [PubMed] [Google Scholar]
- 34.Wherry EJ & Kurachi M. Molecular and cellular insights into T cell exhaustion. Nat. Rev. Immunol 15, 486–499 (2015). [DOI] [PMC free article] [PubMed] [Google Scholar]
- 35.Milner JJ et al. Runx3 programs CD8+ T cell residency in non-lymphoid tissues and tumours. Nature 552, 253–257 (2017). [DOI] [PMC free article] [PubMed] [Google Scholar]
- 36.Colleluori G, Perugini J, Barbatelli G. & Cinti S. Mammary gland adipocytes in lactation cycle, obesity and breast cancer. Rev. Endocr. Metab. Disord 22, 241–255 (2021). [DOI] [PMC free article] [PubMed] [Google Scholar]
- 37.Kalucka J. et al. Single-cell transcriptome atlas of murine endothelial cells. Cell 180, 764–779 (2020). [DOI] [PubMed] [Google Scholar]
- 38.Schupp JC et al. Integrated single-cell atlas of endothelial cells of the human lung. Circulation 144, 286–302 (2021). [DOI] [PMC free article] [PubMed] [Google Scholar]
- 39.Takeda A. et al. Single-cell survey of human lymphatics unveils marked endothelial cell heterogeneity and mechanisms of homing for neutrophils. Immunity 51, 561–572 e565 (2019). [DOI] [PubMed] [Google Scholar]
- 40.Sweeney MD, Ayyadurai S. & Zlokovic BV Pericytes of the neurovascular unit: key functions and signaling pathways. Nat. Neurosci 19, 771–783 (2016). [DOI] [PMC free article] [PubMed] [Google Scholar]
- 41.Armulik A, Genove G. & Betsholtz C. Pericytes: developmental, physiological, and pathological perspectives, problems, and promises. Dev. Cell 21, 193–215 (2011). [DOI] [PubMed] [Google Scholar]
- 42.Brozovich FV et al. Mechanisms of vascular smooth muscle contraction and the basis for pharmacologic treatment of smooth muscle disorders. Pharmacol. Rev 68, 476–532 (2016). [DOI] [PMC free article] [PubMed] [Google Scholar]
- 43.Visvader JE Keeping abreast of the mammary epithelial hierarchy and breast tumorigenesis. Genes Dev. 23, 2563–2577 (2009). [DOI] [PMC free article] [PubMed] [Google Scholar]
- 44.Schmid P. et al. Pembrolizumab for early triple-negative breast cancer. N. Engl. J. Med 382, 810–821 (2020). [DOI] [PubMed] [Google Scholar]
- 45.Choi HY et al. Preoperative axillary lymph node evaluation in breast cancer: current issues and literature review. Ultrasound Q. 33, 6–14 (2017). [DOI] [PubMed] [Google Scholar]
- 46.Kothari C, Diorio C. & Durocher F. The importance of breast adipose tissue in breast cancer. Int. J. Mol. Sci 10.3390/ijms21165760 (2020). [DOI] [PMC free article] [PubMed]
- 47.Garbe JC et al. Accumulation of multipotent progenitors with a basal differentiation bias during aging of human mammary epithelia. Cancer Res. 72, 3687–3701 (2012). [DOI] [PMC free article] [PubMed] [Google Scholar]
- 48.Pelissier Vatter FA et al. High-dimensional phenotyping identifies age-emergent cells in human mammary epithelia. Cell Rep. 23, 1205–1219 (2018). [DOI] [PMC free article] [PubMed] [Google Scholar]
- 49.Fraser IS, Critchley HO, Munro MG & Broder M. Can we achieve international agreement on terminologies and definitions used to describe abnormalities of menstrual bleeding? Hum. Reprod 22, 635–643 (2007). [DOI] [PubMed] [Google Scholar]
- 50.Murrow LM et al. Mapping hormone-regulated cell-cell interaction networks in the human breast at single-cell resolution. Cell Syst. 13, 644–664 (2022). [DOI] [PMC free article] [PubMed] [Google Scholar]
References
- 51.Navin N. et al. Tumour evolution inferred by single-cell sequencing. Nature 472, 90–94 (2011). [DOI] [PMC free article] [PubMed] [Google Scholar]
- 52.Baslan T. et al. Genome-wide copy number analysis of single cells. Nat. Protoc 7, 1024–1041 (2012). [DOI] [PMC free article] [PubMed] [Google Scholar]
- 53.Lander ES et al. Initial sequencing and analysis of the human genome. Nature 409, 860–921 (2001). [DOI] [PubMed] [Google Scholar]
- 54.Schneider VA. et al. Evaluation of GRCh38 and de novo haploid genome assemblies demonstrates the enduring quality of the reference assembly. Genome Res. 27, 849–864 (2017). [DOI] [PMC free article] [PubMed] [Google Scholar]
- 55.Stuart T. et al. Comprehensive integration of single-cell data. Cell 177, 1888–1902 (2019). [DOI] [PMC free article] [PubMed] [Google Scholar]
- 56.Aran D. et al. Reference-based analysis of lung single-cell sequencing reveals a transitional profibrotic macrophage. Nat. Immunol 20, 163–172 (2019). [DOI] [PMC free article] [PubMed] [Google Scholar]
- 57.Tirosh I. et al. Dissecting the multicellular ecosystem of metastatic melanoma by single-cell RNA-seq. Science 352, 189–196 (2016). [DOI] [PMC free article] [PubMed] [Google Scholar]
- 58.Sergushichev AA An algorithm for fast preranked gene set enrichment analysis using cumulative statistic calculation. Preprint at bioRxiv 10.1101/060012 (2016). [DOI]
- 59.Yu G, Wang LG, Han Y. & He QY clusterProfiler: an R package for comparing biological themes among gene clusters. OMICS 16, 284–287 (2012). [DOI] [PMC free article] [PubMed] [Google Scholar]
- 60.Bankhead P. et al. QuPath: open source software for digital pathology image analysis. Sci Rep. 7, 16878 (2017). [DOI] [PMC free article] [PubMed] [Google Scholar]
- 61.Schneider CA, Rasband WS & Eliceiri KW NIH Image to ImageJ: 25 years of image analysis. Nat. Methods 9, 671–675 (2012). [DOI] [PMC free article] [PubMed] [Google Scholar]
- 62.A L. & M W. Classification and regression by randomForest. R News 3, 18–22 (2002). [Google Scholar]
- 63.Wei R. et al. Spatial charting of single-cell transcriptomes in tissues. Nat. Biotechnol 10.1038/s41587-022-01233-1 (2022). [DOI] [PMC free article] [PubMed]
- 64.Stringer C, Wang T, Michaelos M. & Pachitariu M. Cellpose: a generalist algorithm for cellular segmentation. Nat. Methods 18, 100–106 (2021). [DOI] [PubMed] [Google Scholar]
- 65.Satija R, Farrell JA, Gennert D, Schier AF & Regev A. Spatial reconstruction of single-cell gene expression data. Nat. Biotechnol 33, 495–502 (2015). [DOI] [PMC free article] [PubMed] [Google Scholar]
- 66.Efremova M, Vento-Tormo M, Teichmann SA & Vento-Tormo R. CellPhoneDB: inferring cell–cell communication from combined expression of multi-subunit ligand–receptor complexes. Nat. Protoc 15, 1484–1506 (2020). [DOI] [PubMed] [Google Scholar]
Associated Data
This section collects any data citations, data availability statements, or supplementary materials included in this article.
Supplementary Materials
Data Availability Statement
The HBCA website can be viewed at http://www.breastatlas.org. The data are available at the Gene Expression Omnibus (GSE195665). The data are also available from CZI in the CELLxGENE database (https://cellxgene.cziscience.com/collections/4195ab4c-20bd-4cd3-8b3d-65601277e731).


