Genes & Development 23: 2294–2306 (2009)
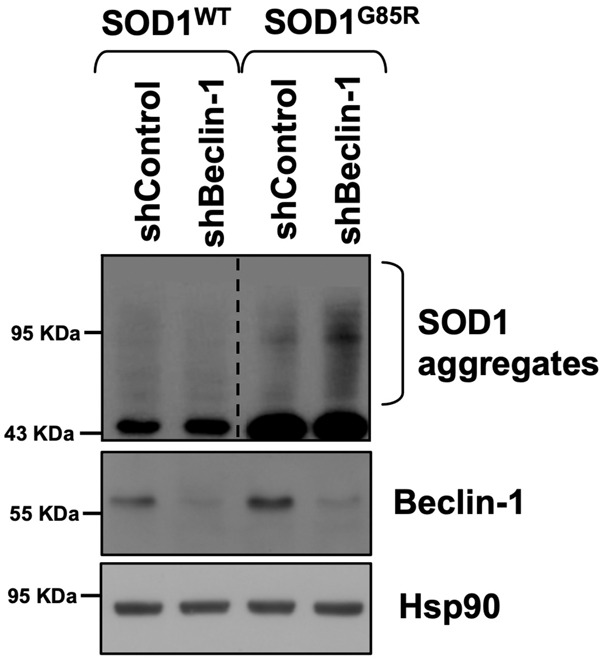
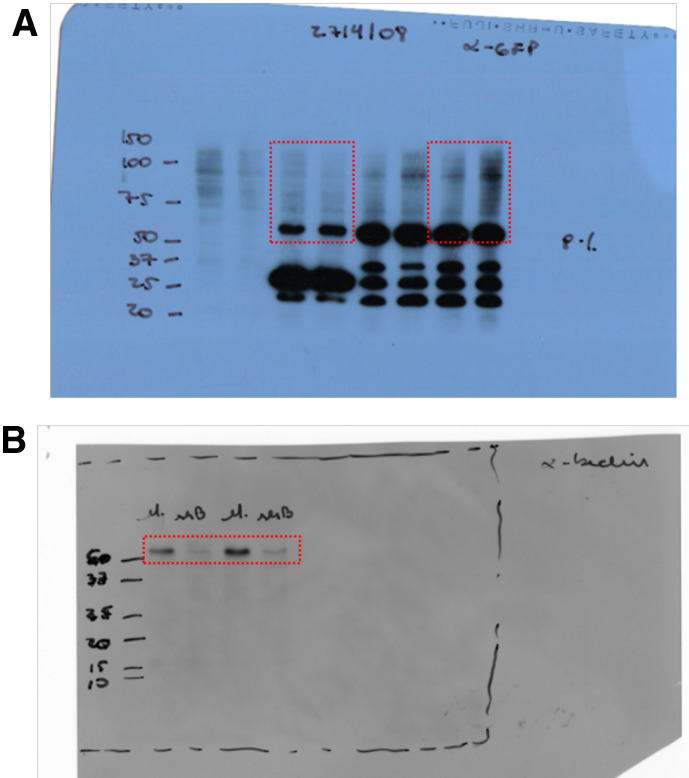
There was an unintentional mistake in Supplemental Figure S2C in the above-mentioned article in which the lanes for the SOD1WT samples and the SOD1G85R samples were spliced together without indicating splice lines. These errors were caused during the Western blot image preparation and did not alter the particular experiment's conclusions. Western blots to measure SOD1 aggregation are always run without DTT on a separate gel to see basal aggregation. This experiment included other samples with another SOD1 mutant (see the raw data in the full scan films below). The pairs include their control for comparison, but the lanes come from the same Western blot from the same film exposure as observed from the full scan. The confirmation of the Beclin-1 knockdown was performed on a separate gel. These were stable cell lines with the pLKO.1 lentiviral vectors (selection with puromycin), so the knockdown levels of Beclin-1 are maintained. Loading control with Hsp90 corresponds to this experiment. As a laboratory, we checked the knockdown regularly and reran the samples with DTT to construct the panel shown here. Importantly, the biological conclusion of the experiment is not altered by this mistake. The corrected Supplemental Figure S2C and legend are shown below.
The authors apologize for this error and any confusion it may have caused.
doi:10.1101/gad.352249.124
Supplemental Figure S2C.

NSC34 cells were transduced with control (shControl) or a shRNA lentiviral construct against Beclin-1 mRNA (shBeclin-1), and levels of Beclin-1 and mutant SOD1 aggregation were evaluated by Western blot. Data are representative of three independent experiments. Of note, protein extracts to detect SOD1 aggregates and Beclin-1 were run in separate Western blots. Dotted lines indicate the splice of an image obtained from the same film exposure.
Raw data for Supplemental Figure S2C.

(A) SOD-GFP aggregates in nonreducing SDS-PAGE for the genotypes shown in Supplemental Figure S2C. The red rectangles indicate the areas cropped to generate the figure. (B) Validation of the knockdown of Beclin-1 in a reducing SDS-PAGE.


