

Abstract
BACKGROUND/OBJECTIVES:
Body size and shape have increased over the past several decades with one in five adolescents now having obesity according to objective anthropometric measures such as weight, height, and body mass index (BMI). The gradual physical changes and their consequences may not be fully appreciated upon visual inspection by those managing the long-term health of adolescents. This study aimed to develop humanoid avatars representing the gradual changes in adolescent body size and shape over the past five decades and to align avatars with key BMI percentile cut points for underweight, normal weight, overweight, and obesity.
PARTICIPANTS/METHODS:
Participants included 223 children and adolescents between the ages of 5 and 18 years approximately representative of the race/ethnicity and BMI of the noninstitutionalized US population. Each participant completed a three-dimensional whole-body scan, and the collected data was used to develop manifold regression models for generating humanoid male and female avatars from specified ages, weights, and heights. Secular changes in the mean weights and heights of adolescents were acquired from six U.S. National Health and Nutrition Surveys beginning in 1971–1974 and ending in 2015–2018. Male and female avatars at two representative ages, 10 and 15 years, were developed for each survey and at the key BMI percentile cut points based on data from the 2015–2018 survey.
RESULTS:
The subtle changes in adolescent Americans’ body size and shape over the past five decades are represented by 24 male and female 10- and 15-year-old avatars and 8 corresponding BMI percentile cut points.
CONCLUSIONS:
The current study, the first of its kind, aligns objective physical examination weights and heights with the visual appearance of adolescents. Aligning the biometric and visual information may help improve awareness and appropriate clinical management of adolescents with excess adiposity passing through health care systems.
TRIAL REGISTRATION:
INTRODUCTION
Obesity present during adolescence poses a high risk of obesity and associated comorbidities during adulthood [1–3]. The prevalence of obesity in adolescents between the ages of 12 and 19 years was 21.5% in the Center for Disease Control and Prevention (CDC) 2015–2018 survey [4]. By contrast, the prevalence of obesity in adolescents in the CDC’s 1971–1974 survey was just 6.2% [4]. These observations foretell increasing rates of overweight and obesity in adults, a trend already well underway [5, 6]. Of the youths with obesity in the 2015–2018 survey, 40.4% had prediabetes, a precursor to type 2 diabetes [7].
Overweight and obesity in adolescents are so prevalent now that the associated greater weights and body sizes of youths have almost become the norm and may not be fully appreciated by those managing their health care. Similarly, parents may be unaware of how changes in the growth trajectory of children are placing them at increased risk for cardiovascular and metabolic disease development [8, 9].
Advances in optical imaging and computer vision technology are increasingly being used to create three-dimensional (3D) humanoid avatars of child and adolescent volunteers that can be used to quantify whole-body anthropometric dimensions [10]. Optical imaging databases with large participant samples can be used to develop prediction models that generate humanoid avatars at a specified sex, age, weight, height, and other anthropometric features [11]. The possibility thus exists to produce adolescent humanoid avatars with body size and shape features based on archival data collected over multiple decades, allowing us to visualize the evolution of the obesity epidemic in a new way.
The aim of the current study was to generate humanoid avatars that correspond to the quantitative trends in adolescent weights and heights across the last five decades. Our motivation for this effort was to bring visual awareness to the remarkable and unfavorable changes in body size and shape among American youths that correspond with unfavorable increases in weight-related comorbidities. This effort extends a complementary series of images reported by us that reflect secular trends in adult Americans’ body size and shape [11].
MATERIALS AND METHODS
Study design
The study was conducted in two phases. The first phase involved recruitment and evaluation of a child and adolescent sample at two sites (University of Hawaii Cancer Center, Honolulu, HI; Pennington Biomedical Research Center, Baton Rouge, LA) that had the approximate race/ethnicity and BMI characteristics of the general United States (US) population (NIH R01DK111698; Shape Up! Kids; Clinical Trials.Gov NCT03706612). Each participant had their weight and height measured followed by a whole-body 3D optical scan. The second phase involved development of manifold regression models that were then used to generate 3D adolescent humanoid male and female avatars at two specified ages (10 and 15 years), weights, and heights. Weights, heights, and BMIs were those reported in National Health and Nutrition Examination Survey (NHANES) documents beginning in 1971–1974 through 2015–2018 (Supplementary Table S1) [12, 13]. Waist circumference data were only reported beginning in the 1999–2002 survey.
Participants
The Shape Up! Kids study sample included 223 healthy children and adolescents (131 female) between the ages of 5 and 18 years. The sample was recruited stratified on an a priori established sex, race/ethnicity, age, and BMI Z-score plan. The characteristics of the sample are summarized in Fig. S1 and Table S2. Participants were recruited from the local communities through word-of-mouth and media advertisements. The Shape Up! Kids study was approved by the Institutional Review Boards at both centers.
Measurements
Body mass and height were measured in each participant with digital scales and stadiometers, respectively [14, 15]. Three-dimensional digital anthropometric data were collected with a Fit3D Proscanner (version 4.x; (Fit3D, San Mateo, CA, USA)). The procedure required participants to stand erect in the “A-pose” on the scanner’s platform about 3 feet from a stationary tower that housed the system’s three cameras. The platform, when activated, made one 40-second revolution while the cameras collected the participant’s image data. System software then created a 3D mesh representing the participant’s body size and shape with about two to three hundred thousand vertices and four to six hundred thousand faces depending on the size of the person.
Model and avatar development
Manifold regression models were developed as previously described in detail by Wong et al. [11]. The scans were first standardized to a template that allowed for anatomical shape comparisons across the whole sample. Principal component analysis (PCA) was then used to formulate sex-specific shape models. Manifold regression analysis followed development of the shape models and the associated equations were used to predict 3D avatars based on the sex, age, height, and weight of representative 10- and 15-year-old males and females. Data to generate the avatars was acquired from the multiple NHANES reports documenting the size and shape characteristics of nationally representative samples of the US civilian noninstitutionalized population in the following cycles: 1971–1974, 1976–1980, 1988–1994, 1999–2002, 2007–2010, and 2015–2018 [12, 13]. The illustrations presented in the text are for two of the surveys, 1971–1974 and 2015–2018; the supplement includes avatars for the full series of six surveys. We also present avatars for 10- and 15-year-old males and females at the 5th, 50th, 85th, and 95th percentiles for the 2015–2018 NHANES survey. We used the mean heights published in that survey and percentile-specific BMI levels as reported by the CDC [16] to estimate the corresponding body weights as BMI x height [2]. Avatars were then generated from the corresponding sex, age, heights, and weights. Underweight, normal weight, overweight, and obesity correspond to <5th, 5th–84th, 85th–94th, and ≥95th percentile, respectively.
Statistical methods
Baseline data on the Shape Up! Kids sample are presented as the mean ± SD. Manifold regression models were developed as previously reported [11]. PCA and manifold regression analysis were performed in R version 4.0.2 (R Core Team) [17]. All other statistical analyses were conducted using Microsoft Excel 2016 (Microsoft Corp., Redmond, Washington, USA). Data described in this manuscript will be made available upon request pending application and approval by the investigators.
RESULTS
The 1971–1974 and 2015–2018 avatars for 10-year-old males and females are shown in Fig. 1 and the full series of six avatars are shown in Figs. S2 and S3. Body mass index increased about the same over the five decades in males and females by about 3 kg/m2. The increase in BMI was mainly due to positive increments in body weight (♂ + 6.6 kg, 19.3%; ♀ + 7.3 kg, 21.6%) as only small changes were present over time in height (<3 cm). The avatars and key BMI percentiles are shown for males and females in Figs. 2 and 3, respectively. The average 10-year-old male and female in 1971–1974 were at about the 50th BMI percentile and by 2015–2018 they were both just at the 85th percentile and thus within the “overweight” range.
Fig. 1. Avatars of 10-year olds at two time points.
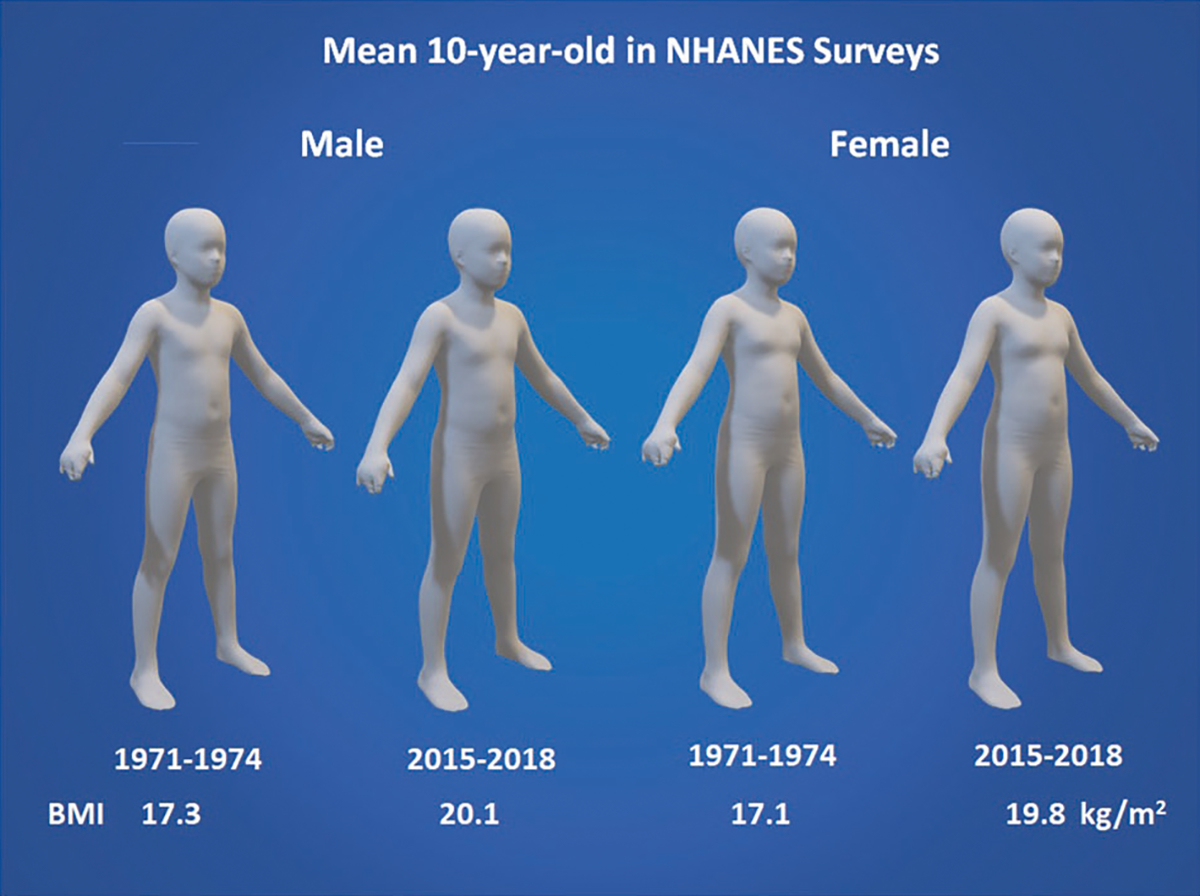
Average 10-year-old US male and female avatars generated by manifold regression analysis from weights and heights reported in the 1971–1974 and 2015–2018 NHANES surveys [12, 13].
Fig. 2. Avatars of 10-year old males at key BMI cutpoints.

The figures were generated using the average male height at age 10 present in the 2015–2018 NHANES survey [12, 13]. The weights in that survey at the 5th, 50th, 85th, and 95th percentiles were then used along with age to generate the avatars and corresponding BMIs. Underweight, normal weight, overweight, and obesity according to the CDC growth charts [16] correspond to <5th, 5th–84th, 85th–94th, and ≥95th percentile, respectively.
Fig. 3. Avatars of 10 year old females at key BMI cutpoints.

The figures were generated using the average male height at age 10 present in the 2015–2018 NHANES survey [12, 13]. The weights in that survey at the 5th, 50th, 85th, and 95th percentiles were then used along with age to generate the avatars and corresponding BMIs. Underweight, normal weight, overweight, and obesity according to the CDC growth charts [16] correspond to <5th, 5th–84th, and 85th–94th, and ≥95th percentile, respectively.
The 1971–1974 and 2015–2018 avatars for 15-year-old males and females are shown in Fig. 4 and the full series of six avatars are shown in Figs. S4 and S5. Body mass index increased again about the same in males and females, about 3–4 kg/m2, over the five decades. The increase in BMI was also mainly due to increments in body weight (♂ 12.4 kg, 20.6%; ♀ 5.8 kg, 10.2%) as only small changes were present over time in height (±2 cm). The avatars and key BMI percentiles are shown for males and females in Figs. 5 and 6, respectively. The average 15-year-old male and female in 1971–1974 were about at or minimally above the 50th BMI percentile and by 2015–2018 they were just above the 85th percentile and thus within the “overweight” range.
Fig. 4. Avatars of 10-year olds at two time points.
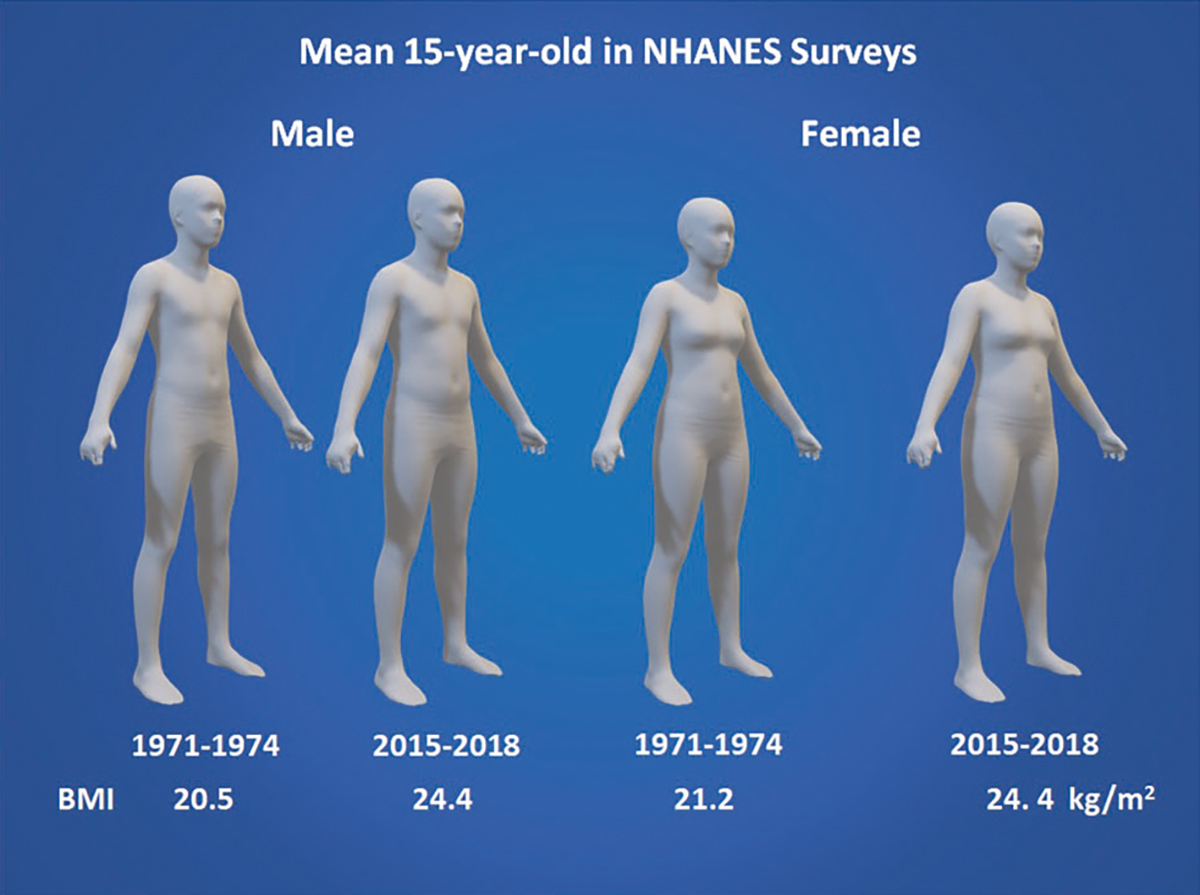
Average 15-year-old US male and female avatars generated by manifold regression analysis from weights and heights reported in the 1971–1974 and 2015–2018 NHANES surveys [12, 13].
Fig. 5. Avatars of 15-year old males at key BMI cutpoints.

The figures were generated using the average male height at age 10 present in the 2015–2018 NHANES survey [12, 13]. The weights in that survey at the 5th, 50th, 85th, and 95th percentiles were then used along with age to generate the avatars and corresponding BMIs. Underweight, normal weight, overweight, and obesity according to the CDC growth charts [16] correspond to <5th, 5th–84th, and 85th–94th, and ≥95th percentile, respectively.
Fig. 6. Avatars of 15-year old females at key BMI cutpoints.

The figures were generated using the average male height at age 10 present in the 2015–2018 NHANES survey [12, 13]. The weights in that survey at the 5th, 50th, 85th, and 95th percentiles were then used along with age to generate the avatars and corresponding BMIs. Underweight, normal weight, overweight, and obesity according to the CDC growth charts [16] correspond to <5th, 5th–84th, 85th–94th, and ≥95th percentile, respectively.
DISCUSSION
Three fundamental components are part of the standard physical examination: measurement of body weight and height, and visual “inspection” of the patient and their physical attributes. Here, for the first time, we connect the measurement and visual components: weight and height are used to derive BMI and BMI percentile or related Z-score; and visual inspection includes evaluation of the patient’s body size and shape. We show how these measured and visual components are related to each other and how they have changed together in an unhealthy direction over the past five decades. The visual transition has been slow and subtle with those at the average body size and shape in the earliest survey five decades ago looking thin by comparison to adolescents in the most recent survey. The images presented in this report provide a visual guide linked to BMI percentiles defining underweight, normal weight, overweight, and obese. Ideally, these images will help those involved in the care of adolescents to take actions aimed at preventing additional weight gain and adult obesity with its multiple adverse consequences.
Potential practical applications of these findings include raising awareness among the public and providers that what might seem like a “normal” sized adolescent in 2022 may actually represent an unhealthy body weight. In addition, these avatars could be used to emphasize that subjective assessment of a patient’s body weight and shape is not adequate to estimate health risk. Providers must measure accurate weight and height, document BMI, and consider other objective measurements of body composition when assessing a patient’s health risk. Providers should not rely on their “clinical impression” that a child is at a healthy weight or not, as public perception of what is healthy and the “norm” may in fact represent an overweight or obesity status.
LIMITATIONS
There are several limitations to the current study. Our generated avatars are racially/ethnically generic and reflect our sample (Fig. S1 and Table S2). Digital image databases are rapidly increasing in size and diversity, thus making future studies of specific groups possible. We did not extend our analyses to young children as frequent movement artifacts using current imaging technology limit the number of analyzable high-quality scans [18]. This technical limitation is being overcome with introduction of new imaging systems designed specifically for use in children. The avatars we developed were based on sex, age, weight, and height as reported in NHANES. Not all surveys included measurements for body circumferences or other anthropometric dimensions that can be used in our manifold regression models to potentially improve the image fidelity.
FUTURE DIRECTIONS
Future directions from this study include determining the sensitivity and specificity of provider and parent’s subjective assessment of these avatars. This approach could be compared across different cultures, as cultural norms may vary on what is an acceptable and “healthy” weight in children.
CONCLUSIONS
In sum, the present study presents a series of digital humanoid avatars depicting the changes in body size and shape of adolescents over the past five decades. The images connect objective size and shape measures such as body weight and BMI to corresponding visual appearance and optimally stimulate recognition and management of excess adiposity in adolescents.
Supplementary Material
FUNDING
This work was partially supported by National Institutes of Health NORC Center Grants P30DK072476, Pennington/Louisiana, P30DK040561, Harvard, and R01DK111698, Shape UP! Kids.
Footnotes
COMPETING INTERESTS
SBH is on the Medical Advisory Board of Tanita Corporation and he is an Amazon Scholar. The other authors and their close relatives and their professional associates have no financial interests in the study outcome, nor do they serve as an officer, director, member, owner, trustee, or employee of an organization with a financial interest in the outcome or as an expert witness, advisor, consultant, or public advocate on behalf of an organization with a financial interest in the study outcome.
Supplementary information The online version contains supplementary material available at https://doi.org/10.1038/s41366-022-01153-9.
Reprints and permission information is available at http://www.nature.com/reprints
DATA AVAILABILITY
Data described in the manuscript, code book, and analytic code will be made available upon request pending application and approval by the investigators.
REFERENCES
- 1.Abdullah A, Stoelwinder J, Shortreed S, Wolfe R, Stevenson C, Walls H, et al. The duration of obesity and the risk of type 2 diabetes. Public Health Nutr. 2011;14:119–26. [DOI] [PubMed] [Google Scholar]
- 2.Abdullah A, Wolfe R, Stoelwinder JU, de Courten M, Stevenson C, Walls HL, et al. The number of years lived with obesity and the risk of all-cause and cause-specific mortality. Int J Epidemiol. 2011;40:985–96. [DOI] [PubMed] [Google Scholar]
- 3.Simmonds M, Llewellyn A, Owen CG, Woolacott N. Predicting adult obesity from childhood obesity: a systematic review and meta-analysis. Obes Rev. 2016;17:95–107. [DOI] [PubMed] [Google Scholar]
- 4.Fryar CD, Carroll MD, Afful J. Prevalence of overweight, obesity, and severe obesity among children and adolescents aged 2–19 years: United States, 1963–1965 through 2017–2018. NCHS Health E-Stats 2020. [Google Scholar]
- 5.Fryar CD, Carroll MD, Afful J. Prevalence of overweight, obesity, and severe obesity among adults aged 20 and over: United states, 1960–1962 through 2017–2018. NCHS Health E-Stats 2020. [Google Scholar]
- 6.Heymsfield SB, Wadden TA. Mechanisms, pathophysiology, and management of obesity. N Engl J Med. 2017;376:254–66. [DOI] [PubMed] [Google Scholar]
- 7.Liu J, Li Y, Zhang D, Yi SS, Liu J. Trends in prediabetes among youths in the us from 1999 through 2018. JAMA Pediatr. 2022. 10.1001/jamapediatrics.2022.0077. [DOI] [PMC free article] [PubMed] [Google Scholar]
- 8.Dietz WH, Robinson TN. Clinical practice. Overweight children and adolescents. NEngl J Med. 2005;352:2100–9. [DOI] [PubMed] [Google Scholar]
- 9.l’Allemand-Jander D Clinical diagnosis of metabolic and cardiovascular risks in overweight children: Early development of chronic diseases in the obese child. Int J Obes. 2010;342:S32–6. [DOI] [PubMed] [Google Scholar]
- 10.Wong MC, Ng BK, Kennedy SF, Hwaung P, Liu EY, Kelly NN, et al. Children and adolescents’ anthropometrics body composition from 3-d optical surface scans. Obesity. 2019;27:1738–49. [DOI] [PMC free article] [PubMed] [Google Scholar]
- 11.Wong MC, McCarthy C, Fearnbach N, Yang S, Shepherd J, Heymsfield SB. Emergence of the obesity epidemic: 6-decade visualization with humanoid avatars. Am J Clin Nutr. 2022;115:1189–93. 10.1093/ajcn/nqac005. [DOI] [PMC free article] [PubMed] [Google Scholar]
- 12.Fryar CD, Kruszon-Moran D, Gu Q, Carroll M, Ogden CL. Mean body weight, height, waist circumference, and body mass index among children and adolescents: United states, 1999–2018. Natl Health Stat Report 2021:1–24. [PubMed] [Google Scholar]
- 13.Ogden CL, Fryar CD, Carroll MD, Flegal KM. Mean body weight, height, and body mass index, United States 1960–2002. Adv Data. 2004:1–17. [PubMed] [Google Scholar]
- 14.Ng BK, Sommer MJ, Wong MC, Pagano I, Nie Y, Fan B, et al. Detailed 3-dimensional body shape features predict body composition, blood metabolites, and functional strength: the shape up! Studies. Am J Clin Nutr. 2019;110:1316–26. [DOI] [PMC free article] [PubMed] [Google Scholar]
- 15.Wong MC, Ng BK, Tian I, Sobhiyeh S, Pagano I, Dechenaud M, et al. A pose-independent method for accurate and precise body composition from 3d optical scans. Obesity. 2021;29:1835–47. [DOI] [PMC free article] [PubMed] [Google Scholar]
- 16.CDC Division of Nutrition, Physical Activity, and Obesity . Growth chart training: Overview of the cdc growth charts: Division of Nutrition, Physical Activity, and Obesity, National Center for Chronic Disease Prevention and Health Promotion, U.S. Department of Health and Human Services; 2021. https://www.cdc.gov/nccdphp/dnpao/growthcharts/training/overview/page1.html. [Google Scholar]
- 17.R Core Team. R: a language and environment for statistical computing Vienna, Austria: R Foundation for Statistical Computing; 2021. https://www.R-project.org/. [Google Scholar]
- 18.Kennedy S, Smith B, Sobhiyeh S, Dechenaud ME, Wong M, Kelly N, et al. Digital anthropometric evaluation of young children: comparison to results acquired with conventional anthropometry. Eur J Clin Nutr. 2022;76:251–60. [DOI] [PMC free article] [PubMed] [Google Scholar]
Associated Data
This section collects any data citations, data availability statements, or supplementary materials included in this article.
Supplementary Materials
Data Availability Statement
Data described in the manuscript, code book, and analytic code will be made available upon request pending application and approval by the investigators.