Abstract
Medical treatment with low ozone concentrations proved to exert therapeutic effects in various diseases by inducing a cytoprotective antioxidant response through the nuclear factor erythroid derived-like 2 (Nrf2) transcription factor pathway. Low ozone doses are increasingly administered to oncological patients as a complementary treatment to mitigate some adverse side-effects of antitumor treatments. However, a widespread concern exists about the possibility that the cytoprotective effect of Nrf2 activation may confer drug resistance to cancer cells or at least reduce the efficacy of antitumor agents. In this study, the effect of low ozone concentrations on tamoxifen-treated MCF7 human breast cancer cells has been investigated in vitro by histochemical and molecular techniques. Results demonstrated that cell viability, proliferation and migration were generally similar in tamoxifen-treated cells as in cells concomitantly treated with tamoxifen and ozone. Notably, low ozone concentrations were unable to overstimulate the antioxidant response through the Nfr2 pathway, thus excluding a possible ozone-driven cytoprotective effect that would lead to increased tumor cell survival during the anti-neoplastic treatment. These findings, though obtained in an in vitro model, support the hypothesis that low ozone concentrations do not interfere with the tamoxifen-induced effects on breast cancer cells.
Key words: MCF7 cells, oxidative stress, Nrf2, cell death, cell migration
Introduction
Tamoxifen (TAM) is a selective estrogen receptor modulator that is widely used for the treatment or prevention of estrogen receptor-positive breast cancer, as well as for chemoprevention in women at high risk of developing breast cancer.1 Although the anti-tumoral mechanisms of TAM are not completely understood, it has been demonstrated that it induces an increase of reactive oxygen species (ROS) which plays a primary role in inhibiting cell proliferation while inducing cell death in breast cancer cells.2,3
Medical treatment with low ozone (O3) concentrations (generally ranging from 10 to 50 µg O3/mL O2) proved to exert therapeutic effects in various pathological conditions by promoting antioxidant and anti-inflammatory responses, wound healing, angiogenesis and tissue protection from injury (e.g.,4-10). Most of these beneficial effects rely on O3-driven antioxidant activity: low O3 concentrations are able to induce an oxidative “eustress”11 thus activating the nuclear factor erythroid derived-like 2 (Nrf2) transcription factor that, after detaching from its cytoplasmic inhibitor Kelch-like ECH-associated protein1 (Keap1), migrates into the nucleus where it promotes the expression of several genes under the control of antioxidant response element (ARE) enhancers. As a result, many antioxidant factors are synthesized that, through a cascade of molecular events, give rise to the cytoprotective response.4,12,13
In the medical practice, low O3 doses are increasingly administered to oncological patients as a complementary treatment due to the observed efficacy of O3 in mitigating some adverse side-effects of antitumor therapy.14-16 However, widespread concern exists about the possibility that the cytoprotective effects of Nrf2 activation may confer drug resistance to cancer cells or at least reduce the efficacy of antitumor drugs.17 On the other hand, some studies demonstrated the ability of O3 to cause direct injury to different tumor cells or to enhance the efficacy of the antitumor treatments.14,18-20 Thus, the suitability of medical O3 administration to oncologic patients still remains an open issue.
The present investigation aims at exploring the effect of low O3 concentrations on TAM-treated MCF7 human breast cancer cells, a cellular model widely used for in vitro studies as these cells retain several peculiar features of the mammary epithelium and are a well-recognized target for TAM since they express estrogen receptors.21 This simple in vitro model allowed the histochemical and molecular analysis of cell viability, proliferation and antioxidant response in TAM-treated cells exposed to low O3 concentrations under strictly controlled experimental conditions.
Materials and Methods
Cell culture and treatments
Human breast cancer MCF7 cells (ECACC 86012803) were grown in Eagle’s minimum essential medium supplemented with 10% heat inactivated fetal bovine serum (FBS), 2 mM L-glutamine and 1% penicillin/streptomycin (all reagents were purchased from Gibco, Waltham, MA, USA) at 37°C in a 5% CO2 humidified atmosphere in T75 flasks. When sub-confluent (80%), the cells were detached using 0.25% trypsin/EDTA (Gibco) and seeded for specific experiments.
MCF7 cells were treated with 25 µM TAM (Sigma T9262, Milan, Italy) or gaseous O2-O3 mixtures or both. This TAM concentration was chosen because it proved to reduce cell viability by about 40% in comparison with the control (untreated) cells at 24 h post-treatment, thus reducing cell viability while maintaining an appropriate number of living cells to carry out the analyses.
TAM was dissolved in dimethyl sulfoxide (DMSO, Sigma), administered to the cells at increasing concentrations and incubated for 24 h at 37°C in a 5% CO2 atmosphere. To evaluate the combined effects of TAM and O2-O3 mixture, cell samples were first treated with TAM for 24 h and then exposed to O3 (as described below) before the analyses.
O3 was produced from medical grade O2 by an OZO2 FUTURA apparatus (Alnitec, Cremosano, CR, Italy); the apparatus allows the real-time photometric control of the O3 concentration and gas flow rate. O3 was used at the concentrations of 10 or 20 µg O3/mL O2, which are currently administered in the clinical practice and already proved to be non-toxic for various cultured cells and tissues.22-27 For Western blot, samples of 4 x 10⁶ cells were suspended in 10 mL medium into a 20 mL polypropylene syringe and an equal volume of gas (10 mL) was drawn into the syringe using a sterile filter (Alnitec); then, the cell suspension was gently shaken for 10 min,28 incubated for 30 min at 37°C (Nrf2 requires a short time to move from cytoplasm to the nucleus after O3 treatment, as demonstrated in13), centrifuged at 1500 rpm for 5 min and finally stored at -80°C until analysis. For MTT assay, cells were treated with gas as described above and then seeded in 96-multi-well plates. For S-phase assessment and the wound healing assays, the cells were seeded on glass coverslips and then treated with gas as described in29. Some cell samples underwent the same procedure followed for the gas treatment but they were exposed to air, in order to evaluate possible handling effects, and used as control.
MTT assay
MTT assay was performed after treatment with TAM or O2-O3 mixtures or both. MCF7 cells were seeded in flat-bottom 96 multi-well plates at the density of 5 x 10³ cells/well. Five wells for each condition were seeded and the assay was performed on samples derived from three independent experiments.
MTT assay was performed after 24 h and 48 h from any treatment. Briefly, the medium was replaced with 100 μL of 0.5 mg/mL MTT (Sigma) in culture medium and incubated for 4 h at 37°C in an incubator. Then, MTT solution was removed, formazan crystals were dissolved in 100 μL of DMSO and the absorbance was measured at 570 nm with a spectrophotometer microplate reader (ChroMate; RayBiotech, Peachtree Corners, GA, USA). The results were reported as percentages with respect to the control value (set as 100%).
S-phase evaluation
For S-phase evaluation, samples of 8 x 10⁴ cells were seeded on 24 mm x 24 mm glass coverslips an allowed to adhere for 24 h; then they were treated with TAM, TAM+air- or TAM+O3 as previously described (untreated samples were used as controls). 24 h post-treatment, the cells were pulse-labelled with 20 µM BrdU (Sigma) at 37°C for 30 min and fixed with cold 70% ethanol.
To partially denature DNA, the cells on coverslips were incubated with 2 N HCl for 20 min at room temperature, then neutralized for 3 min with 0.1 M sodium tetraborate (pH 8.2) (Sigma). Samples were washed with phosphate-buffered saline (PBS) and permeabilized with PBS containing 0.1% bovine serum albumin and 0.05% Tween-20 (Sigma) for 15 min, then incubated for 1 h with a mouse monoclonal antibody recognizing BrdU (BD Diagnostics, Franklin Lakes, NJ, USA) diluted 1:20 in PBS. Following two washes in PBS, the cells were incubated for 1 h with an Alexa Fluor 488-conjugated anti-mouse secondary antibody (Molecular Probes, Invitrogen, Milan, Italy) diluted 1:200, washed twice in PBS, and stained for DNA with 0.1 µg/mL Hoechst 33342 for 10 min (Abcam, Cambridge, UK) in PBS. Samples were placed on glass slides and finally coverslipped with PBS/glycerol 1:1 solution.
The percentage of BrdU-positive cells was assessed in 30 randomly selected fields (40x) for each experimental condition. Observation was performed using an Olympus BX51 microscope (Olympus Italia S.r.l., Segrate, MI, Italy) equipped with a 100W mercury lamp, under the following spectral conditions: 450-480 nm excitation filter (excf), 500 nm dichroic mirror (dm), and 515 nm barrier filter (bf) for Alexa Fluor 488; 330-385 nm excf, 400 nm dm, and 420 nm bf, for Hoechst 33342. Images were acquired with a QICAM Fast 1394 Digital Camera (QImaging, Surrey, BC, Canada) and processed with Image-Pro Plus software (Media Cybernetics, Inc., Rockville, MD, USA). Manual cell counting was performed in samples from three independent experiments by two independed operators.
Mitotic index
Cell samples on glass coverslips were prepared and treated with TAM, TAM+air or TAM+O3 as described in the previous subsection (untreated MCF7 cells were used as controls). 24 h after treatment, the cells were fixed with 70% ethanol for 30 min, washed in PBS and stained for DNA with 0.1 μg/mL Hoechst 33342 (Abcam) in PBS for 10 min. The samples were finally placed on glass slides and mounted in PBS/glycerol (1:1). The percentage of mitotic cells was assessed in 30 randomly selected fields (40x) for each experimental condition. An Olympus BX51 microscope (Olympus Italia S.r.l.) equipped with a 100W mercury lamp was used under the appropriate light excitation and emission conditions for Hoechst 33342. Images were recorded with a QICAM Fast 1394 Digital Camera (QImaging) and processed with Image-Pro Plus software (Media Cybernetics, Inc.). Manual cell counting was performed in samples from three independent experiments by two independed operators.
Wound healing assay
For the wound-healing assay, 3 x 10⁵ cells were seeded onto 24 mm x 24 mm glass coverslips. After 24 h, the confluent cell mono-layers were scratched with a 200 µL sterile pipette tip and then treated with TAM, TAM+air or TAM+O3 (control samples were left untreated). FBS was then omitted from the medium to exclude the effect of cell proliferation. To evaluate cell migration, images were taken at 0, 6, and 24 h post-treatment using an inverted microscope (Leica DMIL, Leica Microsystems S.r.l., Buccinasco, MI, Italy) equipped with a camera (Optika Microscopes, Ponteranica, BG, Italy). The scratched area was measured in 4 randomly chosen fields (4x) in three independent experiments, for a total of 12 fields/experimental condition. The value of the cell-free area was expressed as a percentage of the value at time 0 (considered as 100%).
Western blot
Western blot for Nrf2 was carried out on MCF7 cell pellets obtained as described above and stored at -80°C after 30 min from the treatment. The pellets were lysed in 1% Triton X-100 solution supplemented with 100 mM phenylmethylsulfonyl fluoride (PMSF), and a cocktail of protease inhibitors (Sigma). Protein quantification was then performed with Pierce BCA Protein Assay Kit (Thermo Fisher, Milan, Italy) according to the manufacturer’s protocol. Then, equal amounts of proteins were separated by sodium dodecyl sulphate-polyacrylamide gel electrophoresis (SDS-PAGE) and transferred on a nitrocellulose membrane (Amersham Biosciences, Little Chslfont, UK). The membrane was saturated with 5% bovine serum albumin (BSA, Sigma) and 0.05% of sodium azide, washed in PBS Tween 0.1% and incubated overnight with anti-Nrf2 antibody (Abcam) diluted 1:500 in PBS and anti-alpha-tubulin antibody (Merck Millipore, Milan, Italy) diluted 1:1000 in PBS. The membrane was then washed and incubated with the appropriate horseradish peroxidase-conjugated secondary antibodies (Perkin-Elmer, Milan, Italy) diluted 1:20,000 in PBS for 1 h at room temperature. Western blot images were acquired at ChemiDoc (BioRad, Hercules, CA, USA) and further analyzed using ImageLab (BioRad) software. The tests were performed in three independent experiments and untreated cells were used as control.
Statistical analysis
Data for each variable were pooled according to the experimental condition and presented as mean ± SEM. Statistical significance was assessed by the one-way analysis of variance (ANOVA) test (for S-phase evaluation and mitotic index) and by the Kruskal-Wallis test (for MTT assay, wound healing assay, and Western blot). In case of significance, the Mann Whitney test was used for pairwise comparisons. Statistical significance was set at p≤0.05.
Results
MTT assay
MTT assay was used to assess the mitochondrial activity as a measure of cell viability after treatment with TAM or O2-O3 mixtures or after their simultaneous administration. To test the combined effects of TAM and O3, it was necessary that TAM efficiently reduced cell viability at a suitable extent to enable the experimental procedures. Therefore, a TAM concentration able to reduce cell viability by about 40% in comparison with the untreated control cells at 24 h was used. Therefore, MCF7 cells were treated with different concentrations of TAM (Figure 1), and the concentration of 25 µM was selected (control vs 25 µM TAM, p=0.04) for all the experiments.
In order to confirm the safety of the selected low O3 concentrations on MCF7 cells, cell samples were exposed to O2-O3 mixtures at concentrations of 10 µg O3/mL O2 or 20 µg O3/mL O2 (which are usually administered in clinical practice), and the cell viability was evaluated 24 and 48 h post-treatment (Figure 2). The values were compared to those of control cells and to those of cells undergoing the same handling as O3-treated samples but exposed only to air.
Figure 1.
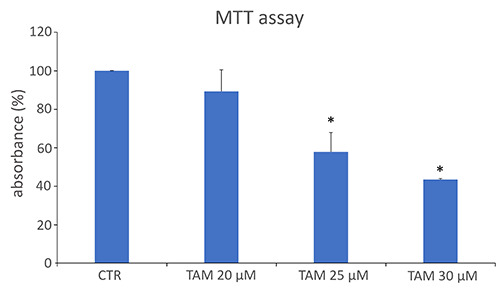
MTT mean values ± SEM (as a measure of cell viability) in MCF7 control cells (CTR) and cells treated with increasing concentrations of tamoxifen (TAM). The absorbance values were normalized to the control, which was fixed as 100. *Statistically significant difference in comparison with control.
Both O3 concentrations did not affect cell viability at 24 h (p=0.06 and p=0.40, respectively) and 48 h (p=0.75 and p=0.92 respectively) post-treatment. In order to reveal the possible interference between low O3 concentrations and TAM cytotoxic effect, MCF7 cells were treated with both TAM and O2-O3 mixtures and the resulting cellular viability was assessed after 24 h and 48 h from the concomitant treatment (Figure 3). After 24 h, a statistically significant decrease in cell viability was observed in TAM+air, TAM+10 µg O3 and TAM+20 µg O3 samples in comparison with control (p=0.03 for all treatments), and such a decrease was comparable to that obtained after TAM treatment alone. The same results were observed also after 48 h (p=0.02 for all treatments).
S-phase evaluation
5-Bromo-2′-deoxyuridine (BrdU) is a thymidine analogue that, being incorporated into newly synthesized DNA, labels S-phase cells and allows their detection and quantification after specific immunostaining. In our samples, BrdU-positive cell nuclei were green-fluorescing, while nuclear DNA was counterstained in blue with Hoechst 33342 (Figure 4). After 24 h from the gas exposure, a significant decrease in the percentage of BrdU-positive cell nuclei was observed in TAM and TAM+air treated samples in comparison with control (untreated) cells (p<0.001 for both samples). No significant differences were observed between controls and cells treated with TAM+O3 10 µg (p=0.32) or TAM+O3 20 µg (p=0.09).
Mitotic index
Proliferation rate of control samples and TAM, TAM+air- and TAM+O3-treated MCF7 cells was assessed also by evaluating the mitotic index (i.e., the number of mitotic figures/total cell nuclei × 100) after DNA staining with Hoechst 33342 (Figure 5). All treated samples showed a significant decrease in the percentage of mitotic cells compared to controls (TAM, p=0.01; TAM+air, p=0.04; TAM+10 µg O3, p=0.04; TAM+20 µg O3, p=0.04).
Wound healing assay
The migration capability of TAM, TAM+air- and TAM+O3-treated cells with respect to control was evaluated using a wound-healing assay (Figure 6).
After 6 h, cells treated with TAM+10 µg O3 showed a significant decrease in the percentage of cell-free area (p=0.03), which further decreased after 24 h (p=0.003). The other treatments, namely TAM, TAM+air and TAM+20 µg O3, did not significantly influenced the cell capability to migrate with respect to control at both 6 h (p=0.69, p=0.94 and p= 0.38, respectively) and 24 h (p=0.69, p=0.81 and p=0.47, respectively).
Western blot
Given the pivotal role of Nrf2 as a critical regulator of the cellular stress response and, in particular, as the lead activator of O3-driven antioxidant response, its enhancement was evaluated by Western blot. The expression of Nrf2 significantly increased in all treated samples in comparison to control (TAM, p=0.03; TAM+air, p=0.04; TAM+10 µg O3, p=0.04; TAM+20 µg O3, p=0.04) (Figure 7), but values of treated samples were statistically similar with each other (p>0.05 for all comparisons).
Discussion
This study explored the combined effects of TAM and O3 on the human breast cancer cell line MCF7, aiming to contribute to the debate on the possible cytoprotective effects of low O3 concentrations on cancer cells under antitumor treatment. The simplified in vitro model chosen for this investigation cannot obviously give a conclusive answer, because the complexity of a living organism and the peculiarity of the tumor microenvironment are not fully reproduced;30,31 however, these experiments, performed under defined experimental conditions, provide basic cellular and molecular data that may contribute to mechanistically elucidate the reported positive effects of the O3 administration to oncologic patients.14-16 It is well-established that TAM induces cell death and reduces proliferation in MCF7 cells (see e.g., 2,32-34). Consistently, we found a concentration-dependent reduction in MCF7 cell viability following treatment with TAM. This allowed us to select a TAM concentration suitable to significantly reduce cell viability while maintaining an appropriate number of living cells to perform our investigation.
Figure 2.
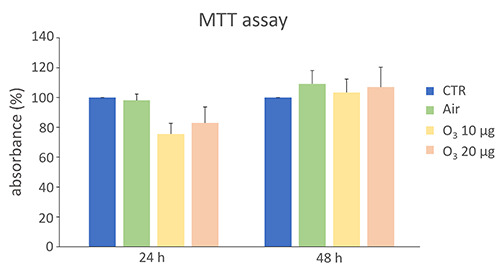
MTT mean values ± SEM (as a measure of cell viability) in MCF7 control cells (CTR) and cells treated with air or O2-O3 mixtures after 24 h and 48 h from gas exposure. The absorbance values were normalized to the control, which was fixed as 100. No statistically significant difference was found in comparison with control.
Figure 3.
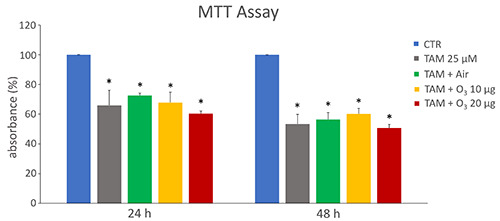
MTT mean values ± SEM of MTT absorbance (as a measure of cell viability) in control (CTR) and treated MCF7 cells after 24 h and 48 h from treatment. The absorbance values were normalized to the control, which was fixed as 100. TAM, tamoxifen; *statistically significant difference in comparison with control.
Figure 4.
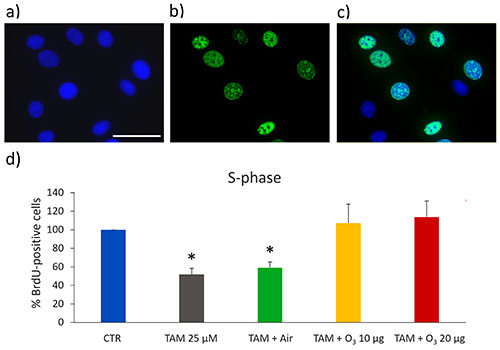
a-c) Representative fluorescence microscopy images of MCF7 cells stained for DNA with Hoechst 33342 (blue) (a), immunolabelled for BrdU (green) (b), and merged (c); scale bar: 50 μm. d) Mean values ± SEM of percentages of BrdU-positive cells 24 h after treatment. The values were normalized to the control, which was fixed as 100. TAM, tamoxifen; *statistically significant difference in comparison with control (CTR).
The O3 concentrations chosen for this study (10 and 20 µg O3/mL O2) are widely used in clinical practice and their effects have been investigated in various cell types, demonstrating that they are non-toxic.22-27 These low concentrations proved to be safe also for the MCF7 cell line, excluding any interference with cells’ viability and thus enabling their use in our study. When TAM and O3 were concomitantly administered, the observed lowering in cell viability was similar to that occurring after treatment with TAM alone, thus demonstrating that, under our experimental conditions, both O3 concentrations were unable to interfere with the cytotoxic effect of the antitumor drug.
The possible interference of O3 administration with TAM on cell proliferation was evaluated by assessing the rate of DNA-duplicating (S-phase) cells and mitotic cells. A significant decrease in S-phase MCF7 cells after TAM treatment was found, according to previous studies demonstrating that TAM induces an arrest of the cell cycle at G0/G1 phase.2,35,36 On the other hand, in cell samples treated with TAM+10 or 20 µg O3 a significant increase of S-phase cells occurred in comparison with samples treated with TAM only, reaching the control values. Looking at the mitotic index, a drastic decrease of mitotic cells was found in TAM-treated samples according to the well-known anti-proliferative effect of this drug2,33 and similarly low values were found in TAM+O3-treated cells, thus excluding a pro-proliferative effect of both low O3 concentrations. Therefore, the increase in S-phase cells observed in TAM+O3-treated cells should not be interpreted as a sign of proliferation recovery but as due to an S-phase block in cell cycle progression. Accordingly, in a recent work it has been demonstrated that low O3 concentrations may induce an increase in the percentage of S-phase cells in human hepatocellular carcinoma cells.37
The migration capability of cancer cells is a key factor for their invasive potential and the combined effect of TAM and O3 on this functional aspect was taken into consideration. MCF-7 cells are weakly metastatic cells with low invasive potential38 and this is due to their cytoskeletal pattern.39 TAM treatment has been shown to reduce the spreading rate in MCF7 by influencing biomechanical parameters and cytoskeletal organization.40 In our study, no statistically significant reduction in cell migration capability was found in TAM-treated MCF7 cells, although a tendency to decline was observed; this discrepancy with other findings in the literature could be due to the different experimental conditions used. Interestingly, when TAM was concomitantly administered with O3, TAM+20 µg O3-treated cells showed similar values as TAM-treated cells, whereas TAM+10 µg O3-treated cells showed a significant increase in their migration rate. It has been reported that small local changes in the amount of ROS (as it occurs after exposure to low O3 concentrations) act on cytoskeletal organization stimulating actin polymerization41-43 and promoting cell adhesion.44,45 In particular, 10 µg O3 induced cytoskeletal reorganization and adhesion in HeLa cells22 as well as the formation of cell surface protrusions in fibroblasts.26 Moreover, low O3 concentrations proved to increase the membrane deformability of blood cells.46,47 All these effects are known to promote cell motility, and may play a role in the increased migration capability observed in MCF7 cells concomitantly treated with TAM and 10 µg O3.
Figure 5.
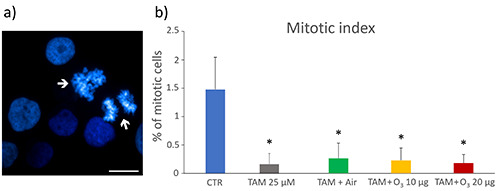
a) Representative fluorescence microscopy image of control MCF7 cells stained for DNA with Hoechst 33342 (blue), the arrows indicate mitotic figures; scale bar: 25 μm. b) Mean values ± SEM of percentages of mitotic cells 24 h after the treatment. TAM, tamoxifen; *statistically significant difference in comparison with control (CTR).
Figure 6.
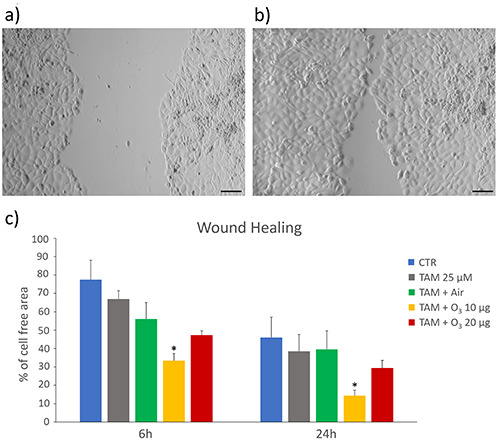
Wound healing assay. a,b) Representative images of MCF7 cells at 6 h (a) and 24 h (b); scale bars: 50 µm. c) Mean values ± SEM of percentages of cell-free areas of control (CTR), and treated cells at 6 h and 24 h. TAM, tamoxifen; *statistically significant difference in comparison with control.
Figure 7.
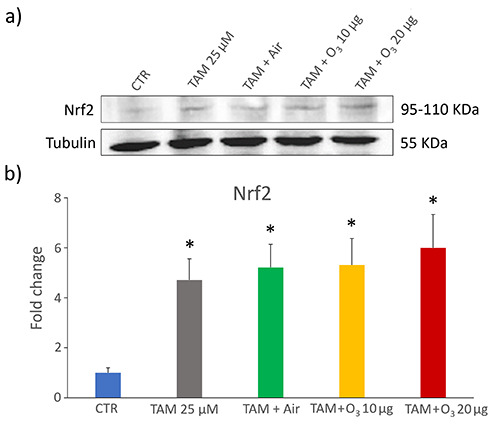
Western blot of Nrf2 protein in control (CTR) and treated MCF7 cells. a) Representative Western blot experiment. b) Mean values ± SEM of Nrf2 levels; data were normalized with respect to a housekeeping protein (tubulin) and expressed as proportional to CTR sample. TAM, tamoxifen; *statistically significant difference in comparison with control.
Since TAM is known to induce marked ROS increase in MCF7 cells2 while low O3 concentrations are able to counteract oxidative stress mainly through Nrf2 activation,13,48 it was crucial to clarify the possible interference of O3 with this antitumor drug by evaluating Nrf2 levels. Generally, breast cancer cells are characterized by a low or undetectable expression of Nrf2 compared with normal mammary epithelial cell lines.49,50 According to its strong oxidative potential, TAM has been found to induce increased Nrf2 expression in breast cancer cells in vivo.51,52 Consistently, in our in vitro model, an increase in Nrf2 was found in TAM-treated MCF7 cells, but the addition of low O3 concentrations to TAM did not change the Nfr2 level, thus excluding the induction of a powerful antioxidant response and a consequent resistance to the antitumor treatment. This finding is also consistent with the results on cell viability and proliferation. Therefore, the concomitant treatment with TAM and O3 does not mimic what happens in TAM-resistant MCF7, whose unresponsiveness is due to the abnormally high expression of Nrf2, which upregulates the antioxidant capacity, thus improving cell survival.52,53 It is worth noting that 10 and 20 µg O3 did not increase Nrf2 level in microglial cells previously treated with dimethyl fumarate, a Nrf2-activating drug,25 thus suggesting that these low O3 concentrations are generally unable to overstimulate the Nrf2-pathway in already activated cells.
Taken together, the results of the present in vitro study demonstrate that, under our experimental conditions, low O3 concentrations administered to TAM-treated human breast cancer MCF7 cells do not interfere with the cytotoxic oxidative stress induced by TAM. In fact, cell viability, proliferation and migration were similar in cells treated with TAM alone as in those exposed to the concomitant treatment with TAM and O3, except from samples treated with 10 ug O3, which showed higher migration ability. Importantly, low O3 concentrations proved to be unable to overstimulate the antioxidant response through the Nfr2 pathway, thus excluding a possible O3-driven cytoprotective effect that would lead to increased cell survival to TAM treatment.
Funding Statement
Funding: this research received no external funding.
References
- 1.Fisher B, Costantino JP, Wickerham DL, Redmond CK, Kavanah M, Cronin WM, et al. Tamoxifen for prevention of breast cancer: report of the National Surgical Adjuvant Breast and Bowel Project P-1 Study. J Natl Cancer Inst 1998;90:1371-88. [DOI] [PubMed] [Google Scholar]
- 2.Li W, Shi X, Xu Y, Wan J, Wei S, Zhu R. Tamoxifen promotes apoptosis and inhibits invasion in estrogen-positive breast cancer MCF-7 cells. Mol Med Rep 2017;16:478-84. [DOI] [PubMed] [Google Scholar]
- 3.Ahmed NS, Samec M, Liskova A, Kubatka P, Saso L. Tamoxifen and oxidative stress: an overlooked connection. Discov Oncol 2021;12:17. [DOI] [PMC free article] [PubMed] [Google Scholar]
- 4.Re L, Mawsouf MN, Menéndez S, León OS, Sánchez GM, Hernández F. Ozone therapy: clinical and basic evidence of its therapeutic potential. Arch Med Res 2008;39:17-26. [DOI] [PubMed] [Google Scholar]
- 5.Elvis AM, Ekta JS. Ozone therapy: A clinical review. J Nat Sci Biol Med 2011;2:66-70. [DOI] [PMC free article] [PubMed] [Google Scholar]
- 6.Bocci V. How a calculated oxidative stress can yield multiple therapeutic effects. Free Radic Res 2012;46:1068-75. [DOI] [PubMed] [Google Scholar]
- 7.Wang L, Chen H, Liu XH, Chen ZY, Weng XD, Qiu T, et al. Ozone oxidative preconditioning inhibits renal fibrosis induced by ischemia and reperfusion injury in rats. Exp Ther Med 2014;8:1764-8. [DOI] [PMC free article] [PubMed] [Google Scholar]
- 8.Izadi M, Kheirjou R, Mohammadpour R, Aliyoldashi MH, Moghadam SJ, Khorvash F, et al. Efficacy of comprehensive ozone therapy in diabetic foot ulcer healing. Diabetes Metab Syndr 2019;13:822-5. [DOI] [PubMed] [Google Scholar]
- 9.Sen S, Sen S. Ozone therapy a new vista in dentistry: integrated review. Med Gas Res 2020;10:189-92. [DOI] [PMC free article] [PubMed] [Google Scholar]
- 10.Scassellati C, Galoforo AC, Bonvicini C, Esposito C, Ricevuti G. Ozone: a natural bioactive molecule with antioxidant property as potential new strategy in aging and in neurodegenerative disorders. Ageing Res Rev 2020;63:101138. [DOI] [PMC free article] [PubMed] [Google Scholar]
- 11.Niki E. Oxidative stress and antioxidants: Distress or eustress? Arch Biochem Biophys 2016;595:19-24. [DOI] [PubMed] [Google Scholar]
- 12.Bocci V, Valacchi G. Nrf2 activation as target to implement therapeutic treatments. Front Chem 2015;3:4. [DOI] [PMC free article] [PubMed] [Google Scholar]
- 13.Galiè M, Costanzo M, Nodari A, Boschi F, Calderan L, Mannucci S, et al. Mild ozonisation activates antioxidant cell response by the Keap1/Nrf2 dependent pathway. Free Radic Biol Med 2018;124:114-21. [DOI] [PubMed] [Google Scholar]
- 14.Luongo M, Brigida AL, Mascolo L, Gaudino G. Possible therapeutic effects of ozone mixture on hypoxia in tumor development. Anticancer Res 2017;37:425-35. [DOI] [PubMed] [Google Scholar]
- 15.Petrucci MT, Gallucci C, Agrillo A, Mustazza MC, Foà R. Role of ozone therapy in the treatment of osteonecrosis of the jaws in multiple myeloma patients. Haematologica 2007;92:1289-90. [DOI] [PubMed] [Google Scholar]
- 16.Clavo B, Santana-Rodriguez N, Llontop P, Gutierrez D, Ceballos D, Méndez C, et al. Ozone therapy in the management of persistent radiation-induced rectal bleeding in prostate cancer patients. Evid Based Complement Alternat Med 2015;2015:480369. [DOI] [PMC free article] [PubMed] [Google Scholar]
- 17.Kang KA, Hyun JW. Oxidative stress, Nrf2, and epigenetic modification contribute to anticancer drug resistance. Toxicol Res 2017;33:1-5. [DOI] [PMC free article] [PubMed] [Google Scholar]
- 18.Sweet F, Kao MS, Lee SC, Hagar WL, Sweet WE. Ozone selectively inhibits growth of human cancer cells. Science 1980;209:931-3. [DOI] [PubMed] [Google Scholar]
- 19.Cannizzaro A, Verga Falzacappa CV, Martinelli M, Misiti S, Brunetti E, Bucci B. O(2/3) exposure inhibits cell progression affecting cyclin B1/cdk1 activity in SK-N-SH while induces apoptosis in SK-N-DZ neuroblastoma cells. J Cell Physiol 2007;213:115-25. [DOI] [PubMed] [Google Scholar]
- 20.Tirelli U, Cirrito C, Pavanello M, Del Pup L, Lleshi A, Berretta M. Oxygen-ozone therapy as support and palliative therapy in 50 cancer patients with fatigue - A short report. Eur Rev Med Pharmacol Sci 2018;22:8030-3. [DOI] [PubMed] [Google Scholar]
- 21.Horwitz KB, Costlow ME, McGuire WL. MCF-7; a human breast cancer cell line with estrogen, androgen, progesterone, and glucocorticoid receptors. Steroids 1975;26:785-95. [DOI] [PubMed] [Google Scholar]
- 22.Costanzo M, Cisterna B, Vella A, Cestari T, Covi V, Tabaracci G, et al. Low ozone concentrations stimulate cytoskeletal organization, mitochondrial activity and nuclear transcription. Eur J Histochem 2015;59:2515. [DOI] [PMC free article] [PubMed] [Google Scholar]
- 23.Cisterna B, Costanzo M, Nodari A, Galiè M, Zanzoni S, Bernardi P, et al. Ozone activates the Nrf2 pathway and improves preservation of explanted adipose tissue in vitro. Antioxidants (Basel) 2020;9:989. [DOI] [PMC free article] [PubMed] [Google Scholar]
- 24.Cappellozza E, Costanzo M, Calderan L, Galiè M, Angelini O, Tabaracci G, et al. Low ozone concentrations affect the structural and functional features of Jurkat T cells. Processes 2021;9:1030. [DOI] [PMC free article] [PubMed] [Google Scholar]
- 25.Lacavalla MA, Inguscio CR, Cisterna B, Bernardi P, Costanzo M, Galiè M, et al. Ozone at low concentration modulates microglial activity in vitro: a multimodal microscopy and biomolecular study. Microsc Res Tech 2022;85:3777-92. [DOI] [PMC free article] [PubMed] [Google Scholar]
- 26.Cisterna B, Costanzo M, Lacavalla MA, Galiè M, Angelini O, Tabaracci G, et al. Low ozone concentrations differentially affect the structural and functional features of non-activated and activated fibroblasts in vitro. Int J Mol Sci 2021;22:10133. [DOI] [PMC free article] [PubMed] [Google Scholar]
- 27.Inguscio CR, Dalla Pozza E, Dando I, Boschi F, Tabaracci G, Angelini O, et al. Mitochondrial features of mouse myoblasts are finely tuned by low doses of ozone: the evidence in vitro. Int J Mol Sci 2023;24:8900. [DOI] [PMC free article] [PubMed] [Google Scholar]
- 28.Larini A, Bianchi L, Bocci V. The ozone tolerance: I) Enhancement of antioxidant enzymes is ozone dose-dependent in Jurkat cells. Free Radic Res 2003;37:1163-8. [DOI] [PubMed] [Google Scholar]
- 29.Costanzo M, Cisterna B, Covi V, Tabaracci G, Malatesta M. An easy and inexpensive method to expose adhering cultured cells to ozonization. Microscopie 2015;23:46–52. [Google Scholar]
- 30.Shi R, Tang YQ, Miao H. Metabolism in tumor microenvironment: Implications for cancer immunotherapy. MedComm (2020) 2020;1:47-68. [DOI] [PMC free article] [PubMed] [Google Scholar]
- 31.de Visser KE, Joyce JA. The evolving tumor microenvironment: From cancer initiation to metastatic outgrowth. Cancer Cell 2023;41:374-403. [DOI] [PubMed] [Google Scholar]
- 32.Chen H, Tritton TR, Kenny N, Absher M, Chiu JF. Tamoxifen induces TGF-beta 1 activity and apoptosis of human MCF-7 breast cancer cells in vitro. J Cell Biochem 1996;61:9-17. [DOI] [PubMed] [Google Scholar]
- 33.Budtz PE. Role of proliferation and apoptosis in net growth rates of human breast cancer cells (MCF-7) treated with oestradiol and/or tamoxifen. Cell Prolif 1999;32:289-302. [DOI] [PMC free article] [PubMed] [Google Scholar]
- 34.Li Z, Carrier L, Belame A, Thiyagarajah A, Salvo VA, Burow ME, et al. Combination of methylselenocysteine with tamoxifen inhibits MCF-7 breast cancer xenografts in nude mice through elevated apoptosis and reduced angiogenesis. Breast Cancer Res Treat 2009;118:33-43. [DOI] [PubMed] [Google Scholar]
- 35.Danova M, Pellicciari C, Zibera C, Mangiarotti R, Gibelli N, Giordano M, et al. Cell cycle kinetic effects of tamoxifen on human breast cancer cells. Flow cytometric analyses of DNA content, BrdU labeling, Ki-67, PCNA, and statin expression. Ann N Y Acad Sci 1993;698:174-81. [DOI] [PubMed] [Google Scholar]
- 36.Danova M, Pellicciari C, Bottone M, Gibelli N, Mangiarotti R, Zibera C, et al. Multiparametric assessment of the cell-cycle effects of tamoxifen on mcf-7 human breast-cancer cells. Oncol Rep 1994;1:739-45. [DOI] [PubMed] [Google Scholar]
- 37.Tang S, Xu B, Li J, Zhong M, Hong Z, Zhao W, et al. Ozone induces BEL7402 cell apoptosis by increasing reactive oxygen species production and activating JNK. Ann Transl Med 2021;9:1257. [DOI] [PMC free article] [PubMed] [Google Scholar]
- 38.Han W, Chen S, Yuan W, Fan Q, Tian J, Wang X, et al. Oriented collagen fibers direct tumor cell intravasation. Proc Natl Acad Sci USA 2016;113:11208-13. [DOI] [PMC free article] [PubMed] [Google Scholar]
- 39.Zbiral B, Weber A, Vivanco MD, Toca-Herrera JL. Characterization of breast cancer aggressiveness by cell mechanics. Int J Mol Sci 2023;24:12208. [DOI] [PMC free article] [PubMed] [Google Scholar]
- 40.Metsiou DN, Siatis KE, Giannopoulou E, Papachristou DJ, Kalofonos HP, Koutras A, et al. The impact of anti-tumor agents on ER-positive MCF-7 and HER2-positive SKBR-3 breast cancer cells biomechanics. Ann Biomed Eng 2019;47:1711-24. [DOI] [PubMed] [Google Scholar]
- 41.Sakai J, Li J, Subramanian KK, Mondal S, Bajrami B, Hattori H, et al. Reactive oxygen species-induced actin glutathionylation controls actin dynamics in neutrophils. Immunity 2012;37:1037-49. [DOI] [PMC free article] [PubMed] [Google Scholar]
- 42.Taulet N, Delorme-Walker VD, DerMardirossian C. Reactive oxygen species regulate protrusion efficiency by controlling actin dynamics. PLoS One 2012;7:e41342. [DOI] [PMC free article] [PubMed] [Google Scholar]
- 43.Muliyil S, Narasimha M. Mitochondrial ROS regulates cytoskeletal and mitochondrial remodeling to tune cell and tissue dynamics in a model for wound healing. Dev Cell 2014;28:239-52. [DOI] [PubMed] [Google Scholar]
- 44.Huang CH, Tang M, Shi C, Iglesias PA, Devreotes PN. An excitable signal integrator couples to an idling cytoskeletal oscillator to drive cell migration. Nat Cell Biol 2013;15:1307-16. [DOI] [PMC free article] [PubMed] [Google Scholar]
- 45.Gardel ML, Schneider IC, Aratyn-Schaus Y, Waterman CM. Mechanical integration of actin and adhesion dynamics in cell migration. Annu Rev Cell Dev Biol 2010;26:315-33. [DOI] [PMC free article] [PubMed] [Google Scholar]
- 46.Verrazzo G, Coppola L, Luongo C, Sammartino A, Giunta R, Grassia A, et al. Hyperbaric oxygen, oxygen-ozone therapy, and rheologic parameters of blood in patients with peripheral occlusive arterial disease. Undersea Hyperb Med 1995;22:17-22. [PubMed] [Google Scholar]
- 47.Artis AS, Aydogan S, Sahin MG. The effects of colorectally insufflated oxygen-ozone on red blood cell rheology in rabbits. Clin Hemorheol Microcirc 2010;45:329-36. [DOI] [PubMed] [Google Scholar]
- 48.Scassellati C, Costanzo M, Cisterna B, Nodari A, Galiè M, Cattaneo A, et al. Effects of mild ozonisation on gene expression and nuclear domains organization in vitro. Toxicol In Vitro 2017;44:100-10. [DOI] [PubMed] [Google Scholar]
- 49.Loignon M, Miao W, Hu L, Bier A, Bismar TA, Scrivens PJ, et al. Cul3 overexpression depletes Nrf2 in breast cancer and is associated with sensitivity to carcinogens, to oxidative stress, and to chemotherapy. Mol Cancer Ther 2009;8:2432-40. [DOI] [PubMed] [Google Scholar]
- 50.Thangasamy A, Rogge J, Krishnegowda NK, Freeman JW, Ammanamanchi S. Novel function of transcription factor Nrf2 as an inhibitor of RON tyrosine kinase receptor-mediated cancer cell invasion. J Biol Chem 2011;286:32115-22. [DOI] [PMC free article] [PubMed] [Google Scholar]
- 51.Bekele RT, Venkatraman G, Liu RZ, Tang X, Mi S, Benesch MG, et al. Oxidative stress contributes to the tamoxifeninduced killing of breast cancer cells: implications for tamoxifen therapy and resistance. Sci Rep 2016;6:21164. [DOI] [PMC free article] [PubMed] [Google Scholar]
- 52.Reinema FV, Sweep FCGJ, Adema GJ, Peeters WJM, Martens JWM, Bussink J, et al. Tamoxifen induces radioresistance through NRF2-mediated metabolic reprogramming in breast cancer. Cancer Metab 2023;11:3. [DOI] [PMC free article] [PubMed] [Google Scholar]
- 53.Kim SK, Yang JW, Kim MR, Roh SH, Kim HG, Lee KY, et al. Increased expression of Nrf2/ARE-dependent anti-oxidant proteins in tamoxifen-resistant breast cancer cells. Free Radic Biol Med 2008;45:537-46. [DOI] [PubMed] [Google Scholar]


