

ABSTRACT
Background
Intrahepatic cholangiocarcinoma (ICC) is a disease with poor prognosis and limited therapeutic options. We investigated the tumor immune microenvironment (TIME) to identify predictors of disease outcome and to explore targets for therapeutic modulation.
Methods
Liver tissue samples were collected during 2008–2019 from patients (n = 139) diagnosed with ICC who underwent curative intent surgery without neoadjuvant chemotherapy. Samples from the discovery cohort (n = 86) were immunohistochemically analyzed on tissue microarrays (TMAs) for the expression of CD68, CD3, CD4, CD8, Foxp3, PD-L1, STAT1, and p-STAT1 in tumor core and stroma areas. Results were digitally analyzed using QuPath software and correlated with clinicopathological characteristics. For validation of TIME-related biomarkers, we performed multiplex imaging mass cytometry (IMC) in a validation cohort (n = 53).
Results
CD68+ cells were the predominant immune cell type in the TIME of ICC. CD4+high T cell density correlated with better overall survival (OS). Prediction modeling together with validation cohort confirmed relevance of CD4+ cells, PD-L1 expression by immune cells in the stroma and N-stage on overall disease outcome. In turn, IMC analyses revealed that silent CD3+CD4+ clusters inversely impacted survival. Among annotated immune cell clusters, PD-L1 was most relevantly expressed by CD4+FoxP3+ cells. A subset of tumors with high density of immune cells (“hot” cluster) correlated with PD-L1 expression and could identify a group of candidates for immune checkpoint inhibition (ICI). Ultimately, higher levels of STAT1 expression were associated with higher lymphocyte infiltration and PD-L1 expression.
Conclusions
These results highlight the importance of CD4+ T cells in immune response against ICC. Secondly, a subset of tumors with “hot” TIME represents potential candidates for ICI, while stimulation of STAT1 pathway could be a potential target to turn “cold” into “hot” TIME in ICC.
KEYWORDS: Immune cell prognosticators, immunomodulation, intrahepatic cholangiocarcinoma, tumor immune microenvironment
TRANSLATIONAL RELEVANCE
The tumor immune microenvironment (TIME) plays a critical role in the immune response In many cancers, including intrahepatic cholangiocarcinoma (ICC). Molecular subtyping of the ICC microenvironment already revealed inter-tumoral heterogeneity with variant profiles of immune cell infiltrates. A recent study created an in-depth immune cell atlas of the TIME in biliary tract cancers and could demonstrate the relevance of specific immune cell subpopulations on patient outcome. We are able to provide a distinctive characterization of TIME, separating tumor epithelial- and stroma areas, in a large and representative ICC cohort using digitalized image analysis on tissue microarrays (TMA) as well as multiplex imaging mass cytometry (IMC). The study was designed for identification of immune cell prognosticators allocating institutional ICC patients into a discovery (2008–15) and a validation (2010–19) cohort. Immune cell subpopulations were correlated with clinicopathological characteristics and patient outcome. Our results highlight: i. The important role of CD4+ T cell infiltration in ICC patients; ii. ICC tumors with high density of immune cells associated with PD-L1 expression identifies a subset of patients with variant tumor biology; iii. Stimulation of STAT1 pathway may be a relevant target to turn “cold” into “hot” tumors.
Background
Cholangiocarcinoma (CCA) is a tumor that arises from the biliary tree, anatomically subcategorized into intrahepatic (ICC), perihilar, and distal CCA. Besides the anatomic location, respective subtypes differ in their molecular alterations, risk factors, clinical behavior and management, as well as prognosis, and are therefore regarded as clinically distinct diseases.1 The diagnosis often entails poor prognosis and few therapeutic options. The best chance of favorable long-term outcome is surgical resection, when possible, although more than half of the patients eventually relapse. Therefore, patients regularly receive adjuvant chemotherapy with capecitabine to improve survival.2 Still, the majority of patients (60%–70%) are diagnosed with advanced disease (inoperable or metastatic) and rely on standard of care systemic therapy with cisplatin and gemcitabine.3 The addition of durvalumab improved the efficacy of gemcitabine/cisplatin and has been established for the palliative treatment as well (TOPAZ-1).4 The development of more effective therapies as well as identification of biomarkers that predict treatment response is critically needed.
The tumor microenvironment (TME) of ICC is characterized by a desmoplastic stroma, in which macrophages are the most prevalent immune cells.5 Elements of adaptive immune response, such as lymphocytes, are also present in the TME.6 Immunologically “hot” tumors are known to have a better response to ICI. Such tumors display features with pronounced lymphocyte infiltration and anti-programmed death-ligand 1 (PD-L1) expression.7 New data on transcriptional profiling of ICC samples have enabled clinical subclassification and was expanded to better understand the inter-tumoral heterogeneity of the TME.8,9 Multiplex analysis allowed for in-depth correlations of immune cell subtypes and clinical outcome in non-metastatic ICC, showing that proficient effector T-cells improve survival, when located in the tumor area.10 Our study uniquely investigates TIME in ICC patients across all tumor stages as previous studies have shown that the TIME composition depends on staging.11
We performed immunohistochemical as well as molecula spatial analyses of the TIME in a single-center cohort of patients diagnosed with ICC. Herein, we characterize the distribution of immune cells and expression of relevant immune-related markers in both, the tumor epithelium and stromal areas, using digitalized image analyses on tissue microarrays (TMA) as well as in-depth, multiplex imaging mass cytometry (IMC). The data was used to identify molecular predictors of disease outcome, to identify potential candidates for immunotherapy, and explore new targets for therapeutic modulation.
Methods
Study population and tissues
We retrospectively analyzed cases of patients diagnosed with ICC, who were resected between 2008 and 2019 at the Department of Surgery, CCM|CVK, Charité – Universitätsmedizin Berlin. The study was designed for identification of immune-related biomarkers, allocating patients into discovery (2008–2015) and validation cohort (2010–2019) (Figure 1a). Specimen of tumors with peri-hilar, distal, and combined hepato-cholangiocarcinoma was excluded. In addition, we excluded patients who received neoadjuvant chemotherapy or who survived less than 30 days after surgery (in-hospital mortality due to postoperative complications). All patients gave informed consent for scientific use of archived samples. The study was approved by the institutional ethics committee (EA1/229/18). Paraffin blocks were retrieved from the Central Biobank of Charité – Universitätsmedizin Berlin. Histological classification was made according to the AJCC (7th Edition) and the WHO classification systems. Patients’ characteristics included clinicopathological data, administration of adjuvant chemotherapy with gemcitabine (with or without cisplatin), recurrence, and survival.
Figure 1.
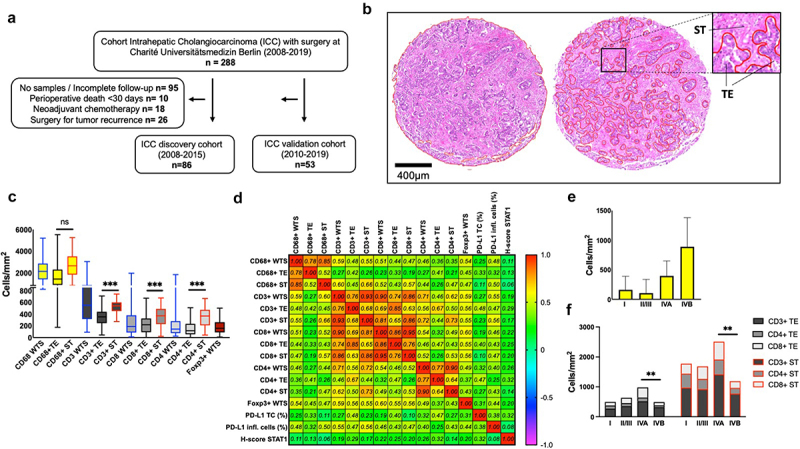
Tumor immune cell infiltration (TIME) in ICC. (a). Flow diagram characterizes the patient selection of surgically treated patients from 2008-2019 at Charité Universitätsmedizin Berlin with histopathological confirmed diagnosis of intrahepatic cholangiocellular carcinoma (ICC). In a two-step trial design patients were randomly allocated into discovery and validation cohort. (b). Representative delimitation of whole TMA section (WTS) into tumor core (TE) and stromal area (ST) following the histological evaluation of HE stainings by two independent pathologists. (c). Kruskal-Wallis multiple comparison between groups showing higher densities of lymphocytes in stromal area in comparison to tumor core. ***, p < 0.001. (d). Correlation matrix among immune cell densities, PD-L1 expression, and STAT1 (Spearman’s rho). Most immune cell populations correlated with each other (heat map represents correlation coefficient r). (e). CD68+ TE densities with standard errors of the mean (SEM) for each UICC stage. (f). Lymphocyte densities for each UICC stage. Two way ANOVA analysis with Tukey’s multiple comparison among stages with significant differences on patients with distant metastases. **, p < 0.01.
Antibodies
The following antibodies and concentrations were used: mouse anti-human CD68 (clone PG-M1, Dako M0876), 1:100; rabbit anti-human CD3 (polyclonal, Dako A0452), 1:200; rabbit anti-human CD4 (clone SP35, Zytomed 503–3354), 1:50; mouse anti-human CD8 (clone C8/144B, Dako M7103), 1:25; rabbit anti-human Foxp3 (polyclonal, Zytomed 506–1849), 1:200; rabbit anti-human PD-L1 (clone E1L3N XP, Cell Signaling Tech 13,684), 1:200; rabbit anti-STAT1 (clone D1K9Y, Cell Signaling Tech 14,994), 1:250; rabbit anti-Phospho-Stat1 Tyr701 (clone 58D6, Cell Signaling Tech, 9167).
Tissue microarray construction and immunohistochemistry
Representative tumor areas were stained with H&E, labeled, and examined by two experienced pathologists (B.S. and A.A.). Areas of necrosis were excluded. Two core punches of areas with high tumor cellularity of FFPE tumor blocks, each with 1.5 mm diameter, were used to generate tissue microarrays (TMA) as previously described.12 In the discovery cohort, TMA included 86 patients with duplicate samples allocated on a total of 3 slides. In the validation cohort, TMAs included 53 patients allocated on 3 slides (Supplementary Figure S1). Tonsil tissue was used as an on-slide control. 4 μm tissue sections from the TMA were stained for CD3, CD4, CD8, CD68, Foxp3, PD-L1 markers using automated system (Leica BOND‐MAX) following manufacturers’ instructions (Supplementary Figure S2). For STAT1 and p-STAT1, standard protocols for IHC staining were conducted (Supplementary methods).
Evaluation of tissue microarrays
H&E and immunohistochemical images were taken using a Panoramic SCAN 150 scanner (3DHISTECH, Budapest, Hungary) and digitally analyzed by QuPath software.13 The evaluation was supervised by experienced pathologists (A.A and B.S.). All scoring was done blinded to patient characteristics. For the evaluation of immune cells (CD3, CD4, CD8, CD68, Foxp3), the densities of the cells (number of cells/mm2) were obtained for the whole TMA section (WTS), tumor epithelium (TE), and stroma (ST) areas performing digital analysis with automated cell counting (more detailed information in Suppl. methods).
PD-L1 expression was analyzed for the TE membranous staining and for immune cells in the ST areas. PD-L1 was defined as positive when detected in ≥ 1% of the tumor cells or immune cells on ST, respectively. Combining results from both punches of each patient, the average number of tumor cells available for staining analysis was 11,896 cells (SD 6490.5) per patient. For the count of TE associated immune cells, ST areas were manually demarcated, and the software generated the percentage of positive stained cells.
STAT1 and p-STAT1 were evaluated according to the intensity of the staining of the tumor cells cytoplasm for each patient. TE areas were manually defined on the stained TMA. Percentages of positive cells were generated by the software considering three different intensity thresholds of tumor cells cytoplasm on pixel-based scoring (low, moderate, high) in the scanned specimens. Histoscore (H-score) was generated according to the formula: 3× percentage of strongly staining cells + 2× percentage of moderately staining cells + percentage of weakly staining cells, giving a range of 0 to 300: STAT1low (≤100), STAT1mod (>100, ≤200) and STAT1high (>200) expression.
Imaging mass cytometry
A list of the antibody (Ab) panel and a detailed description of the workflow can be found in the supplementary (Suppl. methods). In short: Ab that were not commercially available were conjugated according to the MaxPar X8 Fluidigm protocol. 1.5 mm punched tissue sections of 53 patients were assembled into three TMA. Regions of interest (ROIs) spanned 1500 × 1500px and were measured on Hyperion imaging system at 1 μm/px resolution. Raw data was processed with the Steinbock framework using the Mesmer segmentation algorithm to generate cellular masks.14 Furthermore, to spatially separate the analysis of tumor and stroma areas, ROI-wide masks were generated with ImageJ based on CK18 raw image signals. Pre-processed images of the marker channels and segmentation masks generated by Steinbock were both loaded and integrated in R to yield single-cell resolution data which was then spillover corrected and cells were Boolean gated into B cells, T cells, remaining immune cells, and stromal cells according to user-defined marker combinations.
Statistical analyses
Data was analyzed using the statistical software GraphPad Prism 9.3 (GraphPad Software, La Jolla, USA) and IBM SPSS Statistics for Windows, version 25 (IBM Corp., Armonk, N.Y., USA).15 Data was expressed as mean, standard deviation (SD), median, minimum, maximum, and 95% confidence interval. Normality distribution was performed using D’Agostino test. Kaplan-Meier curve was employed to visualize the overall survival (OS) and disease-free survival (DFS). Survival data was present by the median survival time in month and Hazard Ratio (HR) with 95%CI. A Log-rank test was performed to assess the difference in survival curves between factors. Patients who were confirmed to be alive by the end of the follow-up time (August/2020) were censored. To explore the association between risk factors and survival, a Cox proportional-hazards model with backward stepwise selection method was used. Immune markers were analyzed both as continuous variables (densities=cells/mm2) as well as binary data (“high”/“low” densities of immune cells, stratified by median split). Spearman’s rank correlation coefficient was performed to explore the correlation of two continuous variables (e.g., the correlation between the number of tumor-infiltrating immune cells, PD-L1 expression, and H-score STAT1). No correction for the multiple comparison was performed due to an exploratory framework. Mann-Whitney U test and Kruskal-Wallis test were performed to compare immune cells infiltration between groups of PD-L1 (<1% or ≥ 1%), p-STAT1 (positive or negative) and STAT1 expression groups (low, moderate, and high). Two-Step Cluster analysis was employed for generation of patient clusters using Log-likelihood distance measurement and Schwarz’s Bayesian clustering criterion. A p-value ≤0.05 was considered statistically significant. The Harrell C statistic was calculated to assess model discrimination. Calibration by using Cox regression on the PI in the validation cohort was examined at the follow-up time of 3 years and 5 years by using the build-in Stata command stcoxcal.16
Results
Cohort characterization
A total of 139 patients who underwent surgical resection for ICC at our institution from 2008 to 2019 met inclusion criteria (discovery and validation cohort, see methods). Starting from the date of the surgery, patients underwent a follow-up period of at least five years or until death, whatever came first. The median OS survival was 30 months (95%CI 23.4–37.9). One-, 3-, and 5-year survival rates were 76.4%, 52.3%, and 30.2%, while we documented a median DFS of 18.8 months (95%CI 12.2–25.4). By the end of the study, 114 (82%) patients were deceased. Three patients, that were found to have non-resectable distant metastasis at the time of the surgery, were not included in the recurrence group; eight patients died from other clinical reasons without tumor recurrence. Clinicopathologic characteristics of validation cohort was comparable to the discovery cohort and were summarized in Table 1. After histopathologic examination 74 (53.2%) patients were found to have non-metastatic disease (stages I, II, or III), while 65 (46.7%) patients were stage IV (lymph node or distant metastasis). Some patients presented with pre-conditions in the liver, such as history of chronic hepatitis (hepatitis C: 2, hepatitis B: 1, hepatitis E: 1 patients); primary sclerosing cholangitis (3 patients); Caroli disease (1 patient), cirrhosis (5 patients) or previous diagnosis of other malignancies (16 patients).
Table 1.
Patient demographics and tumor characteristics.
| Discovery Cohort (n = 86) 2008–2015 |
Validation Cohort (n = 53) 2010–2019 |
All patients (n = 139) 2008–2019 |
|
|---|---|---|---|
| Median age (min – max) | 64.5 years (23–83) | 70 years (45–83) | 67 years (23–83) |
| Gender | |||
| Female | 43 (50%) | 27 (51%) | 70 (50.4%) |
| Male | 43 (50%) | 26 (49%) | 69 (49.6%) |
| AJCC Staging (7th edition) | |||
| I (T1 N0 M0) | 28 (32.6%) | 14 (26.4%) | 42 (30.2%) |
| II (T2 N0 M0) | 15 (17.4%) | 8 (15.1%) | 23 (16.5%) |
| III (T3 N0 M0) | 3 (3.5%) | 6 (11.3%) | 9 (6.5%) |
| IVa (T4 N0 M0/any T, N1, M0) | 29 (33.7%) | 22 (41.5%) | 51 (36.7%) |
| IVb (any T, any N, M1) | 11 (12.8%) | 3 (5.7%) | 14 (10.1%) |
| TNM | |||
| Tx | 2 (2.3%) | 50 (36.5%) | |
| T1 | 32 (37.2%) | 18 (34%) | 49 (35.8%) |
| T2 | 32 (37.2%) | 17 (32.1%) | 25 (18.2%) |
| T3 | 13 (15.1%) | 12 (22.6%) | 13 (9.5%) |
| T4 | 7 (8.1%) | 6 (11.3%) | 8 (5.8%) |
| Nx | 4 (4.7%) | 4 (7.5%) | 73 (52.5%) |
| N0 | 47 (54.7%) | 26 (49%) | 58 (41.7%) |
| N1 | 35 (40.7%) | 23 (43.3%) | 14 (10.1%) |
| M1 | 11 (12.8%) | 3 (5.6%) | |
| Median Tumor size (min – max) | 70 mm (13 – 210) | 69 mm (20 – 155) | 70 mm (13 – 210) |
| Grade of differentiation | |||
| Well differentiated | 2 (2.4%) | 1 (1.0%) | 3 (2.2%) |
| Moderately differentiated | 62 (72.9%) | 39 (75%) | 101 (73.7%) |
| Poorly differentiated | 21 (24.7%) | 12 (23.1%) | 33 (24.1%) |
| Margin of resection | |||
| Positive | 24 (28.2%) | 15 (28.3%) | 39 (28.3%) |
| Negative | 61 (71.8%) | 38 (71.7%) | 99 (71.7%) |
| Microvascular Invasion | |||
| Positive | 15 (17.4%) | 10 (19.6%) | 21 (15.3%) |
| Negative | 61 (71.8%) | 41 (80.4%) | 116 (83.5%) |
| Lymphangiosis Carcinomatosa | |||
| Positive | 33 (38.4%) | 14 (26.9%) | 47 (34.1%) |
| Negative | 53 (61.6%) | 38 (73.1%) | 91 (65.9%) |
Correlation of survival analysis with clinicopathological variables demonstrated that T > 1, N1, and M1 staging, as well as tumors positive for lymphangiosis carcinomatosa (L1) were associated with worse OS (Supplementary Table S1). A reduced DFS was observed for T > 1 and N1 staging, tumors positive for microvascular invasion (V1), and lymphangiosis carcinomatosa (L1). The characterization of our cohort confirms the relevance of histopathological staging on clinical outcome of ICC patients.
Macrophages are the predominant tumor infiltrating immune cells in the ICC microenvironment
In a two-step trial design (Figure 1a), we started to characterize the TIME in our ICC discovery (n = 86) cohort as well as identify relevant prognostic markers for ICC. We investigated the frequency and the distribution of major immune cell populations on TMAs via IHC analyses and separately measured the densities of immune cells on whole TMA sections (WTS), tumor epithelium (TE) and stromal (ST) areas (Figure 1b). From the markers analyzed, the most frequent infiltrating immune cell type observed were CD68+, followed by CD3+, CD8+, CD4+, and Foxp3+ (Figure 1c). Densities of Foxp3+ cells were overall low, consequently their analyses was focused on WTS. Apart from CD68+ cells, immune cells were significantly observed at higher densities in the ST compartment in comparison to the TE. The predominant lymphocyte population in the TE were CD8+ T-cells, while CD4+ and CD8+ showed similar densities in the ST area. To determine if individual immune cell types and their location in the TIME were related to each other, we performed Spearman’s correlation among immune cells (Figure 1d). Most immune cell types and locations correlated positively with each other while this was particularly strong among CD8+ T cells. Patient with M1 disease at surgery (UICC stage IVB) showed higher CD68+ TE densities (Figure 1e) and lower densities of lymphocyte markers, with lower CD4+ ST densities (p < 0.05), lower CD4+ WTS density (p = 0.04), and a trend toward lower CD8+ ST density (p = 0.06, Figure 1f, Supplementary Figure S3, and Figure S4).
To evaluate if individual immune cell populations have influence on OS and DFS in our discovery ICC cohort, “high” and “low” densities of immune cells were stratified following a median split (Figure 2a, Supplementary Table S2). A better OS was observed in patients with CD4+high WTS density (45.4 vs. 20.2 months, HR 0.5, [95%CI 0.3–0.8], p = 0.008) (Figure 2b) and CD4+high ST density (44.4 vs. 22.2 months, HR 0.6, (95%CI 0.3–0.9), p = 0.04). Accordingly, a better DFS was observed for tumors with CD4+high WTS density compared to CD4+low (Figure 2c).
Figure 2.
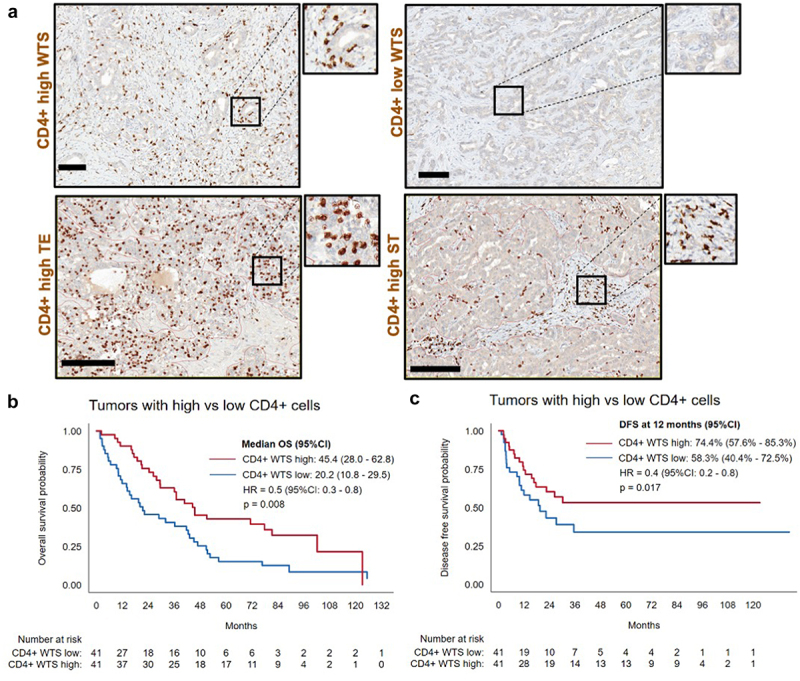
The impact of T-cell infiltration on patient survival. (a). Representative micrographs of “high” and “low” immune cell infiltration of CD4+ cells in WTS, TE, and ST (scale bars represent 100 µm). (b). Kaplan-Meier analysis for overall survival: CD4+high vs. CD4+low WTS. (c). Kaplan-Meier analysis for disease-free survival: CD4+high vs. CD4+low WTS.
In summary, we observed predominant infiltration of CD68+ cells, whose densities were two to four times higher than CD3+ T cells. Immune cells were found in higher densities in the ST compartment in comparison to the TE. Further, CD4+high densities were associated with better OS and DFS.
PD-L1 expression on tumor cells and tumor-associated immune cells is associated with overall higher densities of immune cells
Expression of PD-L1 is an important mechanism implicated in tumor immune escape and has been characterized as a critical marker of clinical course and therapeutic response in many cancer types.17 Consequently, we sought to investigate PD-L1 expression in our discovery ICC cohort. Overall, 20.9% (n = 18 of 86) of the patients were considered positive for PD-L1 expression (≥1% PD-L1 positive cells in TE) on tumor cells. Among them, 33.3% (6 patients) were positive at the threshold value (between 1–2%). Regarding the expression of PD-L1 on immune cells in ST, 52.3% (n = 45 of 86) of the patients were positive for expression on immune cells (≥1% PD-L1 positive cells in ST). On average, 1.7% (0–38.8%, SD 5.3) of tumor cells and 4.6% (0–58.3%, SD 9.1) of immune cells in ST were PD-L1 positive across all samples (Figure 3a, Figure S3, Supplementary Table S3). To evaluate the influence of PD-L1 expression on the TIME, we correlated PD-L1 expression with individual immune cell populations (Suppl. table S4). The expression of PD-L1 was in general associated with higher densities of immune cells in both TE and ST compartments.
Figure 3.
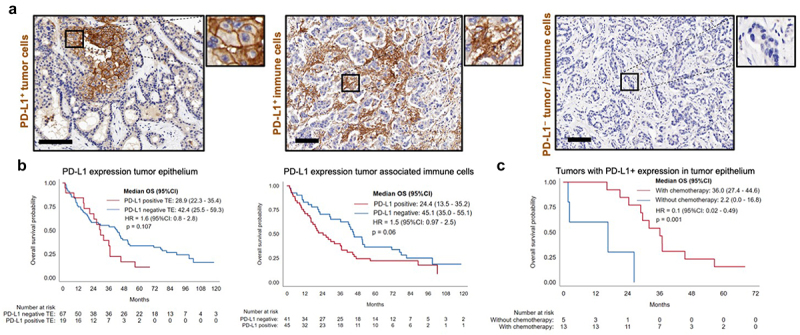
The role of PD-L1 on tumor and tumor-associated immune cells. (a). PD-L1 expression on tumor cells (membranous staining) and PD-L1 staining on tumor associated immune cells (scale bars represent 100 µm). (b). Overall survival Kaplan-Meier curves for PD-L1 tumor expression and PD-L1 expression on immune cells (negative vs. positive). (c). Kaplan-Meier curves representing overall survival for patients with PD-L1 positive expression on tumor cells and adjuvant chemotherapy response.
Testing the impact of PD-L1 expression on OS and DFS, a trend toward a reduced OS for PD-L1 expression on tumor cells (28.9 vs. 42.4 months, HR 1.6, [95%CI 0.8–2.8], p = 0.11) was observed, as well as for PD-L1 expression on tumor-associated immune cells (24.4 vs. 45.1 months, HR 1.5, [95%CI 0.97–2.5], p = 0.06) (Figure 3b). Higher PD-L1 expression on tumor-associated immune cells correlated with N1 (p = 0.01), stage IV (p = 0.02), and lymphangiosis carcinomatosa (p = 0.01). Patients with positive PD-L1 expression on tumor cells that received chemotherapy had a markedly improved OS compared to PD-L1 positive patients that did not received chemotherapy (36 vs. 2.2 months, HR 0.1, [0.02–0.49], p = 0.004) (Figure 3c). This was also observed in N1 patients (36 vs. 5.3 months, HR 0.3, [0.2–0.9], p = 0.04).
To summarize, the expression of PD-L1 in ICC was relatively low. A higher expression of PD-L1 was observed on tumor-associated immune cells in comparison to tumor cells and was strongly associated with immune cell infiltration. PD-L1 expression on tumor-associated immune cells was associated with more aggressive disease, while patients with PD-L1 expression by tumor cells showed better survival with adjuvant chemotherapy.
Clustering of tumors based on the influx of immune cells
Due to heterogenic influx of immune cells in our discovery cohort (inter-tumoral heterogeneity), we clustered immune cell populations using density assessments. We employed continuous variables for immune cell densities in TE and ST areas (in addition to Foxp3+ WTS) in a two-step cluster analysis, which generated a stratification into two immunologically distinct groups (Figure 4a). The majority of the patients, 61.7% (n = 50), presented with tumors of an immune “cold” TIME, with lower densities of all immune cells. A smaller cohort of 38.3% (n = 31) of the patients presented with higher densities of all immune cells and were classified as immune “hot” TIME. We observed that PD-L1 expression correlated with higher densities of immune cells. Accordingly, the “hot” cluster showed higher PD-L1 expression on tumor cells (p = 0.003) and PD-L1 expression on immune cells (p < 0.001, Figure 4b). Further, the immune “cold” group was associated with reduced OS when PD-L1 was expressed by immune cells (17.4 vs. 43.1 months, HR 1.9, [95%CI 1.0–3.7], p = 0.03) (Figure 4c).
Figure 4.
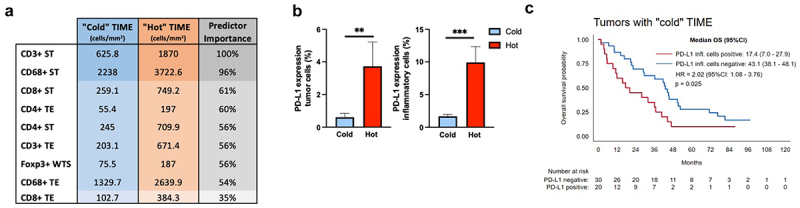
Immune cell clusters in ICC. (a). Immune cell densities (cells/mm2) for each cluster. Color intensity represents input predictor importance. (b). PD-L1 expression on tumor cells and immune cells for each TME cluster (Mann-Whitney U test,**, p < 0.01, and ***, p < 0.001, respectively). (c). Immune “cold” subset survival depending on PD-L1 expression on tumor associated-inflammatory cells.
In summary, while most of the patients in our cohort presented an immune “cold” TIME, a representative subset showed a “hot” TIME, with higher densities of immune cells and correlation with PD-L1 expression. In addition, “cold” TIME in association with PD-L1 expression was a marker of reduced OS.
Spatial immune cell characterization in ICC
To validate our findings of IHC immune cell characterization in our ICC samples, we collected an additional cohort with FFPE tissue blocks from 53 ICC patients (2013–2019) that were assembled in 3 TMAs. In total 126 mm2 of material was stained with a 36-plex panel and subjected for IMC measurements. To allow detailed investigations of major immune cell subsets, we excluded the B cells and gated on the T cells (CD45+CD3+CD19–) and remaining immune cell subsets (CD45+CD3–CD19–). We could identify major immune cell subtypes with similar density and distribution pattern showing predominant influx of CD68+ cells and lesser extend with CD3+CD4+, CD3+CD8+ and CD4+FoxP3+ T-cells (Figure 5a). Again, we sought to stratify into WTS, TE and ST areas, to better elaborate on the TIME distribution patterns. For this, we generated tumor masks based on CK18 raw signal to assign each cell to either TE or ST region (Figure 5b). In accordance with the discovery cohort, a tendency with higher proportion of immune cells was observed in ST when compared to TE. Each gated subset of the IMC validation cohort was then annotated following the unsupervised clustering using relevant immune markers in the panel (Figure 5c, Supplementary Figure S5).
Figure 5.
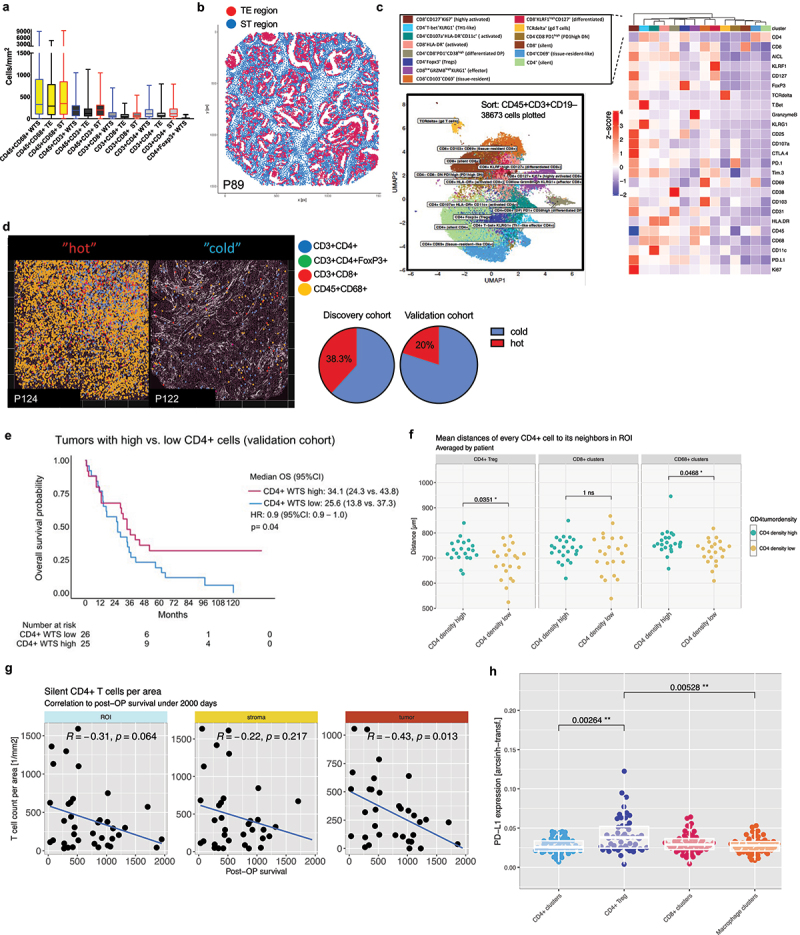
Spatial IMC analysis of TIME in the validation cohort. (a). Kruskal-Wallis multiple comparison between groups showing predominant CD45+CD68+ macrophages and major lymphocyte populations in WTS, TE and ST. (b). Spatial segmentation of WTS sections for identification of tumoral (TE) and stromal (ST) areas (red=te, blue=st). (c). Unbiased T cell clustering performed by Phenograph using specified panel (on the right) after sorting of 38,673 CD45+CD3+CD19– cells across validation cohort identified 14 major immune cell sub-classes. (d). Left: Representative IMC micrographs (P124, P122) representing the major immune cell subtypes (CD45+CD68+, CD3+CD4+, CD3+CD8+, CD3+CD4+FoxP3+) in a immunologically “cold” versus “hot” TIME. Right: pie charts with fraction of clustered “hot” versus “cold” patients. (e). Kaplan-Meier analysis for overall survival in the validation cohort: CD4+high vs. CD4+low WTS. (f). Neighborhood analyses of pooled clusters displayed longer distances of CD4+ clusters to CD4+FoxP3+ and CD68+ clusters in CD4+high tumors. *, p < 0.05. (g). Correlation analyses with cumulative densities (cell counts per mm2) of silent CD4+ clusters plotted against the post-operative survival in days in WTS, ST and TE. (h). Expression analyses of PD-L1 in pooled clusters identified CD4+FoxP3+ cells with significantly higher expression compared to other T cell or macrophage clusters.**, p < 0.01; 2 way ANOVA analysis with Bonferroni correction.
We found tendencies of T cell clusters that allocated in ST areas (e.g. CD4+CD69+, silent CD4+, silent CD8+) while most other clusters were equally distributed in both compartments (Suppl. Figure S6). Again, relevant inter-tumoral heterogeneity was observed across validation cohort. When performing the two-step cluster analysis based on absolute numbers of counted cells (see methods), we could identify tumors with particularly high immune cell influx (“hot” tumors) and tumors with reduction of all immune cell classes (“cold” tumors) (Figure 5d). As observed in the discovery cohort, a smaller proportion of ICC patients were clustered with a “hot” tumor environment.
For validation of a relevant survival function observed in the CD4+high cohort (discovery cohort), tumors were defined as CD4high versus CD4low based on median density of pooled CD45+CD3+CD4+ clusters. Again, a better survival CD4high could be discriminated in Kaplan Meier analysis (Figure 5e, 34.1 vs. 25.6 months, HR 0.9, [95%CI 0.9–1.0], p = 0.04). Subsequent clustering into the defined CD4+ and CD8+ T cells could not discriminate significant changes in the composition relative to CD4high versus CD4low tumors (Supplementary Figure S7). Still, results on neighborhood analyses revealed longer distances of CD45+CD3+CD4+ clusters to CD4+FoxP3+ and CD45+CD68+ cells in CD4high tumors that may imply regulatory mechanisms impacting survival in this cohort (Figure 5f).
In order to identify which CD4+ T helper cell population (CD45+CD3+CD4+ cluster) most relevantly contributed to post-operative survival of ICC patients, we noticed that especially the silent CD4+ clusters negatively correlated with survival and therefore hypothesized that the presence of inactivated bystander may adversely affect survival in ICC. To further elaborate on this, CD4+ and CD4+CD8+ double positive clusters were scored for activity assessed by six markers that were included in our panel (CD107a, CD38, CD69, Ki67, HLA-DR, CD25). Two clusters (CD4+ CD107a+ HLA-DR+ CD11c+ (activated CD4+) and CD4+CD8+PD1+ CD38high (differentiated DP) ranked above the mean of all activity scores and were pooled into the activated group, while the CD4+ (“silent CD4+”), CD4+CD69+ (tissue-resident-like CD4+), CD4+Foxp3+ (Tregs) and CD4+ T-bet+ KLRG1+ (Th1-like effector CD4+) were pooled into the silent group. We then calculated cumulative densities of each group (cell counts per mm2) in each ROIs (WTS, TE, ST) and plotted against the post-operative survival in days. Indeed, the group of silent clusters, especially when located in the TE, negatively correlated with survival (Figure 5g).
We ultimately explored PD-L1 expression in the tumor microenvironment. When using similar threshold measures (≥1% PD-L1 positive cells) in our validation cohort, 35.8% (n = 19) patients were positive for PD-L1 expression on immune cells (CD45+PD-L1+), and 20.7% (n = 11) were positive for PD-L1 expression on tumor cells (CK18+PD-L1+). Among major immune cell clusters, we could detect most prominent PD-L1 expression in the Treg cluster (CD4+FoxP3+) compared to other pooled clusters (Figure 5h).
In summary, we could validate a survival benefit in CD4high cohort and showed that CD3+CD4+ silent clusters can adversely impact survival in ICC. Of relevance for subsequent therapeutic intervention, high heterogeneity along ICCs was observed in the validation cohort as well, identifying tumors with particularly high influx of all immune cell classes. Our data identifies CD4+FoxP3+CD25+ immune cell sub-cluster (Treg) that most prominently expressed PD-L1 across immune cell sub-classes.
STAT1 and p-STAT1 are associated with immune cells and PD-L1 expression
STAT1 has been shown to be involved in chemokine activation and PD-L1 expression. We evaluated its impact on immune cell composition and PD-L1 expression in ICC samples. STAT1 and p-STAT1 staining were observed on cells in the stroma and on the cytoplasm of tumor cells. p-STAT1 staining was additionally observed in the nucleus (Figure 6a). In subsequent analyses, we focused on their expression in the cytoplasm of tumor epithelial cells. Using the H-score, we categorized STAT1 expression into low, moderate, and high scores (STAT1low, STAT1mod, STAT1high, Figure 6b). For STAT1, the median H-score was 129.8 (IQR 62.5–188.1); 34.9% (n = 30) had low score; 45.3% (n = 39), moderate; 19.8% (n = 17), high. On bivariate analysis (Spearman’s rho), there were positive correlations of STAT1 expression with CD3+, CD4+, and CD8+, and PD-L1 expression on tumor cells (p < 0.01, Suppl. table S5). No correlations were observed with CD68+ cells. Kruskal-Wallis-test showed a statistically significant difference across H-score categories with respect to the distribution of lymphocytes (p < 0.05) and PD-L1 expression on tumor cells (p = 0.008). For lymphocyte markers (CD4+ WTS, TE, ST; CD3+ and CD8+ TE; and Foxp3+ WTS), STAT1mod presented higher degree of immune cell influx, followed by STAT1high and, lastly, STAT1low (Figure 6c). STAT1high and STAT1mod had higher degree of PD-L1 tumor expression (Figure 6d); consequently, PD-L1 positive cases showed higher scores of STAT1 (p < 0.001, Figure 6e).
Figure 6.
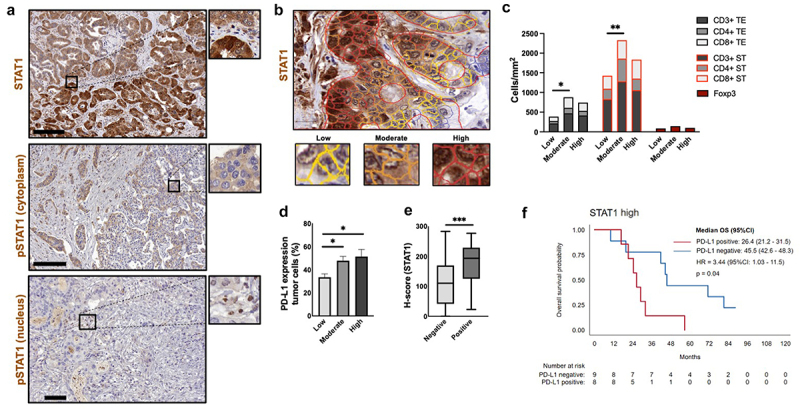
STAT1 axis relevant for immune cell modulation. (a). Representative micrographs after STAT1 and p-STAT1 staining. (b). STAT1 staining with distinct intensities defined with by QuPath software (yellow= low, orange= moderate, red=high). (c). H-score STAT1 intensity groups (low, moderate, high) in correlation with lymphocytes densities. “Moderate” STAT1 levels showed more infiltration of lymphocytes compared to “low” and “high” groups (2 way ANOVA with Tukey´s multiple comparison). (d). H-score STAT1 intensity vs. PD-L1 expression on tumor cells ranks (columns with standard error of mean). Kruskal-Wallis test with Dunn’s multiple comparisons showed significant higher expression of PD-L1 in tumors with “moderate” and “high” STAT1 scores in comparison with “low” score (p < 0.05). (e). H-score for PD-L1 expression on tumor cells (negative: 110.8 vs. positive: 193.7). Mann-Whitney U test, p < 0.001. (f). OS for STAT1high with PD-L1 positive expression on tumor cell population vs. STAT1high with PD-L1 negative expression on tumor cell population.
p-STAT1 generally showed lower expression than STAT1. Due to the low intensity of the staining, patients were categorized into “absent” and “present” expression of p-STAT1. 46.5% (40 patients) were negative for p-STAT1 while 53.5% (n = 46) were positive. p-STAT1 correlated with CD3+ and CD8+ in TE (p < 0.05), with PD-L1 on tumor cells (p = 0.01), and with PD-L1 immune cells expression (p = 0.02, Suppl. table S5). We did not observe a clear association between STAT1 and OS (STAT1mod: 36.9 months, STAT1high: 32 months, STAT1low: 18.3 months, HR 0.1, [95%CI 0.3–1.1], p = 0.1). Positive cases for p-STAT1, however, showed a trend toward a worse OS compared to the negative ones (26.4 vs. 45.1 months, HR 1.5, [95%CI 0.9–2.4], p = 0.09). Interestingly, the combination of STAT1high expression and positive PD-L1 tumor cells expression correlated with poor OS (26.4 vs 45.5 months, HR 3.4, [1.0–11.6], p = 0.04, Figure 6f). Positive p-STAT1 expression was associated with disease aggressiveness, correlating with tumor staging T > 1 (p = 0.01), N1 (p = 0.02), stage IV (p = 0.03), and lymphangiosis carcinomatosa (p = 0.007).
In conclusion, STAT1 and p-STAT1 correlated with PD-L1 expression and lymphocyte infiltration, but no correlations with CD68+ were observed. Specifically, STAT-1mod showed higher densities of CD3+, CD4+, CD8+, and Foxp3+, while STAT1mod and STAT1high had higher PD-L1 expression on tumor cells, being the combination of STAT1high and PD-L1 expression associated with worse OS. p-STAT1 correlated with PD-L1 expression on tumor cells and on tumor-associated immune cells. Our results indicate the impact of STAT1 expression on the TIME of ICC.
Multivariable analysis for OS
To ultimately assess if and which of the immunological markers have clinical implications on the individual outcome of ICC patients, we performed multivariable analysis. All variables that negatively impacted the OS in Kaplan-Meier analysis (T > 1, N1, lymphangiosis carcinomatosa, M1, CD4+ WTS density) and other markers associated with disease aggressiveness (p-STAT1 on tumor cells, PD-L1 expression on immune cells ≥ 1%) were included. The results show that CD4+low WTS density (HR = 2.6, 95%CI 1.5–4.6, p = 0.001), PD-L1 expression on immune cells (HR = 2.0, 95%CI 1.1–3.7, p = 0.01), and N1 status (HR = 1.9, 95%CI 1.1–3.2, p = 0.01) are independent predictors of poor OS (Table 2). The prediction model for OS derived from the discovery cohort that included CD4+ WTS density, N1, and PD-L1 expression on immune cells performed well in the validation cohort with a Harrell’s c-statistic 0.58 (Suppl. table S6). The mean of the prognostic index (PI) in the discovery cohort was 1.40 (95%CI: 1.27–1.53) and in the validation cohort 1.34 (95%CI: 1.17–1.51). The R2 value on the validation cohort was 0.136, lower than the value of 0.190 in the discovery cohort, with a 95%CI for the difference in R2 is (−0.181, 0.289). Since the confidence interval includes zero, the difference in R2 was compatible with no real difference.
Table 2.
Cox regression (final model) using the discovery cohort.
| Number of subjects = 79 | Number of observations = 79 | ||||
|---|---|---|---|---|---|
| Number of failures = 62 | |||||
| Time at risk = 3301 | LR chi2(3) = 19.97 | ||||
| Log likelihood= −217.44 |
Prob > chi2 = 0.0002 |
||||
| Haz. Ratio | Std. Error | z | P> |z| | [95% CI] | |
| N1 | 1.94 | 0.50 | 2.57 | 0.010 | 1.17 - 3.23 |
| CD4+ WTS | 2.61 | 0.76 | 3.29 | 0.001 | 1.47 - 4.62 |
| PD-L1+ immune cells | 2.09 | 0.60 | 2.54 | 0.011 | 1.18 - 3.70 |
In the validation cohort, the predicted OS was 78.6% at 3 years, whereas the observed OS was slightly higher at 80.6%. At 3 years and 5 years of follow-up, the calibration at large was acceptable (p = 0.686 and p = 0.462, respectively) (Suppl. Figure S8).
Discussion
To better understand the role of the immune microenvironment (TIME) in ICC and to identify suitable predictors of prognosis and therapy response, we carried out a comprehensive, in-depth and compartmentalized analysis of the tumor immune microenvironment in total of 139 resected, ICC samples, from discovery to validation. The patient cohort has been derived from a well-characterized group of patients that underwent curative intent surgery without prior neoadjuvant chemotherapy.
CD68+ cells were the largest population observed among the immune cells studied in the TIME of our cohort. The liver generally presents two populations of macrophages: resident Kupffer cells and recruited macrophages from circulating monocytes.18,19 In the tumor microenvironment of ICC, it has shown that TAMs (tumor-associated macrophages) derived from monocytes are the predominant population.20 The density of CD68+ cells progressively increased up to stage IVB (metastatic), consistent with previous reports.11 Metastatic tumors presented a markedly immunosuppressed TIME, with the highest TE CD68+ densities, and significant lower lymphocyte infiltration, especially in the stromal area. Previous studies already described the association of macrophages “M2” immunosuppressive phenotype with metastatic stages.21,22 Furthermore, the high intra-tumoral CD68+ density observed in metastatic tumors prompts speculations about the hypothesis of cellular fusion between epithelial cancer cells with TAMs as a source of metastasis.23,24
When focusing on the adaptive immune response, CD8+ T-cells were the predominant population, followed by CD4+ T-cells. This could be observed in the discovery cohort, but was not confirmed in the validation cohort. Another study using CyTOF observed predominance of CD4+ cells among the lymphocyte population.25 A higher CD4+ T-cell density correlated with longer OS and DFS, both in univariate and multivariate analyses. By contrast, silent CD4+ clusters correlated with poor survival after surgery in our validation cohort. A higher CD8+ infiltration, unlike in some other types of cancer, did not show a significant impact on OS in ICC. There is evidence of a positive impact of CD8+ T cell infiltration in extrahepatic cholangiocarcinoma (ECC),11,26 but not in ICC.27 Still, proficient effector T-cells, when located in the tumor area, were associated with better OS in ICC.10 CD4+ T cells are quite important for their ability to enhance the antitumor efficacy of cytotoxic T lymphocytes.28 CD4+ T cells initiate the priming of CD8+ T cells through dendritic cell signaling, triggering the clonal expansion and differentiation of CD8+ T cells.29,30 Therefore, with the data at hand, we hypothesize that activated CD4+ T cells are the element behind a better anti-tumor response in ICC.
PD-L1 expression has been observed in ICC, but its value as a biomarker to predict the clinical course or therapy response is currently debated. A meta-analysis including 11 studies in CCA observed worse OS for positive PD-L1 expression on tumor cells, however, their results were not always statistically significant, which is in line with our findings.31 An association of PD-L1 expression and other markers could potentially yield better prognostic value. Low PD-L1 expression associated with positive HLA class I expression was associated with favorable outcome in ICC.32 In ECC, PD-L1 expression combined with low lymphocyte infiltration correlated with worse OS.33 In accordance, we observed that “cold” TIME features (CD3+low, CD8+low or CD4+low T-cell infiltrations, as well as the “cold” TIME cluster), combined with positive PD-L1 expression, were associated with worse OS. Such “exhausted” TIME, with low lymphocyte infiltration, possibly benefit from TIME modulating therapies.
Most studies overall showed low PD-L1 expression in ICC, with large variance in the literature. Inter- and intratumoral heterogeneity as well as different methodologies might be some of the reasons for these discrepancies. In Carapeto et al.,34 the expression of PD-L1 on tumor cells was 0% using an antibody with the identical clone as used in Sabbatino et al.32 (clone 22C3), who observed a PD-L1 expression in 30% of the patients. Kriegsmann et al35 compared three different clones of PD-L1 antibodies and observed expressions from 1% up to 11% in the same cohort of CCA. Employing transcriptomic data analysis, Martin-Serrano et al. found a frequency of 6%.9 In our study, 20.9% of the patients in the discovery cohort showed positive PD-L1 tumor expression. Across positive patients in the discovery cohort, 7% of the patients were positive at the threshold value, with expression below than 2%. The high sensitivity of our methods might be responsible for these findings. In the KEYNOTE-028 (NCT02054806; phase 1b) and KEYNOTE-158 (NCT02628067; phase 2) trials, that enrolled patients with advanced biliary tract cancers for treatment with Pembrolizumab, the expression of PD-L1 (≥1%) was not relevant for clinical response.36 In the KEYNOTE-028 trial, the group with a high T-cell inflamed gene-expression profile presented better response to Pembrolizumab.37 Lymphocyte infiltration and its functional characteristics may be a relevant factor to be analyzed on ICI response in CCA. We observed that a subset of patients characterized by immune “hot” tumors, with higher densities of all immune cells, also correlated with PD-L1 expression. We believe that this subset of ICC patients, with high tumor infiltrating lymphocytes and high PD-L1 expression, are potential candidates for ICI therapy.6 ICC “inflamed” (35%) and “non-inflamed” (65%) subgroups were identified by in-depth transcriptomic analysis.9 A similar immune “hot” subgroup was characterized in a detailed TME study that suggested a classification of ICC in 4 subgroups: immune desert (47%), inflamed/lymphoid (11%), myeloid (16%), and mesenchymal (25%). The “inflamed” group overexpressed immune checkpoints and, therefore, is potentially treatable with ICI.8
In our study, PD-L1 expression by tumor-associated immune cells was a better predictor of disease aggressiveness in comparison to PD-L1 expression on tumor cells. We observed higher PD-L1 expression by tumor-associated immune cells than by tumor cells, consistent with previous observations.38,39 The meaning of PD-L1 expression on tumor-associated immune cells has been debated in the literature. Diskin et al. found that PD-L1 can be expressed by T-cells after exposure to antigens derived from apoptotic tumor cells.40 PD-L1 positive T-cells promote TIME immunosuppression by reduction of CD4+ T cells conversion to Th1, suppression of CD8+ T cell cytotoxic function, and induction of M2 macrophage polarization. Other authors pointed out that PD-L1 expression by myeloid-derived cells (MDSCs) is involved in suppression of cytotoxic T-cell response.41,42 Loeuillard et al. found that TAMs are the main source of PD-L1 in CCA, but a blockage of TAM led to a compensatory infiltration of granulocytic MDSCs that reduced T-cell function and proliferation.20 Singhal et al., on the other hand, demonstrated that PD-L1 expression by TAMs did not suppress T-cell function, but only prevented their elimination by effector T-cells while expressing MHC class I.43 In our study, PD-L1 expression by immune cells correlated with high density of all immune cells. Using multiplex staining, Xia et al. recently demonstrated that TAMs presented the highest percentage of PD-L1 expression among the evaluated immune cells.10 Using bioinformatical IMC analyses we could not confirm higher PD-L1 expression by CD68+ cells. Instead, in our validation cohort, CD4+FoxP3+ cells showed significantly higher expression of PD-L1.
By the time the patients in our study underwent surgery, adjuvant chemotherapy recommendation was mostly with gemcitabine with/without cisplatin, and patient selection was not clearly established at the time. In pancreatic cancer, CD68+ cells were associated with negative impact in gemcitabine regimens,44 whereas in breast cancer, high levels of tumor-infiltrating lymphocytes are associated with a better neoadjuvant chemotherapy response.45 In our study, no influence of immune cell infiltration on chemotherapy response was observed. However, patients positive for PD-L1 expression on tumor cells, as well as N1 patients, had a better OS when receiving chemotherapy. Some studies suggest that the combination of gemcitabine with ICI can have a synergistic effect. Gemcitabine reduces MDSC circulation and increases tumor antigenicity, while ICI neutralize the immunosuppressive effect of chemotherapy.46 Some evidences of the advantages of this therapeutic combination were observed in the results of the phase 2 TOPAZ-1 study.4
STAT1 is a cytoplasmic protein that is activated by phosphorylation from Janus kinases or other tyrosine kinases upon signaling from IFN-γ and participates in many intracellular pathways, including chemokine activation for immune cell migration and infiltration in tumors.47 For example, STAT1 recruits CD8+ T cells after IFN-γ stimulation by inducing the production of chemokines CXCL9, CXCL10 and CXCL11.48 We observed that moderate and high STAT1 scores presented with higher lymphocyte densities, especially in the TE compartment. Additionally, p-STAT1 correlated with CD3+ and CD8+ T-cell infiltrations. Zemek et al. identified that STAT1 activity promotes a “hot” TIME and is associated with ICI response. The study showed that pre-treatment of mice with STAT1-activating cytokine interferon-γ, the TLR3 ligand poly (I:C), and an anti – IL-10 antibody sensitized tumors to ICI.49 Tumor cells are also able to employ the IFN-γ/JAK/STAT1 pathway in order to increase PD-L1 expression and avoid T-cell activation.50 High H-scores of STAT1 or tumors positive for p-STAT1 were associated with positive PD-L1 expression on tumor cells. This was also observed in ovarian cancer51 and colorectal cancer.52 We believe that stimulation of STAT-1 pathway could be a promising target to turn “cold” into “hot” tumors in ICC, optimizing the effects of immunotherapies for patients with “cold” TIME.
p-STAT1 staining was markedly less prominent than STAT1 staining. This could be related to the fact that p-STAT1 migrates to the nucleus only after phosphorylation for transcriptional activity, which lasts normally for only a few hours.53 JAK/STAT pathway is negatively regulated in multiple levels.54 Inappropriate STAT activity (loss or uncontrolled constitutive STAT activation) can be harmful to cell metabolism.55 In hematologic malignancies, constitutive active fusion tyrosine kinases leading to constitutive phosphorylation of STAT1 has been observed.56 Therefore, tumors with positive staining might be related to inappropriate constitutive activation of p-STAT1. In our study, p-STAT1 was a marker of bad prognosis, correlating with markers of disease aggressiveness.
Our study provides significant insights on ICC microenvironment based on immune cell composition, PD-L1 expression and their mutual impact on patient outcome. Limitations of our study, however, are its retrospective and exploratory nature as well as the conduction of the study in a single center. The focus of our study clearly lied on TIME in ICC samples while other important participants of the TME (stroma, fibroblasts, endothelial cells) were only marginally included the immunohistochemical-/IMC analyses and clinical correlation studies. However, their role has been well elaborated in previous studies, while the main focus relied on exploring clinical implications of TIME in ICC patients.
Our institutional study on the TIME in a robust ICC cohort provides additional insights about the interplay between specific immune cell populations on disease course and potential therapeutic targets. Available ICI and other immunomodulatory agents could be considered for selected patient cohorts based on the individuals TME. We are convinced, that finding novel immunomodulatory agents will posit deemed non-candidates amenable to immunotherapies. In the era of precision medicine, novel targets that can improve response rates and survival of patients suffering from this aggressive disease need to be explored. The expanding knowledge and understanding of the TIME in biliary tract cancers elicits some optimism on the way of finding more efficacious therapies for ICC patients.
Abbreviation
- AJCC
American Joint Committee on Cancer
- CCA
Cholangiocarcinoma
- CTL
Cytotoxic T-lymphocytes
- DFS
Disease-free survival
- DN
Double negative T-cell population (CD4-CD8-)
- DP
Double positive T-cell population (CD4+CD8+)
- ECC
Extrahepatic cholangiocarcinoma
- H&E
Hematoxylin and eosin
- HR
Hazard ratio, Hazard ratio
- ICC
Intrahepatic cholangiocarcinoma
- ICI
Immune checkpoint inhibitor
- IHC
Immunohistochemistry
- ILC
Innate lymphoid cells
- IMC
Imaging mass cytometry
- OS
Overall survival
- PD-L1
nti-programmed death-ligand 1
- SD
Standard deviation
- ST
Stroma area
- TAM
Tumor associated macrophages
- TE
Tumor epithelium
- TIME
Tumor immune microenvironment
- TMA
Tissue microarray
- TME
Tumor microenvironment
- WTS
Whole TMA section
Supplementary Material
Acknowledgments
We thank our collaborators of the ZeBanC (Zentrale Biobank der Charité) for storage and accessibility of tissue samples. We thank all patients who donated samples for this research.
Funding Statement
This study was funded by the Berliner Krebsgesellschaft [FEFF 201903, 05/2019 – 09/2021]. Johannes Escherich, Felix Krenzien, Linda Feldbrügge, and Matthäus Felsenstein were/are fellows of the BIH Charité Clinician Scientist and funded by the BIH – Berlin Institute of Health and the Charité – Universitätsmedizin Berlin. Matthäus Felsenstein receives additional funding by the Else-Kröner Fresenius Stiftung (EKFS).
Disclosure statement
No potential conflict of interest was reported by the author(s).
Authors contributions
Conceptualization by I.L. (Isis Lozzi), M.F. (Matthäus Felsenstein), I.M.S. (Igor M Sauer); Methodology through I.L. (Isis Lozzi), M.F. (Matthäus Felsenstein), A.A. (Alexander Arnold), M.B. (Matthias Barone), Juliette Johnson (J.C.J.), B.S. (Bruno Sinn), A.S. (Anja Schirmeier); Software used by I.L. (Isis Lozzi), M.F. (Matthäus Felsenstein), M.B. (Matthias Barone), P.G. (Pimrapat Gebert); Formal analysis by I.L. (Isis Lozzi), M.F. (Matthäus Felsenstein), M.B. (Matthias Barone) A.R. (Anja Reutzel-Selke), P.G. (Pimrapat Gebert); Resources provided by I.M.S. (Igor M Sauer) and Experimentelle Chirurgie (Charité Universitätsmedizin Berlin); Data curation by I.L. (Isis Lozzi), M.F. (Matthäus Felsenstein); writing original draft preparation by I.L. (Isis Lozzi), M.F. (Matthäus Felsenstein) and D.P.M. (Dominik P Modest); writing review and editing by I.L., M.F., I.M.S., D.P.M., B.S., A.A., M.F., P.G., R.W., M.H., L.F., A.S., A.R., T.M., W.S., J.P; Supervision by D.P.M., I.M.S, J.P. All authors have read and agreed to the published version of the manuscript.
Data availability statement
All data relevant to the study are included in the article or uploaded as online supplemental information.
Consent for publication
Informed consent was obtained from all subjects involved in the study.
Ethics approval
The study was approved by the institutional ethics committee (EA1/229/18).
Supplementary material
Supplemental data for this article can be accessed online at https://doi.org/10.1080/2162402X.2024.2406052
References
- 1.Rizvi S, Khan SA, Hallemeier CL, Kelley RK, Gores GJ.. Cholangiocarcinoma - evolving concepts and therapeutic strategies. Nat Rev Clin Oncol. 2018. 02;15(2):95–15. doi: 10.1038/nrclinonc.2017.157. Cited in: Pubmed; PMID 28994423. Epub 2017/10/10. [DOI] [PMC free article] [PubMed] [Google Scholar]
- 2.Primrose JN, Fox RP, Palmer DH, Malik HZ, Prasad R, Mirza D, Anthony A, Corrie P, Falk S, Finch-Jones M, et al. Capecitabine compared with observation in resected biliary tract cancer (BILCAP): a randomised, controlled, multicentre, phase 3 study. Lancet Oncol. 2019. 05;20(5):663–673. doi: 10.1016/S1470-2045(18)30915-X. Cited in: Pubmed; PMID 30922733. Epub 20190325. [DOI] [PubMed] [Google Scholar]
- 3.Strijker M, Belkouz A, van der Geest LG, van Gulik TM, van Hooft JE, de Meijer VE, Haj Mohammad N, de Reuver PR, Verheij J, de Vos-Geelen J, et al. Treatment and survival of resected and unresected distal cholangiocarcinoma: a nationwide study. Acta Oncol. 2019. Jul;58(7):1048–1055. doi: 10.1080/0284186X.2019.1590634. Cited in: Pubmed; PMID 30907207. Epub 20190325. [DOI] [PubMed] [Google Scholar]
- 4.Oh DY, Lee KH, Lee DW, Yoon J, Kim TY, Bang JH, Nam AR, Oh KS, Kim JM, Lee Y, et al. Gemcitabine and cisplatin plus durvalumab with or without tremelimumab in chemotherapy-naive patients with advanced biliary tract cancer: an open-label, single-centre, phase 2 study. Lancet Gastroenterol Hepatol. 2022. Mar 09;7(6):522–532. eng. Declaration of interests D-YO received research grants from AstraZeneca, Novartis, Array, Eli Lilly, Servier, BeiGene, Merck Sharp & Dohme, and Handok and has been a consultant or adviser for AstraZeneca, Novartis, Genentech, Merck Serono, Bayer, Taiho, ASLAN Pharmaceuticals, Halozyme, Zymeworks, Bristol Myers Squibb, BeiGene, Basilea, and Turning Point. YL, VG, PM, WL, SW, QZ, and MCR are or were employees and shareholders of AstraZeneca. All other authors declare no competing interests Epub 20220309. doi: 10.1016/S2468-1253(22)00043-7. Cited in: Pubmed; PMID 35278356. [DOI] [PubMed] [Google Scholar]
- 5.Banales JM, Cardinale V, Carpino G, Marzioni M, Andersen JB, Invernizzi P, Lind GE, Folseraas T, Forbes SJ, Fouassier L, et al. Expert consensus document: cholangiocarcinoma: current knowledge and future perspectives consensus statement from the European network for the study of cholangiocarcinoma (ENS-CCA). Nat Rev Gastroenterol Hepatol. 2016. 05;13(5):261–280. doi: 10.1038/nrgastro.2016.51. Cited in: Pubmed; PMID 27095655. Epub 20160420. [DOI] [PubMed] [Google Scholar]
- 6.Loeuillard E, Conboy CB, Gores GJ, Rizvi S. Immunobiology of cholangiocarcinoma. JHEP Rep. 2019. Oct;1(4):297–311. doi: 10.1016/j.jhepr.2019.06.003. Cited in: Pubmed; PMID 32039381. Epub 2019/07/10. [DOI] [PMC free article] [PubMed] [Google Scholar]
- 7.Hegde PS, Karanikas V, Evers S. The where, the when, and the how of immune monitoring for cancer immunotherapies in the era of checkpoint inhibition. Clin Cancer Res. 2016. Apr 15;22(8):1865–1874. doi: 10.1158/1078-0432.CCR-15-1507. Cited in: Pubmed; PMID 27084740. [DOI] [PubMed] [Google Scholar]
- 8.Job S, Rapoud D, Dos Santos A, Gonzalez P, Desterke C, Pascal G, Elarouci N, Ayadi M, Adam R, Azoulay D, et al. Identification of four immune subtypes characterized by distinct composition and functions of tumor microenvironment in intrahepatic cholangiocarcinoma. Hepatology. 2020. Sep;72(3):965–981. doi: 10.1002/hep.31092. Cited in: Pubmed; PMID 31875970. Epub 2020/08/16. [DOI] [PMC free article] [PubMed] [Google Scholar]
- 9.Martin-Serrano MA, Kepecs B, Torres-Martin M, Bramel ER, Haber PK, Merritt E, Rialdi A, Param NJ, Maeda M, Lindblad KE, et al. Novel microenvironment-based classification of intrahepatic cholangiocarcinoma with therapeutic implications. Gut. 2023. Apr;72(4):736–748. eng. Competing interests: JML is receiving research support from Bayer HealthCare Pharmaceuticals, Eisai Inc, Bristol-Myers Squibb, Boehringer-Ingelheim and Ipsen, and consulting fees from Eli Lilly, Bayer HealthCare Pharmaceuticals, Bristol-Myers Squibb, Eisai Inc, Celsion Corporation, Exelixis, Merck, Ipsen, Genentech, Roche, Glycotest, Nucleix, Sirtex, Mina Alpha Ltd and AstraZeneca. AV has received consulting fees from Genentech, Guidepoint, Fujifilm, Boehringer Ingelheim, FirstWord, and MHLife Sciences; advisory board fees from Exact Sciences, Nucleix, Gilead and NGM Pharmaceuticals; and research support from Eisai. doi: 10.1136/gutjnl-2021-326514. Cited in: Pubmed; PMID 35584893. Epub 20220518. [DOI] [PMC free article] [PubMed] [Google Scholar]
- 10.Xia T, Li K, Niu N, Shao Y, Ding D, Thomas DL, Jing H, Fujiwara K, Hu H, Osipov A, et al. Immune cell atlas of cholangiocarcinomas reveals distinct tumor microenvironments and associated prognoses. J Hematol Oncol. 2022. March 28;15(1):37. doi: 10.1186/s13045-022-01253-z. Cited in: Pubmed; PMID 35346322. Epub 20220328. [DOI] [PMC free article] [PubMed] [Google Scholar]
- 11.Goeppert B, Frauenschuh L, Zucknick M, Stenzinger A, Andrulis M, Klauschen F, Joehrens K, Warth A, Renner M, Mehrabi A, et al. Prognostic impact of tumour-infiltrating immune cells on biliary tract cancer. Br J Cancer. 2013. Nov;109(10):2665–2674. doi: 10.1038/bjc.2013.610. Cited in: Pubmed; PMID 24136146. Epub 2013/10/17. [DOI] [PMC free article] [PubMed] [Google Scholar]
- 12.Arnold A, Daum S, von Winterfeld M, Berg E, Hummel M, Horst D, Rau B, Stein U, Treese C. Analysis of NTRK expression in gastric and esophageal adenocarcinoma (AGE) with pan-trk immunohistochemistry. Pathol Res Pract. 2019. Nov;215(11):152662. doi: 10.1016/j.prp.2019.152662. Cited in: Pubmed; PMID 31575452. Epub 20190919. [DOI] [PubMed] [Google Scholar]
- 13.Bankhead P, Loughrey MB, Fernández JA, Dombrowski Y, McArt DG, Dunne PD, McQuaid S, Gray RT, Murray LJ, Coleman HG, et al. QuPath: open source software for digital pathology image analysis. Sci Rep. 2017. December 04;7(1):16878. doi: 10.1038/s41598-017-17204-5. Cited in: Pubmed; PMID 29203879. Epub 20171204. [DOI] [PMC free article] [PubMed] [Google Scholar]
- 14.Windhager J, Zanotelli VRT, Schulz D, Meyer L, Daniel M, Bodenmiller B, Eling N. An end-to-end workflow for multiplexed image processing and analysis. Nat Protoc. 2023. Nov;18(11):3565–3613. doi: 10.1038/s41596-023-00881-0. Cited in: Pubmed; PMID 37816904. Epub 20231010. [DOI] [PubMed] [Google Scholar]
- 15.Gouda MA. Common pitfalls in reporting the use of SPSS software. Med Princ Pract. 2015;24(3):300. doi: 10.1159/000381953. Cited in: Pubmed; PMID 25895435. Epub 20150417. [DOI] [PMC free article] [PubMed] [Google Scholar]
- 16.Royston P. Tools for checking calibration of a cox model in external validation: approach based on individual event probabilities. The Stata J. 2014;14(4):738–755. doi: 10.1177/1536867x1401400403. [DOI] [Google Scholar]
- 17.Topalian SL, Hodi FS, Brahmer JR, Gettinger SN, Smith DC, McDermott DF, Powderly JD, Carvajal RD, Sosman JA, Atkins MB, et al. Safety, activity, and immune correlates of anti-PD-1 antibody in cancer. N Engl J Med. 2012. June 28;366(26):2443–2454. doi: 10.1056/NEJMoa1200690. Cited in: Pubmed; PMID 22658127. Epub 20120602. [DOI] [PMC free article] [PubMed] [Google Scholar]
- 18.Sato K, Hall C, Glaser S, Francis H, Meng F, Alpini G. Pathogenesis of Kupffer cells in cholestatic liver injury. Am J Pathol. 2016. 09;186(9):2238–2247. doi: 10.1016/j.ajpath.2016.06.003. Cited in: Pubmed; PMID 27452297. Epub 20160722. [DOI] [PMC free article] [PubMed] [Google Scholar]
- 19.Raggi C, Correnti M, Sica A, Andersen JB, Cardinale V, Alvaro D, Chiorino G, Forti E, Glaser S, Alpini G, et al. Cholangiocarcinoma stem-like subset shapes tumor-initiating niche by educating associated macrophages. J Hepatol. 2017. 01;66(1):102–115. doi: 10.1016/j.jhep.2016.08.012. Cited in: Pubmed; PMID 27593106. Epub 20160901. [DOI] [PMC free article] [PubMed] [Google Scholar]
- 20.Loeuillard E, Yang J, Buckarma E, Wang J, Liu Y, Conboy C, Pavelko KD, Li Y, O’Brien D, Wang C, et al. Targeting tumor-associated macrophages and granulocytic myeloid-derived suppressor cells augments PD-1 blockade in cholangiocarcinoma. J Clin Invest. 2020. 10;130(10):5380–5396. doi: 10.1172/JCI137110. Cited in: Pubmed; PMID 32663198. [DOI] [PMC free article] [PubMed] [Google Scholar]
- 21.Hasita H, Komohara Y, Okabe H, Masuda T, Ohnishi K, Lei XF, Beppu T, Baba H, Takeya M. Significance of alternatively activated macrophages in patients with intrahepatic cholangiocarcinoma. Cancer Sci. 2010. Aug;101(8):1913–1919. doi: 10.1111/j.1349-7006.2010.01614.x. Cited in: Pubmed; PMID 20545696. Epub 2010/05/12. [DOI] [PMC free article] [PubMed] [Google Scholar]
- 22.Yuan H, Lin Z, Liu Y, Jiang Y, Liu K, Tu M, Yao N, Qu C, Hong J. Intrahepatic cholangiocarcinoma induced M2-polarized tumor-associated macrophages facilitate tumor growth and invasiveness. Cancer Cell Int. 2020. Dec 07;20(1):586. doi: 10.1186/s12935-020-01687-w. Cited in: Pubmed; PMID 33372604. Epub 20201207. [DOI] [PMC free article] [PubMed] [Google Scholar]
- 23.Clawson GA. Cancer. Fusion for moving. Science. 2013. Nov;342(6159):699–700. doi: 10.1126/science.1244270. Cited in: Pubmed; PMID 24202164. [DOI] [PubMed] [Google Scholar]
- 24.Pawelek JM, Chakraborty AK. Fusion of tumour cells with bone marrow-derived cells: a unifying explanation for metastasis. Nat Rev Cancer. 2008. 05;8(5):377–386. doi: 10.1038/nrc2371. Cited in: Pubmed; PMID 18385683. [DOI] [PubMed] [Google Scholar]
- 25.Zhang QW, Zhu MX, Liu WF, Rui WW, Chen Y, Ding XY, Jiang YS, Wu ZY, Liu BB. Identification of clinically relevant subsets CD39(+)PD-1(+)CD8(+) T cells and CD39(+) regulatory T cells in intrahepatic cholangiocarcinoma using single-cell CyTOF. Transl Oncol. 2024. June;44:101954. Declaration of competing interest The authors declare that they have no known competing financial interests or personal relationships that could have appeared to influence the work reported in this paper. doi: 10.1016/j.tranon.2024.101954. Cited in: Pubmed; PMID 38608405. Epub 20240411. [DOI] [PMC free article] [PubMed] [Google Scholar]
- 26.Oshikiri T, Miyamoto M, Shichinohe T, Suzuoki M, Hiraoka K, Nakakubo Y, Shinohara T, Itoh T, Kondo S, Katoh H. Prognostic value of intratumoral CD8+ T lymphocyte in extrahepatic bile duct carcinoma as essential immune response. J Surg Oncol. 2003. Dec;84(4):224–228. doi: 10.1002/jso.10321. Cited in: Pubmed; PMID 14756433. [DOI] [PubMed] [Google Scholar]
- 27.Deng M, Li SH, Fu X, Yan XP, Chen J, Qiu YD, Guo RP. Relationship between PD-L1 expression, CD8+ T-cell infiltration and prognosis in intrahepatic cholangiocarcinoma patients. Cancer Cell Int. 2021. Jul 12;21(1):371. doi: 10.1186/s12935-021-02081-w. Cited in: Pubmed; PMID 34253205. Epub 20210712. [DOI] [PMC free article] [PubMed] [Google Scholar]
- 28.Borst J, Ahrends T, Bąbała N, Melief CJM, Kastenmüller W. CD4. Nat Rev Immunol. 2018. 10;18(10):635–647. doi: 10.1038/s41577-018-0044-0. Cited in: Pubmed; PMID 30057419. [DOI] [PubMed] [Google Scholar]
- 29.Janssen EM, Lemmens EE, Wolfe T, Christen U, von Herrath MG, Schoenberger SP. CD4+ T cells are required for secondary expansion and memory in CD8+ T lymphocytes. Nature. 2003. Feb;421(6925):852–856. doi: 10.1038/nature01441. Cited in: Pubmed; PMID 12594515. Epub 2003/02/09. [DOI] [PubMed] [Google Scholar]
- 30.Shedlock DJ, Shen H. Requirement for CD4 T cell help in generating functional CD8 T cell memory. Science. 2003. Apr;300(5617):337–339. doi: 10.1126/science.1082305. Cited in: Pubmed; PMID 12690201. [DOI] [PubMed] [Google Scholar]
- 31.Xu G, Sun L, Li Y, Xie F, Zhou X, Yang H, Du S, Xu H, Mao Y. The clinicopathological and prognostic value of PD-L1 expression in cholangiocarcinoma: a meta-analysis. Front Oncol. 2019;9:897. doi: 10.3389/fonc.2019.00897. Cited in: Pubmed; PMID 31620360. Epub 20190918. [DOI] [PMC free article] [PubMed] [Google Scholar]
- 32.Sabbatino F, Villani V, Yearley JH, Deshpande V, Cai L, Konstantinidis IT, Moon C, Nota S, Wang Y, Al-Sukaini A, et al. PD-L1 and HLA class I antigen expression and clinical course of the disease in intrahepatic cholangiocarcinoma. Clin Cancer Res. 2016. Jan;22(2):470–478. doi: 10.1158/1078-0432.CCR-15-0715. Cited in: Pubmed; PMID 26373575. Epub 2015/09/15. [DOI] [PMC free article] [PubMed] [Google Scholar]
- 33.Walter D, Herrmann E, Schnitzbauer AA, Zeuzem S, Hansmann ML, Peveling-Oberhag J, Hartmann S. PD-L1 expression in extrahepatic cholangiocarcinoma. Histopathology. 2017. Sep;71(3):383–392. doi: 10.1111/his.13238. Cited in: Pubmed; PMID 28419539. Epub 2017/06/23. [DOI] [PubMed] [Google Scholar]
- 34.Carapeto F, Bozorgui B, Shroff RT, Chagani S, Solis Soto L, Foo WC, Wistuba I, Meric-Bernstam F, Shalaby A, Javle M, et al. The immunogenomic landscape of resected intrahepatic cholangiocarcinoma. Hepatology. 2022. Feb;75(2):297–308. eng. The authors declare no conflicts. doi: 10.1002/hep.32150. Cited in: Pubmed; PMID 34510503. Epub 20211206. [DOI] [PMC free article] [PubMed] [Google Scholar]
- 35.Kriegsmann M, Roessler S, Kriegsmann K, Renner M, Longuespée R, Albrecht T, Loeffler M, Singer S, Mehrabi A, Vogel MN, et al. Programmed cell death ligand 1 (PD-L1, CD274) in cholangiocarcinoma - correlation with clinicopathological data and comparison of antibodies. BMC Cancer. 2019. Jan 15;19(1):72. eng. ETHICS APPROVAL AND CONSENT TO PARTICIPATE: Tissues were used in accordance with the ethical regulations of the NCT tissue bank established by the local ethics committee (S-207/2015). Ethics approval, written and verbal consent to participate has been given by all participants. CONSENT FOR PUBLICATION: Consent for publication has been obtained (NCT; project # 2116 and S-207/2015). COMPETING INTERESTS: The authors declare that they have no competing interests. PUBLISHER’S NOTE: Springer Nature remains neutral with regard to jurisdictional claims in published maps and institutional affiliations. doi: 10.1186/s12885-018-5254-0. Cited in: Pubmed; PMID 30646854. Epub 20190115. [DOI] [PMC free article] [PubMed] [Google Scholar]
- 36.Piha-Paul SA, Oh DY, Ueno M, Malka D, Chung HC, Nagrial A, Kelley RK, Ros W, Italiano A, Nakagawa K, et al. Efficacy and safety of pembrolizumab for the treatment of advanced biliary cancer: results from the KEYNOTE-158 and KEYNOTE-028 studies. Int J Cancer. 2020. Oct;147(8):2190–2198. doi: 10.1002/ijc.33013. Cited in: Pubmed; PMID 32359091. Epub 2020/05/02. [DOI] [PubMed] [Google Scholar]
- 37.Ott PA, Bang YJ, Piha-Paul SA, Razak ARA, Bennouna J, Soria JC, Rugo HS, Cohen RB, O’Neil BH, Mehnert JM, et al. T-Cell–inflamed gene-expression profile, programmed death ligand 1 expression, and tumor mutational burden predict efficacy in patients treated with pembrolizumab across 20 cancers: KEYNOTE-028. J Clin Oncol. 2019. 02;37(4):318–327. doi: 10.1200/JCO.2018.78.2276. Cited in: Pubmed; PMID 30557521. Epub 2018/12/13. [DOI] [PubMed] [Google Scholar]
- 38.Fontugne J, Augustin J, Pujals A, Compagnon P, Rousseau B, Luciani A, Tournigand C, Cherqui D, Azoulay D, Pawlotsky JM, et al. PD-L1 expression in perihilar and intrahepatic cholangiocarcinoma. Oncotarget. 2017. Apr;8(15):24644–24651. doi: 10.18632/oncotarget.15602. Cited in: Pubmed; PMID 28445951. [DOI] [PMC free article] [PubMed] [Google Scholar]
- 39.Kitano Y, Yamashita YI, Nakao Y, Itoyama R, Yusa T, Umezaki N, Tsukamoto M, Yamao T, Miyata T, Nakagawa S, et al. Clinical significance of PD-L1 expression in both cancer and stroma cells of cholangiocarcinoma patients. Ann Surg Oncol. 2020. Feb;27(2):599–607. doi: 10.1245/s10434-019-07701-4. Cited in: Pubmed; PMID 31407173. Epub 2019/08/12. [DOI] [PubMed] [Google Scholar]
- 40.Diskin B, Adam S, Cassini MF, Sanchez G, Liria M, Aykut B, Buttar C, Li E, Sundberg B, Salas RD, et al. PD-L1 engagement on T cells promotes self-tolerance and suppression of neighboring macrophages and effector T cells in cancer. Nat Immunol. 2020. 04;21(4):442–454. doi: 10.1038/s41590-020-0620-x. Cited in: Pubmed; PMID 32152508. Epub 2020/03/09. [DOI] [PubMed] [Google Scholar]
- 41.Lau J, Cheung J, Navarro A, Lianoglou S, Haley B, Totpal K, Sanders L, Koeppen H, Caplazi P, McBride J, et al. Tumour and host cell PD-L1 is required to mediate suppression of anti-tumour immunity in mice. Nat Commun. 2017. 02;8(1):14572. doi: 10.1038/ncomms14572. Cited in: Pubmed; PMID 28220772. Epub 2017/02/21. [DOI] [PMC free article] [PubMed] [Google Scholar]
- 42.Gabrilovich DI, Nagaraj S. Myeloid-derived suppressor cells as regulators of the immune system. Nat Rev Immunol. 2009. Mar;9(3):162–174. doi: 10.1038/nri2506. Cited in: Pubmed; PMID 19197294. [DOI] [PMC free article] [PubMed] [Google Scholar]
- 43.Singhal S, Stadanlick J, Annunziata MJ, Rao AS, Bhojnagarwala PS, O’Brien S, Moon EK, Cantu E, Danet-Desnoyers G, Ra HJ, et al. Human tumor-associated monocytes/macrophages and their regulation of T cell responses in early-stage lung cancer. Sci Transl Med. 2019. 02;11(479). doi: 10.1126/scitranslmed.aat1500. Cited in: Pubmed; PMID 30760579. [DOI] [PMC free article] [PubMed] [Google Scholar]
- 44.Halbrook CJ, Pontious C, Kovalenko I, Lapienyte L, Dreyer S, Lee HJ, Thurston G, Zhang Y, Lazarus J, Sajjakulnukit P, et al. Macrophage-released pyrimidines inhibit gemcitabine therapy in pancreatic cancer. Cell Metab. 2019. 06;29(6):1390–1399.e6. doi: 10.1016/j.cmet.2019.02.001. Cited in: Pubmed; PMID 30827862. Epub 2019/02/28. [DOI] [PMC free article] [PubMed] [Google Scholar]
- 45.Hamy AS, Pierga JY, Sabaila A, Laas E, Bonsang-Kitzis H, Laurent C, Vincent-Salomon A, Cottu P, Lerebours F, Rouzier R, et al. Stromal lymphocyte infiltration after neoadjuvant chemotherapy is associated with aggressive residual disease and lower disease-free survival in HER2-positive breast cancer. Ann Oncol. 2017. Sep;28(9):2233–2240. doi: 10.1093/annonc/mdx309. Cited in: Pubmed; PMID 28911063. [DOI] [PubMed] [Google Scholar]
- 46.Feng K, Liu Y, Zhao Y, Yang Q, Dong L, Liu J, Li X, Zhao Z, Mei Q, Han W. Efficacy and biomarker analysis of nivolumab plus gemcitabine and cisplatin in patients with unresectable or metastatic biliary tract cancers: results from a phase II study. J Immunother Cancer. 2020. 06;8(1):e000367. doi: 10.1136/jitc-2019-000367. Cited in: Pubmed; PMID 32487569. [DOI] [PMC free article] [PubMed] [Google Scholar]
- 47.Au KK, Le Page C, Ren R, Meunier L, Clément I, Tyrishkin K, Peterson N, Kendall-Dupont J, Childs T, Francis JA, et al. STAT1-associated intratumoural T. J Pathol Clin Res. 2016. Oct;2(4):259–270. doi: 10.1002/cjp2.55. Cited in: Pubmed; PMID 27917296. Epub 2016/09/19. [DOI] [PMC free article] [PubMed] [Google Scholar]
- 48.Mikhak Z, Fleming CM, Medoff BD, Thomas SY, Tager AM, Campanella GS, Luster AD. STAT1 in peripheral tissue differentially regulates homing of antigen-specific Th1 and Th2 cells. J Immunol. 2006. Apr;176(8):4959–4967. doi: 10.4049/jimmunol.176.8.4959. Cited in: Pubmed; PMID 16585592. [DOI] [PubMed] [Google Scholar]
- 49.Zemek RM, De Jong E, Chin WL, Schuster IS, Fear VS, Casey TH, Forbes C, Dart SJ, Leslie C, Zaitouny A, et al. Sensitization to immune checkpoint blockade through activation of a STAT1/NK axis in the tumor microenvironment. Sci Transl Med. 2019. July 17;11(501). doi: 10.1126/scitranslmed.aav7816. Cited in: Pubmed; PMID 31316010. [DOI] [PubMed] [Google Scholar]
- 50.Dong H, Strome SE, Salomao DR, Tamura H, Hirano F, Flies DB, Roche PC, Lu J, Zhu G, Tamada K, et al. Tumor-associated B7-H1 promotes T-cell apoptosis: a potential mechanism of immune evasion. Nat Med. 2002. Aug;8(8):793–800. doi: 10.1038/nm730. Cited in: Pubmed; PMID 12091876. Epub 2002/06/24. [DOI] [PubMed] [Google Scholar]
- 51.Liu F, Liu J, Zhang J, Shi J, Gui L, Xu G. Expression of STAT1 is positively correlated with PD-L1 in human ovarian cancer. Cancer Biol Ther. 2020. 10;21(10):963–971. doi: 10.1080/15384047.2020.1824479. Cited in: Pubmed; PMID 33043814. Epub 2020/10/12. [DOI] [PMC free article] [PubMed] [Google Scholar]
- 52.Zhao T, Li Y, Zhang J, Zhang B. PD-L1 expression increased by ifn-γ via JAK2-STAT1 signaling and predicts a poor survival in colorectal cancer. Oncol Lett. 2020. Aug;20(2):1127–1134. doi: 10.3892/ol.2020.11647. Cited in: Pubmed; PMID 32724352. Epub 2020/05/20. [DOI] [PMC free article] [PubMed] [Google Scholar]
- 53.David M, Grimley PM, Finbloom DS, Larner AC. A nuclear tyrosine phosphatase downregulates interferon-induced gene expression. Mol Cell Biol. 1993. Dec;13(12):7515–7521. doi: 10.1128/mcb.13.12.7515. Cited in: Pubmed; PMID 8246969. [DOI] [PMC free article] [PubMed] [Google Scholar]
- 54.Thomas SJ, Snowden JA, Zeidler MP, Danson SJ. The role of JAK/STAT signalling in the pathogenesis, prognosis and treatment of solid tumours. Br J Cancer. 2015. Jul;113(3):365–371. doi: 10.1038/bjc.2015.233. Cited in: Pubmed; PMID 26151455. Epub 2015/07/07. [DOI] [PMC free article] [PubMed] [Google Scholar]
- 55.Casanova JL, Holland SM, Notarangelo LD. Inborn errors of human JAKs and STATs. Immunity. 2012. Apr 20;36(4):515–528. doi: 10.1016/j.immuni.2012.03.016. Cited in: Pubmed; PMID 22520845. [DOI] [PMC free article] [PubMed] [Google Scholar]
- 56.Benekli M, Baumann H, Wetzler M. Targeting signal transducer and activator of transcription signaling pathway in leukemias. J Clin Oncol. 2009. Sep;27(26):4422–4432. doi: 10.1200/JCO.2008.21.3264. Cited in: Pubmed; PMID 19667270. Epub 2009/08/10. [DOI] [PMC free article] [PubMed] [Google Scholar]
Associated Data
This section collects any data citations, data availability statements, or supplementary materials included in this article.
Supplementary Materials
Data Availability Statement
All data relevant to the study are included in the article or uploaded as online supplemental information.