Abstract
Hearing loss is the third most prevalent chronic health condition affecting older adults and age-related hearing loss (ARHL) is the most common form of hearing impairment. Significant sex differences in hearing have been documented in humans and rodents. In general, the results of these studies show that men lose their hearing more rapidly than women. However, the cellular mechanism underlying sex differences in hearing or hearing loss remains largely unknown, and to our knowledge, there is no well-established animal model for studying sex differences in hearing. In the current study, we examined sex differences in body composition, voluntary wheel running activity, balance performance, auditory function, and cochlear histology in young, middle-age, and old CBA/CaJ mice, a model of age-related hearing loss. As expected, body weight of young females was lower than that of males. Similarly, lean mass and total water mass of young, middle-age, and old females were lower than those of males. Young females showed higher voluntary wheel running activity during the dark cycle, an indicator of mobility, physical activity, and balance status, compared to males. Young females also displayed higher auditory brainstem response (ABR) wave I amplitudes at 8 kHz, wave II, III, V amplitudes at 8 and 48 kHz, and wave IV/I and V/I amplitude ratios at 48 kHz compared to males. Collectively, our findings suggest that the CBA/CaJ mouse strain is a useful model to study the cellular mechanisms underlying sex differences in physical activity and hearing.
Keywords: Sex differences, Balance, Mobility, Physical activity, Aging, Hearing loss
1. Introduction
It is well-documented that women live longer than men (Austad, 2006). In support of this observation, more than 80% of centenarians in the U.S. are women (Meyer, 2012). A similar pattern of sex differences in longevity is also found in many other species, including rodents, dogs, and monkeys (Austad, 2006). The advantage that females have in longevity over males can also be observed in other human disorders, including hearing. For example, Lin et al. (2011) found that the prevalence of hearing loss was lower in women than in men. In agreement with this report, women show better hearing thresholds and more robust ABRs throughout the lifespan compared to age-matched men (Chung et al., 1983; Jerger and Johnson, 1988). Moreover, women demonstrate lower hearing thresholds for high-frequency sounds (Chung et al., 1983), shorter auditory brainstem response (ABR) wave latencies, and larger wave amplitudes than men (Dehan and Jerger, 1990). Women also produce more numerous and stronger spontaneous otoacoustic emissions (SOAEs) and larger amplitudes of click-evoked otoacoustic emissions (CEOAEs) compared to men (McFadden and Pasanen, 1999, 1998; McFadden et al., 1996). An unanswered question is why do women have better auditory sensitivity than men? Why is hearing loss more prevalent in men than in women?
Hearing loss is the third most prevalent chronic health condition affecting older adults and age-related hearing loss (ARHL) is the most common form of hearing impairment (Yamasoba et al., 2013). ARHL is characterized by threshold shifts, poor speech understanding particularly in noise, impaired temporal resolution, and central auditory processing deficits. The major sites of age-related cochlear pathology typically include inner hair cells (IHCs), outer hair cells (OHCs), synapses loss, spiral ganglion neurons (SGNs), and stria vascularis (SV). Factors such as genetic predisposition, excessive noise, and ototoxic exposure can further accelerate hearing loss when accompanied by the natural aging process. The effects of cochlear aging audiologically represent themselves in a “ski-slope” shape, from low-frequency to high-frequency, in puretone audiometry thresholds. This can be attributed to the degeneration of auditory hair cells within the cochlea, with more profound degeneration observed at the basal region, responsible for high frequency responses (Boettcher et al., 2002). Additionally, the degeneration of SGNs as well as loss of synapses influence ABRs as wave amplitudes decrease and or wave latencies and interpeak latencies increase as individuals age.
Balance impairment and falls are among the most prevalent and morbid conditions affecting older adults (Agrawal et al., 2020), while obesity is associated with mobility loss and functional decline in older adults (Anton et al., 2015). Body mass index and obesity are also associated with hearing loss in older adults (Yang et., 2020; Koo et al., 2022; Croll et al., 2019; Dalton et al., 2019; Hu et al., 2019; Li et al., 2022; Kohlberg et al., 2018). However, the cellular mechanisms underlying sex differences in hearing are largely unknown. In addition, female mammals have long been neglected in biomedical research; for example, animal research has demonstrated sex bias that favors male over female research subjects and studies of both sexes frequently fail to analyze results by sex. (Mamlouk et al., 2020; Beery et al., 2010). Thus, the goal of the current study was to examine the sex differences in body composition, voluntary wheel running activity, balance performance, auditory function, and cochlear histology in CBA/CaJ mice across the lifespan.
2. Methods
2.1. Animals
CBA/CaJ mice were obtained from Jackson Laboratory (https://www.jax.org/strain/000654). Both male and female CBA/CaJ mice were used in the current study. All animal experiments were conducted under protocols approved by the University of Florida Institutional Animal Care and Use Committee.
2.2. Rotarod balance performance
Mice were trained to use a rotarod apparatus (Rota Rod Rotamex 5; Columbus Instruments) with an acceleration of 2 rpm every 17 s starting from 4 rpm to 40 rpm during the first five trials (trials 1–5). The rotarod performance (average latency to fall) was recorded during the next three trials (trials 6–8) as described by (Tung et al. 2014). Three age groups and two sex groups were used in the rotarod performance tests: 5 m (20, 10 males and 10 females), 16 m (20, 10 males and 10 females), 24 m (20, 10 males and 10 females). We performed power analysis on previous study results to estimate the minimum sample size required for ABR and balance performance measurements and arrived at a group size of 10 for a comparison of 3 age groups. The same animals were used for the rotarod performance, voluntary wheel running activity, and body composition experiments. The rotarod performance test was performed first, followed by the wheel running activity, and the body composition test.
2.3. Voluntary wheel running activity
Mice were single housed in a cage with a running wheel (Coulbourn Instruments). The voluntary wheel running activity (average running distance per day) was recorded for 1 day (24 h) by the computer connected to the running wheels using ClockLab (Coulbourn Instruments) and the number of revolutions was calculated using ClockLab Analysis (Coulbourn Instruments) and converted to the running distance per day (meters/day) as previously described (Han et al., 2016). All wheel running animals were maintained on a 12-h light/12-h dark cycle (changing at 7 am and 7 pm). Three age groups and two sex groups were used in the wheel running activity tests: 5 m (20, 10 males and 10 females), 16 m (16, 6 males and 10 females), 24 m (15, 7 males and 8 females). The same animals were used for the rotarod performance, voluntary wheel running activity, and body composition experiments. We used fewer than 10 mice per group for the middle-age and old groups due to technical and software issues.
2.4. Body composition
Body composition was quantified in conscious mice using EchoMRI Quantitative Magnetic Resonance Body Composition Analyzer (Echo Medical Systems) as described by Harfmann et al. (2016). Briefly, a canola oil probe was used to standardize the machine. Each mouse was weighed, placed into the EchoMRI mouse tube, and placed into the EchoMRI machine. The program performed three scans and took an average for each category. The system recorded the data for fat, lean, free water, total water, and overall mass. Three age groups and two sex groups were used in the body composition tests: 6 m (20, 10 males and 10 females), 17 m (20, 10 males and 10 females), 24 m (20, 10 males and 10 females). The same animals were used for the rotarod performance, voluntary wheel running activity, and body composition experiments.
2.5. Auditory brainstem response
Auditory brainstem response (ABR) hearing tests were performed using an ABR recording system (Tucker-Davis Technologies) as previously described (Kim et al., 2019; Kim et al., 2020). Mice were anesthetized with ketamine (100 mg/kg) and xylazine (10 mg/kg) by intraperitoneal injection. Subdermal needle electrodes were placed at the vertex (active), ipsilateral ear (reference), and contralateral ear (ground). The output from the speaker was channeled through a plastic tube into the animal’s right ear canal (closed field). Tone calibration was done according to the Tucker-Davis Technologies’ ABR User Guide (https://www.tdt.com/files/manuals/ABRGuide.pdf). ABR thresholds were measured with a tone burst stimulus at 4, 8, 16, 32, 48, and 64 kHz. At each frequency, the sound level was reduced in 5–10 dB sound pressure level (SPL) steps from 90 to 10 dB SPL. The threshold was defined as the lowest stimulus level at which response peaks for wave I were clearly and repetitively present upon visual inspection. Amplitudes and latencies for ABR waves I, II, III, IV, and V were measured with a tone burst stimulus of 90 dB SPL at 4, 8, 16, 32, 48, and 64 kHz and a click stimulus of 100 dB SPL. A wave amplitude was determined by measuring the voltage difference between the highest value (peak) and the lowest value (trough) of each ABR wave as previously described (Chen et al., 2014). A wave latency was determined by measuring the amount of time elapsed from the onset of the stimulus to the highest value (peak) of each ABR wave. Three age groups and two sex groups were used in the ABR threshold tests: 5 m (20, 10 males and 10 females), 17 m (21, 11 males and 10 females), 24 m (19, 10 males and 9 females). We used 11 males for the middle-age group because one extra mouse was added to the middle-age group at the start of the experiment in case of high mortality. We used 9 females for the old group because 2 mice died before 24 months of age (we had 11 females for the old group at the start of the experiment). Three age groups and two sex groups were used in the ABR wave and latency tests: 8 kHz, 5 m (20, 10 males and 10 females), 17 m (21, 11 males and 10 females), 24 m (18, 9 males and 9 females); 16 kHz, 5 m (20, 10 males and 10 females), 17 m (21, 11 males and 10 females), 24 m (19, 10 males and 9 females); 32 kHz, 5 m (20, 10 males and 10 females), 17 m (21, 11 males and 10 females), 24 m (19, 10 males and 9 females); 48 kHz, 5 m (20, 10 males and 10 females), 17 m (21, 11 males and 10 females), 24 m (18, 10 males and 8 females). We used 8 females for the old group because ABR response peaks for waves I-V at 48 kHz were not clearly and repetitively present upon visual inspection. The same animals were used for the ABR threshold, wave amplitude, and wave latency tests. Following the ABR tests, inner ear tissues were dissected from each age group and used to conduct histopathological analyses.
2.6. Cochlear histopathology
2.6.1. Sample preparation
Three to five days following ABR hearing tests, mice were sacrificed by cervical dislocation from each sex/age group. Temporal bones were excised from the head and divided into cochlear and vestibular parts as previously described (Kim et al., 2019, 2020). For cochleograms, the excised cochleae were immersed in 10% formalin for 1 day. For paraffin-embedded cochlear sections, the excised cochleae were immersed in 4% paraformaldehyde in PBS for 1 day, decalcified in 10% EDTA in PBS, pH 7.4 for 5–7 days, and embedded in paraffin. Serial sections were cut at 5 μm (parallel to the modiolus), mounted on glass slides, stained with hematoxylin and eosin (H&E), and observed under a light microscope (Leica DM3000; Leica Microsystems). H&E-stained cochlear sections were used for auditory nerve fiber density and stria vascularis thickness measurements.
2.6.2. Cytocochleograms
The organ of Corti was dissected out and cut into three pieces and mounted in glycerin on glass slides. The surface preparations were stained with Ehrlich’s hematoxylin solution and examined with light microscope (Zeiss Standard, 400 X) using differential interference contrast optics. The numbers of inner hair cells (IHCs) and outer hair cells (OHCs) were counted over 0.24 mm intervals from the apex to the base of the cochlea under a microscope at 400X magnification as previously described (Zheng et al., 2009; Ding et al., 2013). The counting results were entered into a custom computer program designed to compute a cochleogram that shows percentage of missing IHCs and OHCs as a function of percentage distance from the apex of the cochlea. For the IHC counts, we used 28 mice for 0 ~90% distance from the cochlear apex: 6 m (10, 5 males and 5 females), 17 m (10, 5 males and 5 females), 24 m (8, 4 males and 4 females); and 27 mice for 90~100% distance from the cochlear apex: 6 m (10, 5 males and 5 females), 17 m (10, 5 males and 5 females), 24 m (7, 4 males and 3 females) (Fig. 12). For the OHC counts, we used 28 mice for 0~90% distance from the cochlear apex: 6 m (10, 5 males and 5 females), 17 m (10, 5 males and 5 females), 24 m (8, 4 males and 4 females); and 26 mice for 90~100% distance from the cochlear apex, 6 m (10, 5 males and 5 females), 17 m (9, 4 males and 5 females), 24 m (7, 4 males and 3 females) (Fig. 13). We used 3–4 mice for the middle-age and old groups (n < 5) because the cochleae were damaged during dissection or some died before the age of 17 or 24 months.
Fig. 12.
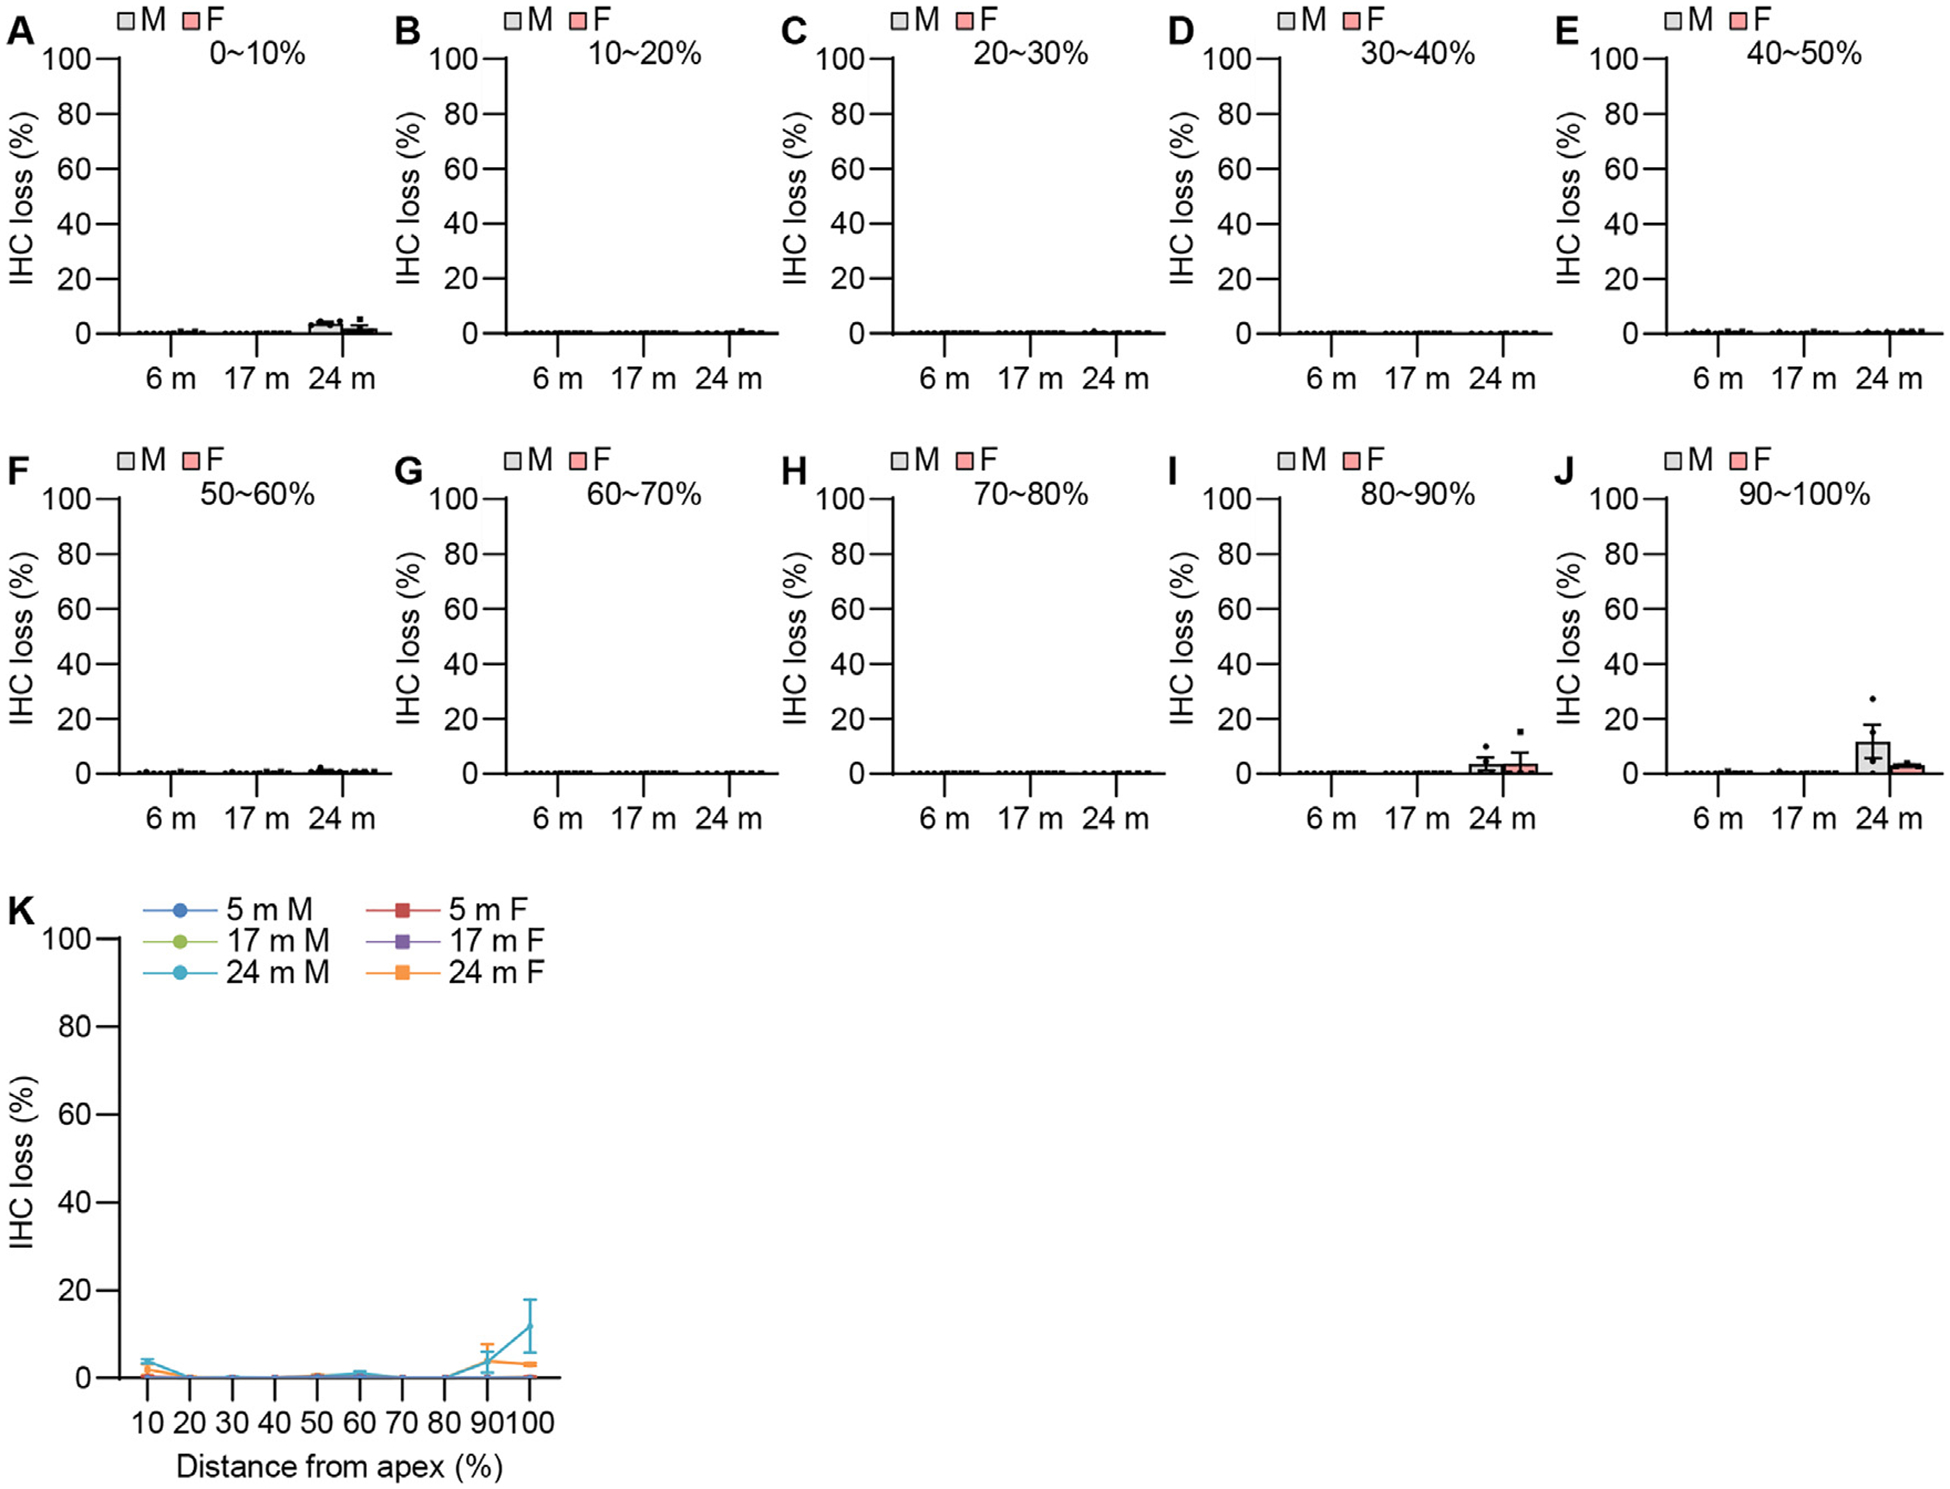
IHC survival. IHC losses were measured at 0~10% (A, K), 10~20% (B, K), 20~30% (C, K), 30~40% (D, K), 40~50% (E, K), 50~60% (F, K), 60~70% (G, K), 70~80% (H, K), 80~90% (I, K), and 90~100% (J, K) distance regions from the cochlear apex in the cochlear tissues from male and female CBA/CaJ mice at 6, 17, and 24 months of age: 0~90%, 6 m (10, 5 males and 5 females), 17 m (10, 5 males and 5 females), 24 m (8, 4 males and 4 females); 0~100%, 6 m (10, 5 males and 5 females), 17 m (10, 5 males and 5 females), 24 m (7, 4 males and 3 females). Data are shown as means ± SEM. Two-way ANOVA with Bonferroni’s multiple comparisons test was performed; m, months of age. M, male; F, female; IHC, inner hair cell.
Fig. 13.
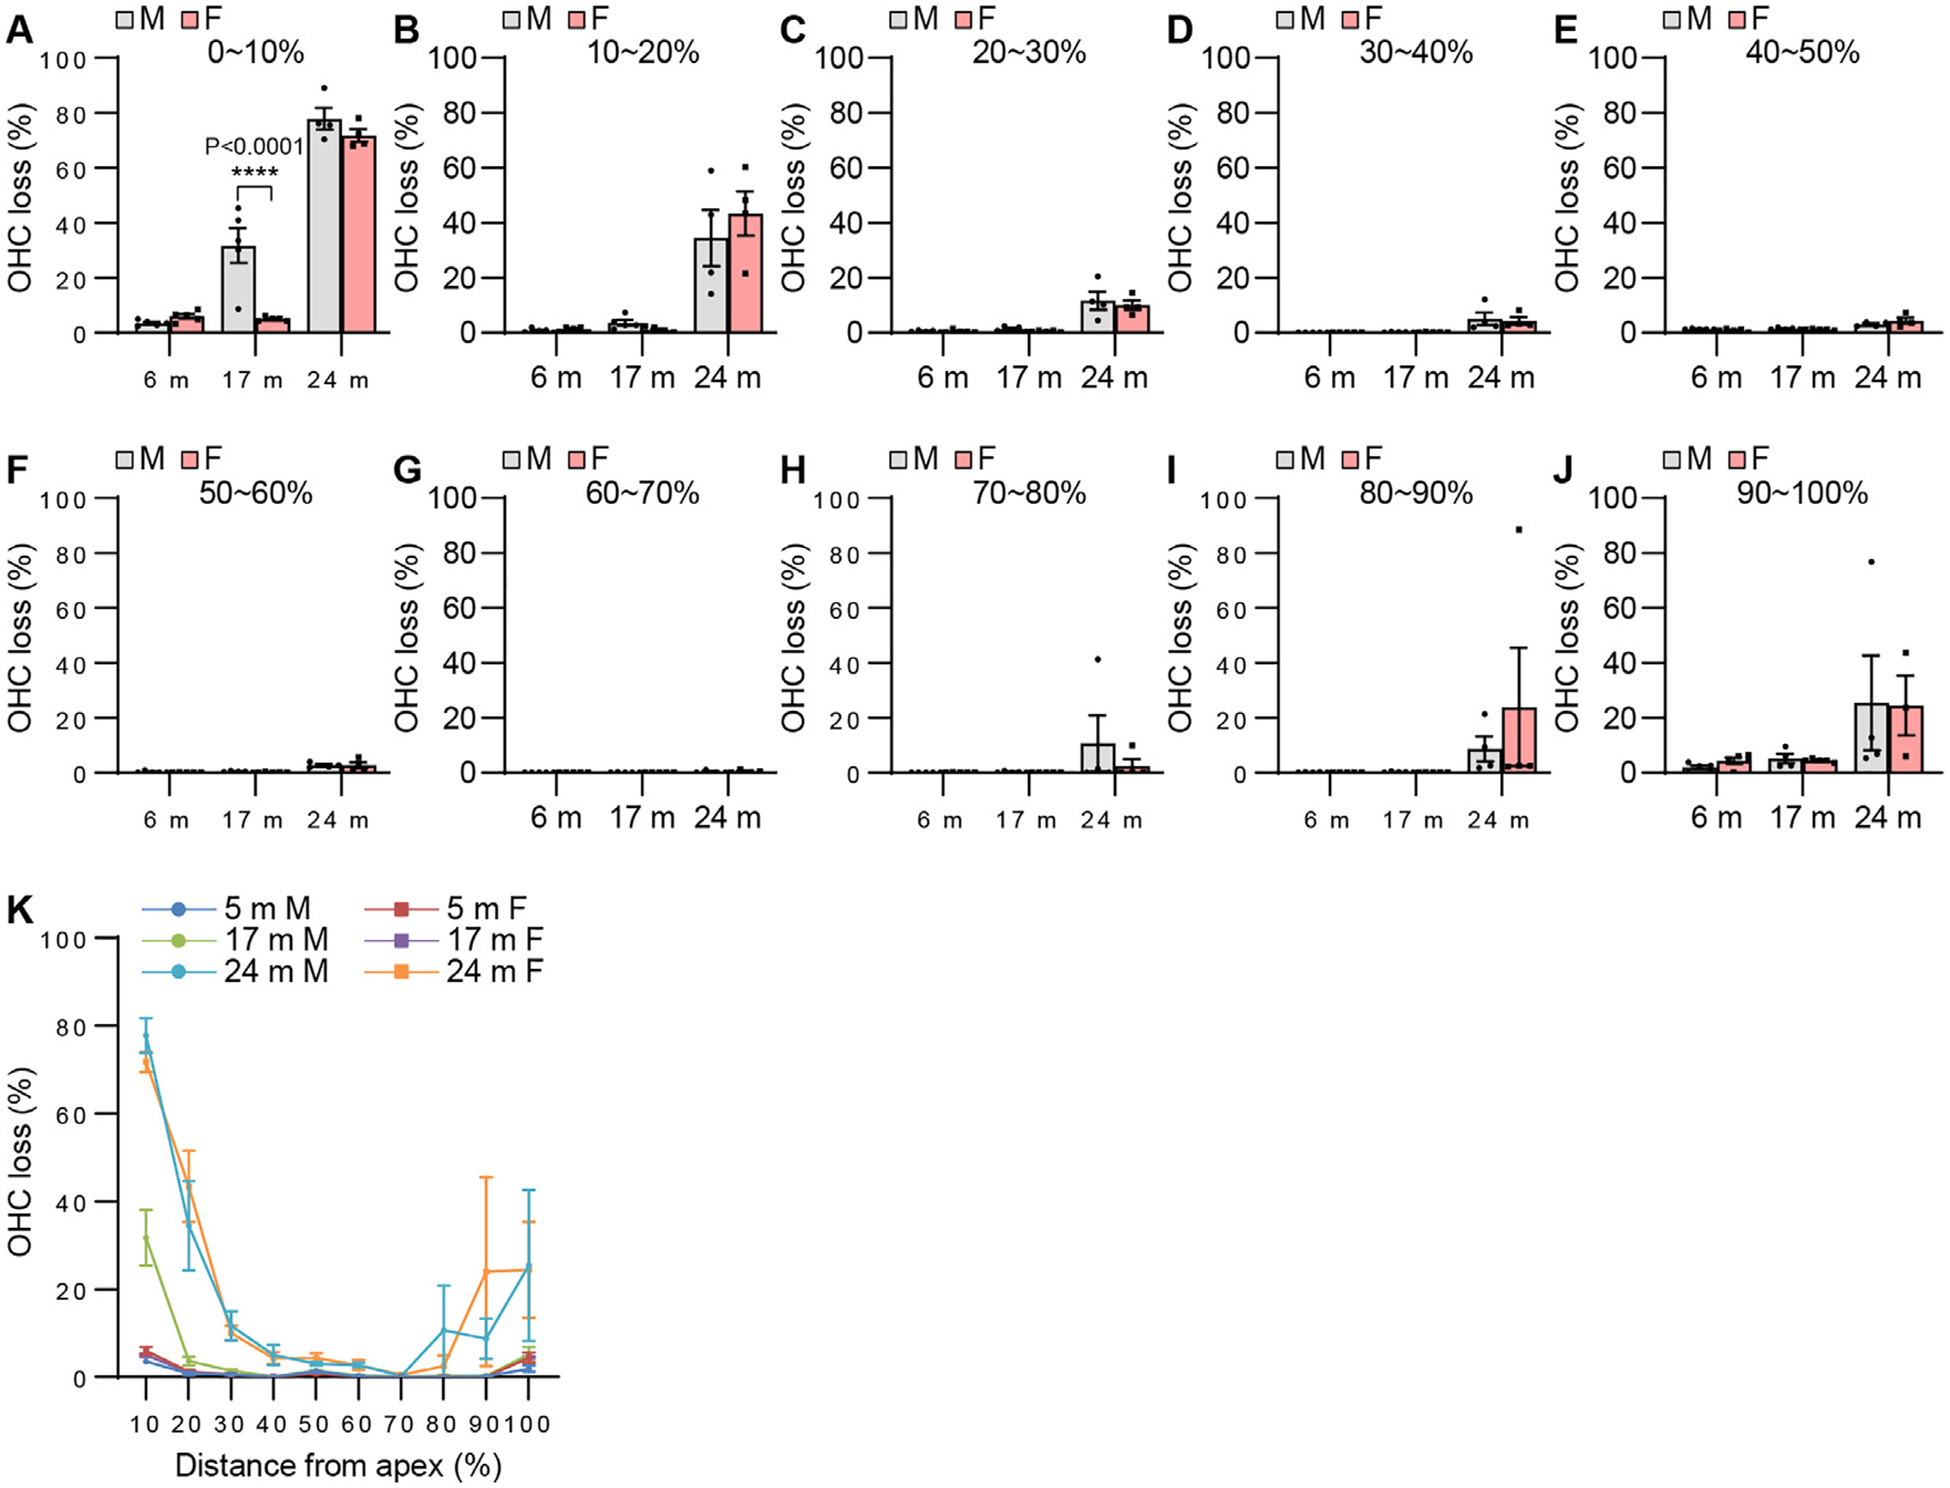
OHC survival. OHC losses were measured at 0~10% (A, K), 10 ~20% (B, K), 20~30% (C, K), 30~40% (D, K), 40~50% (E, K), 50~60% (F, K), 60~70% (G, K), 70~80% (H, K), 80~90% (I, K), and 90~100% (J, K) distance regions from the cochlear apex in the cochlear tissues from male and female CBA/CaJ mice at 6, 17, and 24 months of age: 0~90%, 6 m (10, 5 males and 5 females), 17 m (10, 5 males and 5 females), 24 m (8, 4 males and 4 females); 90~100%, 6 m (10, 5 males and 5 females), 17 m (9, 4 males and 5 females), 24 m (7, 4 males and 3 females). Data are shown as means ± SEM. Two-way ANOVA with Bonferroni’s multiple comparisons test was performed; A 0~10%, Post hoc Bonferroni’s tests showed a significant sex difference for 17 m (****, P < 0.0001), sex effect (F = 14.38, DF = 1, P = 0.0010), age effect (F = 241.8, DF = 2, P < 0.0001), interaction (F = 11.35, DF = 2, P = 0.0004); m, months of age. M, male; F, female; OHC, outer hair cell.
2.6.3. Auditory nerve fiver density
Auditory nerve fiber (ANF) density in the habenula perforata was measured in the middle region of the H&E-stained cochlear sections as described previously (Fu et al., 2012). Specimens were photographed with a digital camera (Leica DFC490; Leica Microsystems) and processed with Adobe Photoshop (Adobe) and ImageJ (National Institutes of Health). The numbers of ANFs in a 100 μm2 grid centered over each opening of the habenula perforata were counted. Counts were obtained from 7–10 habenular openings per animal for the middle region of the cochlea. No attempt was made to distinguish between efferent and afferent nerve fibers. We used 27 mice for the ANF density measurements: 6 m (10, 5 males and 5 females), 17 m (10, 5 males and 5 females), 24 m (7, 4 males and 3 females). We used 3 females for the old group because some of the aged mice died before the age of 24 months and or we were not able to observe ANF/habenula perforata in the cochleae of the remaining mice (the cochleae were damaged during dissection).
2.6.4. Stria vascularis thickness
Stria vascularis (SV) thickness was measured in the apical, middle, and basal regions of the H&E-stained cochlear sections as previously described (Kim et al., 2019). Specimens were photographed with a digital camera (Leica DFC490; Leica Microsystems) and processed with ImageJ (National Institutes of Health). The measurement was made by using a cursor to draw a line from the marginal cells to the basal cells half-way between the Reissner’s membrane and the spiral prominence. Thicknesses were obtained from 1–3 sections per animal for the apical, middle, and basal regions of the cochlea. We used 25–27 mice for the SV thickness measurements: Apical, 6 m (8, 3 males and 5 females), 17 m (10, 5 males and 5 females), 24 m (7, 4 males and 3 females); Middle, 6 m (10, 5 males and 5 females), 17 m (10, 5 males and 5 females), 24 m (7, 4 males and 3 females); Basal, 6 m (10, 5 males and 5 females), 17 m (10, 5 males and 5 females), 24 m (7, 4 males and 3 females). We used 3–4 mice for the young and old groups because we were not able to observe SV in the cochleae of the mice (the cochleae were damaged during dissection), or some of the aged mice died before the age of 24 months.
2.7. Statistical analysis
Two-way ANOVA (analysis of variance) with Bonferroni’s multiple comparisons test was carried out using GraphPad Prism 9 (GraphPad Software) to analyze rotarod latency, wheel running activity, fat, lean, free water, and total water mass, body weight, ABR threshold, ABR wave amplitude, latency, amplitude ratio, interpeak latency, cochlear IHC and OHC loss, ANF density, and SV thickness in mice.
3. Results
3.1. Sex differences in balance performance
Balance impairment and falls are among the most prevalent conditions in older adults (Agrawal et al., 2020). In laboratory mice and rats, physical activity, mobility, and balance performance has traditionally been assessed by the rotarod test, in which the animal is placed on a horizontal rod that rotates about its long axis and must walk forwards to remain upright and not fall off (Carter et al., 2001; Tung et al., 2014; Deacon RM, 2013). To examine sex differences in balance in CBA/CaJ mice across the lifespan, we measured rotarod balance performance (latency to fall) in male and female CBA/CaJ mice at 5, 16, and 24 months of age. There were no sex differences in latency to fall in young, middle-age, or old mice (Fig. 1).
Fig. 1.
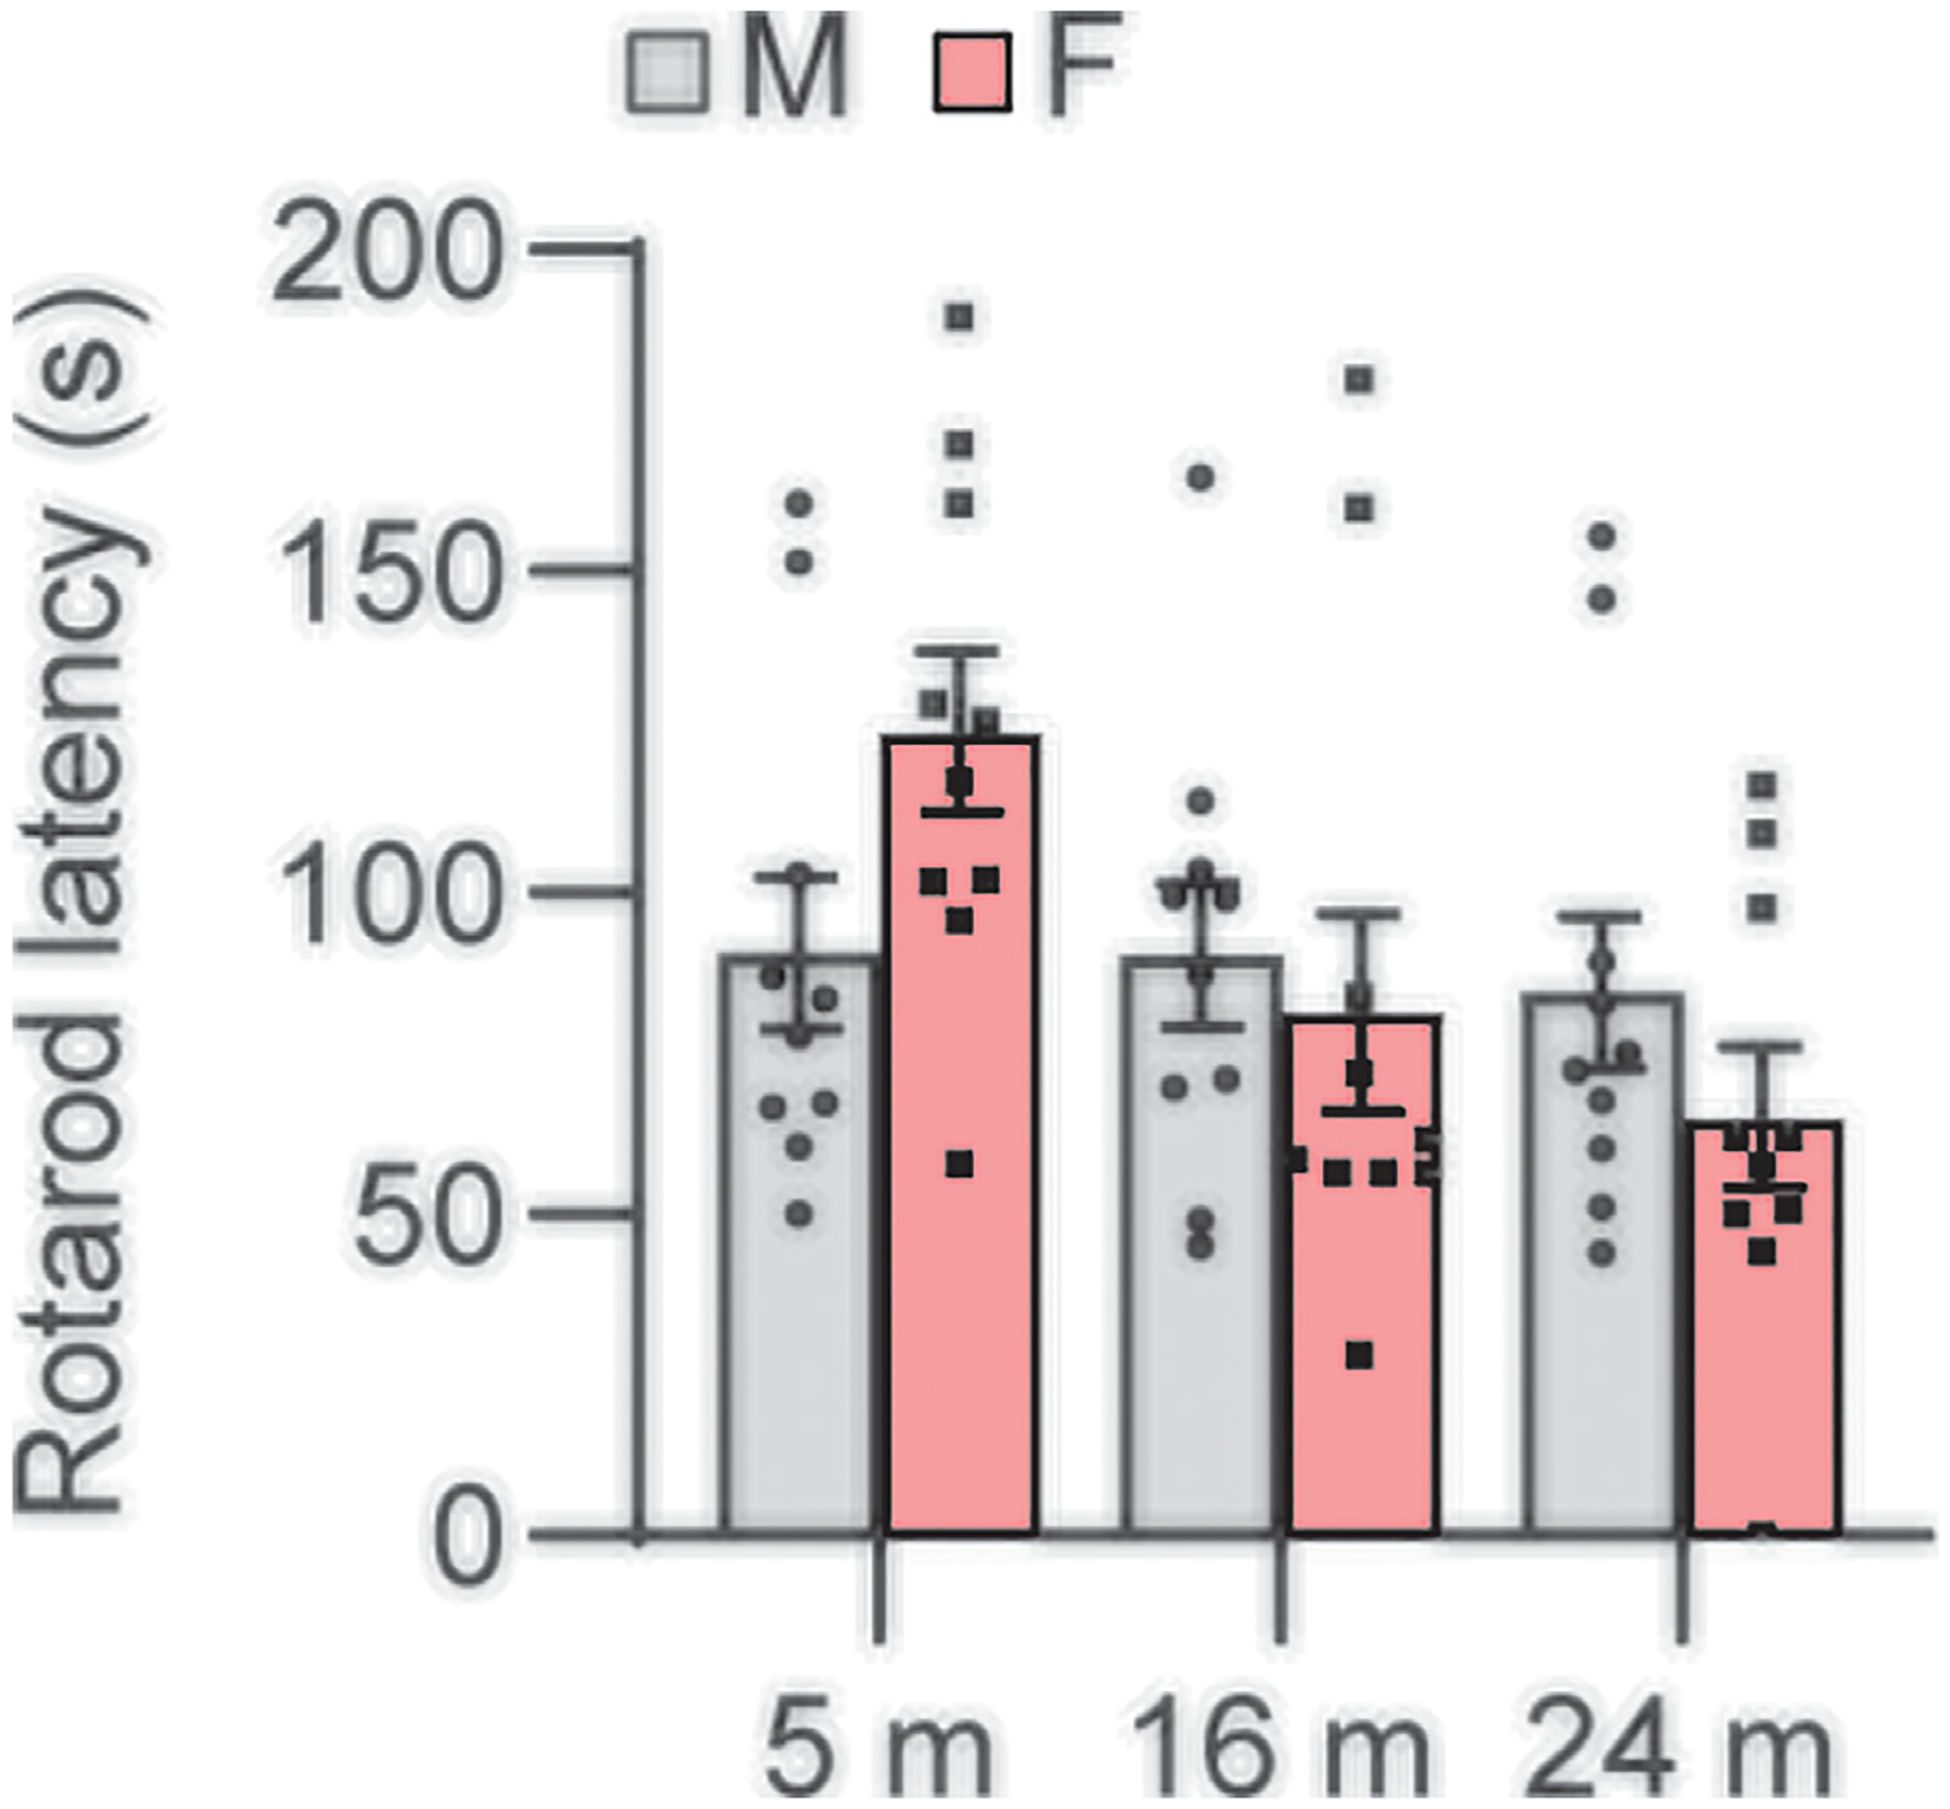
Rotarod performance. Rotarod latencies were measured in male and female CBA/CaJ mice at 5, 16, and 24 months of age; 5 m (20, 10 males and 10 females), 16 m (20, 10 males and 10 females), 24 m (20, 10 males and 10 females). Data are shown as means ± SEM. Two-way ANOVA with Bonferroni’s multiple comparisons test was performed. m, months of age; M, male; F, female.
3.2. Sex differences in voluntary wheel running activity
To examine sex differences in mobility and physical activity in CBA/CaJ mice across the lifespan, we measured voluntary wheel running activity, a robust indicator of physical activity, mobility, and balance status in rodents, for 1 day (24 h) in males and females. We found that running activity during the dark cycle of young females was higher than those of age-matched males, while there were no sex differences in running activity (light cycle, dark cycle, or full light-dark cycle) in middle-age or old mice (Fig. 2).
Fig. 2.

Wheel running activity. Total (A), light cycle (B), and dark cycle (C) wheel running activities were measured in male and female CBA/CaJ mice at 5, 16, and 24 months of age; 5 m (20, 10 males and 10 females), 16 m (16, 6 males and 10 females), 24 m (15, 7 males and 8 females). Data are shown as means ± SEM. Two-way ANOVA with Bonferroni’s multiple comparisons test was performed; C Dark cycle, Post hoc Bonferroni’s tests showed a significant sex difference for 5 m (*, P < 0.05, P = 0.0217), sex effect (F = 3.273, DF = 1, P = 0.0771), age effect (F = 21.92, DF = 2, P < 0.0001), interaction (F = 3.451, DF = 2, P = 0.0403). m, months of age; M, male; F, female; WR, wheel running; light cycle, from 7 am to 7 pm; dark cycle, from 7 pm to 7 am.
3.3. Sex differences in body composition
Body mass index and obesity is associated with mobility loss and functional decline (Anton et al., 2015) and hearing loss in older adults (Yang et al., 2020; Koo et al., 2022; Croll et al., 2019; Dalton et al., 2019; Hu et al., 2019; Li et al., 2022; Kohlberg et al., 2018). To examine sex differences in body composition in CBA/CaJ mice across the lifespan, we measured fat mass, lean mass, free water mass, total water mass, and body weight in males and females. Body weight of young females was lower than that of age-matched males (Fig. 3). Similarly, lean mass (the mass of all organs except body fat) and total water mass of young, middle-age, and old females were lower than those of age-matched males. There were no sex differences in free water mass in young, middle-age, or old mice. Fat mass of middle-age and old females was higher than that of age-matched males.
Fig. 3.
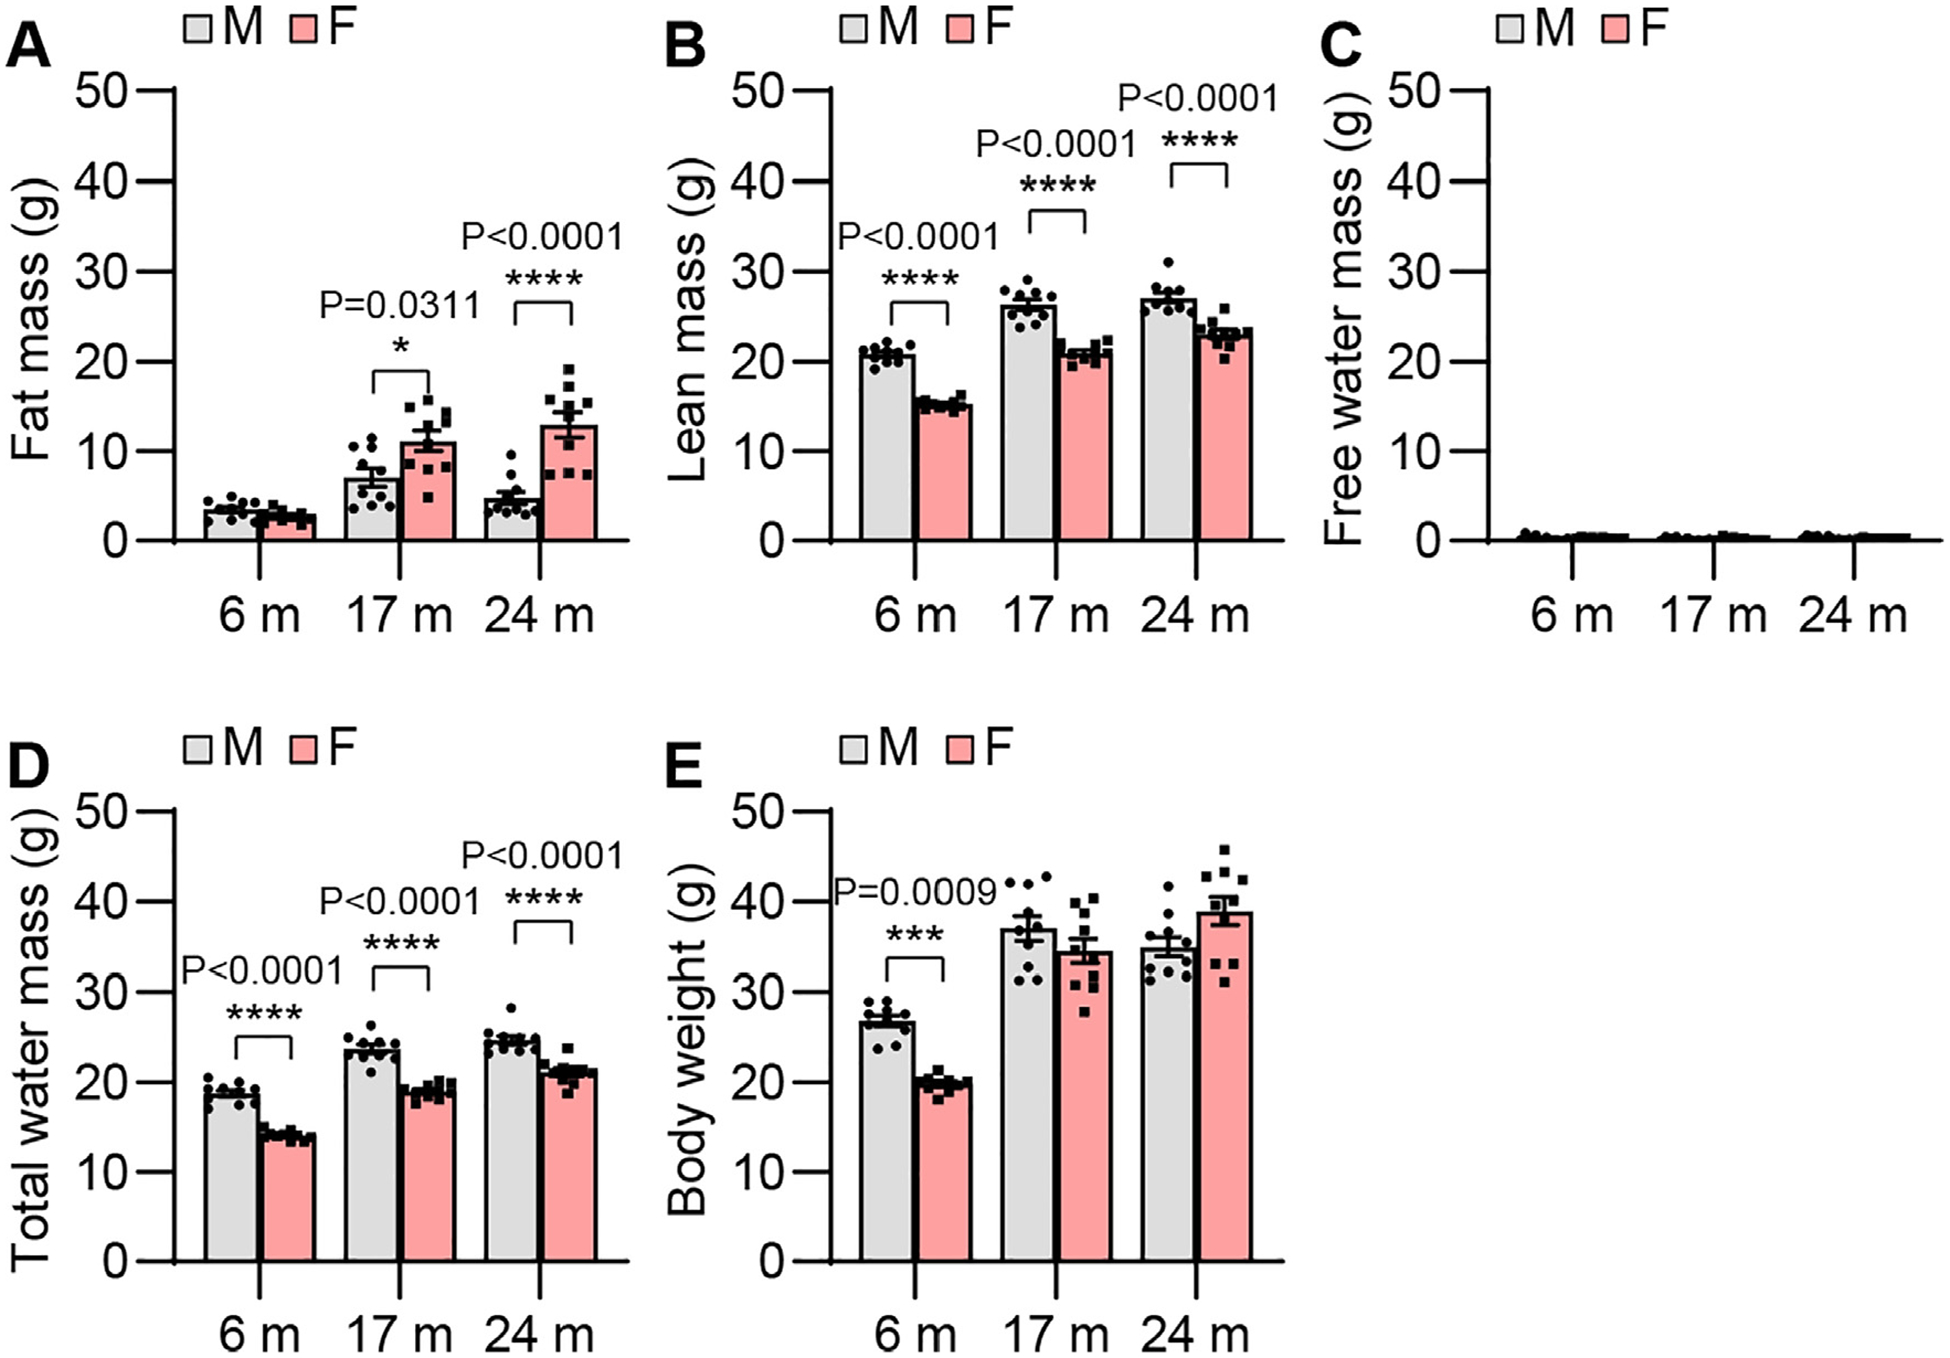
Body composition. Fat (A), lean (B), free water (C), and total water (D) masses and body weights (E) were measured in male and female CBA/CaJ mice at 6, 17, and 24 months of age; 6 m (20, 10 males and 10 females), 17 m (20, 10 males and 10 females), 24 m (20, 10 males and 10 females). Data are shown as means ± SEM. Two-way ANOVA with Bonferroni’s multiple comparisons test was performed: A Fat mass, Post hoc Bonferroni’s tests showed significant sex differences for 17 m (*, P < 0.05, P = 0.0311) and 24 m (****, P < 0.0001), sex effect (F = 27.87, DF = 1, P < 0.0001), age effect (F = 28.73, DF = 2, P < 0.0001), interaction (F = 12.39, DF = 2, P < 0.0001); B Lean mass, Post hoc Bonferroni’s tests showed significant sex differences for 6 m (****, P < 0.0001), 17 m (****, P < 0.0001), and 24 m (****, P < 0.0001), sex effect (F = 213.7, DF = 1, P < 0.0001), age effect (F = 157.1, DF = 2, P < 0.0001), interaction (F = 1.943, DF = 2, P = 0.1531); D Total water mass, Post hoc Bonferroni’s tests showed significant sex differences for 6 m (****, P < 0.0001), 17 m (****, P < 0.0001), and 24 m (****, P < 0.0001), sex effect (F = 201.4, DF = 1, P < 0.0001), age effect (F = 164.5, DF = 2, P < 0.0001), interaction (F = 1.501, DF = 2, P = 0.2320); E Body weight, Post hoc Bonferroni’s tests showed significant a sex difference for 6 m (***, P < 0.001, P = 0.0009), sex effect (F = 3.990, DF = 1, P = 0.0508), age effect (F = 87.77, DF = 2, F, female. P < 0.0001), interaction (F = 11.70, DF = 2, P < 0.0001). m, months of age; M, male; F, female.
3.4. Sex differences in auditory function
To examine sex differences in auditory functions in CBA/CaJ mice across the lifespan, we measured ABR threshold, wave amplitude, latency, amplitude ratio, and interpeak latency in male and female mice. Although mean ABR thresholds were lower for old females compared to age-matched males, there were no significant sex differences in ABR threshold at 8, 16, 32, or 48 kHz in young, middle-age, or old mice (Fig. 4). Young females displayed higher ABR wave I amplitudes at 8 kHz (Fig. 5) and wave II, III, and V amplitudes at 8 and 48 kHz compared to males (Figs. 6, 7, and 9). Middle-age females also displayed higher ABR wave IV amplitudes at 8 kHz compared to age-matched males (Fig. 8). Young females also displayed higher IV/I and V/I amplitude ratios at 48 kHz compared to males (Figs. 10 and 11). In contrast, no sex differences in ABR wave I, II, III, and IV latency or wave I-IV interpeak latency were observed in young, middle-age, or old mice (Figs. 5–10), but unexpectedly, young female mice displayed higher wave V latency and higher I-V interpeak latency at 16 kHz (Figs. 9 and 11).
Fig. 4.
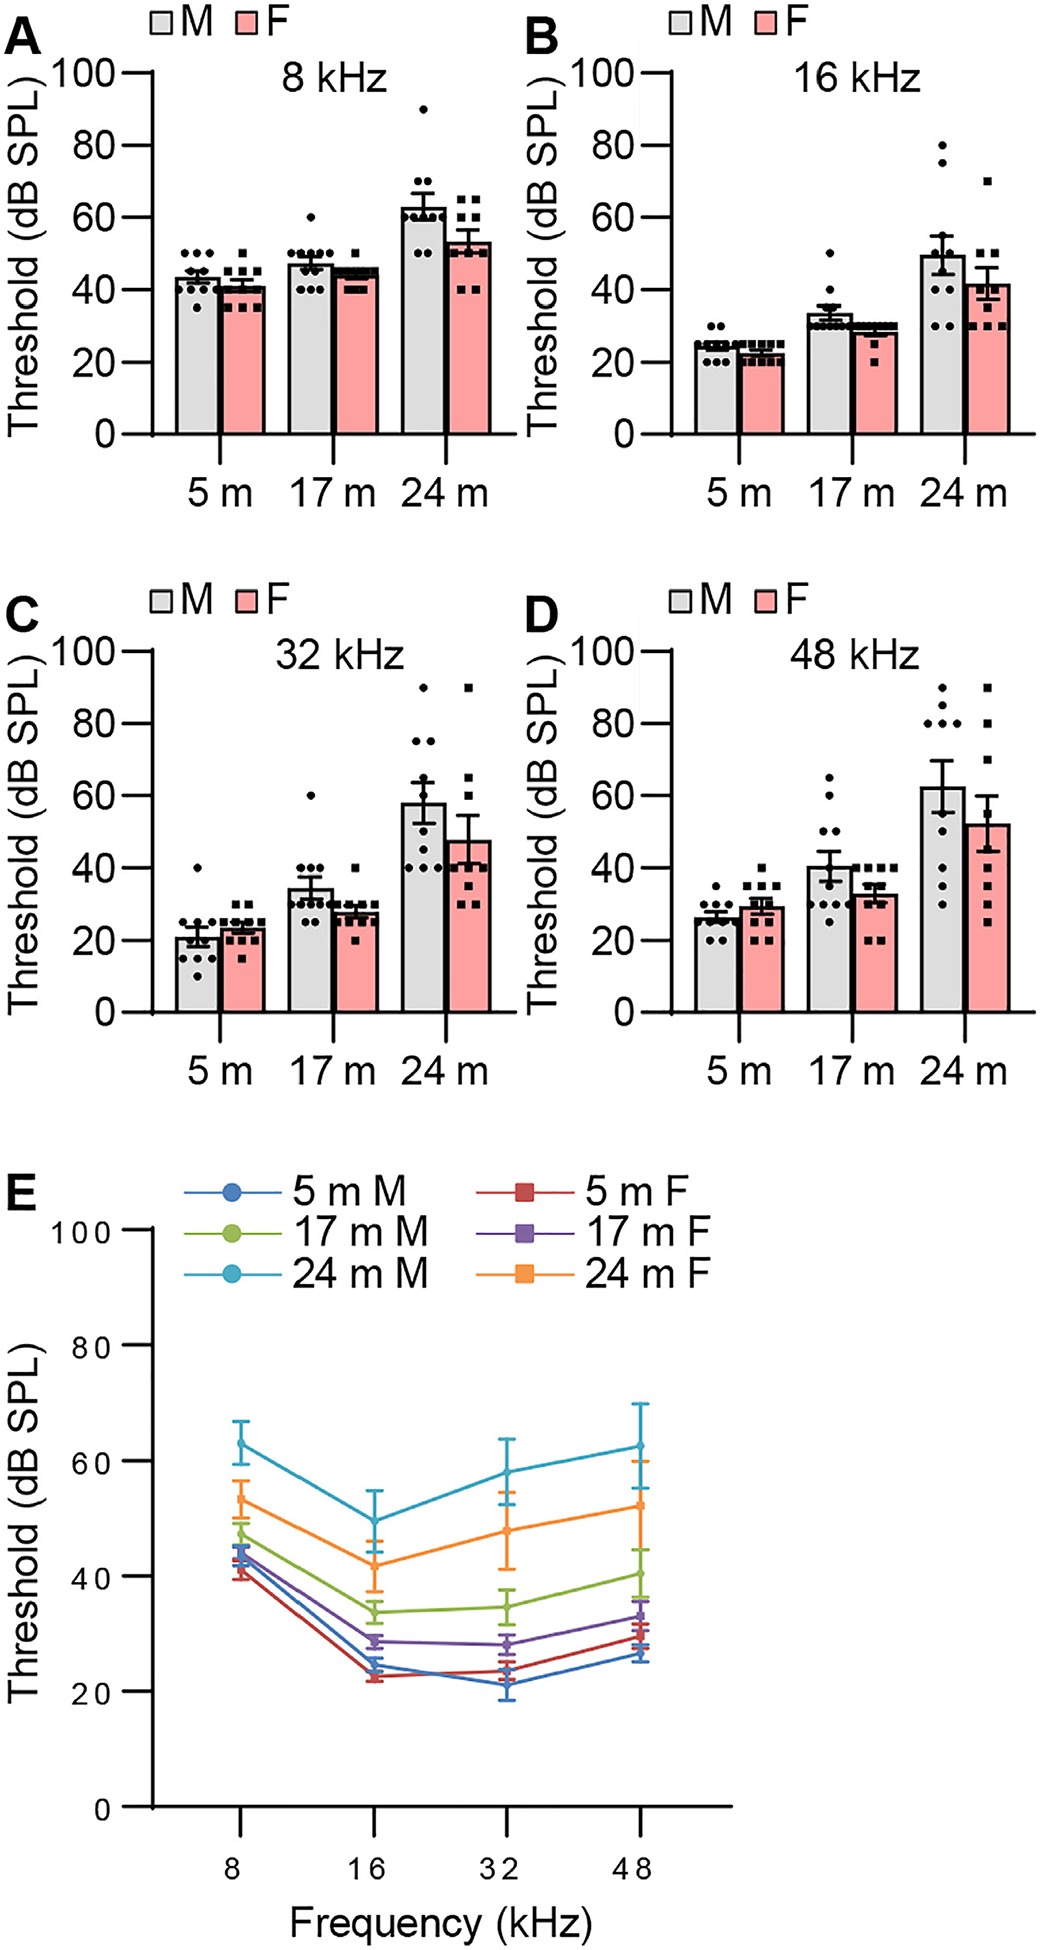
ABR threshold. ABR thresholds were measured with tone burst stimuli at 8 (A, E), 16 (B, E), 32 (C, E), and 48 (D, E) kHz in male and female CBA/CaJ mice at 5, 17, and 24 months of age; 5 m (20, 10 males and 10 females), 17 m (21, 11 males and 10 females), 24 m (19, 10 males and 9 females). Data are shown as means ± SEM. Two-way ANOVA with Bonferroni’s multiple comparisons test was performed. m, months of age; M, male; F, female.
Fig. 5.
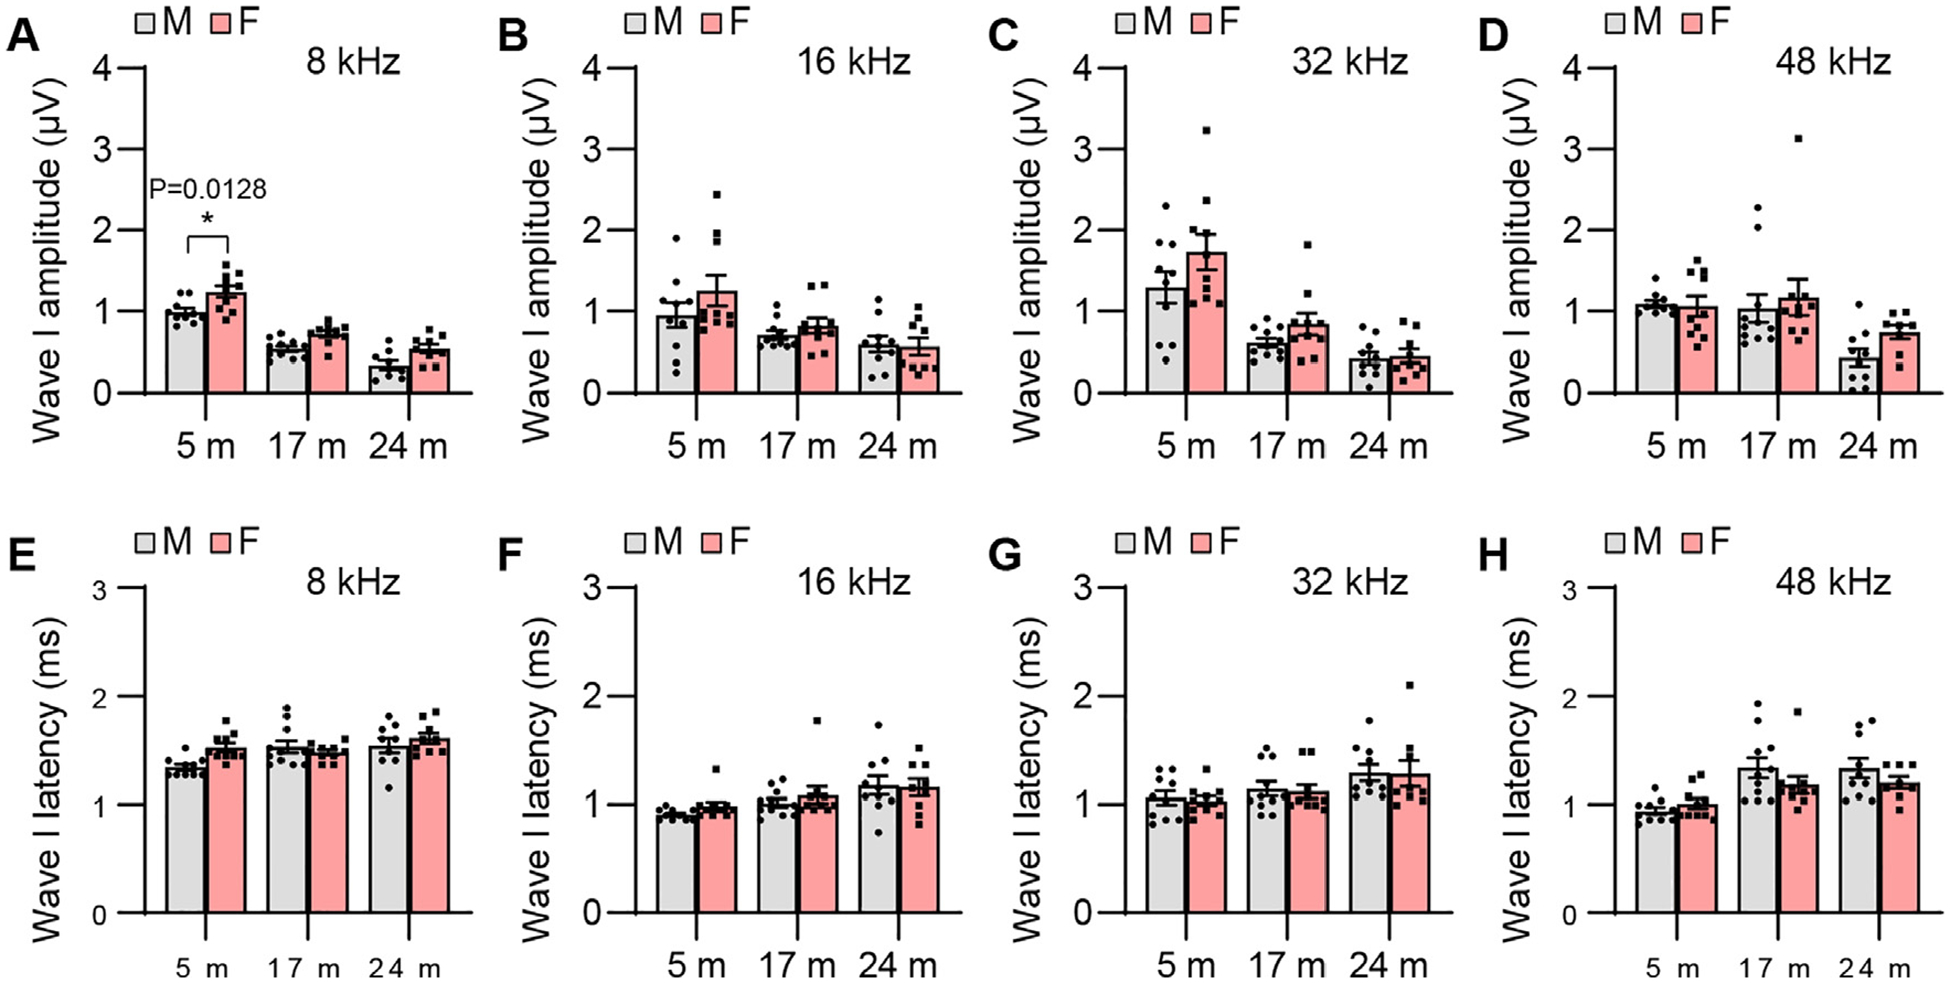
ABR wave I amplitude and latency. ABR wave I amplitudes (A-D) and latencies (E-H) were measured with tone burst stimuli at 8, 16, 32, and 48 kHz at 90 dB SPL in male and female CBA/CaJ mice at 5, 17, and 24 months of age: 8 kHz, 5 m (20, 10 males and 10 females), 17 m (21, 11 males and 10 females), 24 m (18, 9 males and 9 females); 16 kHz, 5 m (20, 10 males and 10 females), 17 m (21, 11 males and 10 females), 24 m (19, 10 males and 9 females); 32 kHz, 5 m (20, 10 males and 10 females), 17 m (21, 11 males and 10 females), 24 m (19, 10 males and 9 females); 48 kHz, 5 m (20, 10 males and 10 females), 17 m (21, 11 males and 10 females), 24 m (18, 10 males and 8 females). Data are shown as means ± SEM. Two-way ANOVA with Bonferroni’s multiple comparisons test was performed; A Wave I amplitude, 8 kHz, Post hoc Bonferroni’s tests showed a significant sex difference for 5 m (*, P < 0.05, P = 0.0128), sex effect (F = 25.72, DF = 1, P < 0.0001), age effect (F = 93.53, DF = 2, P < 0.0001), interaction (F = 0.2594, DF = 2, P = 0.7725). m, months of age; M, male; F, female.
Fig. 6.
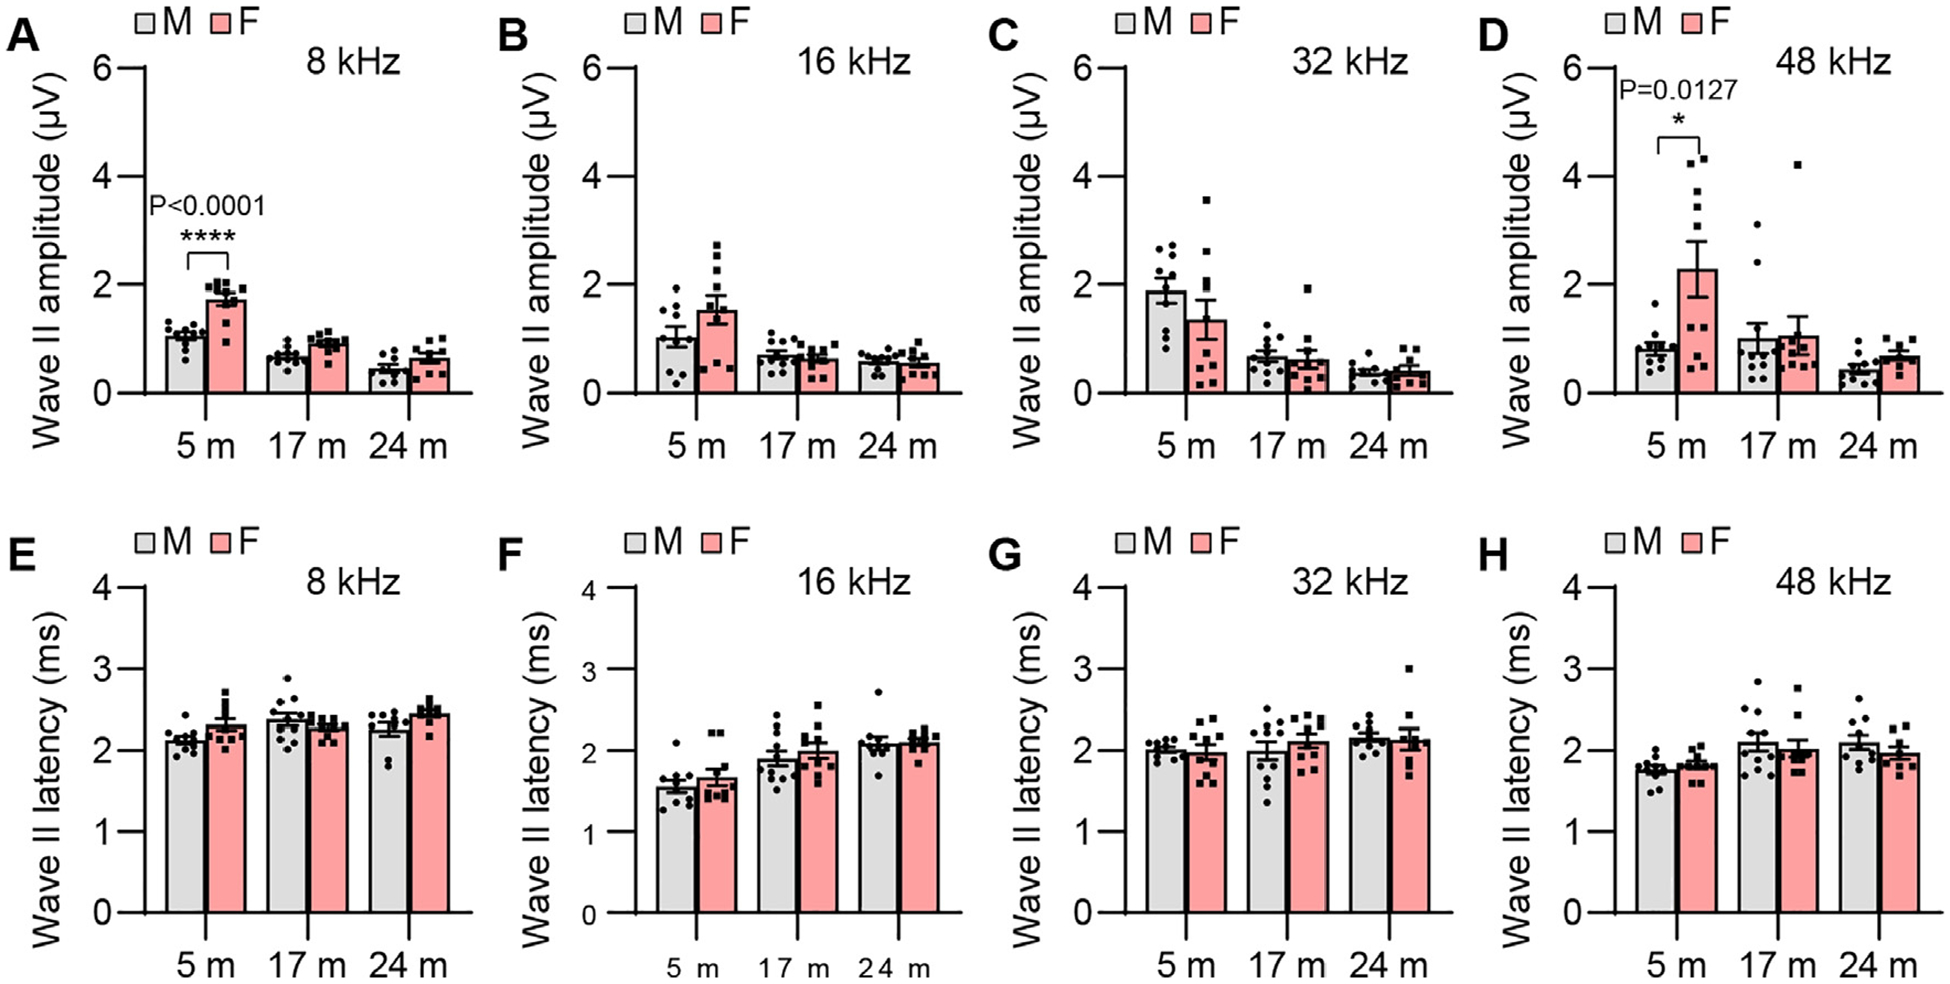
ABR wave II amplitude and latency. ABR wave II amplitudes (A-D) and latencies (E-H) were measured with tone burst stimuli at 8, 16, 32, and 48 kHz at 90 dB SPL in male and female CBA/CaJ mice at 5, 17, and 24 months of age: 8 kHz, 5 m (20, 10 males and 10 females), 17 m (21, 11 males and 10 females), 24 m (18, 9 males and 9 females); 16 kHz, 5 m (20, 10 males and 10 females), 17 m (21, 11 males and 10 females), 24 m (19, 10 males and 9 females); 32 kHz, 5 m (20, 10 males and 10 females), 17 m (21, 11 males and 10 females), 24 m (19, 10 males and 9 females); 48 kHz, 5 m (20, 10 males and 10 females), 17 m (21, 11 males and 10 females), 24 m (18, 10 males and 8 females). Data are shown as means ± SEM. Two-way ANOVA with Bonferroni’s multiple comparisons test was performed; A Wave II amplitude, 8 kHz, Post hoc Bonferroni’s tests showed significant sex differences for 5 m (****, P < 0.0001), sex effect (F = 34.49, DF = 1, P < 0.0001), age effect (F = 61.79, DF = 2, P < 0.0001); interaction (F = 5.727, DF = 2, P = 0.0056); D Wave II amplitude, 48 kHz, Post hoc Bonferroni’s tests showed significant sex differences for 5 m (*, P < 0.05, P = 0.0127), sex effect (F = 5.962, DF = 1, P = 0.0180), age effect (F = 5.325, DF = 2, P = 0.0078), interaction (F = 3.400, DF = 2, P = 0.0408). m, months of age; M, male; F, female.
Fig. 7.
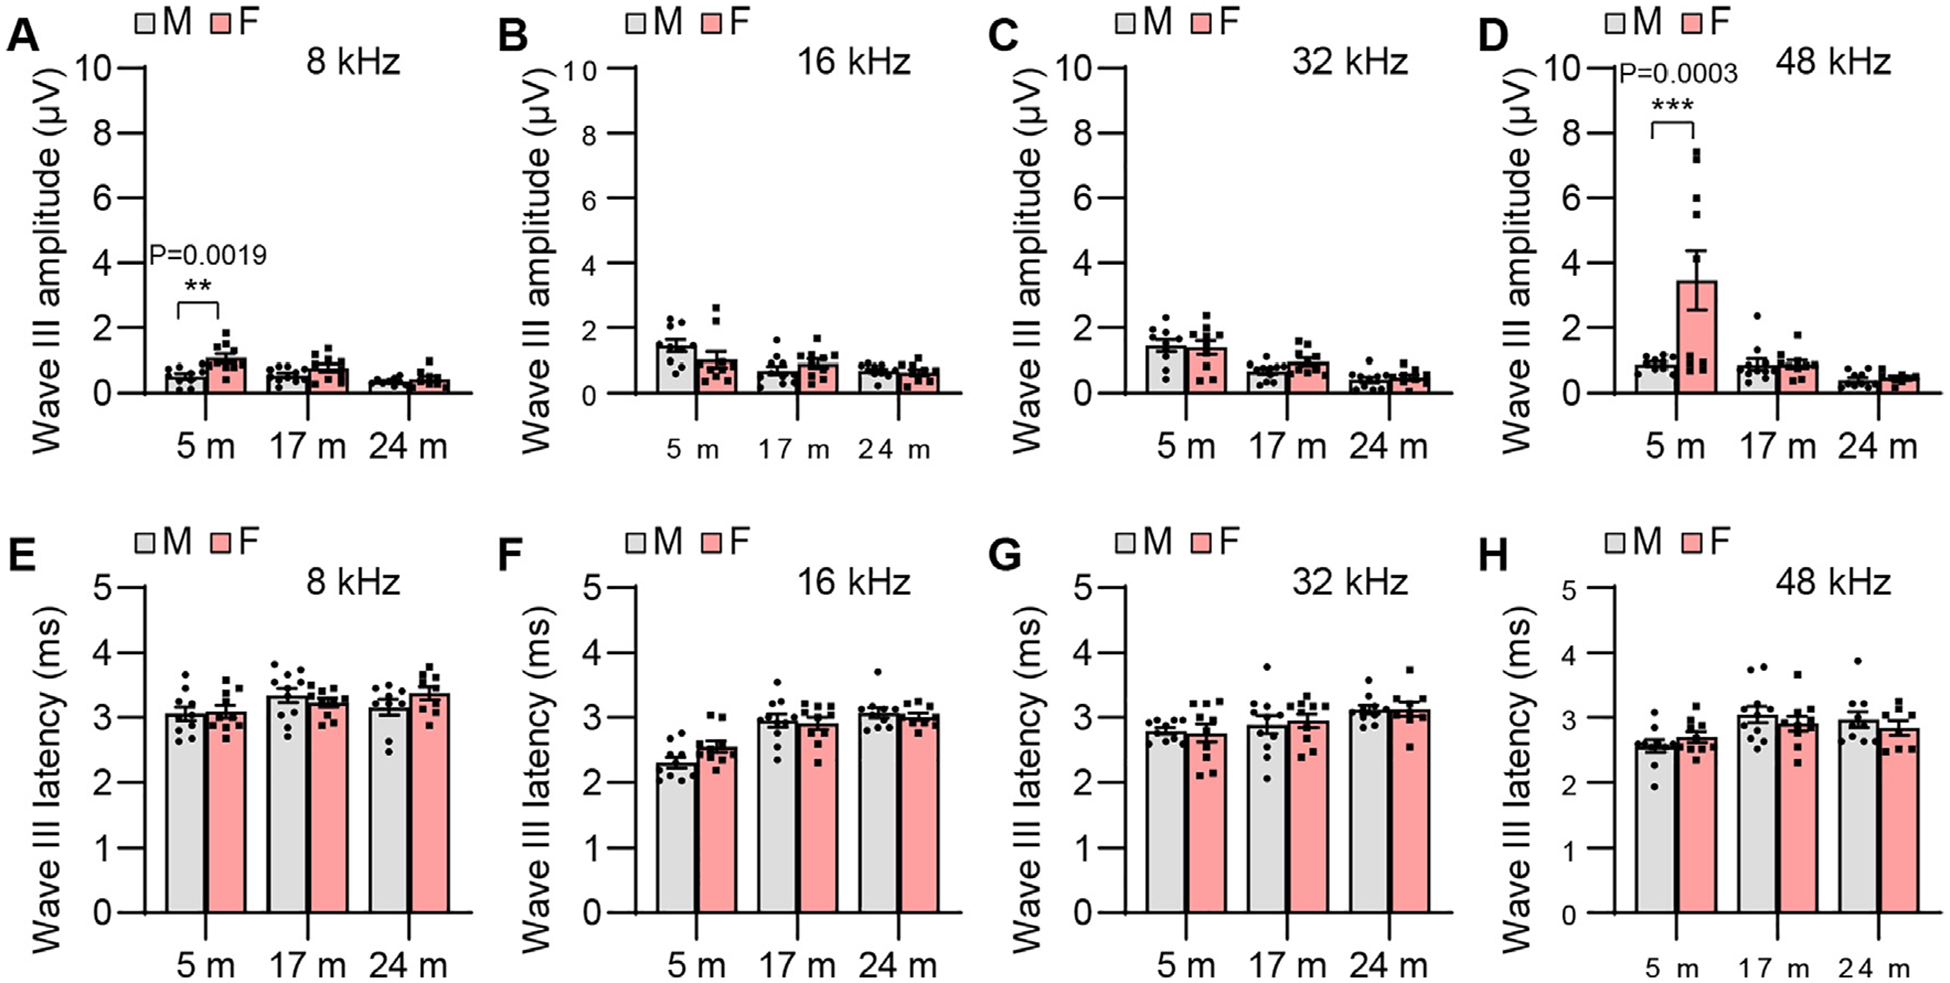
ABR wave III amplitude and latency. ABR wave III amplitudes (A-D) and latencies (E-H) were measured with tone burst stimuli at 8, 16, 32, and 48 kHz at 90 dB SPL in male and female CBA/CaJ mice at 5, 17, and 24 months of age: 8 kHz, 5 m (20, 10 males and 10 females), 17 m (21, 11 males and 10 females), 24 m (18, 9 males and 9 females); 16 kHz, 5 m (20, 10 males and 10 females), 17 m (21, 11 males and 10 females), 24 m (19, 10 males and 9 females); 32 kHz, 5 m (20, 10 males and 10 females), 17 m (21, 11 males and 10 females), 24 m (19, 10 males and 9 females); 48 kHz, 5 m (20, 10 males and 10 females), 17 m (21, 11 males and 10 females), 24 m (18, 10 males and 8 females). Data are shown as means ± SEM. Two-way ANOVA with Bonferroni’s multiple comparisons test was performed; A Wave III amplitude, 8 kHz, Post hoc Bonferroni’s tests showed significant a sex difference for 5 m (**, P < 0.01, P = 0.0019), sex effect (F = 13.09, DF = 1, P = 0.0007), age effect (F = 8.839, DF = 2, P = 0.0005), interaction (F = 3.295, DF = 2, P = 0.0448); D Wave III amplitude, 48 kHz, Post hoc Bonferroni’s tests showed a significant sex difference for 5 m (***, P < 0.001, P = 0.0003), sex effect (F = 7.634, DF = 1, P = 0.0079), age effect (F = 10.39, DF = 2, P = 0.0002), interaction (F = 7.023, DF = 2, P = 0.0020). m, months of age; M, male; F, female.
Fig. 9.
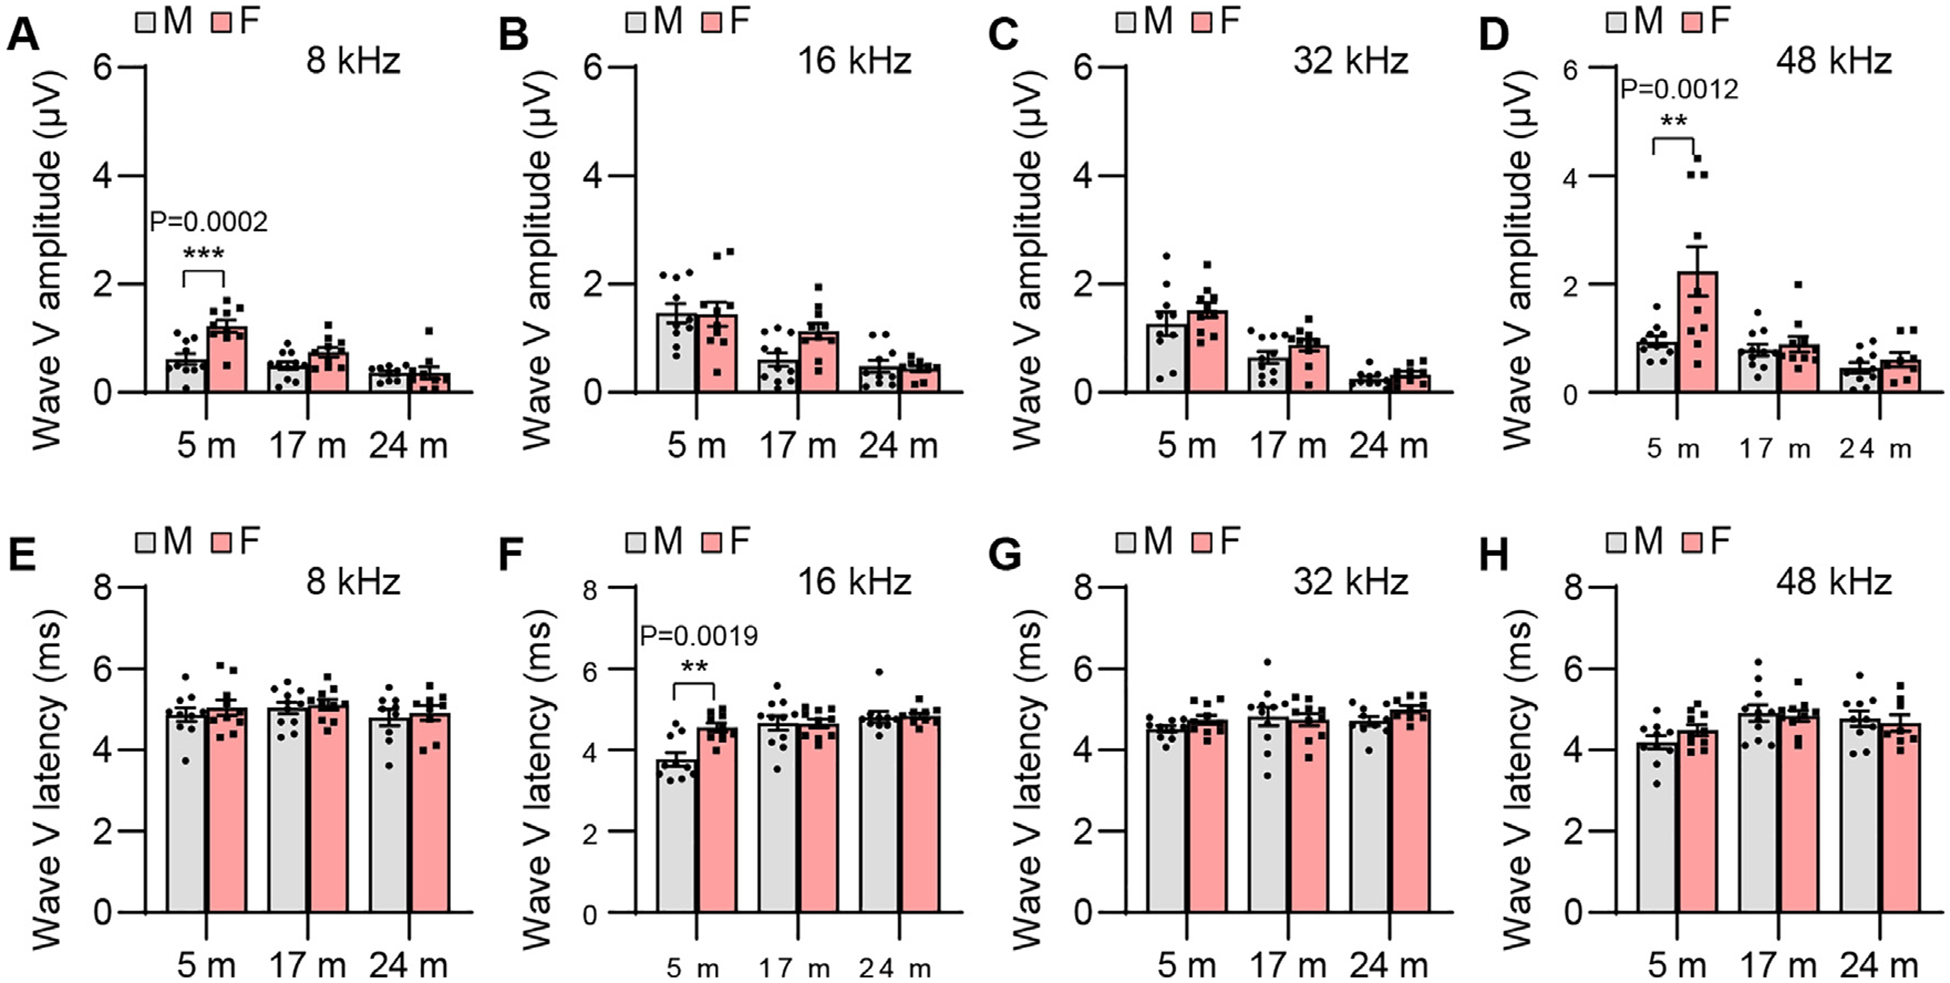
ABR wave V amplitude and latency. ABR wave V amplitudes (A-D) and latencies (E-H) were measured with tone burst stimuli at 8, 16, 32, and 48 kHz at 90 dB SPL in male and female CBA/CaJ mice at 5, 17, and 24 months of age: 8 kHz, 5 m (20, 10 males and 10 females), 17 m (21, 11 males and 10 females), 24 m (18, 9 males and 9 females); 16 kHz, 5 m (20, 10 males and 10 females), 17 m (21, 11 males and 10 females), 24 m (19, 10 males and 9 females); 32 kHz, 5 m (20, 10 males and 10 females), 17 m (21, 11 males and 10 females), 24 m (19, 10 males and 9 females); 48 kHz, 5 m (20, 10 males and 10 females), 17 m (21, 11 males and 10 females), 24 m (18, 10 males and 8 females). Data are shown as means ± SEM. Two-way ANOVA with Bonferroni’s multiple comparisons test was performed; A Wave V amplitude, 8 kHz, Post hoc Bonferroni’s tests showed significant a sex difference for 5 m (***, P < 0.001, P = 0.0002), sex effect (F = 14.98, DF = 1, P = 0.0003), age effect (F = 18.27, DF = 2, P < 0.0001), interaction (F = 5.364, DF = 2, P = 0.0076); D Wave V amplitude, 48 kHz, Post hoc Bonferroni’s tests showed a significant sex difference for 5 m (**, P < 0.01, P = 0.0012), sex effect (F = 8.504, DF = 1, P = 0.0052), age effect (F = 12.40, DF = 2, P < 0.0001), interaction (F = 4.884, DF = 2, P = 0.0113); F Wave V latency, 16 kHz, Post hoc Bonferroni’s tests a showed significant sex difference for 5 m (**, P < 0.01, P = 0.0019), sex effect (F = 5.789, DF = 1, P = 0.0196), age effect (F = 12.90, DF = 2, P < 0.0001), interaction (F = 5.663, DF = 2, P = 0.0059). m, months of age; M, male; F, female.
Fig. 8.
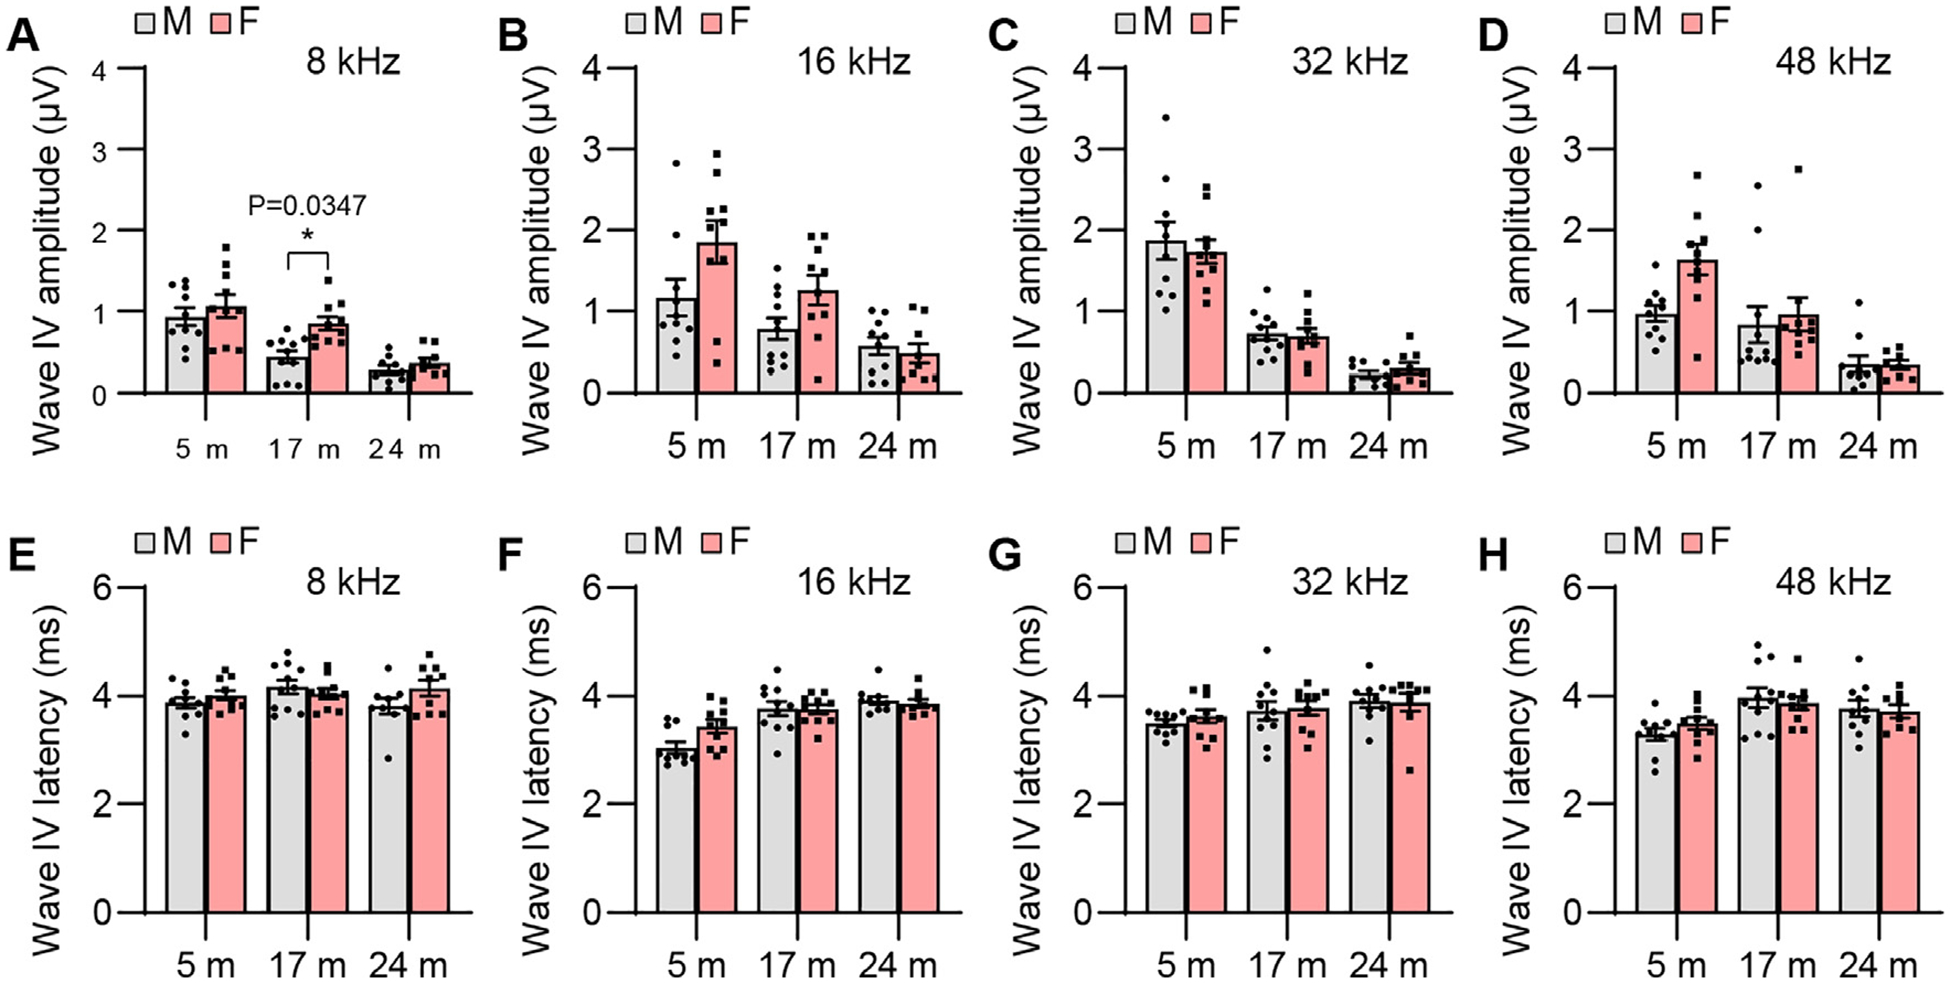
ABR wave IV amplitude and latency. ABR wave IV amplitudes (A-D) and latencies (E-H) were measured with tone burst stimuli at 8, 16, 32, and 48 kHz at 90 dB SPL in male and female CBA/CaJ mice at 5, 17, and 24 months of age: 8 kHz, 5 m (20, 10 males and 10 females), 17 m (21, 11 males and 10 females), 24 m (18, 9 males and 9 females); 16 kHz, 5 m (20, 10 males and 10 females), 17 m (21, 11 males and 10 females), 24 m (19, 10 males and 9 females); 32 kHz, 5 m (20, 10 males and 10 females), 17 m (21, 11 males and 10 females), 24 m (19, 10 males and 9 females); 48 kHz, 5 m (20, 10 males and 10 females), 17 m (21, 11 males and 10 females), 24 m (18, 10 males and 8 females). Data are shown as means ± SEM. Two-way ANOVA with Bonferroni’s multiple comparisons test was performed; A Wave IV amplitude, 8 kHz, Post hoc Bonferroni’s tests showed a significant sex difference for 17 m (*, P < 0.05, P = 0.0347), sex effect (F = 7.488, DF = 1, P = 0.0084), age effect (F = 25.27, DF = 2, P < 0.0001), interaction (F = 1.797, DF = 2, P = 0.1758). m, months of age; M, male; F, female.
Fig. 10.
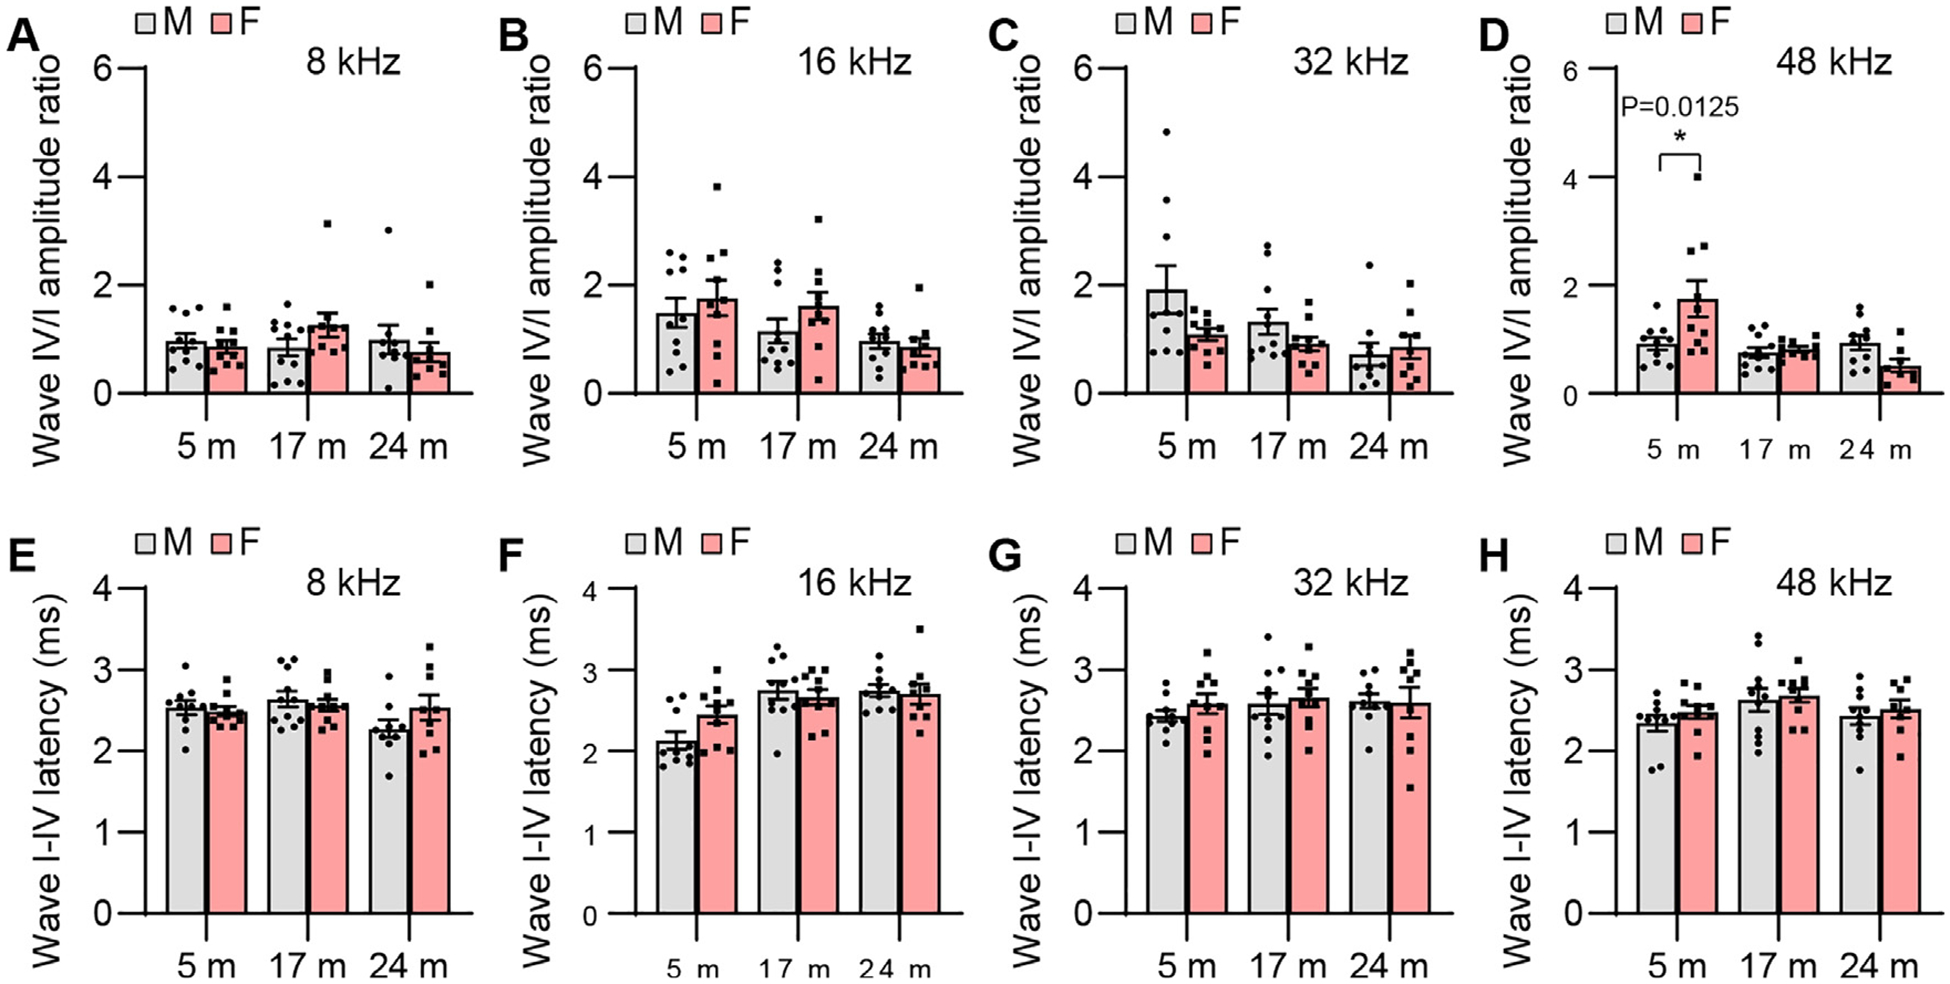
ABR wave IV/I amplitude ratio and I-IV interpeak latency. ABR wave IV/I amplitude ratios (A-D) and I-IV interpeak latencies (E-H) were measured with tone burst stimuli at 8, 16, 32, and 48 kHz at 90 dB SPL in male and female CBA/CaJ mice at 5, 17, and 24 months of age: 8 kHz, 5 m (20, 10 males and 10 females), 17 m (21, 11 males and 10 females), 24 m (18, 9 males and 9 females); 16 kHz, 5 m (20, 10 males and 10 females), 17 m (21, 11 males and 10 females), 24 m (19, 10 males and 9 females); 32 kHz, 5 m (20, 10 males and 10 females), 17 m (21, 11 males and 10 females), 24 m (19, 10 males and 9 females); 48 kHz, 5 m (20, 10 males and 10 females), 17 m (21, 11 males and 10 females), 24 m (18, 10 males and 8 females). Data are shown as means ± SEM. Two-way ANOVA with Bonferroni’s multiple comparisons test was performed; D Wave IV/I amplitude ratio, 48 kHz, Post hoc Bonferroni’s tests showed a significant sex difference for 5 m (*, P < 0.05, P = 0.0125), sex effect (F = 1.308, DF = 1, P = 0.2578), age effect (F = 7.945, DF = 2, P = 0.0010), interaction (F = 6.887, DF = 2, P = 0.0022). m, months of age; M, male; F, female.
Fig. 11.
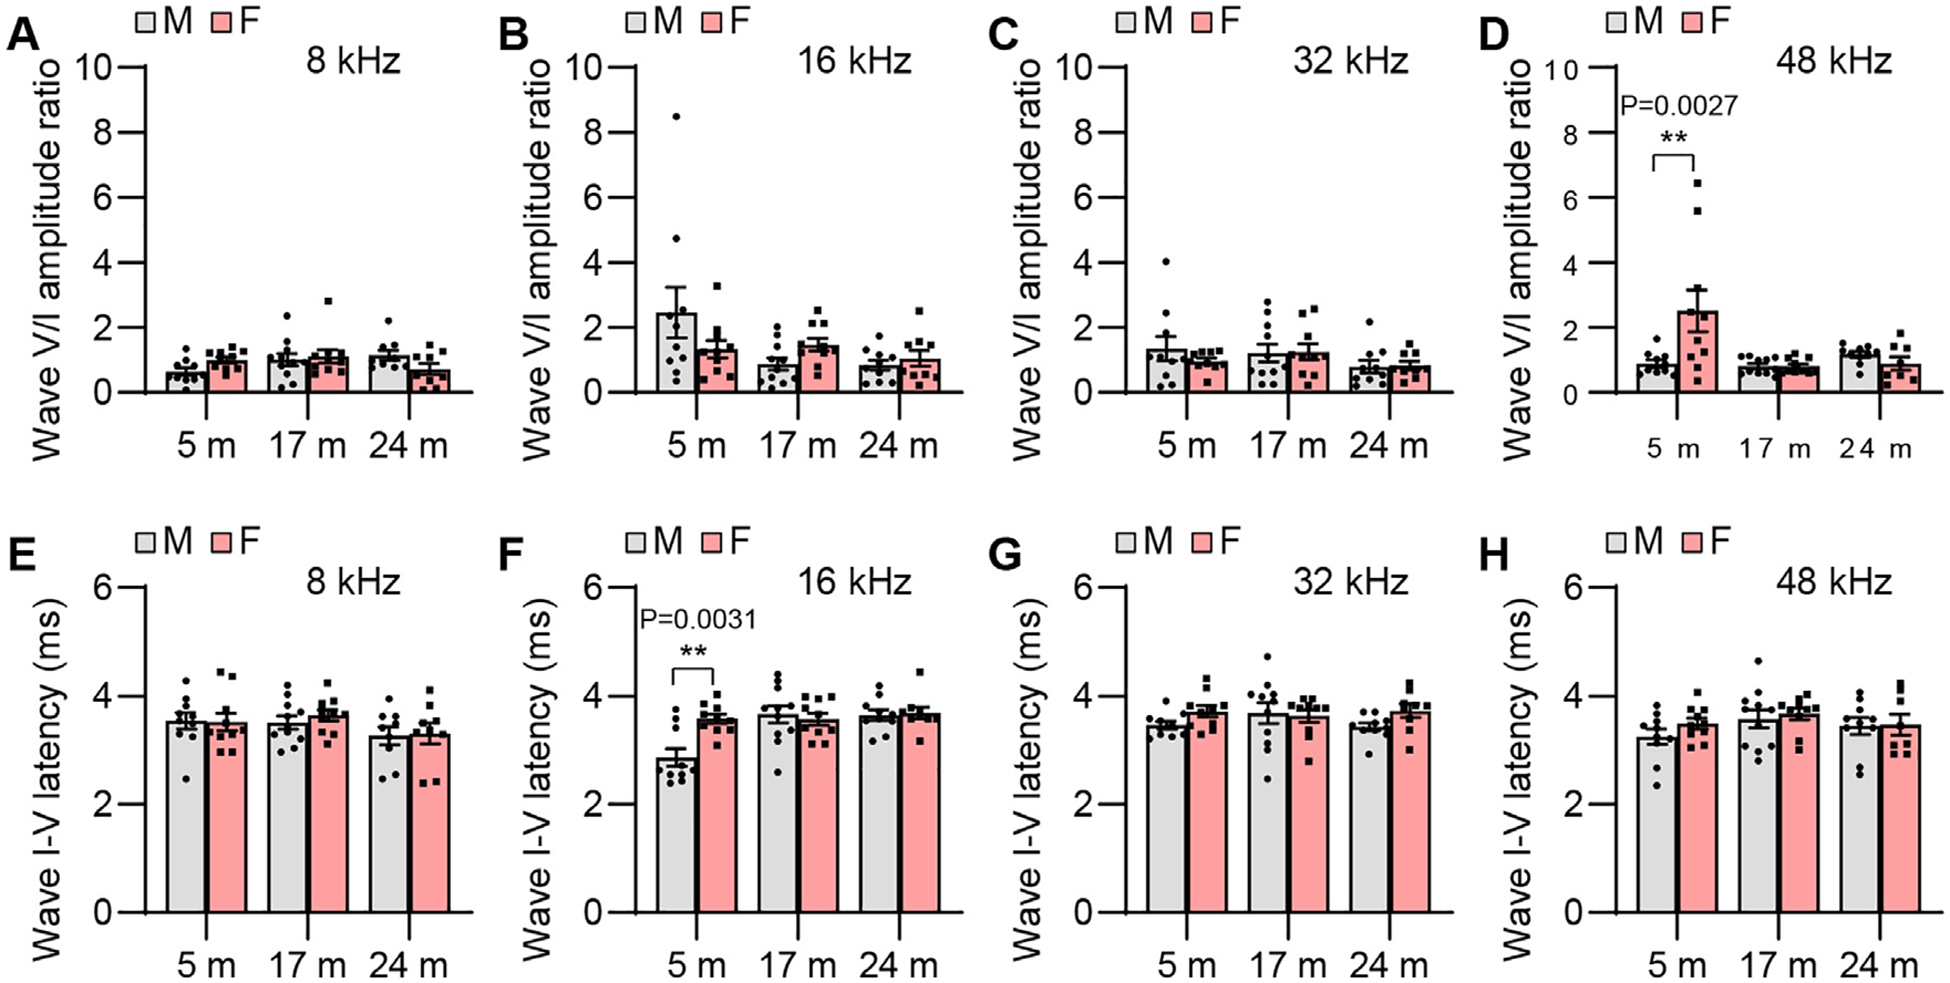
ABR wave V/I amplitude ratio and I-V interpeak latency. ABR wave V/I amplitude ratios (A-D) and I-V interpeak latencies (E-H) were measured with tone burst stimuli at 8, 16, 32, and 48 kHz at 90 dB SPL in male and female CBA/CaJ mice at 5, 17, and 24 months of age: 8 kHz, 5 m (20, 10 males and 10 females), 17 m (21, 11 males and 10 females), 24 m (18, 9 males and 9 females); 16 kHz, 5 m (20, 10 males and 10 females), 17 m (21, 11 males and 10 females), 24 m (19, 10 males and 9 females); 32 kHz, 5 m (20, 10 males and 10 females), 17 m (21, 11 males and 10 females), 24 m (19, 10 males and 9 females); 48 kHz, 5 m (20, 10 males and 10 females), 17 m (21, 11 males and 10 females), 24 m (18, 10 males and 8 females). Data are shown as means ± SEM. Two-way ANOVA with Bonferroni’s multiple comparisons test was performed; D Wave V/I amplitude ratio, 48 kHz, Post hoc Bonferroni’s tests showed a significant sex difference for 5 m (**, P < 0.01, P = 0.0027), sex effect (F = 3.594, DF = 1, P = 0.0635), age effect (F = 5.403, DF = 2, P = 0.0073), interaction (F = 6.339, DF = 2, P = 0.0034); F Wave I-V interpeak latency, 16 kHz, Post hoc Bonferroni’s tests showed a significant sex difference for 5 m (**, P < 0.01, P = 0.0031), sex effect (F = 4.618, DF = 1, P = 0.0361), age effect (F = 7.390, DF = 2, P = 0.0015), interaction (F = 5.817, DF = 2, P = 0.0052). m, months of age; M, male; F, female.
3.5. Sex differences in cochlear histology
To examine sex differences in cochlear hair cell loss or hair cell numbers in CBA/CaJ mice across the lifespan, mean cytocochleograms were prepared from male and female mice. There were no sex differences in IHC loss in the apical, middle, or basal cochlear regions in young, middle-age, or old mice (Fig. 12). There were no sex differences in OHC loss in the middle or basal cochlear regions in young, middle-age, or old mice, but middle-aged females displayed lower OHC loss in the region 0~10% from the apex of the cochlea compared to age-matched males (Fig. 13). Since this OHC loss occurred at 0–10% of apex or the most apical portion of the cochlea in the males and there were no sex differences in OHC loss at 10–30% of apex in middle-age mice (Fig. 13), we believe this was likely due to the damage caused during dissection/perfusion fixation in the middle age males. Next, we measured ANF density in the middle region of the cochlea from male and female CBA/CaJ mice at 6, 17, and 24 months of age. There were no sex differences in ANF density in young, middle-age, or old mice (Fig. 14). Lastly, we measured SV thickness in the apical, middle, and basal regions of the cochlea from male and female CBA/CaJ mice at 6, 17, and 24 months of age. There were no sex differences in SV thickness in young, middle-age, or old mice (Fig. 15). Overall, no sex differences in IHC loss, ANF density or SV thickness were observed in young, middle-age or old mice, and no sex differences in OHC loss for 10–100% distance from the cochlear apex were observed in young, middle-age, or old mice.
Fig. 14.
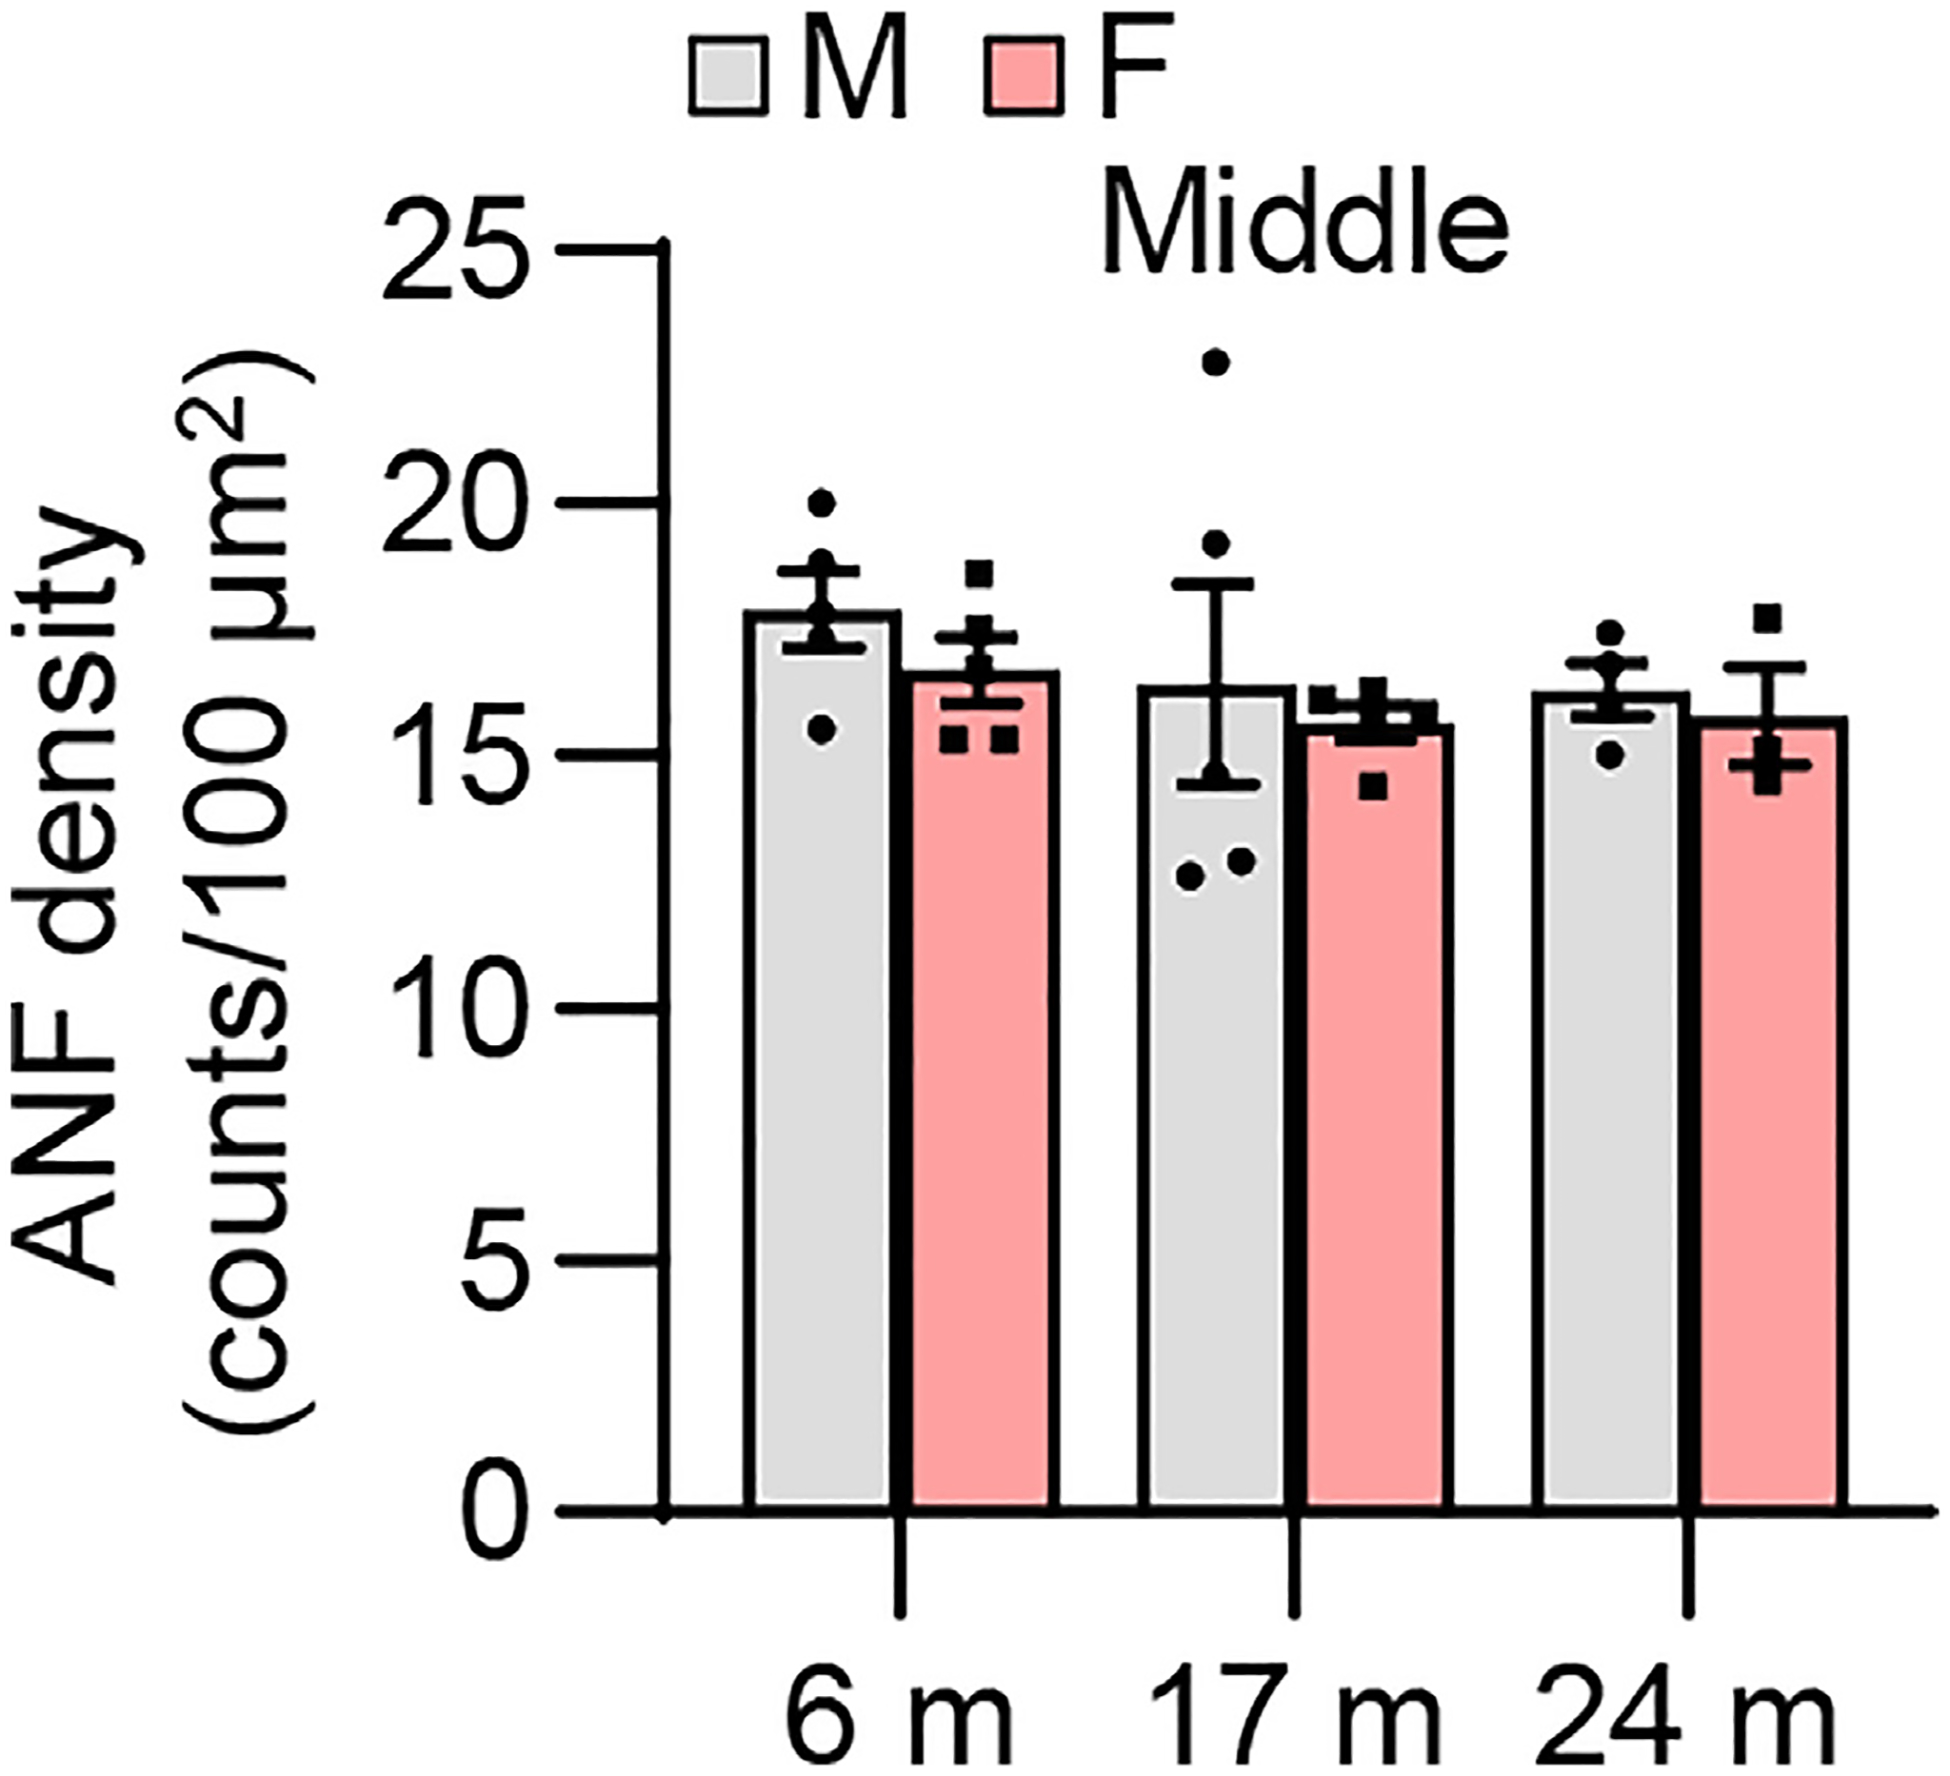
ANF density. ANF densities were measured in the middle region of the cochlear tissues from male and female CBA/CaJ mice at 6, 17, and 24 months of age: 6 m (10, 5 males and 5 females), 17 m (10, 5 males and 5 females), 24 m (7, 4 males and 3 females). Data are shown as means ± SEM. Two-way ANOVA with Bonferroni’s multiple comparisons test was performed. m, months of age; M, male; F, female; ANF, auditory nerve fiber.
Fig. 15.

SV thickness. SV thicknesses were measured in the apical (A), middle (B), and basal (C) regions of the cochlear tissues from male and female CBA/CaJ mice at 6, 17, and 24 months of age: Apical, 6 m (8, 3 males and 5 females), 17 m (10, 5 males and 5 females), 24 m (7, 4 males and 3 females); Middle, 6 m (10, 5 males and 5 females), 17 m (10, 5 males and 5 females), 24 m (7, 4 males and 3 females); Basal, 6 m (10, 5 males and 5 females), 17 m (10, 5 males and 5 females), 24 m (7, 4 males and 3 females). Data are shown as means ± SEM. Two-way ANOVA with Bonferroni’s multiple comparisons test was performed. m, months of age; M, male; F, female; SV, stria vascularis.
4. Discussion
4.1. Sex differences in hearing
Significant sex differences in hearing have been documented in humans and rodents: A number of human studies demonstrate that men lose their hearing more rapidly than women, especially at higher frequencies (Shuster et al., 2019; Pearson et al., 1995: Lin et al., 2011; Allen and Eddins, 2010; Cruickshanks et al., 1998). Inbred mice have been widely used as models of ARHL. Of these inbred strains, the CBA/CaJ has long been considered a normal hearing mouse and a model for late onset ARHL, mimicking the pattern of late onset hearing loss observed in healthy adults (Ohlemiller et al., 2011; Zheng et al., 1999). In addition, female CBA/CaJ mice live longer than males (The Jackson Laboratory, 2018; The Jackson Laboratory, 2022), consistent with the observation that women outlive men (Austad, 2006). In agreement with the human studies, Henry (2004) has shown that male CBA/CaJ mice have poorer high frequency ABR thresholds and display more rapid hearing loss by approximately 12 months of age. Ohlemiller et al. (2011) have shown that male and female CBA/CaJ mice have similar compound action potential (CAP) thresholds at 24 months of age, but the trajectories of thresholds in females begin to close with males after menopause. Females begin to exceed male thresholds after 25 months of age. Using the CBA/J strain, another normal-hearing strain, Frisina and co-workers have shown that old (24–29 months old) females showed significantly lower ABR thresholds than males (Guimaraes et al., 2004), although there were no sex differences in ABR thresholds in young (2–3 months old) and middle-aged (14–16 months old) CBA/J mice. The authors also found that male CBA/J mice lose their outer hair cell function (distortion product otoacoustic emissions amplitude declines) faster than females. In the current study, although old female CBA/CaJ displayed lower mean ABR thresholds compared with age-matched males, no significant sex differences in ABR thresholds were observed in young, middle-age, and old CBA/CaJ mice (Fig. 4).
It is also well documented that women display larger wave-V amplitudes, shorter wave-V latencies, and shorter wave I-V interpeak latencies (Jerger and Hall, 1980; Dehan and Jerger, 1990; Shuster et al., 2019). In agreement with the human studies, young female mice (CBA/J, B6CBAF1/J) show larger ABR wave I amplitude than males (Rouse et al., 2020; Milon et al., 2018). In the current study, we found that young female CBA/CaJ mice displayed larger ABR wave I, II, III, and V amplitudes (Figs. 5–7, and 9), and higher IV/I and V/I amplitude ratios compared to males (Figs. 10 and 11). Middle-age females also displayed larger ABR wave IV amplitudes compared to age-matched males (Fig. 8). In contrast, no sex differences in ABR waves I, II, III, and IV latency or wave I-IV interpeak latency were observed in young, middle-age, or old mice (Figs. 5–10). It has been suggested that the amplitude and latency of ABR waves can be affected by many factors such as head size, body size, the amount of fat between electrodes and generators, and body temperature (Zhou et al., 2006), and it has been postulated that small head size and or a shorter cochlear length in females may contribute to greater synchronous activity at the SGNs and or afferent auditory pathway, leading to greater ABR wave amplitudes and shorter wave latencies (McFadden and Pasanen, 1998; Shuster et al., 2019). However, because all waves are similarly affected by many of these variables, relative amplitude has proven to be useful (Starr and Achor, 1975). Comparison of ABR latencies of males and females of similar head size also suggests that differences in ABR latencies cannot be completely attributed to differences in skull size (Sabo et al., 1992). In the current study, smaller and leaner young females displayed larger ABR wave amplitudes, but not shorter ABR wave latencies (Figs. 5–9). Middle-age females also displayed higher ABR wave amplitude compared to age-matched males (Fig. 8) despite the fact that there were no sex difference in body weight (Fig. 3). Collectively, both female humans (Jerger and Hall, 1980; Dehan and Jerger, 1990; Shuster et al., 2019) and mice (Rouse et al., 2020; Milon et al., 2018) display larger wave amplitudes than males, suggesting that the CBA/CaJ is a useful model for studying sex differences in ABR wave amplitude.
4.2. Sex differences in cochlear pathophysiology
Ohlemiller et al. (2011) have also demonstrated that loss of cochlear spiral ganglion neurons appears more pronounced in the upper cochlear base in old females than in males. Endocochlear potential (EP) decline is also significantly greater in females although no clear pattern by gender was identified for marginal cell loss in CBA/CaJ mice. Age-related stria vascularis thinning is one of the most prominent features of ARHL in both animals and humans, and reduced strial capillary density has been implicated in potential EP decline (Ohlemiller et al., 2011; Gratton & Schulte, 1995). Ohlemiller et al. (2011) have demonstrated that old CBA/CaJ have significant strial thinning throughout most of the cochlea. However, no sex differences in strial capillary density or size were found in CBA/CaJ. Similarly, no sex differences in IHC or OHC survival were observed in CBA/CaJ. In the current study, no sex significant differences in IHC loss, OHC loss (at 10–100% of apex), ANF density, or SV thickness were observed in CBA/CaJ mice at 5, 17 or 24 months of age. To our knowledge, only the current study and the study by Ohlemiller et al. (2011) have examined sex differences in cochlear pathologies in young, middle-age, and old CBA/CaJ mice. Therefore, further carefully designed histological studies are necessary to examine the sex differences in cochlear hair cell number, SGN/ANF density, SV thickness, strial capillary density, supporting cells, ribbon synapses, and other microstructures in CBA/CaJ and other inbred strains.
4.3. Sex differences in balance
The inner ear houses the sensory organs for hearing and balance. Balance impairment and falls are among the most prevalent conditions in older adults (Agrawal et al., 2020). The National Institute on Deafness and other Communication Disorders estimated that 15% of American adults had a balance or dizziness problem in 2008 (NIDCD, 2022). Previous human studies have reported age-related decreases in vestibulo-ocular-reflex (VOR) gain, increased phase lead, decreased ability to suppress the VOR with vision, reduced shortening of the VOR time constant by post-rotary head tilt, and lower optokinetic response (OKN) slow phase velocity saturation (Paige 1992, 1994; Baloh et al. 1993; Shiga et al. 2005; Furman and Redfern, 2001). In both humans and rodents, age-related changes in vestibular structure and loss of vestibular type I and type II hair cells were observed in the inner ears (Rauch et al., 2001; Shiga et al., 2005; Park et al., 1987). In CBA/CaJ mice, Jones and co-workers have shown that aged mice display a gradual age-related decline in gravity receptor sensitivity using the vestibular-evoked potential (VsEP) test (Mock et al., 2011) However, no significant gender difference for VsEPs was observed in CBA/CaJ mice. In the current study, we performed balance performance tests in CBA/CaJ mice using the rotarod, in which a mouse is placed on a horizontal rod that rotates about its long axis and must walk forwards to remain upright and not fall off (Carter et al., 2001; Tung et al., 2014; Deacon RM, 2013). Consistent with the study by Mock and co-authors, we found no sex differences in latency to fall in young, middle-age, or old mice (Fig. 1). Therefore, the CBA/CaJ mouse may not be a useful model to study sex differences in balance and or vestibular function using the rotarod or VsEP test.
4.4. Sex differences in physical activity and body composition
Previous studies have demonstrated that in general, female mice run farther and faster than males (Bartlting et al., 2017; Lightfoot et al., 2004; Bowen et al., 2016; Koteja et al., 1999): Lightfoot and co-workers investigated voluntary wheel running activities (average daily distance, velocity, and duration) in 13 strains of mice: A/J, AKR/J, BALB/cJ, C3H/HeJ, C57Bl/6J, C57L/J, C3Heb/FeJ, CBA/J, DBA/2J, SWR/J, MRL/MpJ, SPRET/Ei, and CAST/Ei (Lightfoot et al., 2004). The authors found that overall, female mice ran an average of 20% farther and 38% faster than male mice. Males ran 15% longer duration on a daily basis. Body weight was associated with exercise velocity in the female mice. Bartling and coworkers also found higher voluntary wheel running distance during the dark cycle for female C57BL/6 mice at 2 months of age (Bartlting et al., 2017). This was reached by higher running velocities of the females, but not by longer running times. The sex differences in daily distance and velocity declined with age. Although it is generally assumed that exercise capacity is enhanced in male vs. female humans, most studies found enhanced exercise capacity in female mice (Oydanich et al., 2019); however, the mechanism underlying sex differences in voluntary wheel running activity in mice is unclear. In the current study, we found higher voluntary wheel running activity during the dark cycle for young female CBA/CaJ mice (Fig. 2). These results are consistent with the studies by Bartlting et al (2017) and Lightfoot et al. (2004), suggesting that young female CBA/CaJ mice can run farther and faster than males in part because young females are smaller and leaner compared to males. We acknowledge that our finding is possibly spurious due to the number of comparisons done. We also note that it is common practice to feed laboratory mice ad libitum (feeding management in which animals are fed without restriction) which has been shown to cause obesity and high levels of body fat in laboratory mice (Feige-Diller et al., 2022). Consistent with the feeding management report, middle-age and old males and females appeared overweight, and there were no significant sex differences in body weight and voluntary wheel running activity in middle-age or old CBA/CaJ mice (Fig. 2). We
Obesity is associated with mobility loss, functional decline, and cognitive decline in older adults (Anton et al., 2015). Body mass index and obesity are also associated with hearing loss in older adults (Yang et al., 2020; Koo et al., 2022; Croll et al., 2019; Dalton et al., 2019; Hu et al., 2019; Li et al., 2022; Kohlberg et al., 2018). In the current study, we show that body weight, lean mass, and total water mass of young female CBA/CaJ mice are significantly lower than those of males (Fig. 3), and that young females are physically more active than males (Fig. 2). Regular physical activity reduces the risk for obesity, cardiovascular diseases, and disability, prolongs mobility in the elderly, and is associated with longer lifespan expectancy (Taylor et al., 2004; Pahor et al., 2014; Anton et al., 2015; Arem et al., 2015). Therefore, one potential explanation for the larger ABR wave amplitude in young female CBA/CaJ mice compared to males is that young females are smaller, leaner, and physically more active. This in turn improves overall cardiovascular health and increases cochlear blood flow/circulation. However, the sex difference in wheel running activity declines with age as females gain weight because they are fed ad libitum throughout the lifespan (Fig. 3A).
5. Summary
In the current study, young CBA/CaJ females displayed larger ABR waves I, II, II, and V amplitudes and higher IV/I and V/I amplitude ratios compared to males. These young females were smaller, leaner, and physically more active than males. Overall, there were no sex differences in ABR wave latency, ABR threshold, rotarod balance performance in young mice. A key unanswered question is why do young female humans and mice display larger ABR wave amplitudes compared to their counterparts? One of the potential explanations for the larger ABR wave amplitude in young females could be the fact that during the premenopausal period, estrogen levels are high in females, and that estrogen such as 17 β-estradiol (E2) are monophenolic compounds that can act as free-radical scavengers, stabilizing neuronal function, supporting neuronal viability, and preventing neuronal death (Behl, 2002; Behal et al., 1995). In line with the idea, premenopausal women (Jerger and Hall, 1980; Dehan and Jerger, 1990; Shuster et al., 2019) as well as young female mice (Rouse et al., 2020; Milon et al., 2018) display larger wave amplitudes than males, suggesting that estrogen and its signaling pathways are likely protective and required for maintenance of cochlear function and hearing in mammals. In order to study the effects of estrogen, other sex female and male hormones, and sex chromosomes on the auditory system, further carefully designed physiological, histological, and molecular biology studies are necessary to examine the sex differences in hearing and cochlear histology using knockout/conditional knockout/transgenic mice.
Acknowledgments
This research was supported by R03 DC011840 (SS), R01 DC012552 (SS) and R01 DC014437 (SS) from the National Institute of Health and National Institute on Deafness and Communication Disorders, the Claude D. Pepper Older Americans Independence Centers at the University of Florida (P30 AG028740) from the National Institute of Health and National Institute on Aging, Evelyn F. McKnight Brain Research Foundation, and American Cancer Society (131062-RSG-17-171-01-DMC).
Footnotes
Declaration of Competing Interest
The authors declare that there are no conflicts of interest.
CRediT authorship contribution statement
Mi-Jung Kim: Writing – original draft, Writing – review & editing. Peter B Carmichael: Writing – review & editing. Samantha L Erfe: Writing – review & editing. Daniella T Fragnito: Writing – review & editing. Nathan Strom: Writing – review & editing. Richard Salvi: Writing – review & editing, Supervision. Shinichi Someya: Writing – original draft, Writing – review & editing, Supervision, Project administration, Funding acquisition.
Data availability
Data will be made available on request.
References
- Agrawal Y, et al. , 2020. Aging, vestibular function, and balance: proceedings of a National Institute on Aging/National Institute on Deafness and other communication disorders workshop. J. Gerontol. A Biol. Sci. Med. Sci 75 (12), 2471–2480. doi: 10.1093/gerona/glaa097. [DOI] [PMC free article] [PubMed] [Google Scholar]
- Allen PD, Eddins DA, 2010. Presbycusis phenotypes form a heterogeneous continuum when ordered by degree and configuration of hearing loss. Hear. Res 264 (1–2), 10–20. doi: 10.1016/j.heares.2010.02.001. [DOI] [PMC free article] [PubMed] [Google Scholar]
- Anton SD, et al. , 2015. Successful aging: advancing the science of physical independence in older adults. Ageing Res. Rev (Pt B) 304–327. doi: 10.1016/j.arr.2015.09.005. [DOI] [PMC free article] [PubMed] [Google Scholar]
- Arem H, et al. , 2015. Leisure time physical activity and mortality: a detailed pooled analysis of the dose-response relationship. JAMA Intern. Med 175 (6), 959–967. doi: 10.1001/jamainternmed.2015.0533. [DOI] [PMC free article] [PubMed] [Google Scholar]
- Austad SN, 2006. Why women live longer than men: sex differences in longevity. Gend. Med 3 (2), 79–92. doi: 10.1016/s1550-8579(06)80198-1. [DOI] [PubMed] [Google Scholar]
- Baloh RW, Jacobson KM, Socotch TM, 1993. The effect of aging on visual-vestibuloocular responses. Exp. Brain Res 95 (3), 509–516. doi: 10.1007/BF00227144. [DOI] [PubMed] [Google Scholar]
- Bartling B, Al-Robaiy S, Lehnich H, Binder L, Hiebl B, Simm A, 2017. Sex-related differences in the wheel-running activity of mice decline with increasing age. Exp. Gerontol 87 (Pt B), 139–147. doi: 10.1016/j.exger.2016.04.011. [DOI] [PubMed] [Google Scholar]
- Beery AK, et al. , 2010. Sex bias in neuroscience and biomedical research. Neurosci. Biobehav. Rev 35 (3), 565–572. doi: 10.1016/j.neubiorev.2010.07.002. [DOI] [PMC free article] [PubMed] [Google Scholar]
- Behl C, 2002. Oestrogen as a neuroprotective hormone. Nat. Rev. Neurosci 3 (6), 433–442. doi: 10.1038/nrn846. [DOI] [PubMed] [Google Scholar]
- Behal C, Widmann M, Trapp T, Holsboer F, 1995. 17-beta estradiol protects neurons from oxidative stress-induced cell death in vitro. Biochem. Biophys. Res. Commun 216 (2), 473–482. doi: 10.1006/bbrc.1995.2647. [DOI] [PubMed] [Google Scholar]
- Boettcher FA, 2002. Presbyacusis and the auditory brainstem response. J. Speech Lang. Hear. Res 45 (6), 1249–1261. doi: 10.1044/1092-4388(2002/100). [DOI] [PubMed] [Google Scholar]
- Bowen RS, et al. , 2016. Stabilization of the wheel running phenotype in mice. Physiol. Behav 155, 149–156. doi: 10.1016/j.physbeh.2015.12.006. [DOI] [PubMed] [Google Scholar]
- Carter RJ, et al. , 2001. Motor coordination and balance in rodents. Curr. Protoc. Neurosci doi: 10.1002/0471142301.ns0812s15, Chapter 8:Unit 8.12. [DOI] [PubMed] [Google Scholar]
- Chen GD, Decker B, Krishnan Muthaiah VP, Sheppard A, Salvi R, 2014. Prolonged noise exposure-induced auditory threshold shifts in rats. Hear. Res 317, 1–8. doi: 10.1016/j.heares.2014.08.004. [DOI] [PMC free article] [PubMed] [Google Scholar]
- Chung DY, Mason K, Gannon RP, Willson GN, 1983. The ear effect as a function of age and hearing loss. J. Acoust. Soc. Am 73 (4), 1277–1282. doi: 10.1121/1.389276. [DOI] [PubMed] [Google Scholar]
- Croll PH, et al. , 2019. The association between obesity, diet quality and hearing loss in older adults. Aging 11 (1), 48–62. doi: 10.18632/aging.101717, (Albany NY). [DOI] [PMC free article] [PubMed] [Google Scholar]
- Cruickshanks KJ, et al. , 1998. Prevalence of hearing loss in older adults in Beaver Dam, Wisconsin. The epidemiology of hearing loss study. Am. J. Epidemiol 148 (9), 879–886. doi: 10.1093/oxfordjournals.aje.a009713. [DOI] [PubMed] [Google Scholar]
- Dalton DS, et al. , 2019. Cadmium, obesity, and education, and the 10-year incidence of hearing impairment: the beaver dam offspring study. Laryngoscope 130 (6), 1396–1401. doi: 10.1002/lary.28244. [DOI] [PMC free article] [PubMed] [Google Scholar]
- Deacon RM, 2013. Measuring motor coordination in mice. J. Vis. Exp (75) e2609. doi: 10.3791/2609. [DOI] [PMC free article] [PubMed] [Google Scholar]
- Dehan CP, Jerger J, 1990. Analysis of gender differences in the auditory brainstem response. Laryngoscope 100 (1), 18–24. doi: 10.1288/00005537-199001000-00005. [DOI] [PubMed] [Google Scholar]
- Ding D, Qi W, Yu D, Jiang H, Han C, Kim MJ, Someya S, 2013. Addition of exogenous NAD + prevents mefloquine-induced neuroaxonal and hair cell degeneration through reduction of caspase-3-mediated apoptosis in cochlear organotypic cultures. PLoS One 8 (11), e79817. doi: 10.1371/journal.pone.0079817. [DOI] [PMC free article] [PubMed] [Google Scholar]
- Feige-Diller J, et al. , 2022. The impact of varying food availability on gene expression in the liver: testing the match-mismatch hypothesis. Front. Nutr 9, 910762. doi: 10.3389/fnut.2022.910762. [DOI] [PMC free article] [PubMed] [Google Scholar]
- Fu Y, Ding D, Jiang H, Salvi R, 2012. Ouabain-induced cochlear degeneration in rat. Neurotox. Res 22 (2), 158–169. doi: 10.1007/s12640-012-9320-0. [DOI] [PMC free article] [PubMed] [Google Scholar]
- Furman JM, Redfern MS., 2001. Effect of aging on the otolith-ocular reflex. J. Vestib. Res 11 (2), 91–103. [PubMed] [Google Scholar]
- Gratton MA, Schulte BA, 1995. Alterations in microvasculature are associated with atrophy of the stria vascularis in quiet-aged gerbils. Hear. Res 82 (1), 44–52. doi: 10.1016/0378-5955(94)00161-i. [DOI] [PubMed] [Google Scholar]
- Guimaraes P, Zhu X, Cannon T, Kim S, Frisina RD, 2004. Sex differences in distortion product otoacoustic emissions as a function of age in CBA mice. Hear. Res 192 (1–2), 83–89. doi: 10.1016/j.heares.2004.01.013. [DOI] [PubMed] [Google Scholar]
- Han C, Ding D, Lopez MC, Manohar S, Zhang Y, Kim MJ, Someya S, 2016. Effects of long-term exercise on age-related hearing loss in mice. J. Neurosci 36 (44), 11308–11319. doi: 10.1523/jneurosci.2493-16.2016. [DOI] [PMC free article] [PubMed] [Google Scholar]
- Harfmann BD, Schroder EA, Kachman MT, Hodge BA, Zhang X, Esser KA, 2016. Muscle-specific loss of Bmal1 leads to disrupted tissue glucose metabolism and systemic glucose homeostasis. Skelet Muscle. 30 (6), 12. doi: 10.1186/s13395-016-0082-x. eCollection 2016. [DOI] [PMC free article] [PubMed] [Google Scholar]
- Henry KR, 2004. Males lose hearing earlier in mouse models of late-onset age-related hearing loss; females lose hearing earlier in mouse models of early-onset hearing loss. Hear. Res 190 (1–2), 141–148. doi: 10.1016/s0378-5955(03)00401-5. [DOI] [PubMed] [Google Scholar]
- Hu H, et al. , 2019. Obesity and risk of hearing loss: a prospective cohort study. Japan epidemiology collaboration on occupational health study group. Clin. Nutr 39 (3), 870–875. doi: 10.1016/j.clnu.2019.03.020. [DOI] [PubMed] [Google Scholar]
- The Jackson Laboratory. (2018). Baseline life span data: commonly used JAX Mice and crosses (CBA/CaJ). https://www.jax.org/research-and-faculty/research-labs/the-harrison-lab/gerontology/available-data
- The Jackson Laboratory. CBA/CaJ strain. (2022). https://www.jax.org/strain/000654
- Jerger J, Hall J, 1980. Effects of age and sex on auditory brainstem response. Arch. Otolaryngol 106 (7), 387–391. doi: 10.1001/archotol.1980.00790310011003. [DOI] [PubMed] [Google Scholar]
- Jerger J, Johnson K, 1988. Interactions of age, gender, and sensorineural hearing loss on ABR latency. Ear Hear. 9 (4), 168–176. doi: 10.1097/00003446-198808000-00002. [DOI] [PubMed] [Google Scholar]
- Kim MJ, Han C, White K, Park HJ, Ding D, Boyd K, Someya S, 2020. Txn2 haplodeficiency does not affect cochlear antioxidant defenses or accelerate the progression of cochlear cell loss or hearing loss across the lifespan. Exp. Gerontol 141, 111078. doi: 10.1016/j.exger.2020.111078. [DOI] [PMC free article] [PubMed] [Google Scholar]
- Kim MJ, Haroon S, Chen GD, Ding D, Wanagat J, Liu L, Someya S, 2019. Increased burden of mitochondrial DNA deletions and point mutations in early-onset age-related hearing loss in mitochondrial mutator mice. Exp. Gerontol 125, 110675. doi: 10.1016/j.exger.2019.110675. [DOI] [PMC free article] [PubMed] [Google Scholar]
- Kohlberg GD, et al. , 2018. Adolescent obesity is an independent risk factor for sensorineural hearing loss: results from the National Health and Nutrition Examination survey 2005 to 2010. Otol. Neurotol 39 (9), 1102–1108. doi: 10.1097/MAO.0000000000001956. [DOI] [PubMed] [Google Scholar]
- Koo JS, et al. , 2022. Association of body mass index with hearing loss in Korean adult population. J. Pers. Med 12 (5), 786. doi: 10.3390/jpm12050786. [DOI] [PMC free article] [PubMed] [Google Scholar]
- Koteja P, Swallow JG, Carter PA, Garland T Jr., 1999. Energy cost of wheel running in house mice: implications for coadaptation of locomotion and energy budgets. Physiol. Biochem. Zool 72 (2), 238–249. doi: 10.1086/316653. [DOI] [PubMed] [Google Scholar]
- Li W, et al. , 2022. Association of weight change across adulthood with hearing loss: a retrospective cohort study. Int. J. Obes 46 (10), 1825–1832. doi: 10.1038/s41366-022-01197-x, (Lond). [DOI] [PubMed] [Google Scholar]
- Lightfoot JT, Turner MJ, Daves M, Vordermark A, Kleeberger SR, 2004. Genetic influence on daily wheel running activity level. Physiol. Genom 19 (3), 270–276. doi: 10.1152/physiolgenomics.00125.2004. [DOI] [PubMed] [Google Scholar]
- Lin FR, Niparko JK, Ferrucci L, 2011. Hearing loss prevalence in the United States. Arch. Intern. Med 171, 1851–1852. doi: 10.1001/archinternmed.2011.506. [DOI] [PMC free article] [PubMed] [Google Scholar]
- Milon B, et al. , 2018. The impact of biological sex on the response to noise and otoprotective therapies against acoustic injury in mice. Biol. Sex Differ 9 (1), 12. doi: 10.1186/s13293-018-0171-0. [DOI] [PMC free article] [PubMed] [Google Scholar]
- Mamlouk GM et al. (2020) Sex bias and omission in neuroscience research is influenced by research model and journal, but not reported NIH funding. 57:100835. 10.1016/j.yfrne.2020.100835 [DOI] [PMC free article] [PubMed] [Google Scholar]
- McFadden D, Loehlin JC, Pasanen EG, 1996. Additional findings on heritability and prenatal masculinization of cochlear mechanisms: click-evoked otoacoustic emissions. Hear. Res 97 (1–2), 102–119. [PubMed] [Google Scholar]
- McFadden D, Pasanen EG, 1998. Comparison of the auditory systems of heterosexuals and homosexuals: click-evoked otoacoustic emissions. Proc. Natl. Acad. Sci. U. S. A 95 (5), 2709–2713. doi: 10.1073/pnas.95.5.2709. [DOI] [PMC free article] [PubMed] [Google Scholar]
- McFadden D, Pasanen EG, 1999. Spontaneous otoacoustic emissions in heterosexuals, homosexuals, and bisexuals. J. Acoust. Soc. Am 105 (4), 2403–2413. doi: 10.1121/1.426845. [DOI] [PubMed] [Google Scholar]
- Meyer J (2012). Centarians: 2010. https://www.census.gov/content/dam/Census/library/publications/2012/dec/c2010sr-03.pdf
- Mock B, Jones TA, Jones SM, 2011. Gravity receptor aging in the CBA/CaJ strain: a comparison to auditory aging. J Assoc Res Otolaryngol. 12 (2), 173–183. doi: 10.1007/s10162-010-0247-y. Epub 2010 Nov 5. [DOI] [PMC free article] [PubMed] [Google Scholar]
- NIDCD. The balance disorders. (2022) https://www.nidcd.nih.gov/health/balance-disorders
- Ohlemiller KK, Rybak Rice ME, Rellinger EA, Ortmann AJ, 2011. Divergence of noise vulnerability in cochleae of young CBA/J and CBA/CaJ mice. Hear. Res 272 (1–2), 13–20. doi: 10.1016/j.heares.2010.11.006. [DOI] [PMC free article] [PubMed] [Google Scholar]
- Oydanich M, Babici D, Zhang J, Rynecki N, Vatner DE, Vatner SF., 2019. Mechanisms of sex differences in exercise capacity. Am. J. Physiol. Regul. Integr. Comp. Physiol 316 (6), R832–R838. doi: 10.1152/ajpregu.00394.2018. [DOI] [PMC free article] [PubMed] [Google Scholar]
- Pahor M, et al. , 2014. Effect of structured physical activity on prevention of major mobility disability in older adults: the LIFE study randomized clinical trial. JAMA 311 (23), 2387–2396. doi: 10.1001/jama.2014.5616. [DOI] [PMC free article] [PubMed] [Google Scholar]
- Paige GD, 1992. Senescence of human visual-vestibular interactions. 1. Vestibulo-ocular reflex and adaptive plasticity with aging. J. Vestib. Res 2 (2), 133–151. [PubMed] [Google Scholar]
- Park JC, Hubel SB, Woods AD, 1987. Morphometric analysis and fine structure of the vestibular epithelium of aged C57BL/6NNia mice. Hear. Res 28 (1), 87–96. doi: 10.1016/0378-5955(87)90156-0. [DOI] [PubMed] [Google Scholar]
- Pearson JD, Morrell CH, Gordon-Salant S, Brant LJ, Metter EJ, Klein LL, Fozard JL, 1995. Gender differences in a longitudinal study of age-associated hearing loss. J. Acoust. Soc. Am 97 (2), 1196–1205. doi: 10.1121/1.412231. [DOI] [PubMed] [Google Scholar]
- Rauch SD, Velazquez-Villaseñor L, Dimitri PS, Merchant SN, 2001. Decreasing hair cell counts in aging humans. Ann. N. Y. Acad. Sci 942, 220–227. doi: 10.1111/j.1749-6632.2001.tb03748.x. [DOI] [PubMed] [Google Scholar]
- Rouse SL, Matthews IR, Li J, Sherr EH, Chan DK., 2020. Integrated stress response inhibition provides sex-dependent protection against noise-induced cochlear synaptopathy. Sci. Rep 10 (1), 18063. doi: 10.1038/s41598-020-75058-w. [DOI] [PMC free article] [PubMed] [Google Scholar]
- Sabo DL, Durrant JD, Curtin H, Boston JR, Rood S, 1992. Correlations of neuroanatomical measures to auditory brain stem response latencies. Ear Hear. 13 (4), 213–222. doi: 10.1097/00003446-199208000-00001. [DOI] [PubMed] [Google Scholar]
- Shiga A, et al. , 2005. Aging effects on vestibulo-ocular responses in C57BL/6 mice: comparison with alteration in auditory function. Audiol. Neurootol 10 (2), 97–104. doi: 10.1159/000083365. [DOI] [PubMed] [Google Scholar]
- Shuster BZ, Depireux DA, Mong JA, Hertzano R, 2019. Sex differences in hearing: probing the role of estrogen signaling. J. Acoust. Soc. Am 145 (6), 3656. doi: 10.1121/1.5111870. [DOI] [PMC free article] [PubMed] [Google Scholar]
- Starr A, Achor J, 1975. Auditory brain stem responses in neurological disease. Arch. Neurol 32 (11), 761–768. doi: 10.1001/archneur.1975.00490530083009. [DOI] [PubMed] [Google Scholar]
- Taylor RS, et al. , 2004. Exercise-based rehabilitation for patients with coronary heart disease: systematic review and meta-analysis of randomized controlled trials. Am. J. Med 116 (10), 682–692. doi: 10.1016/j.amjmed.2004.01.009. [DOI] [PubMed] [Google Scholar]
- Tung VW, Burton TJ, Dababneh E, Quail SL, Camp AJ, 2014. Behavioral assessment of the aging mouse vestibular system. J. Vis. Exp (89) doi: 10.3791/51605. [DOI] [PMC free article] [PubMed] [Google Scholar]
- Yamasoba T, Lin FR, Someya S, Kashio A, Sakamoto T, Kondo K, 2013. Current concepts in age-related hearing loss: epidemiology and mechanistic pathways. Hear. Res 303, 30–38. doi: 10.1016/j.heares.2013.01.021. [DOI] [PMC free article] [PubMed] [Google Scholar]
- Yang JR, et al. , 2020. Body mass index, waist circumference, and risk of hearing loss: a meta-analysis and systematic review of observational study. Environ. Health Prev. Med 25 (1), 25. doi: 10.1186/s12199-020-00862-9. [DOI] [PMC free article] [PubMed] [Google Scholar]
- Zheng QY, Ding D, Yu H, Salvi RJ, Johnson KR., 2009. A locus on distal chromosome 10 (ahl4) affecting age-related hearing loss in A/J mice. Neurobiol. Aging 30 (10), 1693–1705. doi: 10.1016/j.neurobiolaging.2007.12.011. [DOI] [PMC free article] [PubMed] [Google Scholar]
- Zheng QY, Johnson KR, Erway LC, 1999. Assessment of hearing in 80 inbred strains of mice by ABR threshold analyses. Hear. Res 130 (1–2), 94–107. doi: 10.1016/s0378-5955(99)00003-9. [DOI] [PMC free article] [PubMed] [Google Scholar]
- Zhou X, et al. , 2006. Auditory brainstem responses in 10 inbred strains of mice. Brain Res. 1091 (1), 16–26. doi: 10.1016/j.brainres.2006.01.107. [DOI] [PMC free article] [PubMed] [Google Scholar]
Associated Data
This section collects any data citations, data availability statements, or supplementary materials included in this article.
Data Availability Statement
Data will be made available on request.


