
Figure 5:
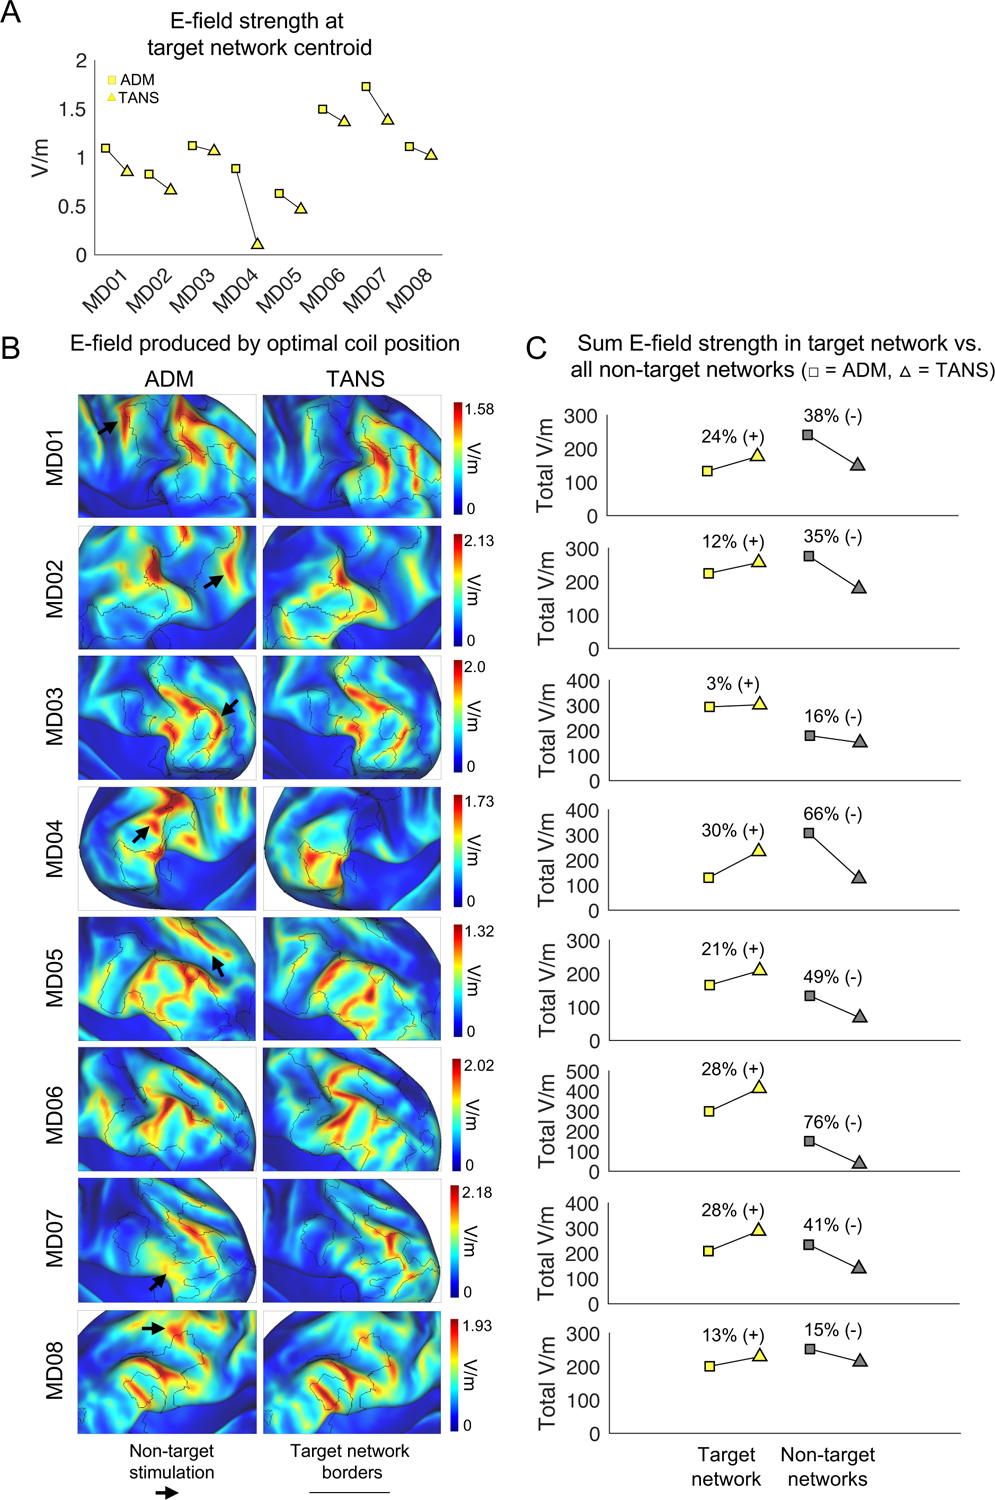
The TANS approach increases the total amount of stimulation in the target functional brain network (A) The average E-field strength inside a 5mm ROI sphere set at the centroid of the target network cluster when using ADM and TANS. Square = ADM, Triangle = TANS. (B) E-field associated with the optimal coil placements identified by ADM (left) and TANS (right). Black borders represent the boundaries of the target functional network. Black arrows highlight stimulation of non-target regions. (C) Total on-target and off-target stimulation (the sum V/m for all target and non-target network vertices inside the E-field hotspot) is shown for each patient. All simulation were performed with stimulation intensity set to dl/dt = 1 A/μ. ADM = auxiliary dipole method, TANS = targeted functional network stimulation.