

SUMMARY
Tumor-associated neutrophil (TAN) effects on glioblastoma biology remain under-characterized. We show here that neutrophils with dendritic features–including morphological complexity, expression of antigen presentation genes, and the ability to process exogenous peptide and stimulate MHCII-dependent T cell activation–accumulate intratumorally and suppress tumor growth in vivo. Trajectory analysis of patient TAN scRNA-seq identifies this ‘hybrid’ dendritic-neutrophil phenotype as a polarization state that is distinct from canonical cytotoxic TANs, and which differentiates from local precursors. These hybrid-inducible immature neutrophils–which we identified in patient and murine glioblastomas–arise not from circulation, but from local skull marrow. Through labeled skull flap transplantation and targeted ablation, we characterize calvarial marrow as a contributor of antitumoral myeloid antigen-presenting cells (APCs), including TANs, which elicit T cell cytotoxicity and memory. As such, agents augmenting neutrophil egress from skull marrow–such as intracalvarial AMD3100, whose survival-prolonging effect in GBM we report–present therapeutic potential.
Keywords: Glioblastoma, skull marrow, myeloid, tumor-associated neutrophil, dendritic cells, antigen-presenting cells, T cells, MHC class II
Graphical Abstract

eTOC BLURB:
Lad et al. demonstrate that calvarial bone marrow supplies the glioblastoma microenvironment with antigen-presenting myeloid cells, including immature neutrophils that polarize into a ‘hybrid’ dendritic-like phenotype. These findings convey the skull marrow as a physiologically relevant and thus clinically targetable immune component of CNS malignancies.
INTRODUCTION
Glioblastoma (GBM) is an aggressive primary brain cancer with poor prognosis.1 Current therapies have failed largely because they treat GBM cells in isolation, failing to account for the interplay between tumor cells and their microenvironment. GBM cells secrete cytokines, chemokines, and growth factors that attract various immune cells, in turn promoting tumor growth, invasiveness, and therapy resistance 2. While myeloid cells constitute the majority of these cells and indeed most nonmalignant cells in the GBM microenvironment,3,4 most studies have emphasized tumor-associated macrophages (TAMs), overlooking tumor-associated neutrophils (TANs) despite their preponderance in circulation. Like macrophages (Mφ), neutrophils are part of the innate immune system, acting as first-line responders during inflammation and arriving at insult sites ahead of Mφs.
Besides their classical antimicrobial functions, neutrophils infiltrate many types of tumors. Early studies suggested that TANs were bystanders, either circulating transiently through tumor vasculature or accumulating passively in the stroma with little function, as it was hard to imagine that such short-lived cells could influence chronic progressive diseases like cancer. Recent studies have cast doubts on this premise by suggesting that TANs influence tumor cells and the microenvironment, although no consensus exists over whether they are pro-tumoral3 or anti-tumoral5. In GBM, the finding that an elevated peripheral neutrophil-to-lymphocyte ratio is associated with worse patient survival6 has suggested a pro-tumor role, but these studies of peripheral blood neutrophils (PBNs) remain correlative and do not qualify the mechanistic interaction between neutrophils and lymphocytes. The tumor-specific cues that dictate TAN functionality in GBM, which is T cell-depleted7, thus remain unclear.
To address this knowledge gap, we isolated PBNs and TANs from GBM patients, compared them transcriptomically, analyzed their interactions with tumor and T cells in culture, and determined their effects in vivo. We used trajectory analysis from patient PBN/TAN scRNA-seq and a calvarial transplantation technique to define a PBN-independent lineage of GBM TANs from immature neutrophil precursors in the skull bone marrow (BM).
RESULTS
TANs are durable residents of the GBM perivascular niche.
Flow cytometry of newly diagnosed patient GBMs revealed that CD45+CD16+CD66b+ TANs constituted 0.39% [range: 0.11-0.69%] of total tumor cellularity and 4.04% [2.52-7.78%] of tumor-infiltrating leukocytes (n=6; Fig. 1A; Table S1). To determine if these neutrophils were more than passerby intravascular cells, we performed IHC to co-localize TANs and blood vessels in patient GBMs. We found that MPO+ TANs in the GBM parenchyma approximated blood vessels in the perivascular niche, but were not truly intravascular (Fig. 1B; Fig. S1A); in fact, compared to Nestin+ GBM stem cells (GSCs), which reside in the perivascular niche,8 TANs even more closely bordered endothelium (avg. distance 8.3 vs 25.7 μm, P<0.001).
Figure 1. TANs are robust, morphologically distinct residents of the perivascular niche in GBM.

(A) Schematic depicting patient neutrophil isolation, with TAN infiltration quantified (n=6).
(B) Immunohistochemical comparison of endothelial (CD31+) proximity to perivascular GSCs (Nestin+) versus neutrophils (MPO+) in human GBM (n=37-38 cells, 3 GBMs). Scale bar represents 20 μm.
(C) Effect of U251cm on neutrophil survival compared to control media (P15h=0.03, P30-90h<0.001), and its neutralization by GM-CSF blockade (n=6/group).
(D) Nuclear segmentation of Wright-Giemsa stained cytospins of patient neutrophils, with distribution quantified in histograms below. Mean segmentation compared between PBNs (n=2133) and TANs (n=1824) via unpaired two-tailed Student’s t-test.
(E) Above: Membrane circularity (form factor) of DAPI-stained TANs vs PBNs (Pcellular=0.001, Pnuclear<0.001; n=4-8/group). Below: NETosis induction by LPS in cultured TANs vs PBNs (P=0.125; n=4/group).
(F) Effect of U251cm on PBN form factor, compared to control (RPMI) or non-GBM-conditioned media (HEK239cm). n=150-743 cells/group. Significance calculated by one-way ANOVA with post-hoc Tukey contrasts.
(G-H) Nanostring multiplex assay of myeloid gene expression in patient-matched TANs/PBNs (n=3). G: Volcano plots depicting differentially expressed genes (P<0.05) related to antigen presentation and T cell activation. H: Geometric mean of normalized DC-related gene expression per sample.
Data represented as means ± SD. *P<0.05, **P<0.01, ***P<0.001. Unless otherwise specified, significance was calculated by unpaired two-tailed Student’s t-test, with Bonferroni correction applied for multiple comparisons. See also Fig S1 and Tables S1–S3.
Further, we found that PBN longevity was enhanced upon exposure to the GBM secretome, dispelling the notion that TANs are short-lived effectors. Healthy control PBNs exhibited robust survival as late as 90 hours (58.83%) in U251 tumor-conditioned media (U251cm), compared to almost no survival (0.9%) in control conditions (P<0.001); this response was amplified longitudinally, with U251cm-treated PBNs exhibiting 1.1-fold (P=0.03), 2.1-fold (P<0.001), and 6.8-fold (P<0.001) greater viability at 15, 30, and 60 hours compared to controls (Fig. 1C; Fig. S1B). This effect was not unique to U251cm, as neutrophils behaved similarly in CM from another human GBM cell line, GBM43, which can grow in suspension to enrich stemness, making it more biomimetic than U251 (Fig. S1C). Phenotypically, surface FcγRIIIb (CD16) downregulation – prototypical of neutrophil apoptosis9 – was delayed in U251cm-treated PBNs (Fig. S1D), a response known to be induced by GM-CSF; as GM-CSF is produced by GBM, we tested whether it mediated the effect of tumor CM.10,11 Indeed, antibody-based GM-CSF blockade abrogated survival prolongation by U251cm (15h: 96.3% vs 90.8%; 30h: 87.1% vs. 37.1%; 60h: 84.9% vs. 5.1%; 90h: 58.8% vs. 0.8%; P<0.001 for all; Fig. 1C). This GM-CSF-dependent benefit of tumor CM on PBN survival was preserved when using CM from homogenized patient tumors (20h: 96.8% vs. 83.9%, P<0.001; 40h: 65.3% vs. 59.3%, P<0.001, Fig. S1E), suggesting that patient tumors produce sufficient GM-CSF to enhance TAN viability.
Compared to PBNs, TANs are morphologically altered In a manner promoted by the GBM secretome.
We then employed Wright-Giemsa staining to validate the purity of our neutrophil FACS algorithm, and to compare TAN and patient-matched PBN morphology. TANs had greater nuclear segmentation than PBNs, consistent with neutrophil activation12–14: 8.2% of TANs were hyper-segmented (5+ segments), compared to 0.2% of PBNs (P<0.001; Fig. 1D). Form factor analysis recapitulated this observation at the nuclear (0.82 vs. 0.52, P<0.001, Fig.1E) and cytoplasmic (0.67 vs. 0.41, P=0.0012; Fig. 1E) membrane levels, suggesting that TANs had non-spherical membranes consistent with nuclear segmentation and cytoplasmic flattening, respectively. These morphological changes did not impact their capacity for NETosis, whereby neutrophils expel DNA and intracellular contents in web-like extracellular traps; TANs and PBNs were similarly NETotic when stimulated by PMA (12.0% vs. 16.4%, P=0.12, Fig. 1E). Finally, we found that U251cm promoted this morphologic change in healthy PBNs (form factor, cellular: 0.96 vs. 0.92; nuclear: 0.88 vs. 0.69, P<0.001, Fig. 1F), confirming the role of the GBM secretome in mediating this phenomenon. Accordingly, U251cm-exposed PBNs exhibited higher mean forward (3.1E5 vs 2.9E5, P<0.001) and side (3.1E5 vs 3.0E5, P=0.03) scatter (FSC, SSC) than control PBNs, consistent with their larger and more structurally complex shape, respectively (Fig. S1F). Using these proxy shape metrics, we validated similar changes using CM from GBM43 and patient tumor (Fig. S1G).
GBM TANs exhibit an APC transcriptional signature that is not fully inducible in PBNs.
We then transcriptomically compared patient-matched TANs and PBNs from 3 GBM patients using the NanoString nCounter platform and a panel of >500 immunology genes. Compared to PBNs, TANs upregulated antigen presentation genes, including costimulatory ligands (CD83/86/40, ICOSLG), MHCII subunits (HLA-DRB3/A, DPA1/B1), and antigen processing proteasomes and chaperones (CD74, CALR, PSME2, HLA-DMA/B) (Fig. 1G, Fig. S1H, Table S2). Many of these genes were dendritic cell (DC)-related, consistent with previously reported neutrophil-DC “hybrids” in autoimmune disease15 and lung cancer.5 Indeed, geometric mean expression of DC-related genes was higher in TANs than PBNs (74.2 vs. 53.5, P=0.002, Fig. 1H).
Culturing healthy PBNs in U251cm caused similar upregulation of many, though not all, of the same APC-related genes (Fig. S1I, Table S3). While part of this discontinuity was attributable to allelic MHCII variance, the inability for the GBM secretome to induce expression of CD86, HLA-DM chaperones, and PSME2 suggested that healthy PBNs may be unable to fully transform into APCs. Concordantly, aggregate DC gene expression did not increase in this setting (69.1 vs. 67.1, P=0.74, Fig. S1J).
GBM TANs activate T cells in an MHCII dependent manner.
We then determined whether the expression of these APC genes bore functional consequences. Flow cytometry of newly diagnosed GBMs confirmed that 11.4-35.7% of TANs expressed MHCII (HLA-DR/DP/DQ), while patient-matched PBNs did not (P<0.001; Fig. 2A). MHCII+ TANs exhibited greater SSC than patient-matched MHCII− TANs, suggesting greater internal complexity morphologically (3.6E5 vs. 3.1E5, P=0.004; Fig. 2B). Using DQ-Ovalbumin, a fluorogenic substrate for proteases, we confirmed that MHCII+ TANs possessed the internal machinery necessary to process exogenous peptide antigen, unlike MHCII− TANs or PBNs (P<0.001; Fig. 2C).
Figure 2. TANs activate T cells in an MHCII-dependent manner.

(A) Flow cytometric characterization of surface MHCII expression in GBM patient TANs/PBNs (n=8), with representative histograms. Quantification shown on right, with significance calculated by paired two-tailed Student’s t-test.
(B) Side scatter (SSC) of patient-matched MHCII+ and MHCII− TANs (n=8, P=0.004), with significance calculated by paired two-tailed Student’s t-test.
(C) Representative histograms comparing DQ-OVA peptide uptake and processing by GBM patient neutrophils, with aggregate results below (n=3 technical replicates/group).
(D) Early (CD69+%) and late (CD25+%) activation of healthy CD3+ T cells cultured with patient neutrophils for 72h and 10 μL/mL CD3/CD28 activator. PCD69+% of CD4+=0.011, CD8+=0.002; PCD25+% of CD4+=0.026, CD8+=0.003 (n=3/group). To determine the role of antigen presentation, TANs were treated with 10 μg/μL αMHCII (PCD69% of CD8+ = 0.033).
(E) Late activation (CD25 MFI) of patient CD3+ T cells cultured with autologous neutrophils for 72h, ±10 μL/mL CD3/CD28 activator. PCD3/28− for TAN cocultures<0.001 CD4+/CD8+; PCD3/28+=0.001 CD4+, 0.004 CD8+. Antibody-mediated quenching of surface MHCII on neutrophils before coculture abrogated TAN effects (PCD3/28+=0.010 for CD8+, P<0.001 all others). n=3/group.
(F-G) 72h coculture of OT-II CD4+ T cells with OVA 323-339 peptide-pulsed healthy splenocytes or FACS-isolated TANs (from GL261-bearing C57BL/6J mice). Unbracketed asterisks indicate differences compared to T cells alone. n=4/group. F: Representative histogram of T cell proliferation (CFSE dilution; left), quantified as indices or % cells divided (right).
G: Early (CD25+) and late (CD69+/44+) activation among cultured T cells.
Data represented as means ± SD. *P<0.05, **P<0.01, ***P<0.001. For panels C-G, significance was calculated using one-way ANOVA with post-hoc Tukey contrasts. See also Fig S2.
We then performed mixed allogenic and autologous syngeneic lymphocyte reactions to determine the effects of TANs on T cells. In the allogenic reactions, where healthy volunteer T cells were cocultured with patient neutrophils in the presence of a CD3/28 T cell activating cocktail, we observed that CD4+ T cells cultured with TANs exhibited 1.9-fold greater early (P=0.01) and 3.2-fold greater late (P=0.03) activation, measured by CD69 and CD25 expression (Fig. 2D; Fig. S2A); analogous trends were observed among CD8+ T cells (2.5-fold greater early activation, P=0.002; 5.3-fold greater late activation, P=0.003). Conversely, PBNs, even when primed with endotoxin, did not activate T cells, suggesting that TANs are phenotypically distinct from resting and conventionally activated PBNs. In the autologous reactions, coculture of TANs and patient-matched circulating T cells similarly yielded 3.7-fold greater late activation of CD4+ (P=0.002) and CD8+ (P=0.004) T cells (Fig. 2E; Fig. S2B). This trend was preserved even without CD3/28 activator (pCD4<0.001, pCD8<0.001), suggesting that TANs express costimulatory ligands and thus provide the dual signals necessary for T cell activation. Antibody-mediated MHCII blockade abrogated this activation (P=0.01; Fig. 2E), confirming the dependence of this phenomenon on peptide cross presentation.
To definitively determine whether TANs present antigen, we assessed if murine TANs could activate ovalbumin-specific OT-II T cells when pulsed with the MHCII-restricted OVA 323-339 peptide. First, we validated in two syngeneic murine GBM models (GL261 [C57BL/6J], BGL1 [Balb/CJ]) that overall neutrophil infiltration extent was of similar magnitude to human tumors (Fig. S2C), and that intratumoral CD11b+Ly6G+ neutrophils appreciably expressed MHCII (HLA-IA/E; 53% [P=0.002] and 34% [P=0.02] of TANs in BGL1 and GL261, respectively; Fig. S2D). Analogous to our patient findings, these MHCII+ TANs were morphologically distinct, exhibiting higher FSC (1.5-fold greater, P<0.001 in BGL1; 1.3-fold greater, P=0.004 in GL261) and SSC (1.7-fold greater, P=0.002 in BGL1; 2.4-fold greater, P<0.001 in GL261) than their MHCII− counterparts (Fig. S2E). Next, we pulsed FACS-isolated TANs from GL261 tumors with OVA peptide, then cultured them with CFSE-labeled CD4+ T cells from OT-II mice. After 72h, we observed robust proliferation of T cells cocultured with pulsed TANs, compared to no proliferation with unpulsed TANs (85.4% vs 3.6% divided, P<0.001), suggesting effective antigen presentation (Fig. 2F). Similarly, exclusively in the setting of OVA pulsing, TANs induced early (77% CD44+ CD69+, P<0.001) and late (90% CD25+, P<0.001) activation (Fig. 2G). Altogether, these data suggest that TANs are potent APCs, inducing proliferation and activation to only a slightly lesser extent than our positive control (pulsed splenocytes; 10% less division, 21% and 7% less early and late activation, P<0.001).
TANs retain their immunostimulatory features in vivo and suppress tumor growth.
We continued investigating murine GBM to discern if these hybrid TANs accumulated sufficiently to elicit effects on tumor burden in vivo consistent with their immunostimulatory properties in culture. To that end, we systemically depleted neutrophils via αLy6G in BGL1-bearing Balb/CJ mice, electing this strain over C57BL/6J given its greater long-term responsiveness to depletion.16,17 Treatment was initiated with an intraperitoneal (i.p.) loading dose before tumor implantation, followed by maintenance injections. Depletion was initially robust (1-week efficacy: 90.1% systemically, 95.0% intratumorally) and remained meaningful over the experimental course (3-week efficacy: 67.0% systemically, 49.0% intratumorally; Fig. S3A). Further, our regimen did not preferentially deplete MHCII+ or MHCII− TANs (Fig. S3B), nor did it affect overall immune or myeloid infiltration (Fig. S3C); among tumor-infiltrating myeloid cells at 3 weeks, only neutrophils were altered by depletion (Fig. S3D).
Consistent with an antitumoral TAN phenotype, tumor growth was accelerated in αLy6G-treated mice. Neutrophil-deficient mice developed 8.0-fold larger tumors than isotype-treated controls at 24 days (measured by bioluminescent imaging [BLI]; P=0.026) and experienced a 3-day reduction in median survival (P<0.001; Fig. 3A). This increase in tumor burden was concomitant with a shift in intratumoral T cell distribution from CD8+ CTL-enriched (32.1% vs. 15.7%, P=0.015) to double-negative T (DNT) cell-enriched (17.5% vs. 41.4%, P=0.005), corroborating prior reports of neutrophil-mediated suppression of TCRγδ T cell proliferation (Fig. 3B).18–21 In fact, CD8+ proportion correlated linearly and inversely (R2=0.5917, P=0.010) with tumor burden (Fig. 3B), suggesting that neutrophil-mediated CTL recruitment attenuated tumor growth in vivo.
Figure 3. Neutrophil depletion exerts T cell dependent effects on GBM in vivo.

(A-D, F-H, J) BGL1-bearing Balb/CJ mice were treated with regularly dosed αLy6G to deplete neutrophils or isotype. Tumor size proxied by BLI.
A: Tumor growth (PPOD24=0.026), with representative BLI images from 1 mouse per cohort. Kaplan-Meier survival (P<0.001) shown below, with significance calculated via log-rank (Mantel-Cox) test. n=9 αLy6G, 8 isotype.
B: Flow cytometric characterization of tumor-infiltrating T cells (above; PCD8+=0.015; PDNT=0.008), and Pearson correlation of CD8+ proportion with tumor growth (fold-change from POD6), with significance calculated via least-squares linear regression. n=5/group.
C: Cell type scores in POD21 tumors, calculated using a Nanostring tumor signaling gene expression panel (n=5/group). PT =0.025, PCytotoxic=0.003, PNK=0.022.
D: Pearson correlation of normalized gene expression (NGE) of cytotoxicity effector function genes with Cd8a, with significance calculated via least-squares linear regression. n=5/group.
F-G: Nanostring transcriptomic comparison of the 3 most- and least-neutrophil enriched POD21 tumors, proxied by Fcgr4 expression. (F) Left: top differentially expressed gene (DEG) sets. Right: Volcano plots of DEGs (P<0.05) related to antigen presentation and T cell co-stimulation. (G) Heatmap of select signaling transduction cascade genes.
H: Comparison of cytokine abundance in representative áLy6G-treated vs isotype-treated mice, measured as mean pixel density (MPD) on a Proteome Profiler multiplex array of tumor supernatants. Black dots indicate non-differentially abundant proteins (ΔMPD<1).
J: Flow cytometric comparison of tumor stroma between αLy6G− (n=5) and isotype-treated (n=4) mice at POD21, analyzed via dimensional reduction (720-2352 cells/sample; representative UMAPs above). Heatmap depicts normalized MFI of markers per cluster. Cluster quantification below, showing reduced mature (P=0.029) and side population (P=0.016) endothelium in neutrophil-depleted mice.
(E) Effect of neutrophil depletion (αLy6G) on tumor growth and Kaplan-Meier survival in T cell-deficient (αCD4/CD8/Thy1.2-treated) BGL1-bearing Balb/CJ mice (n=8/group); treatment yields larger tumors (PPOD18=0.010) and impaired survival (P<0.001).
(I) MHCM+% of TANs across murine GBM models (n=3-4/group), stratified by the model mean CD8+% of tumoral T cells. Pvs(Balb/CJ)=0.046 for C57BL/6J, <0.001 for T cell-depleted Balb/CJ. Pvs(C57BL/6J)=0.012 for T cell-depleted Balb/CJ. Significance was calculated by one-way ANOVA with post-hoc Tukey contrasts.
Data represented as means ± SD, except for BLI (mean ± SEM). POD=post-operative day. *P<0.05, **P<0.01, ***P<0.001. Unless otherwise specified, significance was calculated by unpaired two-tailed Student’s t-test, with Bonferroni correction applied for multiple comparisons. See also Fig S3 and Table S4.
This phenomenon was supported by transcriptional disparities between treated and control tumors, as evaluated by a Nanostring nCounter tumor-signaling panel; neutrophil-deficient mice had 12-17% lower cell type scores for cytotoxic cells wholly (P=0.004), T cells (P=0.025), and NK cells (P=0.022) (Fig. 3C). Moreover, Cd8a expression correlated with both gross CD8+ T cell infiltration (R2=0.9519, P<0.001; Fig. S3E) and with cytotoxicity-related gene expression (Fig. 3D), suggesting that these accumulated CTLs were activated effectors. Upregulated genes included classical toxins perforin and granzyme A (R2prf1=0.5428, P=0.003; R2Gzma=0.5428, P=0.015), activating receptor Klrk1 (NKG2D, R2=0.7569, P=0.001), and degranulation mediator Nkg7 (R2=0.8991, P<0.001) (Fig. 3D).22
To then test whether TAN-mediated tumor suppression depended on this T cell co-infiltration, we depleted neutrophils in combination with pan-T cell depletion, via regularly dosed i.p. αCD4/CD8/Thy1.2. Contrary to our findings in T cell-competent mice, neutrophils did not inhibit tumor growth in the absence of T cells, corroborating the necessity of T cells for antitumoral TAN function (Fig. 3E). In fact, neutrophil depletion was protective in this setting, with mice experiencing a 5-day increase in median survival (P<0.001) and developing 30% smaller tumors (P=0.010) at 18 days.
IFN and TNFα signaling are implicated in TAN-mediated CD8+ T cell enrichment.
Given the dichotomous role of TANs with and without T cells, we sought to discern mediators linking TAN infiltration with CD8+ T cell enrichment by comparing the transcriptional profiles of the three T cell-competent tumors most and least enriched in neutrophils, using Fcgr4 expression as a proxy for neutrophil infiltration given its stratification between depleted and control groups (Fig. S3F). These tumors coincidentally exhibited high and low CD8a expression, respectively (Table S4), with the former upregulating T cell-related Gene Ontology pathways – TCR signaling (GO 0050852, P<0.001), differentiation (GO 0045582, P<0.001), activation (GO 0046635, P=0.007), and proliferation (GO 0042102, P<0.001; Fig. S3G).
Gene set analysis suggested that cumulatively, neutrophil-competent (CD8ahi) and -deficient (CD8alo) tumors were most stratified in their APC element expression (Fig. 3F), suggesting that GBM TANs contributed meaningfully to antigen presentation. In fact, mean expression of 5 of 6 differentially expressed MHCII subunits (Eb1, Dmb1, Ab1, Aa, Dma, and Dmb2) was over 2-fold higher in neutrophil-competent mice than their neutrophil-deficient counterparts, and similar upregulation was observed for MHCI- and costimulation-related genes.
When assessing putative signaling networks involved in this TAN-CTL axis, we observed that neutrophil-competent tumors upregulated the inflammatory IFN-JAK-STAT and TNFα-NFκB pathways (Fig. 3G). Upstream mediators of type I/II interferon production were preferentially expressed in neutrophil-competent (CD8ahi) tissues, including Il12b (log2FC=1.5158, P=0.027) and Il21r (log2FC=1.7901, P=0.001), which induce the differentiation of IFNγ-producing Th1 cells.23,24 In turn, downstream expression of interferon-stimulated genes (ISGs) was enriched: T cell chemokines Cxcl9/10/11, adhesion receptor Icam1, and APC elements. A multiplex array comparing intratumoral cytokine abundance was supportive: FCCXCL9 = 1.29, FCCXCL10=4.11, FCICAM1=1.06 (Fig. 3H).
The predominance of IFNγ signaling in neutrophil/CD8a-enriched tumors corroborated reports that this cytokine – alongside GM-CSF, IL-3, and TNFα – mediates hybrid polarization.25 At a protein level, only neutrophil-competent tumors appreciably contained three of these factors (IFNγ, GM-CSF, and IL3) and was enriched in the fourth (TNFα, FC=4.3), compared to neutrophil-deficient mice. The implied relationship between T cell-associated IFNγ and neutrophil antigen presentation was also observed phenotypically across murine models (Fig. 3I). TAN MHCII positivity was 82% lower in T cell-depleted Balb/CJ mice than controls (53% vs 10% of TANs, P<0.001); meanwhile, GL261-bearing C57BL/6J mice – which have intermediate CD8a+ T cell polarization compared to Balb/CJ models – exhibited similarly intermediate hybrid TAN polarization (34%). Collectively, these findings underscored the reciprocal nature of TAN-T cell crosstalk in stimulating TAN APC features and effecting T cell-mediated cytotoxicity.26
In the absence of TAN-T cell interaction, angiogenesis- and stem-promoting pathways predominate.
Meanwhile, in neutrophil-deficient (CD8alo) tumors, HIF1α and TGFβ/PDGF axes predominated, converging in their promotion of angiogenesis and GSCs. For instance, HIF1α-induced adrenomedullin (log2FC=−2.2799, P=0.015) and Pdgfra/b signaling (log2FC=−1.9310, P=0.011; log2FC=−1.8590, P=0.004), which enhance VEGF synthesis27 and endothelial proliferation, were upregulated in neutrophil-deficient tumors. Likewise, stemness and self-renewal genes governed by these same programs were also enriched, including Sox2 (log2FC=−1.2375, P=0.022)28–30 and TGFβ superfamily cytokine activin A (log2FC=−0.8391, P=0.029).31
To assay if these pathways yielded meaningful changes at a cellular level, we compared stromal infiltrates and GSC marker expression between neutrophil-competent and neutrophil-depleted endpoint tumors. Critically, because TAN-deficient tumors were also CD8alo, we conducted these analyses in both T cell-competent and T cell-depleted (αCD4/αCD8/αThy1.2) models to delineate if these changes were attributable to a paucity of neutrophils or cytotoxic T cells.
Our stromal characterization, accomplished via flow cytometry and dimensional reduction analysis to account for promiscuous mesenchymal marker expression, suggested endothelial enrichment with αLy6G treatment in both models (Fig. 3J, Fig. S3H), implying that TANs attenuate angiogenesis. Interestingly, the subpopulations of affected endothelial cells varied, with neutrophil-deficient tumors enriching CD45lo or CD45hi endothelium in T cell-competent or -deficient mice, respectively (17.3% vs 8.1%, P=0.025; 41.1% vs 13.6%, P=0.011). Altogether, endothelial cells were more activated in neutrophil-deficient mice, expressing twice as much CD105/6 (avg. MFI: 1328 vs 2408, P=0.001). Other stromal populations (MSCs, fibroblasts, and pericytes) were unaffected.
By contrast, our stemness analysis – wherein we quantified CD133, a HIF1α- and TGFβ/PDGF-inducible GSC marker – did not corroborate our transcriptomic findings.32,33 While neutrophil-bearing T cell-competent mice had greater Ifng signaling (log2FC=1.7079, P=0.010), which canonically suppresses Notch1 signaling and downstream CD133 expression,23 this program ultimately did not curb GSCs (13.6% αLy6G vs. 14.8% isotype; P=0.7; Fig. S3I). Speculating that TANs may be modulating stemness in opposition to IFNγ-producing CD8+ cells that were concurrently enriched in neutrophil-high tumors, we interrogated T cell-depleted mice; in this setting, CD133 expression was increased in neutrophil-bearing mice (8.0% vs 1.8%, P=0.04), suggesting TANs in isolation promote GSCs. This aligned with our observation that, in vivo, TANs were grossly protumoral. We validated this in culture, observing greater neurosphere formation by GBM43-derived GSCs grown in patient TAN CM, compared to control media (106 vs. 72 neurospheres/well; P<0.001; Fig. S3J).
These contrasting CTL- vs. GSC-promoting transcriptional signatures aligned with historical models of N1/N2 neutrophil polarization, wherein IFNγ induces the former and TGFβ the latter.12 Traditionally, N1 neutrophils upregulate TNFα/ICAM1, while N2 neutrophils promote tumor stemness, analogous to the TAN effects we observed in T cell-competent and -deficient mice, respectively.34 Broadly, our findings suggested an inflammatory positive feedback loop between hybrid TANs and IFNγ-producing T cells; in T cell-barren tumors, however, TAN-presented antigen cannot elicit a response and oncogenic signaling predominates.
Immunostimulatory and GSC-promoting phenotypes define a noncanonical TAN polarization state distinct from conventional cytotoxic TANs.
Our observation that TANs both enrich GBM stemness and immunologically attenuate GBM growth prompted us to interrogate whether these phenotypes reflected TAN heterogeneity. To that end, we employed scRNA-seq on patient-matched TANs and PBNs. After exclusion of non-viable and contaminant immune cells, 7463 PBNs and 11831 TANs were analyzed.
Broadly, TANs and PBNs exhibited distinct and stratified clustering in UMAP space (Fig. 4A). Module scores were computed for genes defining MHC class I and II pathways, and as previously observed, TANs upregulated both modes of antigen presentation.5,35 The magnitude of upregulation was greater for class II presentation (tMHCII=121.11, P<0.001; tMHCI=25.71, P<0.001), driven by MHCII subunit HLA-DRA (log2FC=2.98), invariant chain CD74 (log2FC=3.02), and activation marker CD83 (log2FC=1.46). Further corroborating this immunostimulatory signature, the top 50 genes upregulated by TANs included cytokines IL1B (log2FC=3.82) and CXCL8 (log2FC=1.65), and macrophage inflammatory protein-1 subcomponents CCL4/3 (log2FC=3.98, log2FC=2.98; Fig. 4B; Table S5). Many of these genes are conventionally expressed by DCs (CD83) and macrophages (CCL3/4, IL1B), again reflecting a hybrid phenotype. However, these cells still robustly expressed S100A8/9 (95.5%/92.4% of TANs), which encode the predominant intracellular protein in neutrophils, calprotectin.
Figure 4. scRNA-seq suggests TAN polarization into canonical and hybrid subsets from precursors not seen in circulation.
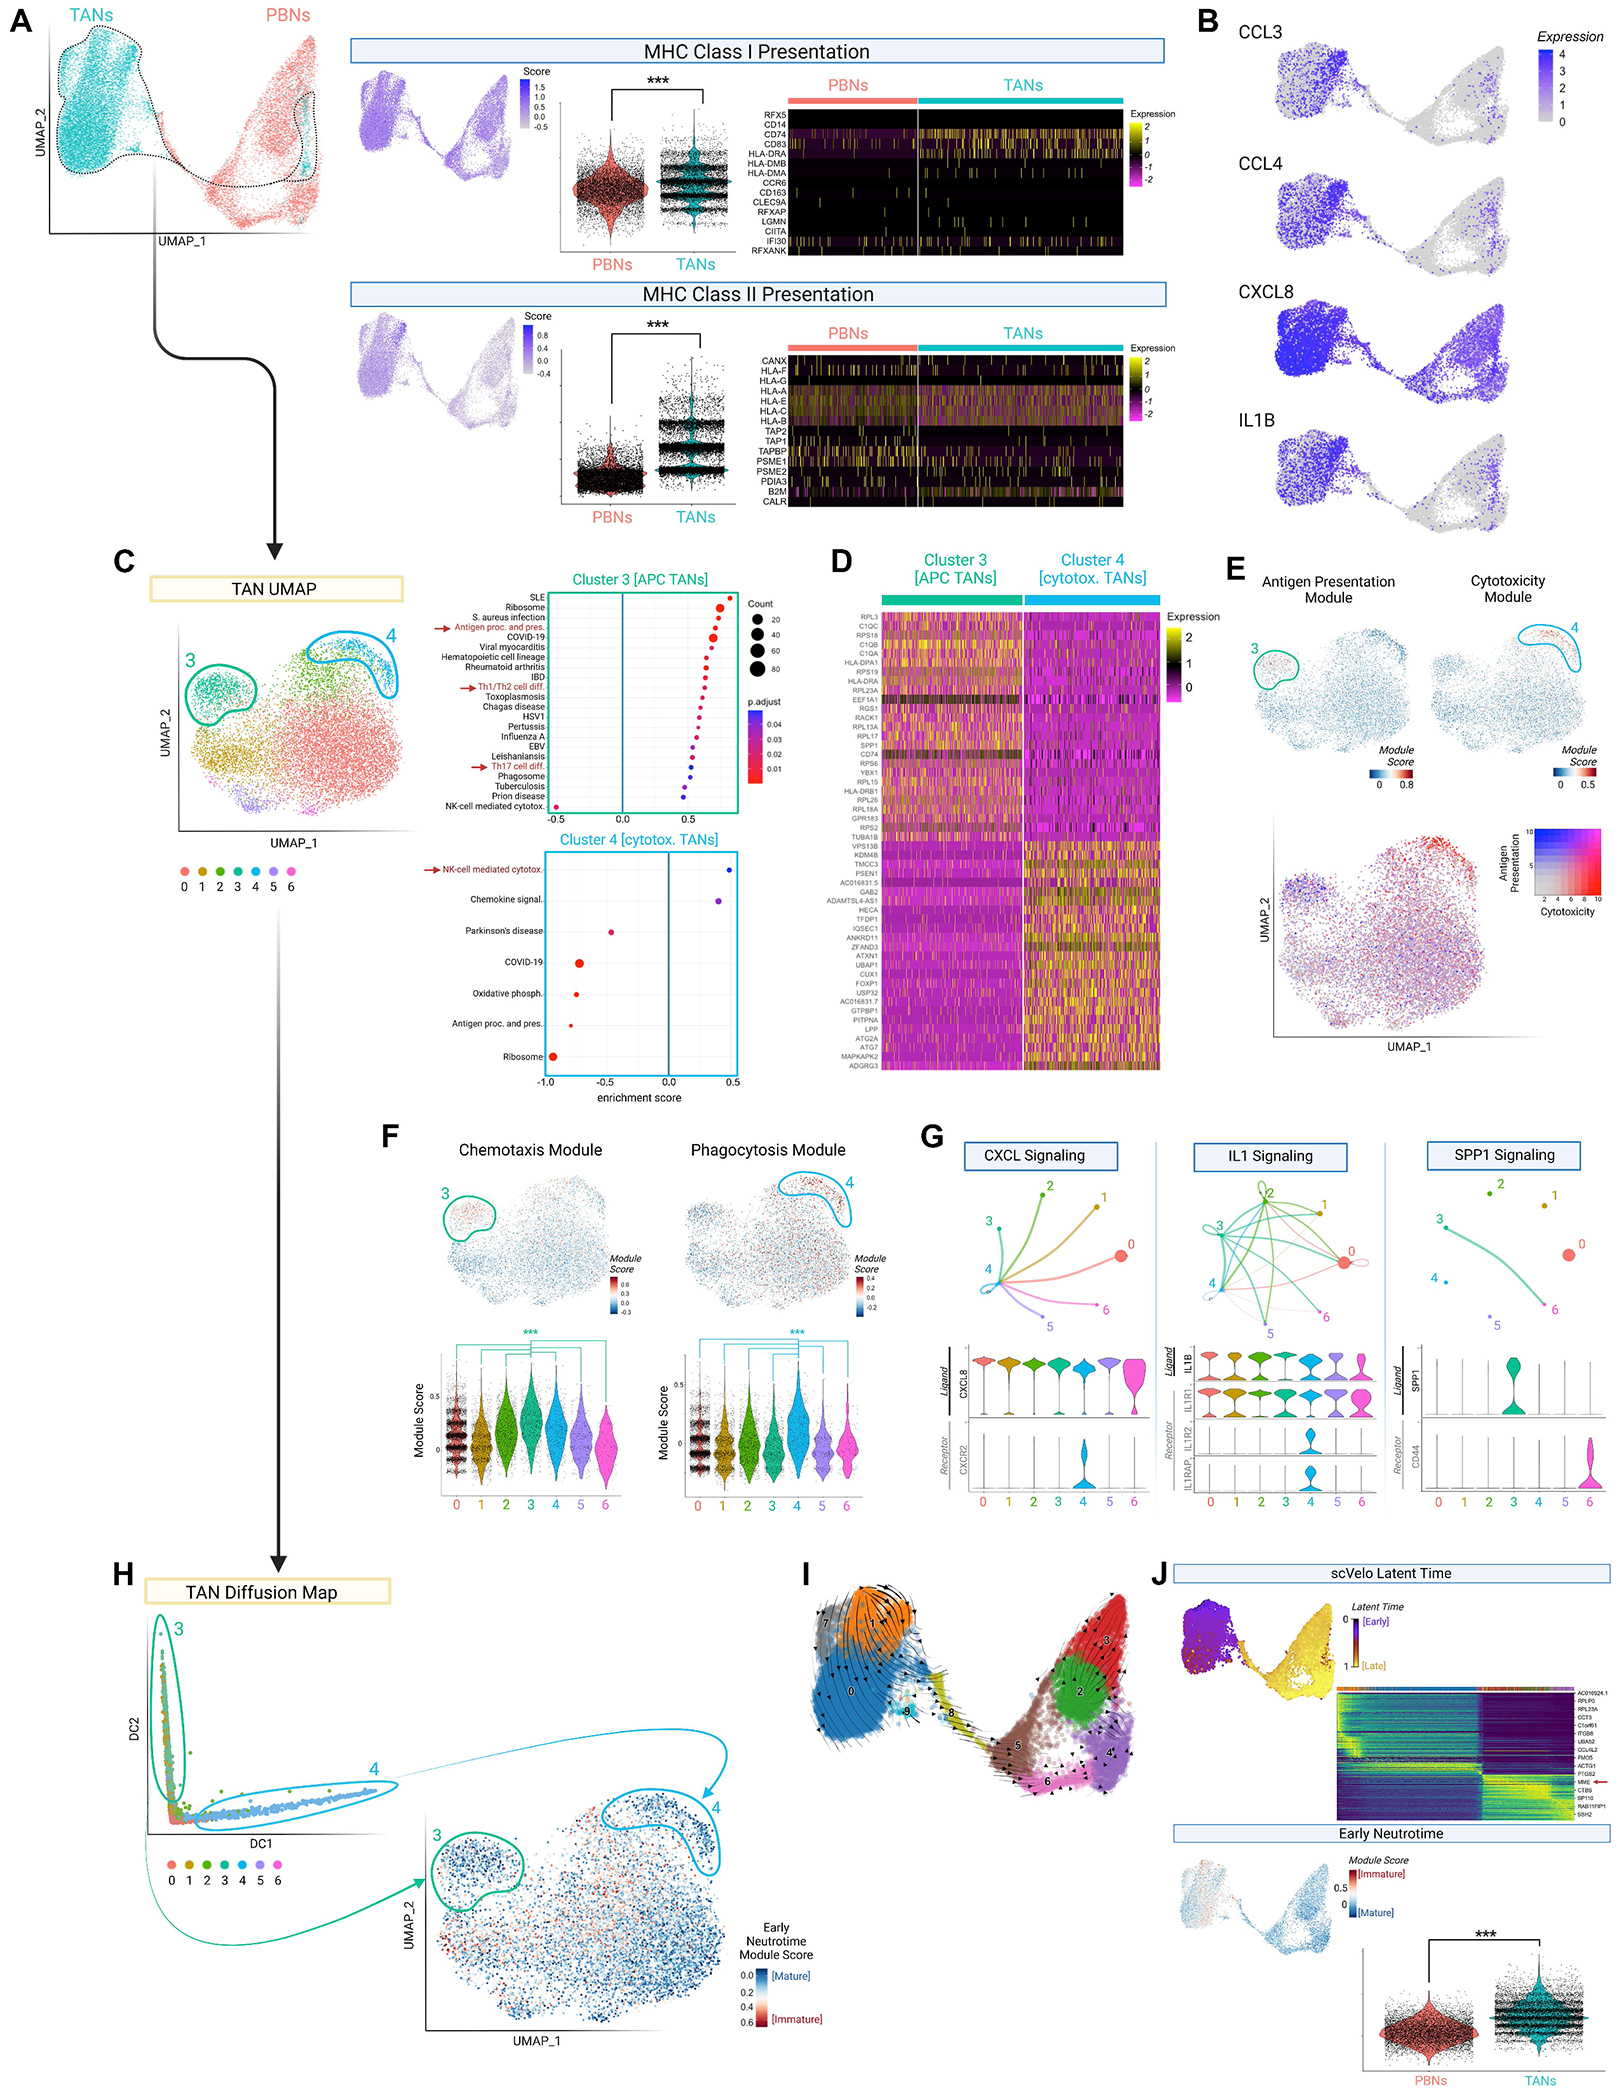
(A) Left: scRNA-seq of patient-matched PBNs/TANs, in UMAP space. Right: Module scores for MHCI and MHCII-related gene expression, visualized per cell (feature plot) and compared between neutrophil sources (violin plot). Heat maps depict constituent genes.
(B) Feature plot depicting expression of cytokine genes.
(C) UMAP visualization of TANs, with KEGG pathway enrichment analysis of clusters 3 (green, n=866) and 4 (blue, n=488). Only up- or down-regulated pathways shown; select pathways highlighted in red.
(D) Heatmap depicting top 50 differentially expressed genes between cluster 3 (APC) and 4 (cytotoxic) TANs.
(E) Feature plots depicting module scores for “Antigen processing and presentation” and “NK-cell mediated cytotoxicity” KEGG pathways (upper plots). Combined representation below.
(F) Feature and violin plots depicting module scores for chemotaxis- and phagocytosis-related genes. Comparisons with clusters 3 and 4 are shown in the violin plots below, with significance calculated by Kruskal-Wallis test with post-hoc pairwise Wilcox contrasts.
(G) Network graphs from CellChat ligand-receptor analysis of TANs; dot size represents cluster size, and arrows match the ligand-expressing cluster color. Violin plots shown below.
(H) Diffusion map of TANs, illustrating clusters 3 and 4 (circled) at opposite ends of the resulting continuous distribution. Corresponding feature plot depicts ‘Early Neutrotime’ scores on the original TAN UMAP, computed based on neutrophil immaturity genes; lower scores indicate greater maturity.
(I) RNA velocity vectors (scVelo) showing developmental relationships between TAN and PBN clusters in the combined dataset.
(J) Quantification of neutrophil maturity by scVelo latent time (above) and Early Neutrotime (below, inversely proportional to maturity), with scores depicted as feature plots. For latent time, heatmap of top transitionally expressed genes shown. For Early Neutrotime, violin plot comparing PBNs and TANs shown.
Data represented as violin plots. *P<0.05, **P<0.01, ***P<0.001. Unless otherwise specified, significance was calculated by unpaired two-tailed Student’s t-test, with Bonferroni correction applied for multiple comparisons. See also Fig S4 and Tables S5–S7.
In discerning whether these hybrid properties identified GBM TANs wholly or a subset, we observed that of six TAN clusters, cluster 3 (866 cells, 7.3%) enriched genes in KEGG pathways for antigen presentation/processing and Th1/2/17 differentiation (Fig. 4C–D; Fig. S4A; Table S6). In contrast, cluster 4 (488 cells, 4.1%) displayed a conventional phenotype, upregulating cytotoxicity genes (Table S7). Combined representation of module scores corresponding to these pathways further highlighted the dichotomy between APC and cytotoxic TAN clusters (Fig. 4E). Additionally, APC TANs exhibited a chemotactic profile characterized by CCL3/CCL4/C1Q/IL1 expression, while cytotoxic TANs upregulated motility and phagocytosis-related genes (Fig. 4F; Fig. S4B), suggesting contrasting effector mechanisms (leukocyte recruitment/activation vs microbicidal function). In fact, in the integrated UMAP space, cytotoxic TANs clustered among PBNs (Fig. S4C), representative of their classical features. Similarly, 41 of the top 50 differentially expressed genes defining cytotoxic TANs relative to other TANs were identical to genes upregulated by PBNs relative to TANs (Fig. S4D; Table S6).
We then applied the ligand-receptor prediction algorithm, CellChat, to discern if APC and cytotoxic TANs interacted. Cytotoxic TANs displayed a responder phenotype, upregulating receptors for cytokines (CXCL8, IL1) expressed by other TANs (Fig. 4G). Meanwhile, APC TANs upregulated these cytokines, as well as the GSC-promoting gene SPP1.36 Further assays confirmed that the encoded protein (osteopontin) was secreted in greater quantity by TANs than PBNs (Fig. S4E), and that osteopontin blockade impeded the stimulatory effects of TANcm on stemness gene expression (NANOG, OCT4; P<0.01; Fig. S4F) and neurosphere formation (P<0.05; Fig. S4G). Critically, the coincidence of inflammatory and stem-promoting features in noncanonical TANs reinforced the centrality of T cell infiltration in determining their net effect on tumor biology.
Trajectory analysis suggests that hybrid TANs polarize intratumorally from immature precursors.
Given the stark differences between cytotoxic and hybrid GBM TANs, we next applied diffusion mapping to delineate if these phenotypes represented alternative differentiation trajectories. Indeed, cells corresponding to clusters 3 and 4 localized to opposite ends of the resulting continuous distribution. The distinct profiles of clusters 3 and 4, and their divergence from PBNs in GBM patients, implied the origin of these clusters from local progenitors (Fig. 4H). Even cytotoxic TANs, which closely resembled PBNs exposed to the tumor secretome, still upregulated genes (e.g., OSM, HLA-DRA) that could not be induced in culture from PBNs (Table S6), suggesting contribution from more plastic precursors.
To query TANs for this immature subset, we calculated Early Neutrotime scores based on a transcriptional module tracing neutrophil development.37 While cytotoxic and hybrid TANs were relatively differentiated, most TANs displayed high Early Neutrotime scores consistent with developmental naivety. Moreover, an alternative unsupervised pipeline based on transitional expression patterns (scVelo) illustrated that no RNA velocity vectors directed differentiation from PBNs towards TANs (Fig. 4I), corroborating the idea that hybrid TANs arose intratumorally rather than peripherally. Conversely, PBNs exhibited universally low Early Neutrotime and high latent time (scVelo) scores (Fig. 4H; Fig. S4H), suggesting that immature neutrophils were exclusive to the TME.
Of note, the dynamically expressed genes (n=264) driving ‘latent time’ included terminal neutrophil markers (MME, PTPRC; Table S7), suggesting that this index truly reflected maturity. In general, PBNs resembled resting PMNs, upregulating late differentiation markers (CXCR2, ITGAM; log2FC=0.62, 0.53), prototypical functional modules (tertiary granule, phagocytosis, respiratory burst; Fig. S4I), and motility-related genes (MYO1F, ADAM8, DOCK2, JAML; log2FC=1.71, 0.45, 1.30, 0.69). Unlike inflammatory TANs, PBNs upregulated immunoregulatory genes: ENTPD1 [CD39], GIT2, and SEMA4D (log2FC=1.99, 1.83, 1.21), which generate adenosine, attenuate TLR signaling, and suppress premature activation.38–40
Hybrid induction occurs in immature murine neutrophils, and is driven by IFNγ signaling.
As our scRNA-seq data suggested that hybrid TAN differentiation occurred entirely within the TME from immature progenitors, we first validated that PBNs were not transformable. Patient and healthy PBNs cultured with CM or tumor cells directly from two models (U251, GBM43) did not upregulate MHCII (Fig 5A; Fig. S5A). We then explored the possible roles of self-recognition and other leukocytes in this phenomenon, coculturing patient PBNs with matched tumor cells, ± infiltrating leukocytes. Again, surface-level MHCII expression was not induced (P=0.2-0.9; Fig. 5A, lower).
Figure 5. MHCII+ TANs with hybrid features arise from immature BMNs rather than PBNs.

(A) Surface MHCII expression in healthy (above) and patient (below) PBNs exposed to U251cm or U251 cells (“U251cc”) for 16h, and for longer in the healthy volunteer arm (n=6/group). Patient PBNs were also cultured with autologous tumor, ± CD45+ immune cells present.
(B) Representative contour plots (left) of MHCII and CD11c expression by FACS-purified mature (CXCR2+Ly6Ghi) and immature (CXCR2−Ly6Glo/hi) Lin−CD11b+Gr1+ BMNs cultured in control or GL261cm for 48h. Wright-Giemsa stained cytospins of immature BMNs (right) depict dendritic processes and irregular nuclei in GL261cm-exposed cells. Images of induced hybrids are stitched together.
(C) APC feature induction in immature and mature BMNs exposed to GL261cm, including hybrid marker expression (Pmature=0.010, Pimmature<0.001) and DQ-OVA uptake/processing (Pmature=0.008, Pimmature<0.001). Induction was greater among immature BMNs (Fhybrid=30.84, P<0.001; FDQ-OVA=32.51 , P<0.001), as determined by two-way ANOVA. n=5/group.
(D) Size (forward scatter, FSC) and internal complexity (side scatter, SSC) of induced hybrid BMNs, compared to CD11c−MHCII− canonical BMNs. n=5.
(E) Rate of hybrid transformation (# per 1000 starting cells) among C57BL/6J BMNs cultured for 48h in GL261cm. Media was treated with isotype or antibodies targeting IFNγ signaling cytokines. For CXCL9/10/11, the receptor (CXCR3) was instead inhibited. n=3-5/sample.
(F) Myeloblastic cells observed in Wright-Giemsa stained cytospins of patient TANs, with non-segmented nuclei, azurophilic hue, and enlarged profile.
(G) Above: Dot plots of immaturity (CD49d expression) in 3 paired PBN-TAN samples, as assessed by flow cytometry. Below: Representative histogram of MHCII expression in CD49dhi vs CD49dlo TANs, with quantification below. Significance was calculated by paired two-tailed Student’s t-test.
(H) Comparison of maturity (CXCR2 expression) in paired PBNs/TANs collected from GL261-bearing C57BL/6J mice (n=3, P=0.036), as assessed by flow cytometry. Significance was calculated by paired two-tailed Student’s t-test.
(I) Flow cytometric characterization of TAN maturity (left) and hybrid polarization (MHCII+%; right) in BGL1-bearing Balb/CJ mice over 25 days, illustrating progressively fewer immature TANs (P10d vs 20d<0.001, P10d vs 25d<0.001, P20d vs 25d= 0.020) and greater MHCII+ TANs (P10d vs 20d<0.001, P10d vs 25d<0.001). n=5-10/group.
(J-K) BGL1-bearing Balb/CJ mice were depleted of neutrophils (αLy6G) either early (POD-1 to POD5, n=11) or late (POD11-POD17, n=8) during tumor growth; controls received isotype (n=8).
J: Flow cytometric characterization of TANs at 21d, showing reduced immature (Pcontrol<0.001, Plate depl.=0.002) and hybrid (Pcontrol=0.001, Plate depl.=0.002) TAN infiltration with early depletion.
K: Kaplan-Meier survival and BLI demonstrates that early depletion attenuates survival (Pcontrol=0.024, Plate depl.=0.003) and yields larger tumors at 21d (Pcontrol=0.030, Plate depl.=0.049). Significance for survival was calculated by log-rank (Mantel-Cox) test.
Data represented as means ± SD, except for BLI (mean ± SEM). POD=post-operative day. *P<0.05, **P<0.01, ***P<0.001. For panels A, E, I-K: significance was calculated by one-way ANOVA with post-hoc Tukey contrasts. Unless otherwise specified, significance for other panels was calculated by unpaired two-tailed Student’s t-test, with Bonferroni correction applied for multiple comparisons. See also Fig S5.
Next, to explore the inducibility of more plastic cells analogous to those in our scRNA-seq analysis, we leveraged murine bone marrow neutrophils (BMNs). As with human PBNs, exposure of magnetically isolated C57BL/6J PBNs to GL261cm did not yield MHCII expression (P=0.5; Fig. S5B). However, in cultures of FACS-purified mature Lin−CD11b+Gr1+CXCR2+Ly6Ghi and immature Lin−CD11b+Gr1+CXCR2−Ly6Glo/hi BMNs, only the latter robustly expressed MHCII in response to tumor-secreted proteins (Fig. 5B; Fig. S5C).37,41,42 The resultant ‘hybrid’ population co-expressed DC marker CD11c (P<0.001 immature, P=0.01 mature) and could process exogenous peptide antigen (P<0.001 immature, P=0.008 mature; Fig. 5C; Fig. S5D).35 Further, conditioned immature BMNs developed oval nuclei and dendritic projections, deviating from classical neutrophil morphology (ringed nuclei, circular profile). Indeed, induced hybrids were larger (FSC: 439250 vs. 271868, P<0.001) and structurally complex (SSC: 236327 vs. 93413, P<0.001; Fig. 5D). All findings were confirmed in Balb/CJ mice with BGL1cm (Fig. S5E).
Next, we interrogated the tumor secretome for factors mediating hybrid transformation (Fig. 5E). As our earlier murine Nanostring analysis had implicated IFNγ signaling in TAN-T cell crosstalk, we targeted all levels of this pathway: upstream mediators, IFNγ, and ISGs.43 While IFNγ blockade was insufficient to prevent MHCII expression on GL261cm-exposed immature BMNs (rate of induction: 24.6 vs 29.4 per 1000 cells, P=0.6), concurrent treatment with αGM-CSF did preclude induction (24.6 vs 7.0, P<0.001), corroborating reports that these factors synergistically promote hybrid differentiation.5 Interestingly, IL21 blockade could independently suppress hybrid transformation (22.3 vs 2.9, P<0.001), perhaps owing to its additional role as a known neutrophil activator.44
Histologic and cytometric identification of immature TANs in patient GBMs.
The exclusive inducibility of immature neutrophils into hybrid TANs, together with our scRNA-seq data, suggested that these precursors must infiltrate the GBM TME. Indeed, though patient TANs were generally hypersegmented, our histologic analysis revealed a subset of azurophilic cells with high nuclear-to-cytoplasmic ratios among TANs, resembling early myeloblasts (Fig. 5F); these cells constituted 1.10% of imaged TANs (n=1824 cells), but were absent in circulation. Flow cytometry of 3 paired patient TAN/PBN samples supported this finding; CD49dhi pre-neutrophils (preNeus) comprised 3.52% [95% CI: ±2.40%] of TANs, but only 0.26% [95% CI: ±0.56%] of PBNs (P=0.036; Fig. 5G).
Collectively, these findings indicated that early lineage TANs accumulated in the human GBM TME. Moreover, among these CD49dhi TANs, hybrid TANs were 3.07 times (P=0.042) more common and had 12.33 times (P=0.0495) greater surface MHCII expression than among CD49dlo TANs, recapitulating the link between developmental immaturity and hybrid inducibility. Notably, CD49d also serves as a receptor for osteopontin, which is secreted by hybrid TANs, suggesting that hybrid TANs may promote their own expansion by augmenting precursor recruitment.45 Likewise, TANs upregulated C1Q, which is similarly involved in HSPC homing.46
Progenitor recruitment to early-stage murine GBM is required for TAN-mediated tumor suppression.
As with patients, we observed in GL261-bearing C57BL/6J mice that immature neutrophils were enriched intratumorally compared to circulation (73.3% vs 20.0%, P=0.036; Fig. 5H). This aligned with our finding that, in vitro, the tumor secretome preserved neutrophils in this dedifferentiated state; in mixed BM cultures, 18.5% [95% CI: ±0.9%] of GL261cm-exposed neutrophils remained immature after 48h, compared to 9.4% [95% CI: ±1.4%] in control conditions (P<0.001; Fig. S5F). Further, GL261cm retarded apoptosis specifically in immature neutrophils (P<0.001; Fig. S5G).
To elucidate the link between neutrophil immaturity and hybrid-inducibility in vivo, we longitudinally characterized TANs in BGL1-bearing Balb/CJ mice. Immature neutrophil infiltration peaked early in tumor growth, waning from 92.5% of TANs at 10d to 69.0% by 25d (P<0.001, Fig 5I). By contrast, hybrid polarization increased 7-fold over this interval, (2.8% to 27.9%, P<0.001). Speculating that early-infiltrating immature TANs gave rise to these late-peaking hybrids, we depleted mice of neutrophils early (−1 to +5 days) during tumor growth (Fig. S5H), finding that immature TAN infiltration was indeed reduced (60.6% of vs 79.3% of TANs, P<0.001), and accordingly, hybrid TAN infiltration was halved (8.0% vs 20.5%, P=0.001; Fig. 5J) at 3 weeks. Clinically, this resulted in mice with 5.8-fold larger tumors (P=0.030) and shortened median survival (33 vs 30d, P=0.024; Fig. 5K). By contrast, mice depleted of neutrophils later (+11 to +17 days) exhibited TAN phenotypes and outcomes analogous to controls. Thus, initial immature neutrophil recruitment foments later hybrid TAN accrual, corroborating reports that early-infiltrative TANs have a uniquely antitumoral phenotype.17
Immature TANs infiltrate GBM from adjacent skull bone marrow.
We then determined if the GBM microenvironment was chemotactic for these immature neutrophils. Mixed C57BL/6J BM isolates were seeded atop transwell inserts and allowed to migrate towards either control media or GL261cm for 16h; migrated cells in the CM group were enriched in both granulocyte-monocyte precursors (GMPs) and immature neutrophils (Fig. 6A; 6.9% vs. 1.0% GMP, pGMP=0.005; 32.0 vs. 12.2% immature neutrophils, pimmNeu=0.003).
Figure 6. GBM recruits immature neutrophils from skull marrow in vivo and subsequently induces MHCII expression.

(A) 16h transwell migration of mixed C57BL/6J BM isolates towards control or GL261cm (n=3/group), with unmigrated (above filter, “source”) and migrated (below filter) cells quantified by flow cytometry for GMPs (Psource=0.232, Pmigrated=0.027) and immature neutrophils (Psource<0.001, Pmigrated=0.008). Experimental schematic and gating for HSCs and immature neutrophils shown.
(B) Above: Schematic of murine calvarial BM niches and ex vivo assay. Below: Quantification of immature neutrophil migration from calvaria cultured in control or syngeneic tumor-CM for 48h (n=3/group). PC57BL/6J=0.045, PBalb/CJ=0.043.
(C-E) BGL1-bearing Balb/CJ mice (n=3) were transplanted with CMFDA-stained skull flaps, and tumors were analyzed at 72h by flow cytometry.
C: Above: Experimental schematic. Below: Contour plots of TANs from each mouse, with CMFDA+ skull-derived cells gated based on FMO. Values indicate % of TANs.
D-E: Immature (D) and MHCII+ (E) proportion of skull-derived TANs, compared to BMNs in the skull itself (“source”). n=3/group, Pimmature=0.003, PMHCII=0.024. Representative contour plots shown in E.
(F) Zebra plot of MHCII expression by definitively skull-derived (GFP+) and other (GFP−) TANs in 3 GL261-bearing C57BL/6J mice, which were transplanted with UBC-GFP skull flaps prior to tumor inoculation. Quantification on right, P=0.002.
(G) Above: SkullGFP C57BL/6J mice were generated through cranial irradiation and UBC-GFP BM transplantation. Below: Flow cytometric quantification of skull-derived (GFP+) canonical and hybrid TANs from GL261-bearing SkullGFP mice at 20d; histograms shown per mouse, with quantification on right. Significance was calculated by paired two-tailed Student’s t-test.
Data represented as means ± SD. *P<0.05, **P<0.01, ***P<0.001. Unless otherwise specified, significance was calculated by unpaired two-tailed Student’s t-test. See also Fig S6.
Then, in light of a study demonstrating that the brain after stroke recruits neutrophils from local skull BM rather than homogenously from systemic BM,47 we investigated whether this myeloid reservoir contributed immature neutrophils to GBM. Mice calvaria were harvested and cultured in control media or syngeneic tumor-CM for 48h (Fig. 6B). Consistent with our transwell findings, emigrated neutrophils in the presence of CM were disproportionately immature (C57BL/6J: 33.5% vs 19.4%, P=0.045; Balb/CJ: 4.6% vs 2.5%, P=0.043). In vivo, we observed that the skulls of GL261-bearing C57BL/6J mice had fewer immature neutrophils than healthy skulls (38.2% vs 45.9%, P=0.048; Fig. S6A), suggesting extensive emigration of these cells. By contrast, the composition of systemic (femur) BMNs was unaffected by tumor implantation.
To definitively demonstrate neutrophil chemotaxis from skull to tumor, dual bregma/lambda skull bone flaps were harvested from donor mice, labeled with CMFDA, and transplanted onto BGL1-bearing Balb/CJ mice for 72h (Fig. S6B–C). Flow cytometric characterization of the resultant tumors universally (n=3) demonstrated infiltration by fluorescent, i.e. skull-derived, neutrophils (Fig. 6C). These skull-derived TANs (S-TANs) were more immature than the overlying skull BM in non-transplanted tumor-bearing controls (85.4% vs 44.2%, P=0.003; Fig. 6D), again suggesting preferential immature neutrophil recruitment. Moreover, while BMNs in the overlying skull marrow did not appreciably express MHCII, S-TANs were robustly MHCII-positive (0.9% vs 25.9%, P=0.02; Fig. 6E), reinforcing a chronological sequence wherein immature skull BMNs transit to the GBM TME, then develop into hybrids.
In fact, hybrid TANs were enriched among S-TANs than among other TANs (25.9% vs 18.8%, P=0.01; Fig. S6D), in line with our supposition that immature BMNs – enriched in this population – become APCs. To then clarify the extent to which S-TANs transform into hybrids longitudinally, we transplanted GFP+ skull flaps from UBC-GFP mice onto C57BL/6J mice immediately before GL261 glioma implantation; since GFP+ cells are durably fluorescent, we could then characterize S-TANs at tumor endpoint (3 weeks). While the transplanted flaps had limited viability and were extensively repopulated by GFP− cells from adjacent marrow (Fig. S6E), we nonetheless observed infiltration by GFP+ neutrophils (n=3 mice; Fig. S6F). These S-TANs were again more immature than skull BM (80.0% vs 36.7%, P=0.005). Critically, almost all (83.2%) S-TANs were MHCII+ (Fig. 6F), suggesting that S-TANs were largely fated to become long-lived hybrid TANs.
To determine if this preferential polarizability meant that S-TANs are the primary source of hybrid TANs in GBM, we implanted GL261 gliomas in C57BL/6J mice with entirely GFP+ skull marrows; these mice were generated through lethal skull irradiation and subsequent adoptive transfer of UBC-GFP BM. At endpoint, 26.1% (95% CI: ±9.2%) of TANs were GFP+ (skull-derived). These S-TANs comprised the majority (82.1%) of hybrid neutrophils, and only 22.2% of canonical TANs (P=0.001; Fig. 6G), indicating that the skull contributed most APC TANs. Accordingly, FACS-sorted GFP+ S-TANs exhibited greater dendricity, as proxied by lower circularity (form factor: 0.68 vs 0.71, P=0.002) and larger area (851.3 vs 464.8 pixels, P<0.001; Fig. S6G).
Of note, in both skull transplant models (Balb/CJ-CMFDA, C57BL/6J-GFP), the skull also contributed macrophages [Lin−CD11b+Gr1+CD115+F4/80+] to the TME (Fig. S6H), which – like TANs – were preferentially MHCIIhi/M1-like compared to other TAMs (Balb/CJ: 21.5% vs 7.7%, P=0.036; C57BL/6J: 30.6% vs 9.4%, P=0.019). Thus, our findings implicated skull BM as a potential driver of CD4+ T cell responses through its multimodal supply of antigen-presenting myeloid cells to the GBM TME.
Modulating skull marrow egress alters hybrid TAN Infiltration and survival In GBM-bearing mice.
To determine whether these skull-derived immune cells bore antitumoral relevance, as suggested by their inflammatory polarization, we selectively ablated skull marrow through cranial irradiation of body-shielded C57BL/6J mice 24h prior to GL261 glioma implantation. Ablation was durable, with minimal repopulation (average: 8.6% repopulation per week; Fig. S7A) and no appreciable off-target effects on brain-resident microglia (P=0.7; Fig. S7B). Conversely, to determine whether promoting skull marrow cell egress into GBM could be therapeutic, some non-irradiated mice were treated 9d after GBM implantation with intracalvarial AMD3100, which induces myeloid cell emigration from skull marrow through CXCR4 blockade.48
Compared to controls, median survival was 22.7% shorter in skull-irradiated mice (P<0.001) and 20.5% longer in AMD3100-treated mice (P=0.006), suggesting that altering the skull marrow-mediated antitumoral response had direct prognostic effects (Fig. 7A). Accordingly, tumor growth was accelerated in skull-irradiated mice and attenuated in the AMD3100-treated group, with skull-irradiated tumors 10.8-fold larger at day 15 than controls (P<0.001), which were in turn 7.7-fold larger than AMD3100-treated tumors (P=0.002) (Fig. 7A). These findings were confirmed in another C57BL/6J tumor model (SB28; Fig. S7C).
Figure 7. Altering the release of skull marrow precursors impacts the tumor immune profile and survival of GBM-bearing mice.

GL261-bearing C57BL/6J mice received either 13 Gy skull irradiation (n=11) pre-implantation, 10 μg of intracalvarial AMD3100 at POD9 (n=4; dashed line), or no treatment (controls, n=9)
(A) Kaplan-Meier survival (Pirrad<0.001, PAMD3100=0.006) and tumor growth (BLI) (Pirrad<0.001 at POD15-18, PAMD3100=0.002), with comparisons relative to controls. Significance for BLI comparisons was calculated by unpaired two-tailed Student’s t-test with Bonferroni correction for multiple comparisons.
(B) Flow cytometric quantification of immune populations as a proportion of endpoint tumor cellularity. Total immune cells (Pcontrol<0.001, PAMD3100<0.001), T cells (Pcontrol=0.025, PAMD3100=0.096), cDCs (Pcontrol=0.038, PAMD3100<0.001), and macrophages (Pcontrol<0.001, PAMD3100=0.003) were decreased in skull-irradiated mice. cDCs were enriched in AMD3100-treated mice (Pcontrol<0.001).
(C) MHCII expression among tumor-infiltrating myeloid cells, enriched in control (P=0.013) and AMD3100-treated mice (P=0.034), compared to skull-irradiated.
(D) Left: Hybrid TAN polarization, greater in controls (P<0.001) than skull-irradiated, and further in AMD3100 (Pvs irrad<0.001, Pvs control<0.001). Data combined over two experiments (n1=3-11 mice/group; n2=6-8 mice/group). Right: Pearson correlation of overall survival and hybrid TAN polarization.
(E) Contribution of neutrophil subsets to endpoint tumors, with hybrid contribution reduced in skull-irradiated mice (Pcontrol=0.019; PAMD3100=0.022) and canonical contribution enriched (Pcontrol=0.005, PAMD3100=0.011).
(F) Pearson correlation of endpoint tumor necrosis and canonical TAN infiltration.
(G) Quantification and representative contour plots of myeloid precursor (CD11blo/hicKithi) infiltration in endpoint tumors. Precursor infiltration is greater in AMD3100-treated mice compared to skull-irradiated (P<0.001) and controls (P<0.001).
(H) Memory T cell subsets in endpoint tumors; Tn=naïve, Tem=effector mem., Tcm=central mem. Asterisks indicate differences vs. controls. Data combined over two experiments (n1=3-11 mice/group; n2=6-8 mice/group). αLy6G administration at time of AMD3100 treatment abrogates its effect on Tn diminution (P=0.007) and Tem expansion (P=0.027).
(I-K) CD8+ T cell-related phenotypes in endpoint tumors with AMD3100 treatment, compared to controls. Effects are abrogated by αLy6G administration at time of treatment.
I: CD8+ T cell activation, proxied by a reduction in CD8 MFI, is enhanced with treatment (left; Pcontrol=0.001, Pirrad<0.001). CD8 MFI correlates with CD4+ memory polarization (right).
J: Th1 (CXCR3+IFNγ+) proportion of tumor-infiltrating CD4+ T cells, enriched with treatment (P<0.001).
K: T cell distribution, with fewer CD4+ (P<0.001) and greater CD8+ (P=0.046) in treated tumors.
Data represented as means ± SD, except for BLI (mean ± SEM). POD=post-operative day. *P<0.05, **P<0.01, ***P<0.001. For Pearson correlations (panels D, F, I), dots are colored by experimental group and significance was calculated by least squares linear regression. Significance for survival comparisons was calculated by log-rank (Mantel-Cox) test. Significance for group mean comparisons was calculated by one-way ANOVA with post-hoc Tukey contrasts. See also Fig S7.
To delineate the cell populations underlying these differences, endpoint tumors were profiled. On average, overall immune infiltration was 62.7% lower in skull-irradiated mice than controls (18.7% vs 50.0% of tumor cellularity, P<0.001; Fig. 7B), suggesting that calvarial contribution to the GBM TME was robust and that systemic marrow sites could not compensate for its loss. Specifically, this reduced immune infiltration was attributable to macrophages, DCs, and T cells, reinforcing the meaningful contribution of calvarial marrow to antigen presentation. Indeed, MHCII expression among myeloid cells was reduced in skull-irradiated tumors (CD11b+ cells: 61.7% vs 86.0%, P=0.013; TANs: 3.7% vs 17.0%, P<0.001; Fig. 7C–D), and the extent of this dendritic polarization among TANs trended linearly with survival (R2=0.7636, P<0.001; Fig. 7D). Interestingly, the antitumoral role of skull-derived myeloid cells (SDMCs) was not solely restricted to their interfacing with T cells as APCs, as in the setting of T cell depletion, skull-irradiated mice still grew larger tumors and succumbed sooner to disease (16 vs 21d, P<0.001; Fig. S7D); thus, SDMCs may also act as first-responders to the tumor insult.
Conversely, despite their general paucity of immune cells, skull-irradiated tumors were so skewed towards non-hybrid polarization that canonical TANs were enriched in these tumors (0.52% vs 0.29%, P=0.005; Fig. 7E), unlike other immune subsets. This cytotoxic TAN profile coincided with 4.5-fold greater tumor necrosis than in controls (60.7% vs. 13.5% dead cells, P<0.001), the extent of which correlated with canonical TAN accumulation (R2=0.7002, P<0.001; Fig. 7F). These data corroborated reports of TAN-mediated ferroptosis in GBM, suggesting that while S-TANs promote a regulated adaptive immune response, systemically-derived neutrophils instead yield pathologic necrosis.49
AMD3100-mobilized TANs stimulate an antitumoral Th1-type response.
Not only did intracalvarial AMD3100 prolong survival in a manner that correlated with hybrid TAN polarization, but strikingly, treatment temporarily reversed tumor growth in the GL261 model, causing a 53.4% size reduction 6 days post-treatment (P<0.01; Fig. 7A). As confirmation that this agent mobilized immature marrow cells, CD11b+cKithi myeloid precursors were enriched in AMD3100-treated GBMs (0.25% vs 0.02% of tumor, P<0.001; Fig. 7G). Downstream, we again observed a link between this immaturity and hybrid transformation, as AMD3100-treated tumors were more polarized towards hybrid TANs than controls (27.1% vs 17.0% of TANs, P<0.001; Fig. 7D). The only other enriched downstream population was DCs (14.7% vs 4.5%, P<0.001; Fig. 7B), particularly cDC2s, which – like hybrid TANs – derive from circulating progenitors that were likely further mobilized by AMD310050–52 (Fig. S7E). Given this possible confounding, we depleted mice of neutrophils at the time of AMD3100 administration (Fig. S7F) to delineate the necessity of mobilized BMNs. Indeed, treatment in this setting no longer prolonged survival (21.5d vs 20.0d, P=0.1202; Fig. S7G–H).
Next, to gauge whether AMD3100-mobilized APCs stimulated T cells, we assessed effector and memory cell subsets,53 finding that treated tumors had greater CD4+ activation than controls – i.e., greater effector memory polarization (Tem; 92.9% vs 63.0%, P<0.001) and fewer naïve cells (Tn; 3.7% vs 31.3%, P<0.001; Fig. 7H). T cell activation was required for AMD3100 to exert its antitumoral effect, as tumor growth and survival benefits were lost in the setting of T cell depletion (Fig. S7D).
Though this memory differentiation was not observed among CD8+ T cells, downregulation of the CD8 coreceptor – indicating early activation54 – was pronounced in treated mice (MFI: 1202 vs 3376, P=0.001; Fig. 7I). This downregulation correlated with the size of the CD4+ memory pool (R2=0.7275, P<0.001), suggesting the latter’s polarization into CTL-stimulatory Th1 cells. Indeed, both Th1 (IFNγ+CXCR3+) and CD8+ T cells were enriched in AMD3100-treated tumors (Th1: 16.9% vs 7.6% of CD4+, P<0.001; CD8+: 63% vs 51.3%, P=0.046; Fig. 7J–K). These effects were abrogated in neutrophil-depleted mice (6.4% vs 7.6%, P=0.5), suggesting that AMD3100-mobilized TANs critically promote an antitumoral CTL response.
Thus, intracalvarial AMD3100 prolonged survival in GBM-bearing mice by liberating skull marrow myeloid precursors into the tumor, where they differentiated into APCs, including hybrid TANs, and effected an antitumoral T cell response.
DISCUSSION
Tumors, which were once perceived as homogenous cell masses, are now recognized as reliant on interactions between tumor cells and their microenvironment. Of these interactions, those with TANs are among the least well-understood in GBM. While early studies suggested that TANs were bystanders, either circulating intravascularly or passively accumulating without actual function because it seemed unlikely that such short-lived cells could meaningfully modulate cancer, our study refuted these assumptions. First, we found that the tumor secretome prolonged neutrophil viability. Second, some TANs had a distinct PBN-independent lineage, arising instead from immature precursors in the skull marrow. Third, these GBM TANs function as APCs, driving an anti-tumoral immune response in the presence of T cells.
APC-like hybrid neutrophils have been described in early-stage lung cancer.5 That finding and our work build upon reports demonstrating that neutrophils can present antigens under inflammatory conditions,15 upregulating MHCII subunits and co-stimulatory molecules.55 Critically, we contextualize this property in vivo, made possible by our utilization of a syngeneic Balb/CJ model. Unlike prior studies of αLy6G-mediated neutrophil depletion, which employ short depletion intervals in C57BL/6 mice,17,56–60 our choice of a murine strain with higher sensitivity to ablation16 enabled us to evaluate TANs longitudinally, highlighting the antitumoral role of early-infiltrative, hybrid-predisposed TANs.5,17 In fact, TAN polarization into APCs was indispensable to this tumor suppression, as when we eliminated hybrid precursors through skull irradiation, residual canonical TANs instead promoted prognostically unfavorable necrosis.
Our identification of APC TANs has different implications in GBM than in other cancers because GBM is notoriously T cell-depleted. While neutrophil depletion accelerated tumor growth in immunocompetent mice, the opposite occurred in T cell-depleted mice. These findings are likely because, while hybrid TANs act as APCs in T cell-enriched tumors, their stimulatory effect on GSCs predominates in T cell-impoverished contexts. Further work is needed to determine how these findings translate in GBM patients who have fewer and functionally impaired T cells than healthy adults.7,61 Moreover, consistent with these contrasting phenotypes, the survival differences we found were often subtle, suggesting that modulating TANs in isolation may not effect meaningful responses in patients. Nonetheless, our demonstration that hybrid TANs can stimulate autologous T cell activation in an MHCII-dependent manner suggests that therapeutic strategies enhancing these interactions are worth exploring.
We also performed scRNA-seq of purified TANs, building upon studies which sequenced entire tumors to understand TAN heterogeneity.62,63 By modifying the standard protocol, we generated abundant high-quality transcriptomic reads despite the fragility and low transcriptomic density of neutrophils, enabling us to interrogate TAN heterogeneity unobscured by interpatient variability. Our analysis demonstrated that, while TANs ranged phenotypically from canonical to APC-like, this polarization was not concordant with N1/N2 or classical/MDSC models, corroborating evolving efforts to replace the idea of an MDSC monolith with one that embraces myeloid plasticity.64,65 Indeed, rather than an individual immunosuppressive TAN cluster,66 we observed that pro-/anti-tumoral properties characterize a single noncanonical population, the net effect of which depends on T cell co-infiltration.
MDSC nomenclature notwithstanding, our analysis supports the idea that immature myeloid cells – a traditionally defining feature of MDSCs – accumulate intratumorally. Through robust capture of diverse cell states, we elaborated upon this concept, demonstrating via trajectory analysis that these precursors are not a static endpoint but instead polarize into other populations – including hybrid TANs. While the role of MHCII+ myeloid cells broadly in inducing T cell cytotoxicity is established,67 prior studies have dichotomized their origin into local and peripherally-derived. By contrast, our work defines skull marrow-derived cells as a third distinct lineage of GBM APCs.
This finding represents an oncological perspective to an expanding body of literature surrounding brain border immunological surveillance, recently invigorated by the discovery that calvarial BM cells traverse the inner table of the skull through vascular channels.47 These studies have demonstrated myeloid and B cell trafficking to inflamed (e.g., stroke, meningitis, TBI) and homeostatic brain tissue.47,48,68 Our work builds upon this by demonstrating that the skull contributes myeloid cells to GBM capable of antigen presentation and T cell activation. The greater ability of skull marrow-derived cells to elicit a cytolytic response against GBM compared to systemic BM could reflect an ability of the calvarial-meningeal path of immune cell development to provide the CNS with a constant supply of immune cells educated by CNS antigens.69
These properties provided compelling evidence that mobilizing skull-derived progenitors could suppress tumor growth, to which end we pursued intracalvarial administration of AMD3100. This strategy builds upon previous work showing that the skull is permeable to small-molecular-weight compounds that can affect meningeal immune cells after TBI.70 While others have leveraged this compound as a mechanistic assay, we present a therapeutic application and justify the testing of treatments that exploit this administration route. Importantly, the efficacy of this agent is contingent on SDMC migration and T cell stimulation by hybrid TANs, phenomena which we demonstrate thoroughly in preclinical murine models but which may not reflect patient biology. Should further studies validate these findings, however, this strategy should be readily implementable clinically.
STAR METHODS
Resource Availability.
Lead contact.
Further information and requests for resources and reagents should be directed to and will be fulfilled by the lead contact, Manish K. Aghi (manish.aghi@ucsf.edu)
Materials availability.
This study did not generate new unique reagents.
Data and code availability.
Deidentified human patient single-cell RNA-seq data reported in this study have been deposited at GEO and accession numbers are listed in the key resources table. They are publicly available as of the publication date. Summary statistics describing these data have been deposited at GEO and are publicly available as of the publication date.
All original code has been uploaded to FigShare and is publicly available as of the date of publication. DOIs are listed in the key resources table.
Any additional information required to reanalyze the data in this paper is available from the lead contact upon request.
Key resources table
| REAGENT or RESOURCE | SOURCE | IDENTIFIER |
|---|---|---|
| Antibodies | ||
| Anti-human CD10 FITC (clone HI10a) | Biolegend | Cat#312207 RRID:AB_314918 |
| Anti-human CD101 PE (clone BB27) | Biolegend | Cat#331011 RRID:AB_2716106 |
| Anti-human CD11c PE (clone 3.9) | Biolegend | Cat#301605 RRID:AB_314175 |
| Anti-human CD14 APC (clone M5E2) | Biolegend | Cat#301807 RRID:AB_314189 |
| Anti-human CD14 BV785 (clone M5E2) | Biolegend | Cat#301839 RRID:AB_2561366 |
| Anti-human CD15 BV605 (clone W6D3) | Biolegend | Cat#323031 RRID:AB_2562131 |
| Anti-human CD15 BV650 (clone W6D3) | Biolegend | Cat#323033 RRID:AB_2562499 |
| Anti-human CD16 APC (clone 3G8) | Biolegend | Cat#302011 RRID:AB_314211 |
| Anti-human CD16 APC/Cy7 (clone 3G8) | Biolegend | Cat#302017 RRID:AB_314217 |
| Anti-human CD19 APC (clone HIB19) | Biolegend | Cat#302211 RRID:AB_314241 |
| Anti-human CD206 Alexa Fluor 700 (clone 15-2) | Biolegend | Cat#321131 RRID:AB_2616868 |
| Anti-human CD25 APC/Fire 810 (clone M-A251) | Biolegend | Cat#356149 RRID:AB_2876679 |
| Anti-human CD25 PE/Dazzle 594 (clone M-A251) | Biolegend | Cat#356125 RRID:AB_2563561 |
| Anti-human CD3 BV421 (clone UCHT1) | Biolegend | Cat#300433 RRID:AB_10897105 |
| Anti-human CD31 (polyclonal) | Abcam | Cat#ab28364 RRID:AB_726362 |
| Anti-human CD4 BV711 (clone OKT4) | Biolegend | Cat#317439 RRID:AB_11219404 |
| Anti-human CD4 PE/Fire 700 (clone SK3) | Biolegend | Cat#344665 RRID:AB_2876651 |
| Anti-human CD45 APC/Cy7 (clone 2D1) | Biolegend | Cat#368515 RRID:AB_2566375 |
| Anti-human CD45 BV711 (clone HI30) | Biolegend | Cat#304049 RRID:AB_2563465 |
| Anti-human CD49d PerCP/Cy5.5 (clone 9F10) | Biolegend | Cat#304311 RRID:AB_10640735 |
| Anti-human CD56 APC (clone HCD56) | Biolegend | Cat#318309 RRID:AB_604098 |
| Anti-human CD56 PE/Fire 700 (clone QA17A16) | Biolegend | Cat#392427 RRID:AB_2876708 |
| Anti-human CD66b BV421 (clone 6/40c) | Biolegend | Cat#392915 RRID:AB_2888722 |
| Anti-human CD69 BV785 (clone FN50) | Biolegend | Cat#310931 RRID:AB_2561370 |
| Anti-human CD8 APC (clone SK1) | Biolegend | Cat#980904 RRID:AB_2616624 |
| Anti-human CD8 PE/Cy7 (clone SK1) | Biolegend | Cat#344711 RRID:AB_2044007 |
| Anti-human CD8 PE/Dazzle 594 (clone SK1) | Biolegend | Cat#344743 RRID:AB_2566514 |
| Anti-human Fc (clone Fc1) | BD Biosciences | Cat#564219 RRID:AB_2728082 |
| Anti-human GM-CSF (clone BVD2-23B6) | Biolegend | Cat#502201 RRID:AB_315211 |
| Anti-human HLA-DR/DP/DQ (clone Tü39) | Biolegend | Cat#361702 RRID:AB_2563139 |
| Anti-human HLA-DR/DP/DQ APC/Fire 750 (clone Tü39) | Biolegend | Cat#361711 RRID:AB_2750313 |
| Anti-human HLA-DR/DP/DQ FITC (clone Tü39) | Biolegend | Cat#361705 RRID:AB_2563191 |
| Anti-human HLA-DR/DP/DQ PE/Cy7 (clone Tü39) | Biolegend | Cat#361707 RRID:AB_2564278 |
| Anti-human myeloperoxidase (clone 2C7) | Abcam | Cat#ab25989 RRID:AB_448948 |
| Anti-human Nestin (clone 10C2) | Abcam | Cat#ab22035 RRID:AB_446723 |
| Anti-human OPN (polyclonal) | R&D Systems | Cat#AF1433 RRID:AB_354791 |
| Anti-human Siglec8 APC (clone 7C9) | Biolegend | Cat#347105 RRID:AB_2561401 |
| Anti-mouse CD105 (MJ7/18) Alexa Fluor 488 | Biolegend | Cat#120405 RRID:AB_961056 |
| Anti-mouse CD106 (429) Alexa Fluor 488 | Biolegend | Cat#105710 RRID:AB_493427 |
| Anti-mouse CD11c BV605 (clone N418) | Biolegend | Cat#117333 RRID:AB_11204262 |
| Anti-mouse CD11c PE/Cy7 (clone N418) | Biolegend | Cat#117317 RRID:AB_493569 |
| Anti-mouse CD133 (315-2C11) PE/Dazzle 594 | Biolegend | Cat#141211 RRID:AB_2566009 |
| Anti-mouse CD133 APC (clone 315-2C11) | Biolegend | Cat#141207 RRID:AB_10898121 |
| Anti-mouse CD140a (APA5) PE/Cy7 | Biolegend | Cat#135911 RRID:AB_2715973 |
| Anti-mouse CD140b (APB5) APC | Biolegend | Cat#136007 RRID:AB_2043971 |
| Anti-mouse CD16/32 (clone 2.4G2) | BD Biosciences | Cat#553142 RRID:AB_394657 |
| Anti-mouse CD16/32 BV421 (clone 190909) | BD Biosciences | Cat#747952 RRID:AB_2872413 |
| Anti-mouse CD183 (CXCR3) (CXCR3-173) | Biolegend | Cat#126554 RRID:AB_2832456 |
| Anti-mouse CD206 APC (clone C068C2) | Biolegend | Cat#141707 RRID:AB_10896057 |
| Anti-mouse CD206 PE/Cy7 (clone C068C2) | Biolegend | Cat#141719 RRID:AB_2562247 |
| Anti-mouse CD25 APC/Cy7 (clone 3C7) | Biolegend | Cat#101917 RRID:AB_2650981 |
| Anti-mouse CD3 APC (clone 17A2) | Biolegend | Cat#100235 RRID:AB_2561455 |
| Anti-mouse CD3 PE (clone 17A2) | Biolegend | Cat#100205 RRID:AB_312662 |
| Anti-mouse CD31 (390) BV421 | Biolegend | Cat#102423 RRID:AB_2562186 |
| Anti-mouse CD326 (EpCAM) (G8.8) BV650 | Biolegend | Cat#118241 RRID:AB_2876432 |
| Anti-mouse CD4 BV421 (clone GK1.5) | Biolegend | Cat#100437 RRID:AB_10900241 |
| Anti-mouse CD4 BV605 (clone GK1.5) | Biolegend | Cat#100451 RRID:AB_2564591 |
| Anti-mouse CD45 (30-F11) BV510 | Biolegend | Cat#103137 RRID:AB_2561392 |
| Anti-mouse CD45 Alexa Fluor 488 (clone 30-F11) | Biolegend | Cat#103121 RRID:AB_493532 |
| Anti-mouse CD45 Alexa Fluor 700 (clone 30-F11) | Biolegend | Cat#103127 RRID:AB_493714 |
| Anti-mouse CD45 APC/Cy7 (clone 30-F11) | Biolegend | Cat#103115 RRID:AB_312980 |
| Anti-mouse CD45 FITC (clone I3/2.3) | Biolegend | Cat#147709 RRID:AB_2563541 |
| Anti-mouse CD45 PerCP/Cy5.5 (clone 30-F11) | Biolegend | Cat#103131 RRID:AB_893344 |
| Anti-mouse CD62L Alexa Fluor 488 (clone MEL-14) | Biolegend | Cat#104419 RRID:AB_493377 |
| Anti-mouse CD62L PE/Cy7 (clone MEL-14) | Biolegend | Cat#104417 RRID:AB_313102 |
| Anti-mouse CD69 APC (clone H1.2F3) | Biolegend | Cat#104513 RRID:AB_492844 |
| Anti-mouse CD69 PE/Cy7 (clone H1.2F3) | Biolegend | Cat#104511 RRID:AB_493565 |
| Anti-mouse CD8a BV711 (clone 53-6.7) | Biolegend | Cat#100747 RRID:AB_11219594 |
| Anti-mouse CD8a PE (clone 53-6.7) | Biolegend | Cat#100707 RRID:AB_312746 |
| Anti-mouse CD8a PE/Cy7 (clone 53-6.7) | Biolegend | Cat#100721 RRID:AB_312760 |
| Anti-mouse CD90.2 APC (clone 30-H12) | Biolegend | Cat#105311 RRID:AB_313182 |
| Anti-mouse CD90.2 APC/Cy7 (clone 30-H12) | Biolegend | Cat#105327 RRID:AB_10613280 |
| Anti-mouse c-Kit Alexa Fluor 488 (clone 2B8) | Biolegend | Cat#105815 RRID:AB_493473 |
| Anti-mouse c-Kit PE (clone 2B8) | Biolegend | Cat#105807 RRID:AB_313216 |
| Anti-mouse c-Kit PE/Dazzle 594 (clone 2B8) | Biolegend | Cat#105833 RRID:AB_2564054 |
| Anti-mouse CSF1R APC/Cy7 (clone AFS98) | Biolegend | Cat#135531 RRID:AB_2632739 |
| Anti-mouse CSF1R BV605 (clone AFS98) | Biolegend | Cat#135517 RRID:AB_2562760 |
| Anti-mouse CSF1R PE (clone AFS98) | Biolegend | Cat#135505 RRID:AB_1937254 |
| Anti-mouse CSF1R PE/Cy7 (clone AFS98) | Biolegend | Cat#135523 RRID:AB_2566459 |
| Anti-mouse CSF1R PE/Dazzle 594 (clone AFS98) | Biolegend | Cat#135527 RRID:AB_2566522 |
| Anti-mouse CX3CR1 Alexa Fluor 647 (clone SA011F11) | Biolegend | Cat#848003 RRID:AB_2721644 |
| Anti-mouse CX3CR1 BV711 (clone SA011F11) | Biolegend | Cat#149031 RRID:AB_2565939 |
| Anti-mouse CXCR2 BV421 (clone V48-2310) | BD Biosciences | Cat#566622 RRID:AB_2864336 |
| Anti-mouse CXCR2 BV605 (clone V48-2310) | BD Biosciences | Cat#747814 RRID:AB_2872278 |
| Anti-mouse CXCR2 PE (clone SA044G4) | Biolegend | Cat#149303 RRID:AB_2565691 |
| Anti-mouse CXCR2 PerCP/Cy5.5 (clone SA044G4) | Biolegend | Cat#149307 RRID:AB_2565695 |
| Anti-mouse F4/80 BV650 (clone BM8) | Biolegend | Cat#123149 RRID:AB_2564589 |
| Anti-mouse GM-CSF (MP1-22E9) | Biolegend | Cat#505415 RRID:AB_2810635 |
| Anti-mouse Gr-1 Alexa Fluor 488 (clone RB6-8C5) | Biolegend | Cat#108419 RRID:AB_493480 |
| Anti-mouse Gr-1 Alexa Fluor 700 (clone RB6-8C5) | Biolegend | Cat#108421 RRID:AB_493728 |
| Anti-mouse Gr-1 PE (clone RB6-8C5) | Biolegend | Cat#108407 RRID:AB_313372 |
| Anti-mouse Gr-1 PE/Dazzle 594 (clone RB6-8C5) | Biolegend | Cat#108451 RRID:AB_2564248 |
| Anti-mouse Gr-1 PerCP/Cy5.5 (clone RB6-8C5) | Biolegend | Cat#108427 RRID:AB_893561 |
| Anti-mouse HLA-IA/E AF488 (clone M5/114.15.2) | Biolegend | Cat#107615 RRID:AB_493524 |
| Anti-mouse HLA-IA/E BV785 (clone M5/114.15.2) | Biolegend | Cat#107645 RRID:AB_2565977 |
| Anti-mouse HLA-IA/E PE (clone M5/114.15.2) | Biolegend | Cat#107607 RRID:AB_313322 |
| Anti-mouse IFN-γ (XMG1.2) | Biolegend | Cat#505833 RRID:AB_11147371 |
| Anti-mouse IFN-γ BV421 (clone XMG1.2) | Biolegend | Cat#505829 RRID:AB_10897937 |
| Anti-mouse IL-10 (1B1.3a) | Biolegend | Cat#504907 RRID:AB_2810629 |
| Anti-mouse IL-12/IL-23 p40 (C17.8) | Biolegend | Cat#505307 RRID:AB_11150770 |
| Anti-mouse IL21 (S20017B) | Biolegend | Cat#122202 RRID:AB_2941414 |
| Anti-mouse Ly6A/E (Sca1) (D7) BV785 | Biolegend | Cat#108139 RRID:AB_2565957 |
| Anti-mouse Ly6C APC (clone HK1.4) | Biolegend | Cat#128015 RRID:AB_1732087 |
| Anti-mouse Ly6G BV421 (clone 1A8) | Biolegend | Cat#127627 RRID:AB_10897944 |
| Anti-mouse Ly6G PE/Dazzle 594 (clone 1A8) | Biolegend | Cat#127647 RRID:AB_2566318 |
| Anti-mouse Ly6G PerCP/Cy5.5 (clone 1A8) | Biolegend | Cat#127615 RRID:AB_1877272 |
| Anti-mouse NK1.1 APC (clone S17016D) | Biolegend | Cat#156505 RRID:AB_2876525 |
| Anti-mouse NK1.1 APC/Cy7 (clone S17016D) | Biolegend | Cat#156509 RRID:AB_2876527 |
| Anti-mouse P2RY12 PE (clone S16007D) | Biolegend | Cat#848003 RRID:AB_2721644 |
| Anti-mouse Podoplanin (8.1.1) PerCP/Cy5.5 | Biolegend | Cat#127421 RRID:AB_2814015 |
| Anti-mouse SiglecF APC (clone S17007L) | Biolegend | Cat#155507 RRID:AB_2750236 |
| Anti-mouse SiglecF APC/Cy7 (clone S17007L) | Biolegend | Cat#155531 RRID:AB_2904295 |
| Anti-mouse SOX2 PE (clone 14A6A34) | Biolegend | Cat#656103 RRID:AB_2562852 |
| Anti-mouse/human B220 APC (clone RA3-6B2) | Biolegend | Cat#103211 RRID:AB_312996 |
| Anti-mouse/human B220 APC/Cy7 (clone RA3-6B2) | Biolegend | Cat#103223 RRID:AB_313006 |
| Anti-mouse/human CD11b APC (M1/70) | Biolegend | Cat#101211 RRID:AB_2044007 |
| Anti-mouse/human CD11b APC/Cy7 (clone M1/70) | Biolegend | Cat#101225 RRID:AB_830641 |
| Anti-mouse/human CD11b BV421 (clone M1/70) | Biolegend | Cat#101235 RRID:AB_10897942 |
| Anti-mouse/human CD11b FITC (clone M1/70) | Biolegend | Cat#101205 RRID:AB_312788 |
| Anti-mouse/human CD11b PE (clone M1/70) | Biolegend | Cat#101207 RRID:AB_312790 |
| Anti-mouse/human CD44 Alexa Fluor 488 (clone IM7) | Biolegend | Cat#103015 RRID:AB_493678 |
| Anti-mouse/human CD44 APC (clone IM7) | Biolegend | Cat#103011 RRID:AB_312962 |
| Anti-mouse/human CD44 BV785 (clone IM7) | Biolegend | Cat#103041 RRID:AB_11218802 |
| Donkey anti-Rabbit IgG (H+L) Highly Cross-Adsorbed Secondary Antibody, Alexa Fluor 555 | Thermo Fisher Invitrogen | Cat#A31572 RRID:AB_162543 |
| Goat anti-Mouse IgG (H+L) Superclonal Secondary Antibody, Alexa Fluor 488 | Thermo Fisher Invitrogen | Cat#A28175 RRID:AB_2536161 |
| InVivoMAb anti-mouse CD4 (clone GK1.5) | BioXCell | Cat#BE0003-1 RRID:AB_1107636 |
| InVivoMAb anti-mouse CD8α (clone 53-6.7) | BioXCell | Cat#BE0004-1 RRID:AB_1107671 |
| InVivoMAb anti-mouse CD90.2 (Thy1.2) (clone 30H12) | BioXCell | Cat#BE0066 RRID:AB_1107682 |
| InVivoMAb anti-mouse Ly6G (clone 1A8) | BioXCell | Cat#BE0075-1 RRID:AB_1107721 |
| InVivoMAb rat IgG2a isotype control, anti-trinitrophenol (clone 2A3) | BioXCell | Cat#BE0089 RRID:AB_1107769 |
| InVivoMAb rat IgG2b isotype control, anti-keyhole limpet hemocyanin (clone LTF-2) | BioXCell | Cat#BE0090 RRID:AB_1107780 |
| Isotype, mouse IgG2a κ (clone MOPC-173) | Biolegend | Cat#400202 RRID:AB_2927399 |
| Isotype, normal goat IgG (polyclonal) | R&D Systems | Cat#AB-108-C RRID:AB_354267 |
| Isotype, rat IgG2a κ (clone RTK2758) | Biolegend | Cat#400501 RRID:AB_326523 |
| Biological samples | ||
| Human: Fresh GBM tissue from time of initial resection | UCSF Brain Tumor Center | N/A |
| Human: Patient and control blood | UCSF Brain Tumor Center | N/A |
| Chemicals, peptides, and recombinant proteins | ||
| Accutase Cell Detachment Reagent | Innovative Cell Technologies | Cat#AT104 |
| Alloxate™ (Meloxicam) Solution for Injection 10 ml | Patterson Veterinary Supply | Cat#078931368 |
| AMD3100 octahydrochloride, CXCR4 antagonist | Abcam | Cat#ab120718 CAS: 155148-31-5 |
| Animal-Free Recombinant Human EGF | Peprotech | Cat#AF-100-15 |
| Apotracker™ Green | Biolegend | Cat#427401 |
| Bovine Serum Albumin, heat shock fraction, protease free, low endotoxin, suitable for cell culture, pH 7, ≥98% | Sigma-Aldrich | Cat#A4919 CAS: 9048-46-8 |
| Bupivacaine 0.255, 10ml vials | Patterson Veterinary Supply | Cat#078904881 |
| Buprenex buprenorphine HCL, 0.3 mg/mL | Patterson Veterinary Supply | Cat#078502280 |
| Dimethyl sulfoxide ACS reagent, >=99.9% | Sigma-Aldrich | Cat#472301 CAS: 67-68-5 |
| D-Luciferin, Potassium Salt | Gold Biotechnology | Cat#LUCK-2G CAS: 115144-35-9 |
| DNase 1 100MG | Worthington Biochemical Corporation | Cat#LS002007 |
| Epredia™ Cytoseal™ Mountant 60 | Fisher Scientific | Cat#83104 |
| Gem21 NeuroPlex™ Supplement without Vitamin A | GeminiBio | Cat#400-161-010 |
| Gibco 2-Mercaptoethanol | Thermo Fisher | Cat#21985023 |
| Gibco ACK Lysing Buffer | Thermo Fisher | Cat#A1049201 |
| Gibco Collagenase, Type IV, powder | Thermo Fisher | Cat#17104019 |
| Gibco DMEM, high glucose, no glutamine | Thermo Fisher | Cat#11960044 |
| Gibco DMEM/F-12 | Thermo Fisher | Cat#11320033 |
| Gibco DPBS, no calcium, no magnesium | Thermo Fisher | Cat#14190144 |
| Gibco GlutaMAX™ Supplement | Thermo Fisher | Cat#35050061 |
| Gibco HEPES (1M) | Thermo Fisher | Cat#15630130 |
| Gibco Hibernate™-A Medium | Thermo Fisher | Cat#A1247501 |
| Gibco MEM Non-Essential Amino Acids Solution (100X) | Thermo Fisher | Cat#11140050 |
| Gibco Penicillin-Streptomycin (10,000 U/mL) | Thermo Fisher | Cat#15140122 |
| Gibco RPMI 1640 Medium | Thermo Fisher | Cat#11875093 |
| Gibco Sodium Pyruvate (100 mM) | Thermo Fisher | Cat#11360070 |
| Gibco TrypLE™ Express Enzyme (1X), phenol red | Thermo Fisher | Cat#12605010 |
| ImmunoCult™ Human CD3/CD28 T Cell Activator | Stem Cell | Cat#10971 |
| Invitrogen CellTracker™ Green CMFDA Dye | Thermo Fisher | Cat#C2925 |
| Invitrogen DQ™ Ovalbumin | Thermo Fisher | Cat#D12053 |
| Invitrogen eBioscience™ Lipopolysaccharide (LPS) Solution (500X) | Thermo Fisher | Cat#00-4976-93 |
| Invitrogen SYTOX™ Dead Cell Stain Sampler Kit | Thermo Fisher | Cat#S34862 |
| IRDye® 800CW Streptavidin | LI-COR | Cat#926-32230 |
| Isoflurane, USP Inhalation Anesthetic | Dechra | Cat#DP7000 |
| Liquid Cyanoacrylate Glue | Avantor VWR | Cat# 470024-626 |
| Normal Goat Serum, Unconjugated, 10ml | Jackson Immuno Research Labs | Cat#005000121 |
| OVA 323-339 | InvivoGen | Cat#vac-isq |
| Recombinant Human FGF-basic (154 a.a.) | Peprotech | Cat#100-18B |
| Recombinant mouse IL-2 protein (Active) | Abcam | Cat# ab259380 |
| RICCA Chemical R9380000-500C Wright-Giemsa Stain Mixture | Genesee Scientific | Cat#72-850 CAS: 67-56-1 |
| Scrub Surgical Betadine PVP Iodine 7.5% Pump | Purdue Frederick Co | Cat#67618-151-17 |
| Seradigm Premium Grade Fetal Bovine Serum (FBS) | Avantor VWR | Cat#97068-085 |
| Sodium Chloride 0.9% Injection Preservative Free SDV | Henry Schein | Cat#1049943 |
| Southern Biotech DAPI Fluoromount-G® | Avantor VWR | DAPI Fluoromount-G® |
| Thermo Scientific Chemicals D(+)-Sucrose, 99+%, for biochemistry, DNAse, RNAse and protease free | Thermo Fisher | Cat#419762500 CAS: 57-50-1 |
| Thermo Scientific Chemicals Paraformaldehyde Solution, 4% in PBS | Thermo Fisher | Cat#J19943.K2 |
| Triton™ X-100 | Sigma-Aldrich | Cat#T8787 CAS: 9036-19-5 |
| Zombie Aqua™ Fixable Viability Kit | Biolegend | Cat#423101 |
| Zombie NIR™ Fixable Viability Kit | Biolegend | Cat#423105 |
| Critical commercial assays | ||
| Applied Biosystems PowerUp SYBR Green Master Mix | Thermo Fisher | Cat#A25776 |
| CFSE Cell Division Tracker Kit | Biolegend | Cat#423801 |
| Chromium Next GEM Chip G Single Cell Kit | 10X Genomics | PN-1000127 |
| Chromium Next GEM Single Cell 3’ GEM, Library & Gel Bead Kit v3.1 | 10X Genomics | PN-1000121 |
| EasySep™ Direct Human Neutrophil Isolation Kit | Stem Cell | Cat#19666 |
| EasySep™ Direct Human T Cell Isolation Kit | Stem Cell | Cat#19661 |
| Human Myeloid v2 Primers | Nanotring | Cat#115000177 |
| Human Myeloid v2 Profiling Codeset (XT_PGX_HuV2_Myeloid_CSO) | Nanotring | Cat#115000171 |
| Human Osteopontin (OPN) Quantikine ELISA Kit | R&D Systems | Cat#DOST00 |
| Invitrogen eBioscience™ Foxp3 / Transcription Factor Staining Buffer Set | Thermo Fisher | Cat#00-5523-00 |
| MojoSort™ Mouse CD4 T Cell Isolation Kit | Biolegend | Cat#480005 |
| MojoSort™ Mouse Neutrophil Isolation Kit | Biolegend | Cat#480057 |
| Mouse Tumor 360 Profiling Codeset + Primers (XT Mm Tumor Sig 360 CSO+PS) | Nanotring | Cat#115000426 |
| nCounter Sprint Cartridge | Nanostring | Cat#100078 |
| Proteome Profiler Mouse Cytokine Array Kit, Panel A | R&D Systems | Cat#ARY006 |
| Qiashredder | Qiagen | Cat#78654 |
| qScript™ XLT cDNA SuperMix | Quanta Bio | Cat#95161-500 |
| RNeasy Mini Kit | Qiagen | Cat#74104 |
| Single Index Kit T Set A | 10X Genomics | PN-1000213 |
| Deposited data | ||
| Human GBM PBN scRNAseq dataset | GEO | GSM8380727 |
| Human GBM TAN scRNAseq dataset | GEO | GSM8380728 |
| Human GBM TAN and PBN scRNAseq analysis code | FigShare | DOI: 10.6084 |
| TCGA mRNA normalized and miRNA data | Genomic Data Commons | https://gdc.cancer.gov/about-data/publications/pancanatlas |
| TCGA clinical and subtype data | Genomic Data Commons; Sanchez-Vega et al., 2018; Robertson et al., 2017 | https://gdc.cancer.gov/about-data/publications/pancanatlas |
| Experimental models: Cell lines | ||
| Human: DBTRG-05MG | ATCC | ATCC: CRL-2020 RRID:CVCL_1169 |
| Human: GBM43 | Mayo Clinic Brain Tumor Xenograft National Resource | Human: GBM43 |
| Human: GBM6 | Mayo Clinic Brain Tumor Xenograft National Resource | Human: GBM6 |
| Human: U-251MG | Sigma-Aldrich | Cat#09063001 RRID: CVCL_0021 |
| Mouse: BGL1 | Dr. Hideho Okada, UCSF Ahn et al., 2015 |
N/A |
| Mouse: GL261 | US National Cancer Institute | RRID: CVCL_Y003 |
| Mouse: SB28 | Dr. Hideho Okada, UCSF Genoud et al., 2018 |
N/A |
| Experimental models: Organisms/strains | ||
| Mouse: B6.Cg-Tg(TcraTcrb)425Cbn/J [OT-II] | The Jackson Laboratory | Stock No.: 004194 |
| Mouse: BalbC/J | The Jackson Laboratory | Stock No.: 000651 |
| Mouse: C57BL/6J | The Jackson Laboratory | Stock No.: 000664 |
| Mouse: UBC-GFP: C57BL/6-Tg(UBC-GFP)30Scha/J | Dr. Harold Chapman, Dr. Martin C Valdearcos, and Dr. Suneil Koliwad (UCSF) | N/A |
| Software and algorithms | ||
| BioRender | BioRender.com | https://www.biorender.com/ |
| cellranger | 10X Genomics | https://support.10xgenomics.com/ |
| ClusterExplorer (v1.7.6) | FlowJo Exchange | https://www.flowjo.com/exchange/ |
| clusterProfiler v4.4.4 | N/A | https://bioconductor.org/packages/release/bioc/html/clusterProfiler.html |
| Destiny 3.10.0 | N/A | https://bioconductor.org/packages/release/bioc/html/destiny.html |
| Downsample (v3.3.1) | FlowJo Exchange | https://www.flowjo.com/exchange/ |
| EnhancedVolcano v1.14.0 | N/A | https://bioconductor.org/packages/release/bioc/html/EnhancedVolcano.html |
| enrichR | N/A | https://maayanlab.cloud/Enrichr/ |
| Fiji | Schindelin et al. | https://fiji.sc/ |
| FlowJo v10.8.1 | FlowJo Corp. | https://www.flowjo.com/ |
| FlowSOM (v4.1.0) | FlowJo Exchange | https://www.flowjo.com/exchange/ |
| ggplot 4.2.0 | N/A | https://github.com/tidyverse/ggplot2 |
| ImageJ | Schneider et al. | https://imagej.nih.gov/ij/ |
| Living Image 4.2 | Caliper Life Sciences | https://www.perkinelmer.com/category/in-vivo-imaging-software |
| Monocle3 v1.2.9 | N/A | https://cole-trapnell-lab.github.io/monocle3/ |
| nSolver v4.0.70 | Nanostring | https://nanostring.com/products/analysis-solutions/nsolver-advanced-analysis-software/ |
| Pathview v1.36.1 | N/A | https://bioconductor.org/packages/release/bioc/html/pathview.html |
| Prism v9.5.1 | GraphPad | https://www.graphpad.com/ |
| Python 3.9 | Python Software Foundation | https://www.python.org |
| R v4.2.0 | The R Foundation | https://cran.r-project.org/src/base/R-4/ |
| Real Statistics Resource Pack Release 7.6 | Charles Zaiontz, © 2013-2021 | https://real-statistics.com/ |
| Rosalind v3.36.1.2 | OnRamp Bio | https://www.rosalind.bio/ |
| scVelo v0.2.4 | N/A | https://scvelo.readthedocs.io/en/stable/installation/ |
| Seurat v4.3.0 | N/A | https://github.com/satijalab/seurat |
| UMAP (v4.0.4) | FlowJo Exchange | https://www.flowjo.com/exchange/ |
| velocyto v0.17.17 | N/A | http://velocyto.org |
| Other | ||
| 0.5 mm x 2.3 mm Tungsten Carbide Burr for Micro Drill | Fine Science Tools | Cat#19009-05 |
| 10 μL, Model 901 Removable Needle (RN) Syringe | Hamilton | Cat#7648-01 |
| 26 gauge, Small Hub RN Needle, 1”, PS4 | Hamilton | Cat#7804-03 |
| 34 gauge, Small Hub RN Needle, 0.375”, PS3 | Hamilton | Cat#207434 |
| 7mm Reflex Clip Applier | Braintree Scientific | Cat#RF7APL |
| Cellstar® Suspension Culture Flask, 50 mL, PS, White Filter Screw Cap | Greiner Bio-One | Cat#690195 |
| Cellstar® TC Cell Culture Flask, 50 mL, PS, Red Filter Screw Cap | Greiner Bio-One | Cat#658175 |
| Costar® 96-well Clear Flat Bottom Ultra-Low Attachment Microplate | Corning | Cat#3474 |
| Costar® 96-well Clear Round Bottom Ultra-Low Attachment Microplate | Corning | Cat#7007 |
| Ethicon bone wax: 2.5G | Ethicon Endo-surgery | Cat#W31G |
| Exel International Disposable Scalpels | Fisher Scientific | Cat#14-840-01 |
| Falcon® 48-well Clear Flat Bottom TC-treated Cell Culture Plate, with Lid | Corning | Cat#353078 |
| Falcon® Permeable Support for 12-well Plate with 3.0 μm Transparent PET Membrane | Corning | Cat#353181 |
| Falcon™ Cell Strainer 70 μm | Corning | Cat#352350 |
| Falcon™ Round-Bottom Polystyrene Test Tubes | Corning | Cat#352058 |
| Fisherbrand™ Cover Glasses: Rectangles | Fisher Scientific | Cat#12-545G |
| Fisherbrand™ Wood Handled 6” Cotton Swab | Fisher Scientific | Cat#22363157 |
| GenClone 12-Well Non-Treated Plates Flat Bottom | Genesee Scientific | Cat#25-101 |
| Luer-Lok™ Syringe sterile, single use, 5 mL | BD Biosciences | Cat#309646 |
| Miltex™ Mid Grade Eye Dressing Forceps | Integra LifeSciences | Cat#V918-780 |
| Nunc™ Lab-Tek™ 8-well Chamber Slide w/ removable wells | Thermo Fisher | Cat#177402 |
| PrecisionGlide™ 25 G X 5/8” Hypodermic Needles | BD Biosciences | Cat#305122 |
| Reflex Wound Clips 7 mm | CellPoint Scientific | Cat#203-1000 |
| Roche Protector RNase Inhibitor | Sigma-Aldrich | Cat#3335402001 |
| SAFE-T-FILL® Capillary Blood Collection Tubes - EDTA | RAM Scientific | Cat#07-7051 |
| Scissors, Fine, Excelta Corp® | VWR | Cat#75880-906 |
| Size 1 Head Exposure Shield Size 1 | Precision X-Ray | Cat#XD1907-2015 |
| Size 1 Holding Fixture, No Flank | Precision X-Ray | Cat#XD1907-1014 |
| Steriflip-HV Sterile Centrifuge Tube Top Filter Unit, 0.45 μm pore size, PVDF | Millipore Sigma | Cat#SE1M003M00 |
| Tissue-Plus™ O.C.T. Compound Tissue-Plus™ O.C.T. Compound, Clear | Fisher Scientific | Cat#FIS23-730-571 |
| Vacutainer™ 10mL Plastic Blood Collection Tubes with Sodium Heparin: Conventional Stopper | BD Biosciences | Cat#367874 |
| Vacutainer™ Plastic Blood Collection Tubes with K2 EDTA: Hemogard™ Closure | BD Biosciences | Cat#366643 |
| VistaVision™ HistoBond® Adhesive Microscope Slides, Premium | Avantor VWR | Cat# 16004-408 |
Experimental Model and Study Participant Details.
Cell lines.
Human GBM6 (Mayo Clinic), GBM43 (Mayo Clinic), DBTRG-05MG (ATCC), and U-251 (ATCC) cell lines were cultured at 37°C and 5% CO2 in Dulbecco’s modified Eagle’s medium (DMEM, Gibco) supplemented with 10% fetal bovine serum (FBS, Avantor) and 1% penicillin and streptomycin (P/S), GlutaMAX, non-essential amino acids (NEAA), and sodium pyruvate (Gibco). Murine cell lines (GL261 [US National Cancer Institute], SB28 and BGL1 [gifted by Dr. Hideho Okada, Univ. Calif. San Francisco]), as well as U-251 cells when used to generate U251cm, were cultured in Roswell Park Memorial Institute Medium 1640 (RPMI 1640) in similar conditions and using identical supplements, with the addition of 1% HEPES (Gibco). To generate GSC-containing neurospheres, GBM6/GM43 cells were grown in neurosphere media, consisting of DMEM/F12 (Gibco) supplemented with 20 ng/mL EGF (Peprotech), 20 ng/mL bFGF (Peprotech), and 2% GEM21/neuroplex (GeminiBio). All cell lines were passaged less than 10 times, screened bimonthly for mycoplasma, and validated every 6 months by Short Tandem Repeat (STR) analysis at the University of California Cell Culture Facility.
Mice.
6-8 week-old female C57BL/6J, OT-II, and Balb/CJ mice were purchased from the Jackson Laboratory. UBC-GFP mice were kindly provided by Drs. Chapman, Valdearcos, and Koliwad (UCSF). Mice were housed in specific pathogen-free (SPF) conditions and standard environmental parameters (12:12 light:dark cycle; 10-15 air changes/hour; 30-70% humidity; 68-79°F) at the UCSF Diller Cancer Research Building Animal Facility. Experiments were conducted using 8-12 week-old mice randomized to experimental groups, in accordance with UCSF IACUC protocol AN105170-02.
Human samples.
Human tumor samples were from newly diagnosed IDHwt GBM patients at initial resection, following UCSF Brain Tumor Research Center (BTRC) and IRB #11-06160 protocol. Written consent was obtained from all patients preoperatively. Patient age, sex, and experimental relevance are in Table S1.
Method Details.
Murine and human tissue harvest and dissociation.
Tumor cells and supernatants:
Patient tumors were collected in serum-free Hibernate-A medium (Gibco) and transferred on ice to the laboratory for further processing. To harvest murine tumors, mice were first euthanized via CO2 administration (2L/min) in a closed chamber, followed by systemic perfusion with 10 mL of Dulbecco’s phosphate-buffered saline (DPBS; Gibco) through the left ventricle; the brain was subsequently isolated and the tumor resected using sterile surgical blades (Exel). To dissociate both human and murine tissue into single cell suspensions, tumors were washed twice with DPBS and cut into 1mm fragments prior to a final wash in 1 mL DPBS per 100 mg of tissue. After centrifugation, the supernatant was collected in some cases for analysis of secreted cytokines. The remaining tissue was incubated for 45 minutes at 37°C in 600 μL of dissociation buffer (0.74 U/μL collagenase IV [Gibco] + 5.3 U/μL deoxyribonuclease I [Worthington] in DPBS) per 100 mg tissue. Homogenized samples were passed through a 70 μm filter (Falcon) and resuspended in 1 mL ACK buffer (Gibco) for 2 minutes at room temperature (RT) to lyse erythrocytes. Single cell suspensions were kept in DPBS on ice until downstream use.
Blood PBMCs:
Patient and healthy control blood samples were collected in either EDTA- or heparin-coated tubes (BD) for subsequent neutrophil or T cell isolation, respectively. Murine blood was collected in EDTA-coated capillary tubes (RAM Scientific), either through saphenous vein draw in live mice or intracardiac draw in euthanized mice. Samples for flow cytometry were additionally incubated in ACK buffer at a 1:10 ratio for 10 minutes at RT with intermittent agitation. Processed samples intended for neutrophil isolation were stored at RT to minimize thermal induction of neutrophil activation; otherwise, samples were stored on ice.
Splenocytes:
Spleens were isolated from euthanized mice, then passed through a 70 μm filter using a syringe plunger, and subsequently resuspended in 1 mL ACK buffer for 2 minutes at RT. Final sample was kept in DPBS on ice until use.
Systemic and skull BM:
To harvest systemic marrow, femurs were isolated from euthanized mice, their epiphyses were cut using surgical scissors (Excelta), and the internal marrow was flushed with DPBS using a 5 mL syringe (BD) fitted with a 25G needle (BD). Marrow contents were then passed through a 70 μm filter using a syringe plunger, and subsequently resuspended in 1 mL ACK buffer for 2 minutes at RT. To harvest skull BM, calvaria were first isolated from euthanized mice by cutting around the occipital, parietal, and frontal bones using surgical scissors. The underlying dura was carefully removed using fine-toothed forceps (Integra). Skulls were then cut into 0.5-1.0 mm fragments, resuspended in 1 mL dissociation buffer (as described earlier), and incubated for 45 minutes at 37°C with intermittent vortexing. The resulting mixture was passed through a 70 μm filter and resuspended in 1 mL ACK buffer for 2 minutes at RT. Final skull and systemic marrow samples were kept in DPBS on ice until use.
Staining for flow cytometric immunophenotyping and functional characterization.
Staining and analysis protocol:
All cell suspensions were processed and acquired immediately after harvesting, and antibodies were purchased from either BD or Biolegend. Samples were first stained with ZombieAqua or ZombieNIR viability dye according to manufacturer instructions. For apoptosis-related assays, Apotracker Green was also applied at this step at a working concentration of 0.16 μM. After washing with FACS buffer (2% FBS in DPBS), samples were then blocked for 10 minutes at 4°C in 10 μg/ml of either rat anti-mouse CD16/32 (clone 2.4G2; for murine samples) or Human Fc Block (Fc1; for human samples). In some cases, murine samples were alternatively blocked with anti-CD16/32-BV421 (190909) to enable characterization of this marker. Surface staining was otherwise completed following manufacturer recommendations. Where necessary, intracellular staining was performed using an eBioscience Foxp3/Transcription Factor Staining Buffer Set. Samples were acquired on an Attune NxT (ThermoFisher) flow cytometer, and data was subsequently analyzed with FlowJo software (Tree Star). All analyses were initiated with exclusion of cell doublets and dead cells. Samples were then either assessed through conventional gating or dimensional reduction. For dimensional reduction, samples were converted to uniform size using the Downsample (v3.3.1) plugin on FlowJo and then concatenated together. UMAP (v4.0.4) and FlowSOM (v4.1.0) were used to plot and cluster cells in dimensionally reduced space based on compensated area parameters for phenotypic markers; ClusterExplorer (v1.7.6) was used to generate expression heatmaps.
Immune profiling:
To characterize immune populations in human samples, cells were stained with fluorophore-conjugated anti-human antibodies against: CD3 (UCHT1), CD4 (OKT4), CD8 (SK1), CD11b (M1/70), CD11c (3.9), CD14 (M5E2), CD15 (W6D3), CD45 (2D1), CD56 (QA17A16), CD66b (6/40c), CD206 (15-2), MHCII/HLA-DR,P,Q (Tü39). For murine studies, fluorophore-conjugated anti-mouse antibodies were used: CD45 (I3/2.3, 30-F11), CD11b (M1/70), CD11c (N418), B220 (RA3-6B2), CD90.2 (30-H12), NK1.1 (S17016D), CD115/CSF1R (AFS98), F4/80 (BM8), CD117/c-Kit (2B8), Ly6G (1A8), CXCR2 (V48-2310, SA044G4), Ly6C (HK1.4), SiglecF (S17007L), Gr1 (RB6-8C5), CD3 (17A2), CD4 (GK1.5), CD8a (53-6.7), MHCII/HLA-IA,E (M5/114.15.2), CD206/MMR (C068C2), P2RY12 (S16007D), and CX3CR1 (SA011F11). CD45+ mouse hematopoietic cells were profiled into cKithi HSPCs, CD3+ T cells, CD11b+ myeloid cells, CD11b−B220+CD11c+MHCII+ pDCs, and CD11b−B220−CD11c+MHCII+ cDC1s. T cells were subdivided into CD8−CD4+ Th cells, CD8+CD4− CTLs, CD8+CD4+ DNTs, and CD8+CD4+ double positive T cells. Myeloid cells were subdivided into cKithi precursors, Gr1+SiglecF+ eosinophils, CD11c+MHCII+CSF1Rlo cDC2s, P2Y12R+CX3CR1+ microglia, Gr1+Ly6Glo/hiCSF1R− neutrophils, and CSF1R+/F480+ macrophages. Macrophages were further characterized as M1 (CD206hiMHCIIlo), M2 (CD206loMHCIIhi), and/or inflammatory (Ly6C+), and neutrophils were defined as hybrid (CD11c+MHCII+), immature (CXCR2−Ly6Glo/hi), and/or mature (CXCR2+Ly6Ghi).
T cell profiling:
To evaluate activation in T cells cocultured with patient neutrophils, cells were stained with fluorophore-conjugated anti-human antibodies against: CD4 (SK3), CD8 (SK1), CD25 (M-A251), CD69 (FN50). To profile murine intratumoral T cell subsets, fluorophore-conjugated anti-mouse antibodies were used: CD45 (30-F11), CD3 (17A2), CD4 (GK1.5), CD8a (53-6.7), CD44 (IM7), CD62L (MEL-14), CX3CR1 (SA011F11), CD69 (H1.2F3), and IFNγ (intracellular, XMG1.2). CD3+CD4+CD8− Th cells and CD3+CD4−CD8+ CTLs were individually identified as naïve CD62LhiCD44− Tn’s, effector memory CD62LloCD44+ Tem’s, and central memory CD62LhiCD44+ Tem’s; Th1-subtype CD4+ T cells were additionally identified as CX3CR1+IFNγ+. Activation was assessed by CD25 (late) and CD69 and/or CD44 (early) expression.
Neutrophil maturity and phenotype profiling:
To identify immature and hybrid neutrophils among patient TANs and PBNs, human tumor and PBMC specimens were stained with fluorophore-conjugated anti-human antibodies against CD16 (3G8), CD66b (6/40c), CD15 (W6D3), MHCII/HLA-DR,P,Q (Tü39), CD49d (9F10), CD101 (BB27), CD10 (HI10a), CD3 (UCHT1), CD19 (HIB19), CD56 (HCD56), CD14 (M5E2), Siglec8 (7C9). For maturity analysis, after the exclusion of lineage-positive cells (CD3, CD19, CD56, CD14, Siglec8), CD66b+[CD16+/CD15+] neutrophils were assessed for their expression of MHCII and their internal composition: CD49dhiCD101lo preNeus, CD49dloCD101hiCD10lo immNeus, and CD49dloCD101hiCD10hi matNeus. In murine studies – which included phenotypic induction experiments, migration experiments, and TAN/PBN profiling – cells were stained with fluorophore-conjugated anti-mouse antibodies against CD45 (I3/2.3, 30-F11), CD11b (M1/70), B220 (RA3-6B2), CD90.2 (30-H12), SiglecF (S7007L), NK1.1 (S17016D), CD117/c-Kit (2B8), CD16/32 (190909), CD11c (N418), MHCII/HLA-IA,E (M5/114.15.2), Gr1 (RB6-8C5), CD115/CSF1R (AFS98), Ly6G (1A8), F4/80 (BM8), and CXCR2 (V48-2310, SA044G4). Following exclusion of lineage-positive cells (SiglecF, NK1.1, CD90.2, B220), cKithiCD16/32+ GMPs, CD11b+[CSF1R+/F480+] macrophages, and CD11b+Gr1+CSF1R− neutrophils were identified. The latter were further stratified as immature CXCR2−Ly6Glo/hi or mature CXCR2+Ly6Ghi.
Glioma stemness and stromal characterization:
Murine tumor stemness and stromal composition were characterized by staining tumor samples with fluorophore-conjugated anti-mouse antibodies against CD133 (315-2C11), CD105 (MJ7/18), CD106 (429), Podoplanin (8.1.1), CD133 (315-2C11), CD140a (APA5), CD140b (APB5), CD31 (390), CD45 (30-F11), CD326 (EpCAM), (G8.8), and Ly6A/E (Sca1) (D7). Tumor stemness was assessed as CD133 expression. Stromal components were analyzed via dimensional reduction, using markers to identify major clusters: Sca-1+ mesenchymal stem cells, CD140b+ pericytes/VSMCs, podoplanin+CD140a+ fibroblasts, and CD31+ endothelial cells (divided into CD45+ immature and CD45− mature subsets).
Magnetic and fluorescence-activated cell sorting of human immune cells.
For coculture studies, patient and control CD3+ T cells were isolated from PBMCs via negative magnetic selection (StemCell), following the manufacturer’s protocol. Similarly, PBNs were initially enriched via negative magnetic selection (StemCell). Both PBNs and TANs were subsequently purified from their respective samples (either enriched PBNs or tumor cell suspensions) via FACS. Cells were stained with fluorophore-conjugated anti-human CD45 (HI30), CD16 (3G8), and CD66b (6/40c), and live CD45+CD66b+CD16hi neutrophils were sorted on a 4-laser 6-channel Sony SH800 cell sorter using ‘normal purity’ settings. For scRNA-seq specimens, sorted cells were collected in 5 mL round-bottom polystyrene tubes (Corning Falcon) prefilled with 10 μL of Protector RNase Inhibitor (Roche).
Fluorescence-activated cell sorting of mouse immune cells.
To harvest murine BMNs for MHCII induction experiments, BM isolates were stained with fluorophore-conjugated anti-mouse CD117/c-Kit (2B8), CD90.2 (30-H12), B220 (RA3-6B2), NK1.1 (S17016D), SiglecF (S17007L), CD115/CSF1R (AFS98), CD11b (M1/70), Gr1 (RB6-8C5), and CXCR2 (V48-2310). Following exclusion of HSPCs (cKithi) and lineage-positive (CD90.2, B220, NK1.1, SiglecF, CSF1R) cells, immature CD11b+Gr1+CXCR2− and mature CD11b+Gr1+CXCR2+ BMNs were sorted on a 4-laser 6-channel Sony SH800 sorter using ‘normal purity’ settings.
Imaging and analysis.
Frozen section immunohistochemistry for TAN proximity to vasculature:
Tissue from the operating room was promptly suspended in 4% paraformaldehyde in DPBS for 12 hours, then transferred to a 30% sucrose w/v solution for 48 hours. Next, samples were submerged in Tissue-Plus Optimal Cooling Temperature (OCT) Compound TM (Fisher) and frozen at −80°C for ≥24 hours. OCT tissue blocks were sectioned into 10 μm slices using a Leica HM550 Cryostat and immediately adhered to Superfrost+ microscope slides (ThermoFisher), which were refrozen at −80°C until staining.
Slides were fixed and stained in the typical fashion. Briefly, samples were rinsed with DPBS followed by blocking at RT for 1 hour in 5% goat serum (Jackson Immuno), 2% bovine serum albumin (Sigma Aldrich), and 0.3% Triton X-100 (Sigma Aldrich) in DPBS. Slides were incubated overnight at 4°C in anti-human primary polyclonal antibodies diluted in blocking buffer per manufacturer recommendations: anti-CD31 and either anti-MPO or anti-Nestin (Abcam). Samples were then rinsed with DPBS and incubated in secondary antibodies diluted in blocking buffer per manufacturer recommendations (Invitrogen) for 2h. The solution was aspirated and slides were allowed to air dry before mounting with DAPI (Southern Biotech) and coverslip (Fisher) application. Images were acquired on a Zeiss M1 fluorescent confocal microscope, and processed on ImageJ (Fiji).
Form factor analysis:
Isolated TANs and PBNs were resuspended in DAPI and mounted onto slides prior to image acquisition on a Nikon Eclipse Ti-E epifluorescence microscope and subsequent analysis using ImageJ. As previously described, form factor or dendriticity was calculated as P2/(4*π*A), where P is cellular perimeter and A is area.71
Cytocentrifugation and Wright-Giemsa histological staining:
Isolated patient TANs/PBNs and murine BMNs/TANs were resuspended in supplemented RPMI and 25,000 cells/well were seeded into 8-well Nunc Lab-Tek chamber slides (Thermo Fisher). Slides were placed into a custom 3D-printed adapter 72 and spun at 130 rcf for 5 minutes in a standard Eppendorf 5415 centrifuge. Wells were removed and samples were allowed to air-dry completely. Slides were flooded with 1-2 mL of Wright-Giemsa stain (RICCA), followed 1 minute later by an equal volume of deionized water. After 3 minutes, slides were rinsed with deionized water and allowed to air dry before mounting with Cytoseal 60 (Epredia). Brightfield images were acquired on a Keyence BZ-X800 microscope using a Plan Apo 20x NA 0.75 WD 1mm objective. For nuclear segmentation analysis, nuclear lobulation was manually recorded and measurements validated by a second independent observer.
Generation of neutrophil- and tumor-conditioned medias.
Neutrophil-conditioned media:
TANs and PBNs were cultured in non-treated 12-well plates (Genesee Scientific) for 12h in supplemented RPMI at 10,000 cells/mL. Cells were then centrifuged and CM collected. For purification, media was passed through a 0.45 μm Steriflip vacuum filtration unit (MilliporeSigma).
Tumor-conditioned media (TCM):
To generate CM from patient tumor specimens, viable CD45− tumor cells were first enriched via FACS. Cells were then cultured for 12h in 10 mL of supplemented RPMI in non-treated 75 cm2 flasks (CellStar), at 1.0E6 cells/mL. To generate TCM from immortalized tumor lines, 3.75E5 BGL1 or U251 cells suspended in 28.125 mL of supplemented RPMI were seeded on to TC-treated 75 cm2 flasks (Greiner Bio-One CellStar) for 24h. For GBM43, 10E6 cells suspended in 10 mL neurosphere media were cultured in non-treated 75 cm2 flasks for 12h. Finally, for GL261 CM, 1.0E6 cells were first seeded in 10 mL of supplemented RPMI in TC-treated 75 cm2 flasks, then media was replaced after 72h with an additional 25 mL, and cells were allowed to incubate for 24 more hours. In all models, after their respective culture times, media was collected, centrifuged to remove cellular components, and further purified through 0.45 μm filtration.
Human neutrophil culture studies.
Effects of tumor contact and TCM on neutrophil biology:
To assess the effects of the tumor secretome on neutrophil viability, form factor, and MHCII expression, control and/or patient PBNs were cultured in TCM at a concentration of 150,000 cells/mL in non-treated 12-well plates; control samples were instead cultured in supplemented RPMI. In some experiments, PBNs were instead cultured directly with GBM cells (either U251, GBM43, or autologous tumor); in these cases, 100,000 tumor cells and 300,000 PBNs were co-cultured in 2 mL of appropriate media. For adherent cell lines (i.e., U251), tumor cells were seeded first, and media was replaced 12h later with a fresh 2 mL containing PBNs. For blocking experiments, TCM was supplemented with 10 μg/mL of anti-human GM-CSF antibody (BVD2-23B6) or matched isotype (Rat IgG2a κ [RTK2758]), then incubated on ice for 30 minutes before use. Culture durations varied from 12h (form factor) to 96h (viability, MHCII induction). For analysis, cells were harvested via media collection and centrifugation, then imaged or assessed cytometrically.
Effects of TANs and PBNs on tumor biology [NETosis]:
We adapted a previously published murine NETosis assay to compare the effector capabilities of patient TANs and PBNs.73 Briefly, neutrophils were resuspended in supplemented RPMI with 0.05% v/v SYTOX Green (1:250 dilution in DMSO, Invitrogen) and either 50% v/v DMSO (Sigma Aldrich) or 50% v/v LPS (1:250 dilution in DMSO; Invitrogen eBioscience), at a concentration of 1.0E6 cells/mL. 200 μL of each suspension was plated per well of a non-treated 96-well flat-bottom plate (Costar) and incubated at 37°C/5% CO2 for 2h. Samples were harvested, washed and resuspended in FACS buffer, and acquired on an Attune NxT flow cytometer. NETosis induction per experimental condition was calculated as the ratio of SYTOX Green positivity in LPS-treated samples to that in vehicle (DMSO)-treated samples.
Effects of TANs and PBNs on tumor biology [glioma stem cell formation]:
For neurosphere formation assays, GBM6, DBTRG_05MG, or GBM43 GSCs were seeded in 96-well non-treated flat-bottom plates with 200 μL of neurosphere media at 24 cells/well, or in 12-well non-treated plates with 2 mL of neurosphere media at 10,000 cells/well. For experimental conditions, cells were instead suspended in a 1:1 mixture of neurosphere media and either TAN- or PBN-CM. In osteopontin-blocking assays, samples were treated with 5 ug/mL anti-human OPN (polyclonal; R&D) or normal goat IgG (polyclonal; R&D). Cultures were incubated for 24h, after which spheres were quantified per well.
Effects of TANs and PBNs on tumor biology [osteopontin ELISA]:
Patient TAN- and PBN-CM were assessed in technical triplicate for OPN production using an OPN ELISA (R&D Systems), on undiluted samples following manufacturer instructions.
Effects of TANs and PBNs on tumor biology [antigen processing capacity/DQ-OVA uptake]:
To test whether neutrophils could proteolyze exogenous peptide antigen, TANs/PBNs were seeded into flat-bottom 96-well non-treated plates at 50,000 cells/well in 200 μL of supplemented RPMI with 10 μg/mL of DQ-OVA (Invitrogen). Samples were incubated at 37°C/5% CO2 for 2 hours, harvested, washed, and assessed by flow cytometry for green fluorescence.
Effects of TANs and PBNs on tumor biology [T cell interactions]:
In experiments where neutrophils were initially activated, cells were resuspended at a concentration of 1.0E6 cells/mL in 1 μg/mL LPS in DPBS or pure DPBS and incubated for 1 hour at 37°C/5% CO2 followed by 2 washes with DPBS. Next, cells were resuspended at the same concentration in supplemented RPMI with 10 μg/mL anti-human anti-MHCII/HLA-DR,P,Q (Tü39; Biolegend) or mouse IgG2a κ (MOPC-173; Biolegend), then incubated for 30 minutes at 37°C/5% CO2 before being diluted 6-fold in supplemental RPMI to a final concentration of 1.67E5 cells/mL. Meanwhile, control- or patient-derived T cells were first stained with CFSE (Biolegend) per the manufacturer’s protocol, then resuspended at a concentration of 8.33E5 cells/mL in supplemented RPMI with or without 10 uL/mL of Immunocult Human CD3/CD28 T cell Activator (Stem Cell). Neutrophil and T cell suspensions were mixed in a 1:1 ratio and immediately plated in 96-well non-treated flat-bottom plates, at 1.2E5 cells/well. Cultures were incubated for 72h at 37°C/5% CO2 with daily mixing by micropipetting and final analysis by flow cytometry.
Murine neutrophil and mixed bone marrow culture studies.
Effects of TCM on BMN maturation and viability:
Mixed BM isolates from C57BL/6J mice were cultured in 12-well non-treated plates at 500,000 cells/well in 2 mL of supplemented RPMI (controls) or GL261cm. Samples were incubated for 72h and assessed for viability and preponderance of immature neutrophils by flow cytometry.
Effects of TCM on BMN hybrid polarization:
To compare the phenotypic plasticity of different BMN subsets, sorted immature and mature murine neutrophils were cultured in 96-well non-treated flat-bottom plates at 50,000 cells/well in 200 μL of supplemented RPMI (controls) or syngeneic TCM (BGL1cm for Balb/CJ, GL261cm for C57BL/6J). For blocking experiments, TCM was supplemented with 10 μg/mL of anti-mouse IL-10 (1B1.3a), IL-12/IL-23 p40 (C17.8), IL21 (S20017B), CD183 (CXCR3-173), GM-CSF (MP1-22E9), and/or IFN-γ (XMG1.2) antibody, then incubated on ice for 30 mins prior to use; controls were instead treated with matched isotype (Rat IgG2a κ [RTK2758], Rat IgG1 κ [RTK2071], or Armenian Hamster IgG [HTK888]). Samples were incubated for 48h, after which they underwent histological staining, flow cytometry, and DQ-OVA uptake assays.
Effects of TCM on BMN migration:
Mixed murine BM isolates from C57BL/6J mice were resuspended in supplemented RPMI and seeded onto 3.0 μm-pore PET-coated transparent 12-well transwell inserts (Falcon) at a concentration of 3.0E6 cells/well. Inserts were then placed into 12-well non-treated plates containing 1.5 mL of either prewarmed supplemented RPMI or GL261cm per well. Migration was allowed to continue for 16h at 37°C/5% CO2, after which cells from above and below the insert filter were collected and analyzed by flow cytometry.
Effects of TCM on skull neutrophil migration ex vivo:
To assess the chemotactic effects of tumor-secreted proteins on skull neutrophils ex vivo, mouse calvaria were thoroughly rinsed with 3 DPBS washes and cut sagitally into paired halves. Each half was placed, inferior side-down, into 2 mL of media in a 12-well non-treated plate; for each skull, one half was suspended in supplemented RPMI, and the other in syngeneic TCM (BGL1cm for Balb/CJ; GL261cm for C57BL/6J). Cells were allowed to egress for 48h at 37°C/5% CO2. At endpoint, cells were collected by harvesting media and rinsing calvaria with DPBS, then assessed by flow cytometry for maturity.
Effects of TANs on antigen-specific T cells [OT-II CD4+ assay]:
To test the ability of TANs to effectively present antigen to T cells, FACS-isolated TANs from GL261 tumors experiments were pulsed with 100 μg/mL OVA 323-339 peptide (Invivogen) at a concentration of 100,000 cells/mL for 4h at 37°C/5% CO2; as a positive control, splenocytes from C57BL/6J mice were similarly pulsed. TANs and splenocytes were washed and plated in a non-treated 96-well round-bottom plate (Costar), at a concentration of 70,000 neutrophils per well and 210,000 splenocytes per well. CFSE-labeled CD4+ T cells were isolated via magnetic negative selection from OT-II mice (MojoSort™ Mouse CD4 T cell Isolation Kit, Biolegend) and stained with CFSE per manufacturer instructions, then added to the preloaded wells at a concentration of 70,000 cells per well. Wells were filled to 200 μL and supplemented with 55 μM β-mercaptoethanol (Gibco) and 30 U/mL IL-2 (Abcam). Cultures were incubated for 72h at 37°C/5% CO2 with daily mixing and final analysis by flow cytometry. CFSE dilution indices were calculated on FlowJo: proliferation (total divisions/cells that went into division), expansion (total cells/cells at start), replication (total divided cells/cells that went into division).
Proteomic studies.
Proteome profiler:
To assess cytokine abundance intratumorally, supernatants were collected during murine tumor dissociation (as described earlier) and analyzed using a Proteome Profiler mouse cytokine array (R&D Systems), following manufacturer instructions. For imaging, membranes were incubated in IRDye 800CW Streptavidin (LI-COR) diluted in array buffer (1:2000) for 30 mins at RT on a rocking platform, then washed and imaged on a LI-COR Odyssey XF Imager (NIR fluorescence, 84μm resolution, medium quality, focus offset=0.0mm, starting intensity=5). Mean pixel density of array spots was quantified on ImageJ (Fiji).
Bulk transcriptomic studies.
Quantitative polymerase chain reactions for NANOG, OCT4:
RNA was extracted from GSCs using an RNeasy Mini kit (Qiagen) and stored at −80°C until use. cDNA was created using qScript XLT cDNA Supermix (Quanta Bio), following manufacturer’s protocol. cDNA was diluted to a constant concentration for all samples to ensure similar nucleic acid loading. Quantitative PCR was carried out using Power SYBR Green Master Mix (Applied Biosystems) on an Applied Biosystems StepOne Real-Time PCR cycler following manufacturer guidelines: 95°C for 10 min, followed by 40 cycles of 95°C/15 sec and 60°C/1 min. Ct values were calculated using the StepOne software (Applied Biosystems). Samples were prepared with three technical replicates per primer pair, using β-actin as a housekeeping gene.
Nanostring multiplex transcriptomic analysis:
RNA was extracted from patient and murine tumor single cell suspensions using an RNeasy Mini kit (Qiagen) and stored at −80°C until use. A bioanalyzer was used to determine RNA quantity and quality. RNA (100ng) from each sample was hybridized with the Nanostring Myeloid v2 Profiling (human) and Mouse Tumor Signaling 360 (murine) codesets for 18 hours. 30 μl of the reaction was loaded into the nCounter cartridge and run on the nCounter SPRINT Profiler. Quality control and alignment of raw data was completed using nSolver (Nanostring). Differential gene expression was carried out using the DeSeq2 package in R, followed by pathway expression analysis – as defined in the KEGG 2019 Human database – using the Enrichr pipeline. Raw files were simultaneously analyzed on the Rosalind online platform (OnRamp Bio) to calculate normalized gene expression counts, differentially expressed gene significance, and cell type scores. Geometric means for DC gene expression were manually computed; to identify target genes, the Nanostring probe annotation list was queried for all targets exclusively associated with DCs and not other immune subsets. Visualizations (heatmaps, volcano plots) were generated on Microsoft Excel 365.
scRNA-seq of patient-matched TANs and PBNs.
Sample loading:
scRNA-seq was carried out using the 10x genomics platform. 10-15,000 patient TANs and PBNs were isolated by FACS into Protector RNase Inhibitor as described earlier, then validated for viability on a Countess automated cell counter. Cells were loaded on a Chromium Controller (10X Genomics) according to manufacturer instructions. The emulsion underwent reverse transcription immediately. cDNA isolation and library preparation were performed per manufacturer recommendations for processing granulocytes, including 2 extra cycles of cDNA amplification; library quality control was performed using Qubit and BioAnalyzer to determine the concentration and average size [520-570bp]. The libraries were sequenced on a NovaSeq platform at the UCSF sequencing core.
Quality Control and Pre-Processing:
Feature-barcode matrices were generated using the 10X CellRanger pipeline, with “ - -force-cells” used to include low-UMI barcodes. Feature-barcodes and count matrices subsequently underwent pre-processing and quality control in R (v4.2.0) using Seurat (v4.3.0). Cells with greater than 20% mitochondrial gene expression or expression of fewer than 200 genes were excluded. The LogNormalize, SelectVariableFeatures, and ScaleData functions were used to perform log normalization, variable feature selection, and scaling prior to dimensionality reduction using PCA (RunPCA) and UMAP (RunUMAP). A nearest neighbor graph was constructed and cells were clustered using the Louvain algorithm implemented through the FindNeighbors and FindClusters functions using a clustering resolution of 0.5. Other immune populations were removed from further analysis based on expression of CD3D/CD3E/CD4+ (T cells), CD79A/B+ (B cells), and CD14+ (monocytes). After pre-processing and quality control there were 7,463 cells (94.1%) x 16,849 genes in the blood sample and 11,831 cells (85.5%) x 19,913 genes in the tumor sample.
Integration:
Integration of the samples from blood and tumor was performed by selecting variable features in each sample (SelectIntegrationFeatures), identifying anchors using CCA (FindIntegrationAnchors), and finally integrating the data (IntegrateData). Scaling, dimensionality reduction, and clustering was performed as outlined above after selecting “RNA” as the default assay for the integrated sample.
Module scores:
Module scores were computed for genes sets for MHC class I/II presentation, cytotoxicity, and chemotaxis using the AddModuleScore function of Seurat, referencing gene sets described previously 42.
Data visualization:
Heatmaps, UMAP plots, and feature plots were produced using default visualization methods of Seurat. Volcano plots were produced using the EnhancedVolcano package (v1.14.0) in R. Diffusion maps were produced using destiny (v3.10.0) with the entire cells x genes matrix from the tumor sample as input.
Trajectory analysis (RNA velocity):
BAM file outputs from the 10X CellRanger pipeline were converted to loom files using velocyto (v0.17.17) and were processed in scVelo (v0.2.4) to generate estimates of RNA velocity using spliced and unspliced counts using the dynamical modeling setting with default parameters. Latent time and velocity arrows were computed and overlayed onto the UMAP embedding computed through the Seurat pre-processing pipeline.
Gene Ontology, GSEA, and KEGG pathway analysis:
clusterProfiler (v4.4.4) was used for all gene ontology (GO), GSEA, and KEGG pathway analysis. During gene ontology analysis, the top 50 genes by log2 fold change that were differentially expressed in each comparison group were utilized. The pathview package (v1.36.1) was used to visualize expression of genes in KEGG pathways of interest.
Ligand-receptor analysis:
CellChat (v1.6.1) was used to analyze ligand-receptor interactions among clusters of the tumor neutrophil dataset. The whole ligand-receptor database was utilized, and the average gene expression per cell group was calculated using the trimean method.
Murine in vivo studies.
For all cranial surgical procedures, mice were anesthetized with 1.5% isoflurane (Dechra) and administered pre- and post-operative subcutaneous analgesics (0.05-0.1 mg/kg buprenorphine HCL [Buprenex]; 5-10 mg/kg meloxicam [Alloxate]). Body temperature was maintained intraoperatively by placing mice on a heating pad at 37°C. Prior to midline incision, mice were administered subcutaneous 0.25% bupivacaine HCL (Patterson Vetinerary), heads were shaved if necessary, and exposed scalps were sterilized with 70% EtOH and 7.5% povidone-iodine (Purdue Frederick). After surgery, incisions were closed with 7mm Reflex wound clips (CellPoint Scientific). Mice were monitored daily and euthanized at pre-determined endpoints or at protocol endpoint (>15% weight loss or neurologic deficits).
Intracranial tumor implantation:
150,000 luc+ BGL1 cells, 55,000 luc+ GL261 cells, or 15,000 luc+ SB28 cells were resuspended in 2 μL of Hank’s buffered saline solution (HBSS; Gibco) and implanted intracranially into the right frontal lobes of Balb/CJ (BGL1) or C57BL/6J (GL261, SB28) mice. Tumor inoculation was completed stereotactically (Stoelting) 1.9 mm right of bregma and 3.0 mm below the dural surface, using a 10 μL micro-syringe fitted with a 26G 1” 12° PS4 needle (Hamilton) needle.
Bioluminescent imaging (BLI):
In vivo tumor growth was monitored through BLI on an IVIS Spectrum imaging system, with images taken every 3 days starting from the sixth day after tumorization; imaging was terminated per experimental group after the first mortality. Mice were first administered 100 μL of 30 mg/mL D-luciferin Potassium Salt in DPBS (GoldBio) intraperitoneally, then anesthetized with 2.5% isoflurane. Automatic exposure settings were used for image acquisition 10 minutes post-injection, and signal was analyzed using the Living Image 4.2 software (Caliper Life Sciences). Tumor size was measured as total flux (photons/s) in a region of interest (ROI) outlining the entire tumor, and in some analyses, was normalized per mouse to a starting BLI value.
Leukocyte depletion regimens:
Longitudinal and early neutrophil depletion regimens were initiated 24h prior to tumor inoculation, and either sustained over the experimental duration (longitudinal) or until day 5 (early) through doses every 3 days; meanwhile, late neutrophil depletion was implemented between days 11 to 17. Mice were injected intraperitoneally with 200 μg of anti-mouse Ly6G (1A8; BioXCell) or matched rat IgG2a κ isotype (2A3; BioXCell) at initiation, and 100 μg thereafter. Depletion efficacy was monitored systemically through weekly saphenous vein blood draws, and at endpoint intratumorally; specimens were analyzed by flow cytometry for neutrophil abundance. Finally, for neutrophil depletion around time of AMD3100 treatment, mice were dosed with 200 μg twice, 24h before and after treatment.
T cell depletion was similarly initiated 24h before tumor inoculation, and sustained through doses every 3 days for the experimental duration. Mice were injected intraperitoneally at initiation with 200 μg of anti-mouse CD90.2 (Thy1.2) (30H12), 400 μg anti-mouse CD4 (GK1.5), and 400 μg anti-mouse CD8a (53-6.7) from BioXCell; maintenance dosing was half as much. Controls were treated with matched isotype (rat IgG2a κ (2A3) and/or IgG2b κ isotype (LTF-2)).
Surgical transplantation of CMFDA-stained and GFP+ skull flaps:
Donor bone flaps were collected from harvested UBC-GFP and Balb/CJ mouse skulls by cutting 3 and 4 mm-diameter circular cranial windows around the frontonasal and lambdoid sutures, respectively, at midline. Balb/CJ flaps were then additionally each incubated in 48-well plates (Falcon) in 200 μL of 83.3 μg/mL CellTracker Green CMFDA dye (Invitrogen). To make the staining solution, 50 μg of lyophilized CMFDA was first reconstituted in 3 μL of DMSO, then diluted to a total volume of 600 μL with DPBS. Flaps were stained at RT with intermittent shaking for 10 minutes, then washed thoroughly 3x with DPBS to quench the reaction. Prepared UBC-GFP and stained Balb/CJ bone flaps were stored in DPBS on ice, protected from light, until use.
Skull flap transplantation was performed as previously described 48. Briefly, an electrical rotary micro-drill fitted with a 0.5 mm tungsten carbide bit (Fine Science Tools) was used to create 3 and 4 mm-diameter circular cranial windows around the frontonasal and lambdoid sutures, respectively, at midline. The skull was cooled intermittently with 0.9% NaCl (Henry Schein), and craniotomy was carefully performed with fine-toothed forceps so as to not damage the underlying meninges. Donor bone flaps were placed in the surgical window, and manually fitted with surgical scissors as necessary. The transplant was fixed in place using cyanoacrylate glue (VWR) applied with a sterile cotton swab (Fisher).
Non-surgical transplantation of GFP+ bone marrow into skulls:
6-week-old C57BL/6J mice were treated with lethal irradiation to their heads (see below). 6h later, 4.0E6 systemic bone marrow cells harvested from UBC-GFP mice (as described above) were injected intravenously (via tail vein) in 100 μL of DPBS. Skull marrow was allowed to reconstitute for 4 weeks before further experiments (tumor implantation).
Irradiation of mouse skull bone marrow:
Mouse heads were lethally irradiated 24h prior to tumor implantation. Awake mice were restrained in size-1 holding fixtures (Precision X-Ray) attached to lead head-exposure body shields (Precision X-Ray), then administered 13 Gy of split dose irradiation (6.5 + 6.5 Gy, 4 hour interval) on a Precision XRad 320 irradiator. Instrument settings were as follows: 50 cm platform distance to source, F2 filter set, 320.0 KV, 12.50 mA. Skull BM was harvested at 2d, 7d, and 21d in non-tumor-treated mice to validate irradiation efficacy; the total number of viable CD45+ immune cells per skull was assessed by flow cytometry and compared to non-irradiated controls.
Administration of AMD3100 to the skull:
AMD3100 was administered intracalvarially as previously described on stereotactically restrained mice 47. An electrical drill was used to thin the outer periosteum at 2 spots near bregma and 3 spots near lambda. 10 μL of 1 mg/mL AMD3100 (Abcam) in DPBS was drawn into a 10 μL Hamilton micro-syringe fitted with a 34G 0.375” blunt needle, and 2 μL of drug was injected into each predrilled spot, using the needle to poke the final hole and being careful to not penetrate lower periosteum or dura. Each injection occurred over 60 seconds, and the needle was held in place for 30 more seconds to minimize reflux. After needle removal, bone wax (Ethicon) was applied using a cotton swab.
Quantification and Statistical Analysis.
Statistical analyses were done using either Prism v9.5.1 (GraphPad) or the Real Statistics Resource Pack software (Release 7.6; ©2013-2021, Charles Zaiontz) on Microsoft Excel 365. Parametric comparisons between two groups were conducted using a two-way Student’s t-test; comparisons between multiple groups were conducted via one-way ANOVA with post-hoc Tukey contrasts for parametric variables, or Kruskal-Wallis test with post-hoc pairwise Wilcox contrasts for non-parametric measures. Interaction of multiple categorial variables on parametric outcomes was assessed by two-way ANOVA. Categorical distributions were compared using χ2 test for independence. Pearson correlation coefficients and adjusted R2 values were calculated for linear regressions between continuous variables. Kaplan-Meier analysis was carried out for in vivo survival studies, and differences were assessed via log-rank (Mantel-Cox) test. Outliers were removed if values met Grubbs’ criteria. Study parameters and statistical measures are all explicated in the text, figures, and legends, including number of replicates, P values, choice of mean or median for measure of center, and choice of SD or SEM for variance. Significance was defined as P<0.05, with Bonferroni correction applied for multiple comparisons. Some figures were created with BioRender.com.
Supplementary Material
Table S7 (related to Fig. 4): scRNA-seq of Patient Neutrophils, scVelo Dynamically Expressed Genes.
HIGHLIGHTS:
‘Hybrid’ dendritic-neutrophils in GBM activate T cells in an MHCII-dependent manner
Neutrophil suppression of GBM growth depends on T cells and involves IFN signaling
Hybrid differentiation occurs intratumorally from precursors rarely seen in blood
Skull marrow contributes immature and antigen-presenting myeloid cells to GBM
ACKNOWLEDGEMENTS
The authors thank Akane Yamamichi, MD, PhD and Pavlina Chuntova, PhD for their assistance with animal experimentation and flow cytometry panel design. M.K.A. was supported by the NIH (1R01CA227136, 2R01NS079697, and 1R01NS123808). This study was supported by HDFCCC Laboratory for Cell Analysis Shared Resource Facility through NIH grants (P30CA082103 and S10OD021818-01).
Footnotes
Publisher's Disclaimer: This is a PDF file of an unedited manuscript that has been accepted for publication. As a service to our customers we are providing this early version of the manuscript. The manuscript will undergo copyediting, typesetting, and review of the resulting proof before it is published in its final form. Please note that during the production process errors may be discovered which could affect the content, and all legal disclaimers that apply to the journal pertain.
DECLARATION OF INTERESTS
The authors declare no competing interests.
REFERENCES
- 1.Luo JW, Wang X, Yang Y, and Mao Q (2015). Role of micro-RNA (miRNA) in pathogenesis of glioblastoma. European review for medical and pharmacological sciences 19, 1630–1639. [PubMed] [Google Scholar]
- 2.Elliott LA, Doherty GA, Sheahan K, and Ryan EJ (2017). Human Tumor-Infiltrating Myeloid Cells: Phenotypic and Functional Diversity. Front Immunol 8, 86. 10.3389/fimmu.2017.00086. [DOI] [PMC free article] [PubMed] [Google Scholar]
- 3.Liang J, Piao Y, Holmes L, Fuller GN, Henry V, Tiao N, and de Groot JF (2014). Neutrophils promote the malignant glioma phenotype through S100A4. Clin Cancer Res 20, 187–198. 10.1158/1078-0432.CCR-13-1279. [DOI] [PMC free article] [PubMed] [Google Scholar]
- 4.Raychaudhuri B, Rayman P, Huang P, Grabowski M, Hambardzumyan D, Finke JH, and Vogelbaum MA (2015). Myeloid derived suppressor cell infiltration of murine and human gliomas is associated with reduction of tumor infiltrating lymphocytes. J Neurooncol 122, 293–301. 10.1007/s11060-015-1720-6. [DOI] [PubMed] [Google Scholar]
- 5.Singhal S, Bhojnagarwala PS, O’Brien S, Moon EK, Garfall AL, Rao AS, Quatromoni JG, Stephen TL, Litzky L, Deshpande C, et al. (2016). Origin and Role of a Subset of Tumor-Associated Neutrophils with Antigen-Presenting Cell Features in Early-Stage Human Lung Cancer. Cancer Cell 30, 120–135. 10.1016/j.ccell.2016.06.001. [DOI] [PMC free article] [PubMed] [Google Scholar]
- 6.Bambury RM, Teo MY, Power DG, Yusuf A, Murray S, Battley JE, Drake C, O’Dea P, Bermingham N, Keohane C, et al. (2013). The association of pre-treatment neutrophil to lymphocyte ratio with overall survival in patients with glioblastoma multiforme. J Neurooncol 114, 149–154. 10.1007/s11060-013-1164-9. [DOI] [PubMed] [Google Scholar]
- 7.Chongsathidkiet P, Jackson C, Koyama S, Loebel F, Cui X, Farber SH, Woroniecka K, Elsamadicy AA, Dechant CA, Kemeny HR, et al. (2018). Sequestration of T cells in bone marrow in the setting of glioblastoma and other intracranial tumors. Nat Med 24, 1459–1468. 10.1038/s41591-018-0135-2. [DOI] [PMC free article] [PubMed] [Google Scholar]
- 8.Calabrese C, Poppleton H, Kocak M, Hogg TL, Fuller C, Hamner B, Oh EY, Gaber MW, Finklestein D, Allen M, et al. (2007). A perivascular niche for brain tumor stem cells. Cancer Cell 11, 69–82. 10.1016/j.ccr.2006.11.020. [DOI] [PubMed] [Google Scholar]
- 9.Dransfield I, Stocks SC, and Haslett C (1995). Regulation of Cell Adhesion Molecule Expression and Function Associated With Neutrophil Apoptosis. Blood 85, 3264–3273. 10.1182/blood.V85.11.3264.bloodjournal85113264. [DOI] [PubMed] [Google Scholar]
- 10.Nitta T, Sato K, Allegretta M, Brocke S, Lim M, Mitchell DJ, and Steinman L (1992). Expression of granulocyte colony stimulating factor and granulocyte-macrophage colony stimulating factor genes in human astrocytoma cell lines and in glioma specimens. Brain Res 571, 19–25. 10.1016/0006-8993(92)90505-4. [DOI] [PubMed] [Google Scholar]
- 11.Moulding DA, Hart CA, and Edwards SW (1999). Regulation of neutrophil FcgammaRIIIb (CD16) surface expression following delayed apoptosis in response to GM-CSF and sodium butyrate. J Leukoc Biol 65, 875–882. 10.1002/jlb.65.6.875. [DOI] [PubMed] [Google Scholar]
- 12.Fridlender ZG, Sun J, Kim S, Kapoor V, Cheng G, Ling L, Worthen GS, and Albelda SM (2009). Polarization of tumor-associated neutrophil phenotype by TGF-beta: “N1” versus “N2” TAN. Cancer Cell 16, 183–194. 10.1016/j.ccr.2009.06.017. [DOI] [PMC free article] [PubMed] [Google Scholar]
- 13.Pylaeva E, Korschunow G, Spyra I, Bordbari S, Siakaeva E, Ozel I, Domnich M, Squire A, Hasenberg A, Thangavelu K, et al. (2022). During early stages of cancer, neutrophils initiate anti-tumor immune responses in tumor-draining lymph nodes. Cell Rep 40, 111171. 10.1016/j.celrep.2022.111171. [DOI] [PubMed] [Google Scholar]
- 14.Bain BJ (2017). 5 - Blood Cell Morphology in Health and Disease. In Dacie and Lewis Practical Haematology (Twelfth Edition), Bain BJ, Bates I, and Laffan MA, eds. (Elsevier; ), pp. 61–92. 10.1016/B978-0-7020-6696-2.00005-9. [DOI] [Google Scholar]
- 15.Ashtekar AR, and Saha B (2003). Poly’s plea: membership to the club of APCs. Trends Immunol 24, 485–490. 10.1016/s1471-4906(03)00235-7. [DOI] [PubMed] [Google Scholar]
- 16.Boivin G, Faget J, Ancey PB, Gkasti A, Mussard J, Engblom C, Pfirschke C, Contat C, Pascual J, Vazquez J, et al. (2020). Durable and controlled depletion of neutrophils in mice. Nat Commun 11, 2762. 10.1038/s41467-020-16596-9. [DOI] [PMC free article] [PubMed] [Google Scholar]
- 17.Magod P, Mastandrea I, Rousso-Noori L, Agemy L, Shapira G, Shomron N, and Friedmann-Morvinski D (2021). Exploring the longitudinal glioma microenvironment landscape uncovers reprogrammed pro-tumorigenic neutrophils in the bone marrow. Cell Rep 36, 109480. 10.1016/j.celrep.2021.109480. [DOI] [PubMed] [Google Scholar]
- 18.Mensurado S, Rei M, Lanca T, Ioannou M, Goncalves-Sousa N, Kubo H, Malissen M, Papayannopoulos V, Serre K, and Silva-Santos B (2018). Tumor-associated neutrophils suppress pro-tumoral IL-17+ gammadelta T cells through induction of oxidative stress. PLoS Biol 16, e2004990. 10.1371/journal.pbio.2004990. [DOI] [PMC free article] [PubMed] [Google Scholar]
- 19.Kalyan S, and Kabelitz D (2014). When neutrophils meet T cells: beginnings of a tumultuous relationship with underappreciated potential. Eur J Immunol 44, 627–633. 10.1002/eji.201344195. [DOI] [PubMed] [Google Scholar]
- 20.Oberg HH, Wesch D, Kalyan S, and Kabelitz D (2019). Regulatory Interactions Between Neutrophils, Tumor Cells and T Cells. Frontiers in Immunology 10, 1690. ARTN 1690 10.3389/fimmu.2019.01690. [DOI] [PMC free article] [PubMed] [Google Scholar]
- 21.Sabbione F, Gabelloni ML, Ernst G, Gori MS, Salamone G, Oleastro M, Trevani A, Geffner J, and Jancic CC (2014). Neutrophils suppress gammadelta T-cell function. Eur J Immunol 44, 819–830. 10.1002/eji.201343664. [DOI] [PubMed] [Google Scholar]
- 22.Ng SS, De Labastida Rivera F, Yan J, Corvino D, Das I, Zhang P, Kuns R, Chauhan SB, Hou J, Li XY, et al. (2020). The NK cell granule protein NKG7 regulates cytotoxic granule exocytosis and inflammation. Nat Immunol 21, 1205–1218. 10.1038/s41590-020-0758-6. [DOI] [PMC free article] [PubMed] [Google Scholar]
- 23.Jorgovanovic D, Song M, Wang L, and Zhang Y (2020). Roles of IFN-gamma in tumor progression and regression: a review. Biomark Res 8, 49. 10.1186/s40364-020-00228-x. [DOI] [PMC free article] [PubMed] [Google Scholar]
- 24.Wan CK, Andraski AB, Spolski R, Li P, Kazemian M, Oh J, Samsel L, Swanson PA 2nd, McGavern DB, Sampaio EP, et al. (2015). Opposing roles of STAT1 and STAT3 in IL-21 function in CD4+ T cells. Proc Natl Acad Sci U S A 112, 9394–9399. 10.1073/pnas.1511711112. [DOI] [PMC free article] [PubMed] [Google Scholar]
- 25.Takashima A, and Yao Y (2015). Neutrophil plasticity: acquisition of phenotype and functionality of antigen-presenting cell. J Leukoc Biol 98, 489–496. 10.1189/jlb.1MR1014-502R. [DOI] [PubMed] [Google Scholar]
- 26.Zhao T, Jiang Q, Li W, Wang Y, Zou Y, Chai X, Yuan Z, Ma L, Yu R, Deng T, et al. (2022). Antigen-Presenting Cell-Like Neutrophils Foster T Cell Response in Hyperlipidemic Patients and Atherosclerotic Mice. Front Immunol 13, 851713. 10.3389/fimmu.2022.851713. [DOI] [PMC free article] [PubMed] [Google Scholar]
- 27.Cheng L, Yu H, Yan N, Lai K, and Xiang M (2017). Hypoxia-Inducible Factor-1alpha Target Genes Contribute to Retinal Neuroprotection. Front Cell Neurosci 11, 20. 10.3389/fncel.2017.00020. [DOI] [PMC free article] [PubMed] [Google Scholar]
- 28.Lopez-Bertoni H, Johnson A, Rui Y, Lal B, Sall S, Malloy M, Coulter JB, Lugo-Fagundo M, Shudir S, Khela H, et al. (2022). Sox2 induces glioblastoma cell stemness and tumor propagation by repressing TET2 and deregulating 5hmC and 5mC DNA modifications. Signal Transduct Target Ther 7, 37. 10.1038/s41392-021-00857-0. [DOI] [PMC free article] [PubMed] [Google Scholar]
- 29.Wang P, Zhao L, Gong S, Xiong S, Wang J, Zou D, Pan J, Deng Y, Yan Q, Wu N, and Liao B (2021). HIF1alpha/HIF2alpha-Sox2/Klf4 promotes the malignant progression of glioblastoma via the EGFR-PI3K/AKT signalling pathway with positive feedback under hypoxia. Cell Death Dis 12, 312. 10.1038/s41419-021-03598-8. [DOI] [PMC free article] [PubMed] [Google Scholar]
- 30.Garros-Regulez L, Garcia I, Carrasco-Garcia E, Lantero A, Aldaz P, Moreno-Cugnon L, Arrizabalaga O, Undabeitia J, Torres-Bayona S, Villanua J, et al. (2016). Targeting SOX2 as a Therapeutic Strategy in Glioblastoma. Front Oncol 6, 222. 10.3389/fonc.2016.00222. [DOI] [PMC free article] [PubMed] [Google Scholar]
- 31.Pauklin S, and Vallier L (2015). Activin/Nodal signalling in stem cells. Development 142, 607–619. 10.1242/dev.091769. [DOI] [PubMed] [Google Scholar]
- 32.Soeda A, Park M, Lee D, Mintz A, Androutsellis-Theotokis A, McKay RD, Engh J, Iwama T, Kunisada T, Kassam AB, et al. (2009). Hypoxia promotes expansion of the CD133-positive glioma stem cells through activation of HIF-1alpha. Oncogene 28, 3949–3959. 10.1038/onc.2009.252. [DOI] [PubMed] [Google Scholar]
- 33.Kim Y, Kim E, Wu Q, Guryanova O, Hitomi M, Lathia JD, Serwanski D, Sloan AE, Weil RJ, Lee J, et al. (2012). Platelet-derived growth factor receptors differentially inform intertumoral and intratumoral heterogeneity. Genes Dev 26, 1247–1262. 10.1101/gad.193565.112. [DOI] [PMC free article] [PubMed] [Google Scholar]
- 34.Anselmi M, Fontana F, Marzagalli M, Gagliano N, Sommariva M, and Limonta P (2022). Melanoma Stem Cells Educate Neutrophils to Support Cancer Progression. Cancers (Basel) 14. 10.3390/cancers14143391. [DOI] [PMC free article] [PubMed] [Google Scholar]
- 35.Matsushima H, Geng S, Lu R, Okamoto T, Yao Y, Mayuzumi N, Kotol PF, Chojnacki BJ, Miyazaki T, Gallo RL, and Takashima A (2013). Neutrophil differentiation into a unique hybrid population exhibiting dual phenotype and functionality of neutrophils and dendritic cells. Blood 121, 1677–1689. 10.1182/blood-2012-07-445189. [DOI] [PMC free article] [PubMed] [Google Scholar]
- 36.Pietras A, Katz AM, Ekstrom EJ, Wee B, Halliday JJ, Pitter KL, Werbeck JL, Amankulor NM, Huse JT, and Holland EC (2014). Osteopontin-CD44 signaling in the glioma perivascular niche enhances cancer stem cell phenotypes and promotes aggressive tumor growth. Cell Stem Cell 14, 357–369. 10.1016/j.stem.2014.01.005. [DOI] [PMC free article] [PubMed] [Google Scholar]
- 37.Grieshaber-Bouyer R, Radtke FA, Cunin P, Stifano G, Levescot A, Vijaykumar B, Nelson-Maney N, Blaustein RB, Monach PA, Nigrovic PA, and ImmGen C (2021). The neutrotime transcriptional signature defines a single continuum of neutrophils across biological compartments. Nat Commun 12, 2856. 10.1038/s41467-021-22973-9. [DOI] [PMC free article] [PubMed] [Google Scholar]
- 38.Wang X, and Chen D (2018). Purinergic Regulation of Neutrophil Function. Front Immunol 9, 399. 10.3389/fimmu.2018.00399. [DOI] [PMC free article] [PubMed] [Google Scholar]
- 39.Minns D, Smith KJ, Hardisty G, Rossi AG, and Gwyer Findlay E (2021). The Outcome of Neutrophil-T Cell Contact Differs Depending on Activation Status of Both Cell Types. Front Immunol 12, 633486. 10.3389/fimmu.2021.633486. [DOI] [PMC free article] [PubMed] [Google Scholar]
- 40.Wei J, Wei C, Wang M, Qiu X, Li Y, Yuan Y, Jin C, Leng L, Wang J, Yang X, and He F (2014). The GTPase-activating protein GIT2 protects against colitis by negatively regulating Toll-like receptor signaling. Proc Natl Acad Sci U S A 111, 8883–8888. 10.1073/pnas.1309218111. [DOI] [PMC free article] [PubMed] [Google Scholar]
- 41.Xie X, Shi Q, Wu P, Zhang X, Kambara H, Su J, Yu H, Park SY, Guo R, Ren Q, et al. (2020). Single-cell transcriptome profiling reveals neutrophil heterogeneity in homeostasis and infection. Nat Immunol 21, 1119–1133. 10.1038/s41590-020-0736-z. [DOI] [PMC free article] [PubMed] [Google Scholar]
- 42.Evrard M, Kwok IWH, Chong SZ, Teng KWW, Becht E, Chen J, Sieow JL, Penny HL, Ching GC, Devi S, et al. (2018). Developmental Analysis of Bone Marrow Neutrophils Reveals Populations Specialized in Expansion, Trafficking, and Effector Functions. Immunity 48, 364–379 e368. 10.1016/j.immuni.2018.02.002. [DOI] [PubMed] [Google Scholar]
- 43.Hallek M, Lepisto E, Slattery K, Griffin J, and Ernst T (1992). Interferon-gamma increases the expression of the gene encoding the beta subunit of the granulocyte-macrophage colony-stimulating factor receptor. Blood 80, 1736–1742. 10.1182/blood.V80.7.1736.1736. [DOI] [PubMed] [Google Scholar]
- 44.Spolski R, West EE, Li P, Veenbergen S, Yung S, Kazemian M, Oh J, Yu ZX, Freeman AF, Holland SM, et al. (2019). IL-21/type I interferon interplay regulates neutrophil-dependent innate immune responses to Staphylococcus aureus. Elife 8. 10.7554/eLife.45501. [DOI] [PMC free article] [PubMed] [Google Scholar]
- 45.Cao H, Cao B, Heazlewood CK, Domingues M, Sun X, Debele E, McGregor NE, Sims NA, Heazlewood SY, and Nilsson SK (2019). Osteopontin is An Important Regulative Component of the Fetal Bone Marrow Hematopoietic Stem Cell Niche. Cells 8. 10.3390/cells8090985. [DOI] [PMC free article] [PubMed] [Google Scholar]
- 46.Jalili A, Marquez-Curtis L, Shirvaikar N, Wysoczynski M, Ratajczak M, and Janowska-Wieczorek A (2010). Complement C1q enhances homing-related responses of hematopoietic stem/progenitor cells. Transfusion 50, 2002–2010. 10.1111/j.1537-2995.2010.02664.x. [DOI] [PMC free article] [PubMed] [Google Scholar]
- 47.Herisson F, Frodermann V, Courties G, Rohde D, Sun Y, Vandoorne K, Wojtkiewicz GR, Masson GS, Vinegoni C, Kim J, et al. (2018). Direct vascular channels connect skull bone marrow and the brain surface enabling myeloid cell migration. Nat Neurosci 21, 1209–1217. 10.1038/s41593-018-0213-2. [DOI] [PMC free article] [PubMed] [Google Scholar]
- 48.Cugurra A, Mamuladze T, Rustenhoven J, Dykstra T, Beroshvili G, Greenberg ZJ, Baker W, Papadopoulos Z, Drieu A, Blackburn S, et al. (2021). Skull and vertebral bone marrow are myeloid cell reservoirs for the meninges and CNS parenchyma. Science 373. 10.1126/science.abf7844. [DOI] [PMC free article] [PubMed] [Google Scholar]
- 49.Yee PP, Wei Y, Kim SY, Lu T, Chih SY, Lawson C, Tang M, Liu Z, Anderson B, Thamburaj K, et al. (2020). Neutrophil-induced ferroptosis promotes tumor necrosis in glioblastoma progression. Nat Commun 11, 5424. 10.1038/s41467-020-19193-y. [DOI] [PMC free article] [PubMed] [Google Scholar]
- 50.Merad M, Sathe P, Helft J, Miller J, and Mortha A (2013). The dendritic cell lineage: ontogeny and function of dendritic cells and their subsets in the steady state and the inflamed setting. Annu Rev Immunol 31, 563–604. 10.1146/annurev-immunol-020711-074950. [DOI] [PMC free article] [PubMed] [Google Scholar]
- 51.Naik SH, Sathe P, Park HY, Metcalf D, Proietto AI, Dakic A, Carotta S, O’Keeffe M, Bahlo M, Papenfuss A, et al. (2007). Development of plasmacytoid and conventional dendritic cell subtypes from single precursor cells derived in vitro and in vivo. Nat Immunol 8, 1217–1226. 10.1038/ni1522. [DOI] [PubMed] [Google Scholar]
- 52.Sichien D, Lambrecht BN, Guilliams M, and Scott CL (2017). Development of conventional dendritic cells: from common bone marrow progenitors to multiple subsets in peripheral tissues. Mucosal Immunol 10, 831–844. 10.1038/mi.2017.8. [DOI] [PubMed] [Google Scholar]
- 53.Patente TA, Pinho MP, Oliveira AA, Evangelista GCM, Bergami-Santos PC, and Barbuto JAM (2018). Human Dendritic Cells: Their Heterogeneity and Clinical Application Potential in Cancer Immunotherapy. Front Immunol 9, 3176. 10.3389/fimmu.2018.03176. [DOI] [PMC free article] [PubMed] [Google Scholar]
- 54.Xiao Z, Mescher MF, and Jameson SC (2007). Detuning CD8 T cells: down-regulation of CD8 expression, tetramer binding, and response during CTL activation. J Exp Med 204, 2667–2677. 10.1084/jem.20062376. [DOI] [PMC free article] [PubMed] [Google Scholar]
- 55.Iking-Konert C, Ostendorf B, Sander O, Jost M, Wagner C, Joosten L, Schneider M, and Hansch GM (2005). Transdifferentiation of polymorphonuclear neutrophils to dendritic-like cells at the site of inflammation in rheumatoid arthritis: evidence for activation by T cells. Ann Rheum Dis 64, 1436–1442. 10.1136/ard.2004.034132. [DOI] [PMC free article] [PubMed] [Google Scholar]
- 56.Chen N, Alieva M, van der Most T, Klazen JAZ, Vollmann-Zwerenz A, Hau P, and Vrisekoop N (2022). Neutrophils Promote Glioblastoma Tumor Cell Migration after Biopsy. Cells 11. 10.3390/cells11142196. [DOI] [PMC free article] [PubMed] [Google Scholar]
- 57.Alghamri MS, McClellan BL, Avvari RP, Thalla R, Carney S, Hartlage CS, Haase S, Ventosa M, Taher A, Kamran N, et al. (2021). G-CSF secreted by mutant IDH1 glioma stem cells abolishes myeloid cell immunosuppression and enhances the efficacy of immunotherapy. Sci Adv 7, eabh3243. 10.1126/sciadv.abh3243. [DOI] [PMC free article] [PubMed] [Google Scholar]
- 58.Jeon HY, Ham SW, Kim JK, Jin X, Lee SY, Shin YJ, Choi CY, Sa JK, Kim SH, Chun T, et al. (2019). Ly6G(+) inflammatory cells enable the conversion of cancer cells to cancer stem cells in an irradiated glioblastoma model. Cell Death Differ 26, 2139–2156. 10.1038/s41418-019-0282-0. [DOI] [PMC free article] [PubMed] [Google Scholar]
- 59.Wang PF, Zhang YX, Su J, Yao K, Li SW, Huang GR, and Yan CX (2020). Neutrophil depletion enhances the therapeutic effect of PD-1 antibody on glioma. Aging (Albany NY) 12, 15290–15301. 10.18632/aging.103428. [DOI] [PMC free article] [PubMed] [Google Scholar]
- 60.Fujita M, Scheurer ME, Decker SA, McDonald HA, Kohanbash G, Kastenhuber ER, Kato H, Bondy ML, Ohlfest JR, and Okada H (2010). Role of type 1 IFNs in antiglioma immunosurveillance--using mouse studies to guide examination of novel prognostic markers in humans. Clin Cancer Res 16, 3409–3419. 10.1158/1078-0432.CCR-10-0644. [DOI] [PMC free article] [PubMed] [Google Scholar]
- 61.Woroniecka K, Chongsathidkiet P, Rhodin K, Kemeny H, Dechant C, Farber SH, Elsamadicy AA, Cui X, Koyama S, Jackson C, et al. (2018). T-Cell Exhaustion Signatures Vary with Tumor Type and Are Severe in Glioblastoma. Clin Cancer Res 24, 4175–4186. 10.1158/1078-0432.CCR-17-1846. [DOI] [PMC free article] [PubMed] [Google Scholar]
- 62.Xue R, Zhang Q, Cao Q, Kong R, Xiang X, Liu H, Feng M, Wang F, Cheng J, Li Z, et al. (2022). Liver tumour immune microenvironment subtypes and neutrophil heterogeneity. Nature 612, 141–147. 10.1038/s41586-022-05400-x. [DOI] [PubMed] [Google Scholar]
- 63.Salcher S, Sturm G, Horvath L, Untergasser G, Kuempers C, Fotakis G, Panizzolo E, Martowicz A, Trebo M, Pall G, et al. (2022). High-resolution single-cell atlas reveals diversity and plasticity of tissue-resident neutrophils in non-small cell lung cancer. Cancer Cell 40, 1503–1520 e1508. 10.1016/j.ccell.2022.10.008. [DOI] [PMC free article] [PubMed] [Google Scholar]
- 64.Hegde S, Leader AM, and Merad M (2021). MDSC: Markers, development, states, and unaddressed complexity. Immunity 54, 875–884. 10.1016/j.immuni.2021.04.004. [DOI] [PMC free article] [PubMed] [Google Scholar]
- 65.Khan S, Mittal S, McGee K, Alfaro-Munoz KD, Majd N, Balasubramaniyan V, and de Groot JF (2020). Role of Neutrophils and Myeloid-Derived Suppressor Cells in Glioma Progression and Treatment Resistance. Int J Mol Sci 21. 10.3390/ijms21061954. [DOI] [PMC free article] [PubMed] [Google Scholar]
- 66.Veglia F, Sanseviero E, and Gabrilovich DI (2021). Myeloid-derived suppressor cells in the era of increasing myeloid cell diversity. Nat Rev Immunol 21, 485–498. 10.1038/s41577-020-00490-y. [DOI] [PMC free article] [PubMed] [Google Scholar]
- 67.Kilian M, Sheinin R, Tan CL, Friedrich M, Kramer C, Kaminitz A, Sanghvi K, Lindner K, Chih YC, Cichon F, et al. (2023). MHC class II-restricted antigen presentation is required to prevent dysfunction of cytotoxic T cells by blood-borne myeloids in brain tumors. Cancer Cell 41, 235–251 e239. 10.1016/j.ccell.2022.12.007. [DOI] [PubMed] [Google Scholar]
- 68.Brioschi S, Wang WL, Peng V, Wang M, Shchukina I, Greenberg ZJ, Bando JK, Jaeger N, Czepielewski RS, Swain A, et al. (2021). Heterogeneity of meningeal B cells reveals a lymphopoietic niche at the CNS borders. Science 373. 10.1126/science.abf9277. [DOI] [PMC free article] [PubMed] [Google Scholar]
- 69.Pulous FE, Cruz-Hernandez JC, Yang C, Kaya Z, Paccalet A, Wojtkiewicz G, Capen D, Brown D, Wu JW, Schloss MJ, et al. (2022). Cerebrospinal fluid can exit into the skull bone marrow and instruct cranial hematopoiesis in mice with bacterial meningitis. Nat Neurosci 25, 567–576. 10.1038/s41593-022-01060-2. [DOI] [PMC free article] [PubMed] [Google Scholar]
- 70.Roth TL, Nayak D, Atanasijevic T, Koretsky AP, Latour LL, and McGavern DB (2014). Transcranial amelioration of inflammation and cell death after brain injury. Nature 505, 223–228. 10.1038/nature12808. [DOI] [PMC free article] [PubMed] [Google Scholar]
- 71.Heffron DS, and Mandell JW (2005). Opposing roles of ERK and p38 MAP kinases in FGF2-induced astroglial process extension. Mol Cell Neurosci 28, 779–790. 10.1016/j.mcn.2004.12.010. [DOI] [PubMed] [Google Scholar]
- 72.Castroagudin MR, Zhai Y, Li Z, Marnell MG, and Glavy JS (2016). Cyto-3D-print to attach mitotic cells. Cytotechnology 68, 1641–1645. 10.1007/s10616-015-9917-2. [DOI] [PMC free article] [PubMed] [Google Scholar]
- 73.McGill CJ, Lu RJ, and Benayoun BA (2021). Protocol for analysis of mouse neutrophil NETosis by flow cytometry. STAR Protoc 2, 100948. 10.1016/j.xpro.2021.100948. [DOI] [PMC free article] [PubMed] [Google Scholar]
Associated Data
This section collects any data citations, data availability statements, or supplementary materials included in this article.
Supplementary Materials
Table S7 (related to Fig. 4): scRNA-seq of Patient Neutrophils, scVelo Dynamically Expressed Genes.
Data Availability Statement
Deidentified human patient single-cell RNA-seq data reported in this study have been deposited at GEO and accession numbers are listed in the key resources table. They are publicly available as of the publication date. Summary statistics describing these data have been deposited at GEO and are publicly available as of the publication date.
All original code has been uploaded to FigShare and is publicly available as of the date of publication. DOIs are listed in the key resources table.
Any additional information required to reanalyze the data in this paper is available from the lead contact upon request.
Key resources table
| REAGENT or RESOURCE | SOURCE | IDENTIFIER |
|---|---|---|
| Antibodies | ||
| Anti-human CD10 FITC (clone HI10a) | Biolegend | Cat#312207 RRID:AB_314918 |
| Anti-human CD101 PE (clone BB27) | Biolegend | Cat#331011 RRID:AB_2716106 |
| Anti-human CD11c PE (clone 3.9) | Biolegend | Cat#301605 RRID:AB_314175 |
| Anti-human CD14 APC (clone M5E2) | Biolegend | Cat#301807 RRID:AB_314189 |
| Anti-human CD14 BV785 (clone M5E2) | Biolegend | Cat#301839 RRID:AB_2561366 |
| Anti-human CD15 BV605 (clone W6D3) | Biolegend | Cat#323031 RRID:AB_2562131 |
| Anti-human CD15 BV650 (clone W6D3) | Biolegend | Cat#323033 RRID:AB_2562499 |
| Anti-human CD16 APC (clone 3G8) | Biolegend | Cat#302011 RRID:AB_314211 |
| Anti-human CD16 APC/Cy7 (clone 3G8) | Biolegend | Cat#302017 RRID:AB_314217 |
| Anti-human CD19 APC (clone HIB19) | Biolegend | Cat#302211 RRID:AB_314241 |
| Anti-human CD206 Alexa Fluor 700 (clone 15-2) | Biolegend | Cat#321131 RRID:AB_2616868 |
| Anti-human CD25 APC/Fire 810 (clone M-A251) | Biolegend | Cat#356149 RRID:AB_2876679 |
| Anti-human CD25 PE/Dazzle 594 (clone M-A251) | Biolegend | Cat#356125 RRID:AB_2563561 |
| Anti-human CD3 BV421 (clone UCHT1) | Biolegend | Cat#300433 RRID:AB_10897105 |
| Anti-human CD31 (polyclonal) | Abcam | Cat#ab28364 RRID:AB_726362 |
| Anti-human CD4 BV711 (clone OKT4) | Biolegend | Cat#317439 RRID:AB_11219404 |
| Anti-human CD4 PE/Fire 700 (clone SK3) | Biolegend | Cat#344665 RRID:AB_2876651 |
| Anti-human CD45 APC/Cy7 (clone 2D1) | Biolegend | Cat#368515 RRID:AB_2566375 |
| Anti-human CD45 BV711 (clone HI30) | Biolegend | Cat#304049 RRID:AB_2563465 |
| Anti-human CD49d PerCP/Cy5.5 (clone 9F10) | Biolegend | Cat#304311 RRID:AB_10640735 |
| Anti-human CD56 APC (clone HCD56) | Biolegend | Cat#318309 RRID:AB_604098 |
| Anti-human CD56 PE/Fire 700 (clone QA17A16) | Biolegend | Cat#392427 RRID:AB_2876708 |
| Anti-human CD66b BV421 (clone 6/40c) | Biolegend | Cat#392915 RRID:AB_2888722 |
| Anti-human CD69 BV785 (clone FN50) | Biolegend | Cat#310931 RRID:AB_2561370 |
| Anti-human CD8 APC (clone SK1) | Biolegend | Cat#980904 RRID:AB_2616624 |
| Anti-human CD8 PE/Cy7 (clone SK1) | Biolegend | Cat#344711 RRID:AB_2044007 |
| Anti-human CD8 PE/Dazzle 594 (clone SK1) | Biolegend | Cat#344743 RRID:AB_2566514 |
| Anti-human Fc (clone Fc1) | BD Biosciences | Cat#564219 RRID:AB_2728082 |
| Anti-human GM-CSF (clone BVD2-23B6) | Biolegend | Cat#502201 RRID:AB_315211 |
| Anti-human HLA-DR/DP/DQ (clone Tü39) | Biolegend | Cat#361702 RRID:AB_2563139 |
| Anti-human HLA-DR/DP/DQ APC/Fire 750 (clone Tü39) | Biolegend | Cat#361711 RRID:AB_2750313 |
| Anti-human HLA-DR/DP/DQ FITC (clone Tü39) | Biolegend | Cat#361705 RRID:AB_2563191 |
| Anti-human HLA-DR/DP/DQ PE/Cy7 (clone Tü39) | Biolegend | Cat#361707 RRID:AB_2564278 |
| Anti-human myeloperoxidase (clone 2C7) | Abcam | Cat#ab25989 RRID:AB_448948 |
| Anti-human Nestin (clone 10C2) | Abcam | Cat#ab22035 RRID:AB_446723 |
| Anti-human OPN (polyclonal) | R&D Systems | Cat#AF1433 RRID:AB_354791 |
| Anti-human Siglec8 APC (clone 7C9) | Biolegend | Cat#347105 RRID:AB_2561401 |
| Anti-mouse CD105 (MJ7/18) Alexa Fluor 488 | Biolegend | Cat#120405 RRID:AB_961056 |
| Anti-mouse CD106 (429) Alexa Fluor 488 | Biolegend | Cat#105710 RRID:AB_493427 |
| Anti-mouse CD11c BV605 (clone N418) | Biolegend | Cat#117333 RRID:AB_11204262 |
| Anti-mouse CD11c PE/Cy7 (clone N418) | Biolegend | Cat#117317 RRID:AB_493569 |
| Anti-mouse CD133 (315-2C11) PE/Dazzle 594 | Biolegend | Cat#141211 RRID:AB_2566009 |
| Anti-mouse CD133 APC (clone 315-2C11) | Biolegend | Cat#141207 RRID:AB_10898121 |
| Anti-mouse CD140a (APA5) PE/Cy7 | Biolegend | Cat#135911 RRID:AB_2715973 |
| Anti-mouse CD140b (APB5) APC | Biolegend | Cat#136007 RRID:AB_2043971 |
| Anti-mouse CD16/32 (clone 2.4G2) | BD Biosciences | Cat#553142 RRID:AB_394657 |
| Anti-mouse CD16/32 BV421 (clone 190909) | BD Biosciences | Cat#747952 RRID:AB_2872413 |
| Anti-mouse CD183 (CXCR3) (CXCR3-173) | Biolegend | Cat#126554 RRID:AB_2832456 |
| Anti-mouse CD206 APC (clone C068C2) | Biolegend | Cat#141707 RRID:AB_10896057 |
| Anti-mouse CD206 PE/Cy7 (clone C068C2) | Biolegend | Cat#141719 RRID:AB_2562247 |
| Anti-mouse CD25 APC/Cy7 (clone 3C7) | Biolegend | Cat#101917 RRID:AB_2650981 |
| Anti-mouse CD3 APC (clone 17A2) | Biolegend | Cat#100235 RRID:AB_2561455 |
| Anti-mouse CD3 PE (clone 17A2) | Biolegend | Cat#100205 RRID:AB_312662 |
| Anti-mouse CD31 (390) BV421 | Biolegend | Cat#102423 RRID:AB_2562186 |
| Anti-mouse CD326 (EpCAM) (G8.8) BV650 | Biolegend | Cat#118241 RRID:AB_2876432 |
| Anti-mouse CD4 BV421 (clone GK1.5) | Biolegend | Cat#100437 RRID:AB_10900241 |
| Anti-mouse CD4 BV605 (clone GK1.5) | Biolegend | Cat#100451 RRID:AB_2564591 |
| Anti-mouse CD45 (30-F11) BV510 | Biolegend | Cat#103137 RRID:AB_2561392 |
| Anti-mouse CD45 Alexa Fluor 488 (clone 30-F11) | Biolegend | Cat#103121 RRID:AB_493532 |
| Anti-mouse CD45 Alexa Fluor 700 (clone 30-F11) | Biolegend | Cat#103127 RRID:AB_493714 |
| Anti-mouse CD45 APC/Cy7 (clone 30-F11) | Biolegend | Cat#103115 RRID:AB_312980 |
| Anti-mouse CD45 FITC (clone I3/2.3) | Biolegend | Cat#147709 RRID:AB_2563541 |
| Anti-mouse CD45 PerCP/Cy5.5 (clone 30-F11) | Biolegend | Cat#103131 RRID:AB_893344 |
| Anti-mouse CD62L Alexa Fluor 488 (clone MEL-14) | Biolegend | Cat#104419 RRID:AB_493377 |
| Anti-mouse CD62L PE/Cy7 (clone MEL-14) | Biolegend | Cat#104417 RRID:AB_313102 |
| Anti-mouse CD69 APC (clone H1.2F3) | Biolegend | Cat#104513 RRID:AB_492844 |
| Anti-mouse CD69 PE/Cy7 (clone H1.2F3) | Biolegend | Cat#104511 RRID:AB_493565 |
| Anti-mouse CD8a BV711 (clone 53-6.7) | Biolegend | Cat#100747 RRID:AB_11219594 |
| Anti-mouse CD8a PE (clone 53-6.7) | Biolegend | Cat#100707 RRID:AB_312746 |
| Anti-mouse CD8a PE/Cy7 (clone 53-6.7) | Biolegend | Cat#100721 RRID:AB_312760 |
| Anti-mouse CD90.2 APC (clone 30-H12) | Biolegend | Cat#105311 RRID:AB_313182 |
| Anti-mouse CD90.2 APC/Cy7 (clone 30-H12) | Biolegend | Cat#105327 RRID:AB_10613280 |
| Anti-mouse c-Kit Alexa Fluor 488 (clone 2B8) | Biolegend | Cat#105815 RRID:AB_493473 |
| Anti-mouse c-Kit PE (clone 2B8) | Biolegend | Cat#105807 RRID:AB_313216 |
| Anti-mouse c-Kit PE/Dazzle 594 (clone 2B8) | Biolegend | Cat#105833 RRID:AB_2564054 |
| Anti-mouse CSF1R APC/Cy7 (clone AFS98) | Biolegend | Cat#135531 RRID:AB_2632739 |
| Anti-mouse CSF1R BV605 (clone AFS98) | Biolegend | Cat#135517 RRID:AB_2562760 |
| Anti-mouse CSF1R PE (clone AFS98) | Biolegend | Cat#135505 RRID:AB_1937254 |
| Anti-mouse CSF1R PE/Cy7 (clone AFS98) | Biolegend | Cat#135523 RRID:AB_2566459 |
| Anti-mouse CSF1R PE/Dazzle 594 (clone AFS98) | Biolegend | Cat#135527 RRID:AB_2566522 |
| Anti-mouse CX3CR1 Alexa Fluor 647 (clone SA011F11) | Biolegend | Cat#848003 RRID:AB_2721644 |
| Anti-mouse CX3CR1 BV711 (clone SA011F11) | Biolegend | Cat#149031 RRID:AB_2565939 |
| Anti-mouse CXCR2 BV421 (clone V48-2310) | BD Biosciences | Cat#566622 RRID:AB_2864336 |
| Anti-mouse CXCR2 BV605 (clone V48-2310) | BD Biosciences | Cat#747814 RRID:AB_2872278 |
| Anti-mouse CXCR2 PE (clone SA044G4) | Biolegend | Cat#149303 RRID:AB_2565691 |
| Anti-mouse CXCR2 PerCP/Cy5.5 (clone SA044G4) | Biolegend | Cat#149307 RRID:AB_2565695 |
| Anti-mouse F4/80 BV650 (clone BM8) | Biolegend | Cat#123149 RRID:AB_2564589 |
| Anti-mouse GM-CSF (MP1-22E9) | Biolegend | Cat#505415 RRID:AB_2810635 |
| Anti-mouse Gr-1 Alexa Fluor 488 (clone RB6-8C5) | Biolegend | Cat#108419 RRID:AB_493480 |
| Anti-mouse Gr-1 Alexa Fluor 700 (clone RB6-8C5) | Biolegend | Cat#108421 RRID:AB_493728 |
| Anti-mouse Gr-1 PE (clone RB6-8C5) | Biolegend | Cat#108407 RRID:AB_313372 |
| Anti-mouse Gr-1 PE/Dazzle 594 (clone RB6-8C5) | Biolegend | Cat#108451 RRID:AB_2564248 |
| Anti-mouse Gr-1 PerCP/Cy5.5 (clone RB6-8C5) | Biolegend | Cat#108427 RRID:AB_893561 |
| Anti-mouse HLA-IA/E AF488 (clone M5/114.15.2) | Biolegend | Cat#107615 RRID:AB_493524 |
| Anti-mouse HLA-IA/E BV785 (clone M5/114.15.2) | Biolegend | Cat#107645 RRID:AB_2565977 |
| Anti-mouse HLA-IA/E PE (clone M5/114.15.2) | Biolegend | Cat#107607 RRID:AB_313322 |
| Anti-mouse IFN-γ (XMG1.2) | Biolegend | Cat#505833 RRID:AB_11147371 |
| Anti-mouse IFN-γ BV421 (clone XMG1.2) | Biolegend | Cat#505829 RRID:AB_10897937 |
| Anti-mouse IL-10 (1B1.3a) | Biolegend | Cat#504907 RRID:AB_2810629 |
| Anti-mouse IL-12/IL-23 p40 (C17.8) | Biolegend | Cat#505307 RRID:AB_11150770 |
| Anti-mouse IL21 (S20017B) | Biolegend | Cat#122202 RRID:AB_2941414 |
| Anti-mouse Ly6A/E (Sca1) (D7) BV785 | Biolegend | Cat#108139 RRID:AB_2565957 |
| Anti-mouse Ly6C APC (clone HK1.4) | Biolegend | Cat#128015 RRID:AB_1732087 |
| Anti-mouse Ly6G BV421 (clone 1A8) | Biolegend | Cat#127627 RRID:AB_10897944 |
| Anti-mouse Ly6G PE/Dazzle 594 (clone 1A8) | Biolegend | Cat#127647 RRID:AB_2566318 |
| Anti-mouse Ly6G PerCP/Cy5.5 (clone 1A8) | Biolegend | Cat#127615 RRID:AB_1877272 |
| Anti-mouse NK1.1 APC (clone S17016D) | Biolegend | Cat#156505 RRID:AB_2876525 |
| Anti-mouse NK1.1 APC/Cy7 (clone S17016D) | Biolegend | Cat#156509 RRID:AB_2876527 |
| Anti-mouse P2RY12 PE (clone S16007D) | Biolegend | Cat#848003 RRID:AB_2721644 |
| Anti-mouse Podoplanin (8.1.1) PerCP/Cy5.5 | Biolegend | Cat#127421 RRID:AB_2814015 |
| Anti-mouse SiglecF APC (clone S17007L) | Biolegend | Cat#155507 RRID:AB_2750236 |
| Anti-mouse SiglecF APC/Cy7 (clone S17007L) | Biolegend | Cat#155531 RRID:AB_2904295 |
| Anti-mouse SOX2 PE (clone 14A6A34) | Biolegend | Cat#656103 RRID:AB_2562852 |
| Anti-mouse/human B220 APC (clone RA3-6B2) | Biolegend | Cat#103211 RRID:AB_312996 |
| Anti-mouse/human B220 APC/Cy7 (clone RA3-6B2) | Biolegend | Cat#103223 RRID:AB_313006 |
| Anti-mouse/human CD11b APC (M1/70) | Biolegend | Cat#101211 RRID:AB_2044007 |
| Anti-mouse/human CD11b APC/Cy7 (clone M1/70) | Biolegend | Cat#101225 RRID:AB_830641 |
| Anti-mouse/human CD11b BV421 (clone M1/70) | Biolegend | Cat#101235 RRID:AB_10897942 |
| Anti-mouse/human CD11b FITC (clone M1/70) | Biolegend | Cat#101205 RRID:AB_312788 |
| Anti-mouse/human CD11b PE (clone M1/70) | Biolegend | Cat#101207 RRID:AB_312790 |
| Anti-mouse/human CD44 Alexa Fluor 488 (clone IM7) | Biolegend | Cat#103015 RRID:AB_493678 |
| Anti-mouse/human CD44 APC (clone IM7) | Biolegend | Cat#103011 RRID:AB_312962 |
| Anti-mouse/human CD44 BV785 (clone IM7) | Biolegend | Cat#103041 RRID:AB_11218802 |
| Donkey anti-Rabbit IgG (H+L) Highly Cross-Adsorbed Secondary Antibody, Alexa Fluor 555 | Thermo Fisher Invitrogen | Cat#A31572 RRID:AB_162543 |
| Goat anti-Mouse IgG (H+L) Superclonal Secondary Antibody, Alexa Fluor 488 | Thermo Fisher Invitrogen | Cat#A28175 RRID:AB_2536161 |
| InVivoMAb anti-mouse CD4 (clone GK1.5) | BioXCell | Cat#BE0003-1 RRID:AB_1107636 |
| InVivoMAb anti-mouse CD8α (clone 53-6.7) | BioXCell | Cat#BE0004-1 RRID:AB_1107671 |
| InVivoMAb anti-mouse CD90.2 (Thy1.2) (clone 30H12) | BioXCell | Cat#BE0066 RRID:AB_1107682 |
| InVivoMAb anti-mouse Ly6G (clone 1A8) | BioXCell | Cat#BE0075-1 RRID:AB_1107721 |
| InVivoMAb rat IgG2a isotype control, anti-trinitrophenol (clone 2A3) | BioXCell | Cat#BE0089 RRID:AB_1107769 |
| InVivoMAb rat IgG2b isotype control, anti-keyhole limpet hemocyanin (clone LTF-2) | BioXCell | Cat#BE0090 RRID:AB_1107780 |
| Isotype, mouse IgG2a κ (clone MOPC-173) | Biolegend | Cat#400202 RRID:AB_2927399 |
| Isotype, normal goat IgG (polyclonal) | R&D Systems | Cat#AB-108-C RRID:AB_354267 |
| Isotype, rat IgG2a κ (clone RTK2758) | Biolegend | Cat#400501 RRID:AB_326523 |
| Biological samples | ||
| Human: Fresh GBM tissue from time of initial resection | UCSF Brain Tumor Center | N/A |
| Human: Patient and control blood | UCSF Brain Tumor Center | N/A |
| Chemicals, peptides, and recombinant proteins | ||
| Accutase Cell Detachment Reagent | Innovative Cell Technologies | Cat#AT104 |
| Alloxate™ (Meloxicam) Solution for Injection 10 ml | Patterson Veterinary Supply | Cat#078931368 |
| AMD3100 octahydrochloride, CXCR4 antagonist | Abcam | Cat#ab120718 CAS: 155148-31-5 |
| Animal-Free Recombinant Human EGF | Peprotech | Cat#AF-100-15 |
| Apotracker™ Green | Biolegend | Cat#427401 |
| Bovine Serum Albumin, heat shock fraction, protease free, low endotoxin, suitable for cell culture, pH 7, ≥98% | Sigma-Aldrich | Cat#A4919 CAS: 9048-46-8 |
| Bupivacaine 0.255, 10ml vials | Patterson Veterinary Supply | Cat#078904881 |
| Buprenex buprenorphine HCL, 0.3 mg/mL | Patterson Veterinary Supply | Cat#078502280 |
| Dimethyl sulfoxide ACS reagent, >=99.9% | Sigma-Aldrich | Cat#472301 CAS: 67-68-5 |
| D-Luciferin, Potassium Salt | Gold Biotechnology | Cat#LUCK-2G CAS: 115144-35-9 |
| DNase 1 100MG | Worthington Biochemical Corporation | Cat#LS002007 |
| Epredia™ Cytoseal™ Mountant 60 | Fisher Scientific | Cat#83104 |
| Gem21 NeuroPlex™ Supplement without Vitamin A | GeminiBio | Cat#400-161-010 |
| Gibco 2-Mercaptoethanol | Thermo Fisher | Cat#21985023 |
| Gibco ACK Lysing Buffer | Thermo Fisher | Cat#A1049201 |
| Gibco Collagenase, Type IV, powder | Thermo Fisher | Cat#17104019 |
| Gibco DMEM, high glucose, no glutamine | Thermo Fisher | Cat#11960044 |
| Gibco DMEM/F-12 | Thermo Fisher | Cat#11320033 |
| Gibco DPBS, no calcium, no magnesium | Thermo Fisher | Cat#14190144 |
| Gibco GlutaMAX™ Supplement | Thermo Fisher | Cat#35050061 |
| Gibco HEPES (1M) | Thermo Fisher | Cat#15630130 |
| Gibco Hibernate™-A Medium | Thermo Fisher | Cat#A1247501 |
| Gibco MEM Non-Essential Amino Acids Solution (100X) | Thermo Fisher | Cat#11140050 |
| Gibco Penicillin-Streptomycin (10,000 U/mL) | Thermo Fisher | Cat#15140122 |
| Gibco RPMI 1640 Medium | Thermo Fisher | Cat#11875093 |
| Gibco Sodium Pyruvate (100 mM) | Thermo Fisher | Cat#11360070 |
| Gibco TrypLE™ Express Enzyme (1X), phenol red | Thermo Fisher | Cat#12605010 |
| ImmunoCult™ Human CD3/CD28 T Cell Activator | Stem Cell | Cat#10971 |
| Invitrogen CellTracker™ Green CMFDA Dye | Thermo Fisher | Cat#C2925 |
| Invitrogen DQ™ Ovalbumin | Thermo Fisher | Cat#D12053 |
| Invitrogen eBioscience™ Lipopolysaccharide (LPS) Solution (500X) | Thermo Fisher | Cat#00-4976-93 |
| Invitrogen SYTOX™ Dead Cell Stain Sampler Kit | Thermo Fisher | Cat#S34862 |
| IRDye® 800CW Streptavidin | LI-COR | Cat#926-32230 |
| Isoflurane, USP Inhalation Anesthetic | Dechra | Cat#DP7000 |
| Liquid Cyanoacrylate Glue | Avantor VWR | Cat# 470024-626 |
| Normal Goat Serum, Unconjugated, 10ml | Jackson Immuno Research Labs | Cat#005000121 |
| OVA 323-339 | InvivoGen | Cat#vac-isq |
| Recombinant Human FGF-basic (154 a.a.) | Peprotech | Cat#100-18B |
| Recombinant mouse IL-2 protein (Active) | Abcam | Cat# ab259380 |
| RICCA Chemical R9380000-500C Wright-Giemsa Stain Mixture | Genesee Scientific | Cat#72-850 CAS: 67-56-1 |
| Scrub Surgical Betadine PVP Iodine 7.5% Pump | Purdue Frederick Co | Cat#67618-151-17 |
| Seradigm Premium Grade Fetal Bovine Serum (FBS) | Avantor VWR | Cat#97068-085 |
| Sodium Chloride 0.9% Injection Preservative Free SDV | Henry Schein | Cat#1049943 |
| Southern Biotech DAPI Fluoromount-G® | Avantor VWR | DAPI Fluoromount-G® |
| Thermo Scientific Chemicals D(+)-Sucrose, 99+%, for biochemistry, DNAse, RNAse and protease free | Thermo Fisher | Cat#419762500 CAS: 57-50-1 |
| Thermo Scientific Chemicals Paraformaldehyde Solution, 4% in PBS | Thermo Fisher | Cat#J19943.K2 |
| Triton™ X-100 | Sigma-Aldrich | Cat#T8787 CAS: 9036-19-5 |
| Zombie Aqua™ Fixable Viability Kit | Biolegend | Cat#423101 |
| Zombie NIR™ Fixable Viability Kit | Biolegend | Cat#423105 |
| Critical commercial assays | ||
| Applied Biosystems PowerUp SYBR Green Master Mix | Thermo Fisher | Cat#A25776 |
| CFSE Cell Division Tracker Kit | Biolegend | Cat#423801 |
| Chromium Next GEM Chip G Single Cell Kit | 10X Genomics | PN-1000127 |
| Chromium Next GEM Single Cell 3’ GEM, Library & Gel Bead Kit v3.1 | 10X Genomics | PN-1000121 |
| EasySep™ Direct Human Neutrophil Isolation Kit | Stem Cell | Cat#19666 |
| EasySep™ Direct Human T Cell Isolation Kit | Stem Cell | Cat#19661 |
| Human Myeloid v2 Primers | Nanotring | Cat#115000177 |
| Human Myeloid v2 Profiling Codeset (XT_PGX_HuV2_Myeloid_CSO) | Nanotring | Cat#115000171 |
| Human Osteopontin (OPN) Quantikine ELISA Kit | R&D Systems | Cat#DOST00 |
| Invitrogen eBioscience™ Foxp3 / Transcription Factor Staining Buffer Set | Thermo Fisher | Cat#00-5523-00 |
| MojoSort™ Mouse CD4 T Cell Isolation Kit | Biolegend | Cat#480005 |
| MojoSort™ Mouse Neutrophil Isolation Kit | Biolegend | Cat#480057 |
| Mouse Tumor 360 Profiling Codeset + Primers (XT Mm Tumor Sig 360 CSO+PS) | Nanotring | Cat#115000426 |
| nCounter Sprint Cartridge | Nanostring | Cat#100078 |
| Proteome Profiler Mouse Cytokine Array Kit, Panel A | R&D Systems | Cat#ARY006 |
| Qiashredder | Qiagen | Cat#78654 |
| qScript™ XLT cDNA SuperMix | Quanta Bio | Cat#95161-500 |
| RNeasy Mini Kit | Qiagen | Cat#74104 |
| Single Index Kit T Set A | 10X Genomics | PN-1000213 |
| Deposited data | ||
| Human GBM PBN scRNAseq dataset | GEO | GSM8380727 |
| Human GBM TAN scRNAseq dataset | GEO | GSM8380728 |
| Human GBM TAN and PBN scRNAseq analysis code | FigShare | DOI: 10.6084 |
| TCGA mRNA normalized and miRNA data | Genomic Data Commons | https://gdc.cancer.gov/about-data/publications/pancanatlas |
| TCGA clinical and subtype data | Genomic Data Commons; Sanchez-Vega et al., 2018; Robertson et al., 2017 | https://gdc.cancer.gov/about-data/publications/pancanatlas |
| Experimental models: Cell lines | ||
| Human: DBTRG-05MG | ATCC | ATCC: CRL-2020 RRID:CVCL_1169 |
| Human: GBM43 | Mayo Clinic Brain Tumor Xenograft National Resource | Human: GBM43 |
| Human: GBM6 | Mayo Clinic Brain Tumor Xenograft National Resource | Human: GBM6 |
| Human: U-251MG | Sigma-Aldrich | Cat#09063001 RRID: CVCL_0021 |
| Mouse: BGL1 | Dr. Hideho Okada, UCSF Ahn et al., 2015 |
N/A |
| Mouse: GL261 | US National Cancer Institute | RRID: CVCL_Y003 |
| Mouse: SB28 | Dr. Hideho Okada, UCSF Genoud et al., 2018 |
N/A |
| Experimental models: Organisms/strains | ||
| Mouse: B6.Cg-Tg(TcraTcrb)425Cbn/J [OT-II] | The Jackson Laboratory | Stock No.: 004194 |
| Mouse: BalbC/J | The Jackson Laboratory | Stock No.: 000651 |
| Mouse: C57BL/6J | The Jackson Laboratory | Stock No.: 000664 |
| Mouse: UBC-GFP: C57BL/6-Tg(UBC-GFP)30Scha/J | Dr. Harold Chapman, Dr. Martin C Valdearcos, and Dr. Suneil Koliwad (UCSF) | N/A |
| Software and algorithms | ||
| BioRender | BioRender.com | https://www.biorender.com/ |
| cellranger | 10X Genomics | https://support.10xgenomics.com/ |
| ClusterExplorer (v1.7.6) | FlowJo Exchange | https://www.flowjo.com/exchange/ |
| clusterProfiler v4.4.4 | N/A | https://bioconductor.org/packages/release/bioc/html/clusterProfiler.html |
| Destiny 3.10.0 | N/A | https://bioconductor.org/packages/release/bioc/html/destiny.html |
| Downsample (v3.3.1) | FlowJo Exchange | https://www.flowjo.com/exchange/ |
| EnhancedVolcano v1.14.0 | N/A | https://bioconductor.org/packages/release/bioc/html/EnhancedVolcano.html |
| enrichR | N/A | https://maayanlab.cloud/Enrichr/ |
| Fiji | Schindelin et al. | https://fiji.sc/ |
| FlowJo v10.8.1 | FlowJo Corp. | https://www.flowjo.com/ |
| FlowSOM (v4.1.0) | FlowJo Exchange | https://www.flowjo.com/exchange/ |
| ggplot 4.2.0 | N/A | https://github.com/tidyverse/ggplot2 |
| ImageJ | Schneider et al. | https://imagej.nih.gov/ij/ |
| Living Image 4.2 | Caliper Life Sciences | https://www.perkinelmer.com/category/in-vivo-imaging-software |
| Monocle3 v1.2.9 | N/A | https://cole-trapnell-lab.github.io/monocle3/ |
| nSolver v4.0.70 | Nanostring | https://nanostring.com/products/analysis-solutions/nsolver-advanced-analysis-software/ |
| Pathview v1.36.1 | N/A | https://bioconductor.org/packages/release/bioc/html/pathview.html |
| Prism v9.5.1 | GraphPad | https://www.graphpad.com/ |
| Python 3.9 | Python Software Foundation | https://www.python.org |
| R v4.2.0 | The R Foundation | https://cran.r-project.org/src/base/R-4/ |
| Real Statistics Resource Pack Release 7.6 | Charles Zaiontz, © 2013-2021 | https://real-statistics.com/ |
| Rosalind v3.36.1.2 | OnRamp Bio | https://www.rosalind.bio/ |
| scVelo v0.2.4 | N/A | https://scvelo.readthedocs.io/en/stable/installation/ |
| Seurat v4.3.0 | N/A | https://github.com/satijalab/seurat |
| UMAP (v4.0.4) | FlowJo Exchange | https://www.flowjo.com/exchange/ |
| velocyto v0.17.17 | N/A | http://velocyto.org |
| Other | ||
| 0.5 mm x 2.3 mm Tungsten Carbide Burr for Micro Drill | Fine Science Tools | Cat#19009-05 |
| 10 μL, Model 901 Removable Needle (RN) Syringe | Hamilton | Cat#7648-01 |
| 26 gauge, Small Hub RN Needle, 1”, PS4 | Hamilton | Cat#7804-03 |
| 34 gauge, Small Hub RN Needle, 0.375”, PS3 | Hamilton | Cat#207434 |
| 7mm Reflex Clip Applier | Braintree Scientific | Cat#RF7APL |
| Cellstar® Suspension Culture Flask, 50 mL, PS, White Filter Screw Cap | Greiner Bio-One | Cat#690195 |
| Cellstar® TC Cell Culture Flask, 50 mL, PS, Red Filter Screw Cap | Greiner Bio-One | Cat#658175 |
| Costar® 96-well Clear Flat Bottom Ultra-Low Attachment Microplate | Corning | Cat#3474 |
| Costar® 96-well Clear Round Bottom Ultra-Low Attachment Microplate | Corning | Cat#7007 |
| Ethicon bone wax: 2.5G | Ethicon Endo-surgery | Cat#W31G |
| Exel International Disposable Scalpels | Fisher Scientific | Cat#14-840-01 |
| Falcon® 48-well Clear Flat Bottom TC-treated Cell Culture Plate, with Lid | Corning | Cat#353078 |
| Falcon® Permeable Support for 12-well Plate with 3.0 μm Transparent PET Membrane | Corning | Cat#353181 |
| Falcon™ Cell Strainer 70 μm | Corning | Cat#352350 |
| Falcon™ Round-Bottom Polystyrene Test Tubes | Corning | Cat#352058 |
| Fisherbrand™ Cover Glasses: Rectangles | Fisher Scientific | Cat#12-545G |
| Fisherbrand™ Wood Handled 6” Cotton Swab | Fisher Scientific | Cat#22363157 |
| GenClone 12-Well Non-Treated Plates Flat Bottom | Genesee Scientific | Cat#25-101 |
| Luer-Lok™ Syringe sterile, single use, 5 mL | BD Biosciences | Cat#309646 |
| Miltex™ Mid Grade Eye Dressing Forceps | Integra LifeSciences | Cat#V918-780 |
| Nunc™ Lab-Tek™ 8-well Chamber Slide w/ removable wells | Thermo Fisher | Cat#177402 |
| PrecisionGlide™ 25 G X 5/8” Hypodermic Needles | BD Biosciences | Cat#305122 |
| Reflex Wound Clips 7 mm | CellPoint Scientific | Cat#203-1000 |
| Roche Protector RNase Inhibitor | Sigma-Aldrich | Cat#3335402001 |
| SAFE-T-FILL® Capillary Blood Collection Tubes - EDTA | RAM Scientific | Cat#07-7051 |
| Scissors, Fine, Excelta Corp® | VWR | Cat#75880-906 |
| Size 1 Head Exposure Shield Size 1 | Precision X-Ray | Cat#XD1907-2015 |
| Size 1 Holding Fixture, No Flank | Precision X-Ray | Cat#XD1907-1014 |
| Steriflip-HV Sterile Centrifuge Tube Top Filter Unit, 0.45 μm pore size, PVDF | Millipore Sigma | Cat#SE1M003M00 |
| Tissue-Plus™ O.C.T. Compound Tissue-Plus™ O.C.T. Compound, Clear | Fisher Scientific | Cat#FIS23-730-571 |
| Vacutainer™ 10mL Plastic Blood Collection Tubes with Sodium Heparin: Conventional Stopper | BD Biosciences | Cat#367874 |
| Vacutainer™ Plastic Blood Collection Tubes with K2 EDTA: Hemogard™ Closure | BD Biosciences | Cat#366643 |
| VistaVision™ HistoBond® Adhesive Microscope Slides, Premium | Avantor VWR | Cat# 16004-408 |