Abstract
Objectives
Temporomandibular disorders (TMDs) are common and may cause persistent functional limitations and pain. Magnetic resonance imaging (MRI) at 1.5 and 3 T is commonly applied for the evaluation of the temporomandibular joint (TMJ). No evidence is available regarding the feasibility of modern low-field MRI for the assessment of TMDs. The objective of this prospective study was to evaluate the image quality (IQ) of 0.55 T MRI in direct comparison with 1.5 T MRI.
Materials and Methods
Seventeen patients (34 TMJs) with suspected intraarticular TMDs were enrolled, and both 0.55 and 1.5 T MRI were performed on the same day. Two senior readers independently evaluated the IQ focusing on the conspicuity of disc morphology (DM), disc position (DP), and osseous joint morphology (OJM) for each joint. We analyzed the IQ and degree of artifacts using a 4-point Likert scale (LS) at both field strengths. A fully sufficient IQ was defined as an LS score of ≥3. Nonparametric Wilcoxon test for related samples was used for statistical comparison.
Results
The median IQ for the DM and OJM at 0.55 T was inferior to that at 1.5 T (DM: 3 [interquartile range {IQR}, 3–4] vs 4 [IQR, 4–4]; OJM: 3 [IQR, 3–4] vs 4 [IQR 4–4]; each P < 0.001). For DP, the IQ was comparable (4 [IQR 3–4] vs 4 [IQR 4–4]; P > 0.05). A sufficient diagnostic IQ was maintained for the DM, DP, and OJM in 92% of the cases at 0.55 T and 100% at 1.5 T. Minor image artifacts (LS score of ≥3) were more prevalent at 0.55 T (29%) than at 1.5 T (12%).
Conclusions
Magnetic resonance imaging of the TMJ at 0.55 T yields a lower IQ than does MRI at 1.5 T but maintains sufficient diagnostic confidence in the majority of patients. Further improvements are needed for reliable clinical application.
Key Words: low field MRI, 0.55 T MRI, temporomandibular joint disease, temporomandibular joint
Temporomandibular disorders (TMDs) are highly prevalent and have has a predominance in young adults and female individuals, although children and adolescents can also be affected.1,2 Typical symptoms include pain with or without functional limitations such as impaired mouth opening.3,4
For patients with persistent symptoms of the temporomandibular joint (TMJ), magnetic resonance imaging (MRI) is commonly performed owing to its excellent soft tissue contrast, high spatial resolution, and the possibility of dynamic examination.5 Especially, detailed evaluation of disc morphology (DM), disc position (DP), and osseous joint morphology (OJM) can be characterized.6 Magnetic resonance imaging at field strengths of 1.5 or 3 T represents the current standard method for the evaluation of all joint tissues including DM and function.5,7
However, approximately 50% of the population worldwide has either only limited or no access to MRI.8 A new generation of modern low-field MRI systems with magnetic field strengths below 1 T has shown promising results in different body regions, including musculoskeletal imaging, head and neck imaging, and lung imaging.9–15 Purchase and maintenance of low-field MRI systems are comparatively inexpensive and could increase access to MRI technology worldwide.16,17 Further, lower magnetic field strengths may improve the accessibility to MRI for patients with active implants due to safety issues and may have advantages in regard of susceptibility artifacts around implants and body regions affected by this such as the paranasal sinuses, skull base, oral cavity, or pharynx.15,16 However, low-field MRI has a lower signal-to-noise ratio (SNR) and spatial resolution than to high field MRI.18 It remains unclear whether the application of modern low-field MRI is feasible in characterizing TMDs at a clinically diagnostic image quality (IQ).
Hence, the aim of this single-center prospective, explorative study was to compare the IQ of a modern low-field MRI system at 0.55 T with that of a standard MRI system at 1.5 in patients with a variety of TMDs.
MATERIALS AND METHODS
Patient Population and Study Protocol
A convenience sample of 23 patients referred for TMJ MRI with a mixed spectrum of TMDs were screened from September 2022 to January 2023. The exclusion criteria were as follows: prior surgery of the TMJ, inflammatory joint diseases, or contraindications for MRI examination (eg, unsuitable pacemakers, implants, metal foreign bodies, or claustrophobia). Seventeen patients with clinical indications for cross-sectional imaging, mainly comprising pain symptoms, jaw locking, and articular sounds, were finally enrolled.19 Standard MRI examination at 1.5 T system was performed, followed immediately by the MRI at 0.55 T (Fig. 1). We analyzed the prevalence of disc degeneration, disc dislocation, and osseous joint disease in the available patient collective. Before MRI, all participants provided written informed consent. Approval from the institutional review board of Friedrich-Alexander-University Erlangen-Nürnberg University (number: 341_21 B) was obtained, and the Health Insurance Portability and Accountability Act and the Declaration of Helsinki were followed.
FIGURE 1.
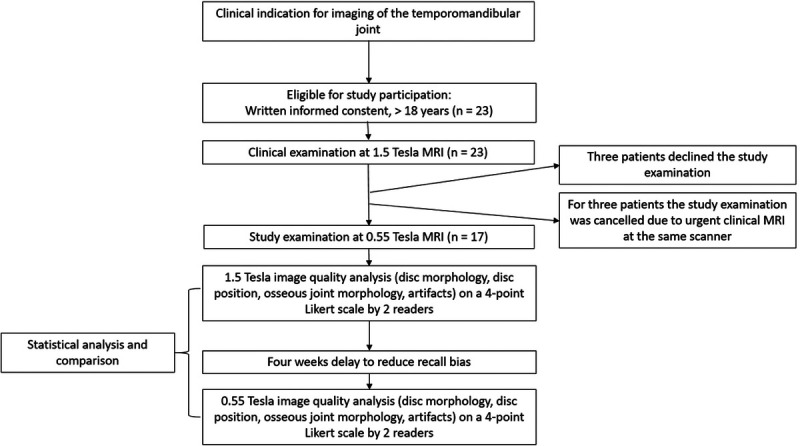
Flowchart of the study design. Both study examinations were performed immediately one after the other on the same day. We applied a 4-week delay between image quality analysis at 1.5 T and 0.55 T to reduce a possible recall bias to a minimum.
Image Acquisition
All diagnostic MRI examinations were performed on a 1.5 T MRI system (MAGNETOM Aera; Siemens Healthcare GmbH, Erlangen, Germany) and a 0.55 T MRI system (MAGNETOM Free.Max; Siemens Healthcare GmbH). We used a dedicated head and neck coil for optimized image acquisition of the TMJ at both field strengths. The protocol at 1.5 T was consistent with the recommendations of the European Society of Musculoskeletal Radiology and the Musculoskeletal Imaging Working Group of the Germany Radiology Society.20,21 The protocol includes the following sequences in an open- and closed-mouth position: a proton density-weighted (PDw) sequence in coronal slice orientation with 2-mm slice thickness, a PDw sequence in sagittal oblique slice orientation with 2-mm slice thickness and dedicated angulation for each TM, and a T2-weighted turbo spin echo sequence in axial orientation over both TMJs in a closed-mouth position. All 0.55 T examinations were performed using a software acceleration technique (Deep Resolve Sharp) provided by the vendor, which is based on artificial intelligence (AI). This algorithm improves the image sharpness and simultaneously reduces the image noise.22 A comparable sequence protocol was used for the 0.55 T system in an open- and closed-mouth position.
A detailed overview of the sequence parameters is presented in Table 1.
TABLE 1.
Sequence Parameters of 1.5 T and 0.55 T Magnetic Resonance Imaging
| Parameter | 1.5 T | 0.55 T | ||||
|---|---|---|---|---|---|---|
| Sequence | PDwcoronal | PDwsagittal | T2axial | PDwcoronal | PDwsagittal | T2axial |
| Fat suppression | No | No | No | No | No | No |
| Repetition time, ms | 2000 | 2170 | 4000 | 1800 | 1800 | 4080 |
| Echo time, ms | 11 | 11 | 67 | 18 | 18 | 100 |
| Voxel size reconstruction, mm3 | 0.3 × 0.3 × 2.0 | 0.2 × 0.2 × 2.0 | 0.3 × 0.3 × 3.0 | 0.3 × 0.3 × 2.0 | 0.3 × 0.3 × 2.0 | 0.4 × 0.4 × 4.0 |
| Voxel size acquisition, mm3 | 0.62 × 0.59 × 2.0 | 0.49 × 0.42.2.0 | 0.76 × 0.55 × 3.0 | 0.86 × 0.69 × 2.0 | 0.85 × 0.67 × 2.0 | 0.9 × 0.7 × 4.0 |
| Interpolation | Yes | Yes | Yes | Yes | Yes | Yes |
| Field of view, mm | 150 × 150 | 120 × 120 | 132 × 170 | 185 × 220 | 128 × 149 | 185 × 220 |
| Acquisition time, min:s | 3:04 | 3:49 | 1:02 | 4:03 | 4:39 | 5.03 |
| Standard no. slices | 13 | 16 | 19 | 13 | 16 | 19 |
| Averages | 3 | 2 | 2 | 2 | 2 | 2 |
| Concatenations | 1 | 1 | 1 | 2 | 2 | 2 |
| Flip angle, degrees | 150 | 150 | 150 | 130 | 130 | 130 |
| Receiver bandwidth, Hz/pixel | 160 | 160 | 191 | 80 | 80 | 80 |
| Acceleration technique | GRAPPA | GRAPPA | GRAPPA | No | No | No |
| Acceleration factor | 2 | 2 | 2 | NA | NA | NA |
| Acceleration software | NA | NA | NA | DRS | DRS | DRS |
On both scanners, we applied PDw sequences in coronal and sagittal sequences and T2-weighted sequences in axial orientation. The differences between acquired and reconstructed voxel are depending on the zero-filling interpolation technique used on both scanners. All 0.55 T examinations were performed using a software acceleration technique based on artificial intelligence, which improves the image sharpness and reduces the image noise (Deep Resolve Sharp, Siemens Healthineers, Erlangen, Germany).
PDw, proton density-weighted; NA, not available; DRS, Deep Resolve Sharp.
Image Analysis
Two board-certified radiologists (reader 1 with 8 years of experience and reader 2 with 6 years of experience in musculoskeletal imaging) independently performed the image analysis. The readers were blinded to the medical patient history and to the side of clinically suspected TMD. Initially, each reader independently evaluated the 1.5 T images for each joint side separately in random order. Thereafter, the 0.55 T images were analyzed by both readers in a different randomized order and also for each joint separately. We applied a 4-week delay between both analysis steps to reduce possible recall bias to a minimum.
Both readers analyzed all sequences for each joint side and scored the IQ on a 4-point Likert scale (LS) as follows: 1 = insufficient for clinical use, 2 = suboptimal, but partly diagnostic IQ, 3 = sufficient IQ for full clinical use, and 4 = optimal IQ with superior conspicuity.23,24 The IQ evaluation focused on the conspicuity of DM, DP, and OJM. In addition, artifacts were as assessed as follows: 1 = severe artifacts with an insufficient IQ for clinical use, 2 = some artifacts reducing the IQ in the target structures, 3 = minor artifacts without a reduced IQ, and 4 = optimal IQ without artifacts.
STATISTICAL ANALYSIS
The data were presented as means and standard deviations in case of normal distribution. Normal distribution was analyzed using the Kolmogorov-Smirnov test. Meanwhile, the LS scores were presented as medians and interquartile ranges (IQRs) as normal distribution is not applicable. The nonparametric Wilcoxon test for related samples was used for comparison between the subjective IQ ratings of 1.5 and 0.55 T examinations. Interrater agreement was assessed using weighted Cohen κ coefficients. We calculated the κ coefficients for the overall population and for each DM, DP, and OJM analysis. Kappa values ≥0.41 were interpreted as moderate, κ values ≥0.61 as substantial, and κ values ≥0.81 as almost perfect agreement according to Landis and Koch.25
Statistical significance was accepted for P values below 0.05. Statistical analysis was performed using SPSS version 28 (SPSS Inc/IBM, Chicago, IL).
RESULTS
Patient Population
A total of 23 patients (16 women and 7 men) were eligible for study participation. Three patients refused study participation in advance. Three other patients refused the examination at 0.55 T after the initial diagnostic scan at 1.5 T. Consequently, 17 patients (n = 13 women and 4 men) with 34 TMJs available for separate statistical analysis were enrolled. The mean age for of included patients was 41 ± 17 years (range, 22–71 years). We found disc degeneration in 17 TMJs (50%), disc dislocation in 9 TMJs (26.5%), and osseous joint disease in 9 TMJs (26.5%).
Image Quality
The conspicuity of the articular disc was significantly lower at 0.55 T than at 1.5 T with a median rating of 3 (IQR, 3–4) compared with 4 (IQR, 4–4; P < 0.001). For the OJM, the IQ ratings at 0.55 T were significantly lower (LS score of 3; IQR, 3–4) than that at 1.5 T (LS, 4; IQR, 4–4; P < 0.001). No significant difference was found for the DP between 0.55 T (4; IQR, 3–4) and 1.5 T (4; IQR, 4–4; P = 0.06). A sufficient IQ for clinical use (LS score of 3) was observed for the DM, DP, and OJM in 92% of the cases at 0.55 T. In 4 of 51 ratings (n = 2 for DM; n = 2 for OJM), the IQ was suboptimal with only partly diagnostic levels (LS score of 2) owing to the reduced spatial resolution. The detailed IQ ratings are illustrated in Figures 2 to 8.
FIGURE 2.

A, Illustration of the full field-of-view image for 0.55 T (A) and 1.5 T (B) with the enlarged image section, which is applied for the following Figures 2B–7. B, Comparison of the image quality (IQ) in an oblique-sagittal proton density-weighted sequence of the same patient at 0.55 T (A) and 1.5 T (B). The IQ is sufficient in both examinations with normal disc morphology (white arrow) and no relevant degenerative changes of the temporomandibular joint. On a 4-point Likert scale (LS), both the 0.55 and the 1.5 T IQ scored despite the smaller acquired and reconstructed voxel size at 1.5 T.
FIGURE 8.
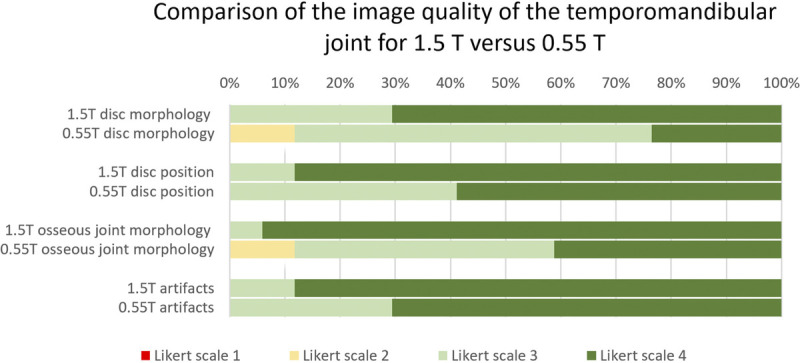
Prevalence of the image quality (IQ) based on the 4-point Likert scale scores for 1.5 T and 0.55 T MRI. The horizontal bars illustrate the IQ for the disc morphology, disc position, osseous joint morphology, and overall artifacts. The subjective IQ ratings are based on the evaluation of all acquired sequences.
FIGURE 3.
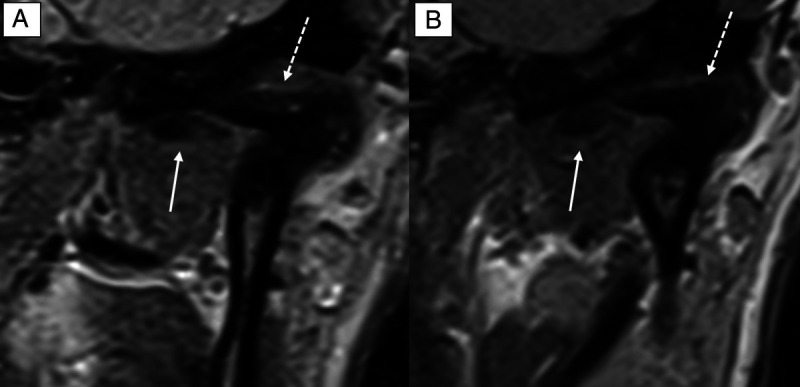
Comparison of the image quality (IQ) in a coronal proton density-weighted sequence of the same patient at 0.55 T (A) and 1.5 T (B). The IQ is sufficient in both examinations with medial disc dislocation (white arrow) and degenerative sclerotic changes (white dotted arrow) of the temporomandibular joint. On a 4-point Likert scale (LS), the 0.55 T IQ scored 3, whereas the 1.5 T IQ scored 4 owing to the smaller acquired voxel size at 1.5 T.
FIGURE 4.
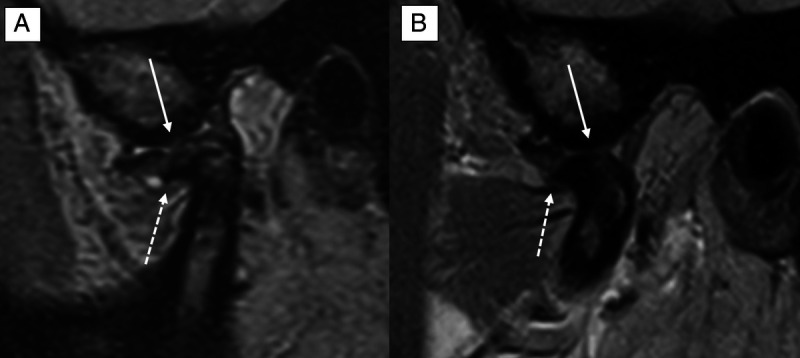
Comparison of the image quality (IQ) in an oblique-sagittal proton density-weighted sequence of the same patient at 0.55 T (A) and 1.5 T (B). The IQ is sufficient in both examinations with delineation of central disc perforation (white arrow) and degenerative sclerotic changes with osteophytes of the temporomandibular joint (white dotted arrow). On a 4-point Likert scale (LS), the 0.55 T IQ scored 3, whereas the 1.5 T IQ scored 4 owing to the smaller acquired and reconstructed voxel size at 1.5 T.
FIGURE 5.
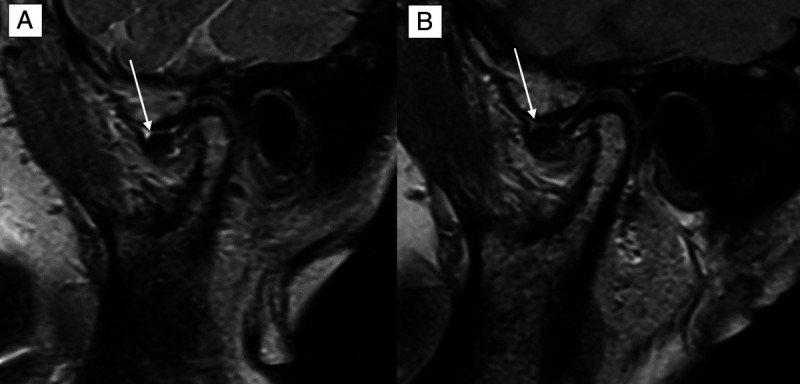
Comparison of the image quality (IQ) in an oblique-sagittal proton density-weighted sequence of the same patient at 0.55 T (A) and 1.5 T (B). The IQ is suboptimal but partly sufficient at 0.55 T and optimal at 1.5 T. The delineation of the anteriorly dislocated discus (white arrow) as well as the illustration of the degenerative osseous joint disease is hampered. On a 4-point Likert scale (LS), the 0.55 T IQ scored 2, whereas the 1.5 T IQ scored 4 owing to the smaller acquired and reconstructed voxel size at 1.5 T.
FIGURE 6.
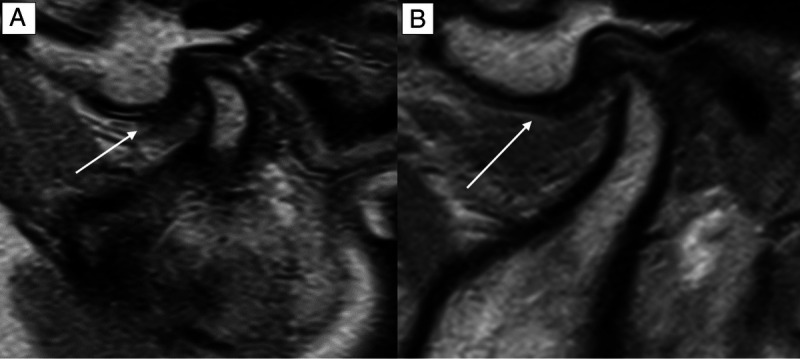
Comparison of the image quality (IQ) in an oblique-sagittal proton density-weighted sequence of the same patient at 0.55 T (A) and 1.5 T (B). The IQ is sufficient both at 0.55 and 1.5 T but hampered owing to movement artifacts. Nevertheless, the delineation of the partly anteriorly dislocated discus (white arrow) as well as the illustration of the normal osseous joint structures is diagnostic. On a 4-point Likert scale (LS), the 0.55 T and 1.5 T IQ scored 3.
FIGURE 7.
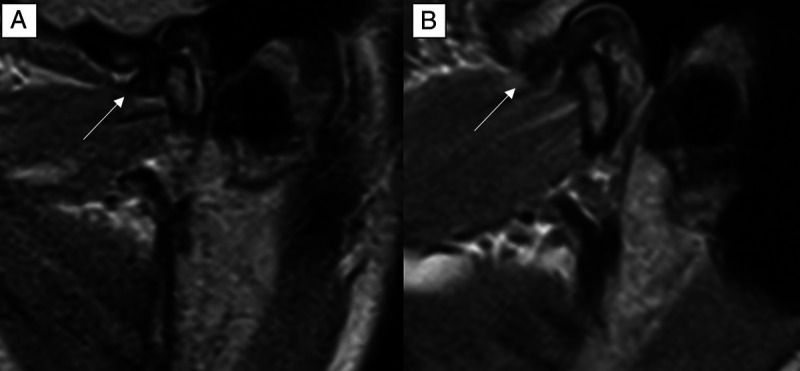
Comparison of the image quality (IQ) in an oblique-sagittal proton density-weighted sequence of the same patient at 0.55 T (A) and 1.5 T (B). The IQ of the disc morphology at 0.55 T scored 2 on a 4-point Likert scale with suboptimal, but partly diagnostic disc conspicuity. The IQ at 1.5 T was rated as optimal and scored 4 on the 4-point Likert scale.
The analysis of artifacts showed comparable results between 0.55 T (4; IQR, 3–4) and 1.5 T (4; IQR, 4–4; P = 0.32). Minor artifacts were slightly more prevalent at 0.55 T (n = 5; 29%) than at 1.5 T (n = 2; 6%). No severe artifacts were present (LS score of ≤2) at both field strengths. In all cases, artifacts were caused by patient movements. No artifacts due to technical reasons occurred. The results and comparative examples of the IQ for the DM, DP, and OJM are available in Table 2.
TABLE 2.
Image Quality for the Disc Morphology, Disc Position, and Osseous Joint Morphology Between 1.5 T and 0.55 T MRI
| 1.5 T MRI | 0.55 T MRI | P | |
|---|---|---|---|
| Disc morphology | 4 (IQR, 4–4) | 3 (IQR, 3–4) | <0.001 |
| Disc position | 4 (IQR, 4–4) | 4 (IQR, 3–4) | 0.06 |
| Osseous joint morphology | 4 (IQR, 4–4) | 3 (IQR, 3–4) | <0.001 |
| Image artifacts | 4 (IQR, 4–4) | 4 (IQR, 3–4) | 0.32 |
| Fully sufficient IQ with a Likert scale score of ≥3 | 100% | 92% |
Values are given as medians and interquartile ranges (IQRs). Likert scale graduation: 1 = insufficient for clinical use; 2 = suboptimal, but partly diagnostic IQ; 3 = sufficient IQ for full clinical use; and 4 = optimal IQ with superior conspicuity.
MRI, magnetic resonance imaging; IQR, interquartile range.
Interrater Performance
The overall interrater correlation of the IQ evaluation between 0.55 (κ = 0.57) and 1.5 T (κ = 0.58) was moderate. We separately calculated the interrater correlation for the DM (0.55 T: κ = 0.63; 1.5 T: κ = 0.59), DP (0.55 T: κ =0.74; 1.5 T: 0.72), OJM (0.55 T: κ = 0.71; 1.5 T: 0.68), and artifacts (0.55 T: κ = 0.63; 1.5 T: κ = 0.57).
DISCUSSION
We found significantly lower IQ ratings for the DM and OJM at 0.55 T than at 1.5 T (each P < 0.001). However, a sufficient IQ (LS score of 3) was reached in 92% of the cases at 0.55 T compared with 100% at 1.5 T. For the DP, all cases at 0.55 T and 1.5 T showed a diagnostic IQ of 100%. Minor artifacts were slightly more prevalent at 0.55 T than at 1.5 T.
Currently, MRI is the reference imaging method used for the evaluation of TMDs and visualization of disc pathologies and morphological osseous joint changes. To date, technical MRI developments for clinical routine use have often focused on increasing the magnetic field strength, which enables imaging with a high spatial resolution.25 Nevertheless, MRI systems with high field strengths and high spatial resolutions require intensive cooling system, a high consumption of energy, and high cost of maintenance. This limits the distribution of MRI systems to many rural areas worldwide.16 Recently developed modern low-field MRI systems require less energy and have lower maintenance costs, which make this technology promising for large-scale use even under financial constraints.16,26–29
Several recently published studies have already emphasized the clinical applicability of modern low-field MRI compared with standard high-field systems at different anatomic locations. For brain imaging, a study among 17 patients with stroke reported a noninferior IQ of low-field MRI at 0.55 T over that of higher field MRI. However, the authors also discussed a limited visualization of very small infarcts at 0.55 T.30 Osmanodja et al14 examined 16 patients with 19 known intracranial aneurysms via dedicated time-of-flight angiography at 0.55 T, 1.5 T, or 3 T MRI as well as digital subtraction angiography. The authors demonstrated a comparable overall aneurysm size between 0.55 T and 1.5/3 T MRI.14 Notably, no previous studies have assessed the actual diagnostic performance using a defined reference standard, such as histopathology; comparisons have only been conducted between MRI systems. This is also true for our study.
Despite the promising results of low-field MRI, there are still some general disadvantages of lower magnetic field strengths, which must be considered. Some relevant drawbacks in clinical routine include reduced spatial resolutions owing to the lower magnetic field strength and longer acquisition times, considering sufficient SNR and potentially increased movement artifacts caused by longer examination times. In our study, the IQ at 0.55 T was suboptimal with only partly diagnostic images in 4 of 51 ratings (n = 2 for DM; n = 2 for OJM) owing to the reduced SNR and spatial resolution. Therefore, other cost-effective imaging modalities such as high-resolution ultrasound must still be considered, as it showed promising results in comparison with 1.5 T MRI.31 In addition, the acquisition time at 0.55 T was 36% longer compared with the reference scan at 1.5 T (22 vs 14 minutes). Nevertheless, an increased acquisition time of 8 minutes seems still acceptable for routine clinical imaging. Future acceleration techniques based on several aspects, including AI, may contribute to decreased acquisition times and consequently make the application of routine MRI of the TMJ at 0.55 T more feasible.25 Shortened scan times using AI technology may also help reducing the higher prevalence of movement artifacts at 0.55 T.
Therefore, low-field MRI seems promising in providing more patients with TMD access to sufficient, radiation-free imaging to clarify the etiology of their various, often chronic TMJ symptoms.2 An accurate diagnosis of TMDs is the basis of an appropriate treatment strategy, which often focuses on TMJ-related pain symptoms. Based on our results, 0.55 T MRI seems feasible to provide information about structural damage of the TMJ, especially internal derangement. Apart from clinical symptoms, imaging findings drive potential therapeutic strategies, which mainly include medications (eg, corticosteroids, nonsteroidal anti-inflammatory drugs, opioids), physiotherapy, and occlusal splint therapy.32 However, a minority of patients (5%–10%) require surgical procedures, especially arthrocentesis, arthroscopy, and arthrotomy.33 Despite our promising results, it has to kept in mind that gains in SNR at higher magnetic field strengths such as 3 T can be used to increase the spatial resolution when imaging the TMJ, which translates into increased visibility and delineation of anatomical structures.34
Our study has limitation that needs mentioning. First, our study included only patients with suspected TMD. Therefore, neither the IQ of low-field MRIs between a healthy population and patients with TMD (ie, potential false-positive diagnoses) could be assessed. Second, we did not evaluate the diagnostic performance in the detection of incidental findings, including odontogenic, brain, hypophyseal, or bone lesions. Third, although highly trained radiologists rated the IQ, semiquantitative assessment is prone to interreader variability. Fourth, no reference standard (eg, surgery or histopathology) that could objectively validate the MRI findings was available. Fourth, we did not compare our images to images acquired at higher magnetic field strengths such as 3 T or to images acquired with surface coils. We also did not include dynamic MRI sequences in the IQ evaluation due to time restraints and due the potential dependence of patient cooperation. Fifth, we did not perform fat-saturated T2-weighted imaging, which is recommended for diagnosing inflammatory diseases at the TMJ. Sixth, we did not blind the readers to the MRI field strength as overall image impression obviously indicated the different MRI field strength.
Low-field 0.55 T MRI yields a lower IQ than does 1.5 T, which can affect the visibility of the OJM and exact DM. However, the IQ at 0.55 T can be considered sufficient in a majority of patients. Therefore, 0.55 T MRI seems feasible for TMJ evaluation, although further improvements are needed for reliable clinical application.
ACKNOWLEDGMENTS
The authors thank the Imaging Science Institute Erlangen for providing measurement data and Sandy Schmidt for providing technical assistance during MRI acquisition.
Footnotes
Conflicts of interest and sources of funding: R.H., M.M., M.K., and M.U. are members of the speakers bureau of Siemens Healthcare GmbH. F.W.R. outside the current work (for the last 36 months) was a consultant to Grünethal GmbH, Shareholder Boston Imaging Core Lab (BICL), LLC. All other authors have no affiliation with any organization with a direct or indirect financial interest in the subject discussed in the article. This research received no specific grant from any funding agency in the public, commercial, or not-for-profit sectors.
Contributor Information
Marco Wiesmueller, Email: marco.wiesmueller@uk-erlangen.de.
Mayte Buchbender, Email: Mayte.Buchbender@uk-erlangen.de.
Marco Kesting, Email: Marco.Kesting@uk-erlangen.de.
Armin M. Nagel, Email: armin.nagel@uk-erlangen.de.
Matthias S. May, Email: matthias.may@uk-erlangen.de.
Michael Uder, Email: michael.uder@uk-erlangen.de.
Frank W. Roemer, Email: frank.roemer@uk-erlangen.de.
Rafael Heiss, Email: rafael.heiss@uk-erlangen.de.
REFERENCES
- 1.Guralnick W, Kaban LB, Merrill RG. Temporomandibular-joint afflictions. N Engl J Med. 1978;299:123–129. [DOI] [PubMed] [Google Scholar]
- 2.Matheson EM, Fermo JD, Blackwelder RS. Temporomandibular disorders: rapid evidence review. Am Fam Physician. 2023;107:52–58. [PubMed] [Google Scholar]
- 3.Balaban E Yilmaz O Timarcioglu G, et al. Preoperative and postoperative assessment of temporal and masseter muscle size with magnetic resonance imaging in patients undergoing unilateral temporomandibular joint surgery. J Craniomaxillofac Surg. 2021;49:705–710. [DOI] [PubMed] [Google Scholar]
- 4.Petscavage-Thomas JM, Walker EA. Unlocking the jaw: advanced imaging of the temporomandibular joint. AJR Am J Roentgenol. 2014;203:1047–1058. [DOI] [PubMed] [Google Scholar]
- 5.Xiong X Ye Z Tang H, et al. MRI of temporomandibular joint disorders: recent advances and future directions. J Magn Reson Imaging. 2021;54:1039–1052. [DOI] [PubMed] [Google Scholar]
- 6.Willenbrock D Lutz R Wuest W, et al. Imaging temporomandibular disorders: reliability of a novel MRI-based scoring system. J Craniomaxillofac Surg. 2022;50:230–236. [DOI] [PubMed] [Google Scholar]
- 7.Lee YH, Lee KM, Auh Q-S. MRI-based assessment of masticatory muscle changes in TMD patients after whiplash injury. J Clin Med. 2021;10:1404. [DOI] [PMC free article] [PubMed] [Google Scholar]
- 8.Sarracanie M, Salameh N. Low-field MRI: how low can we go? A fresh view on an old debate. Front Phys. 2020;8. [Google Scholar]
- 9.Pogarell T May MS Nagel AM, et al. Imaging of the musculoskeletal system using low-field magnetic resonance imaging. Radiologe. 2022;62:410–417. [DOI] [PubMed] [Google Scholar]
- 10.Hinsen M Heiss R Nagel AM, et al. Imaging of the lung using low-field magnetic resonance imaging. Radiologe. 2022;62:418–428. [DOI] [PMC free article] [PubMed] [Google Scholar]
- 11.Heiss R Grodzki DM Horger W, et al. High-performance low field MRI enables visualization of persistent pulmonary damage after COVID-19. Magn Reson Imaging. 2021;76:49–51. [DOI] [PMC free article] [PubMed] [Google Scholar]
- 12.Levy S Heiss R Grimm R, et al. Free-breathing low-field MRI of the lungs detects functional alterations associated with persistent symptoms after COVID-19 infection. Invest Radiol. 2022;57:742–751. [DOI] [PubMed] [Google Scholar]
- 13.Heiss R Tan L Schmidt S, et al. Pulmonary dysfunction after pediatric COVID-19. Radiology. 2023;306:e221250. [DOI] [PMC free article] [PubMed] [Google Scholar]
- 14.Osmanodja F Rosch J Knott M, et al. Diagnostic performance of 0.55 T MRI for intracranial aneurysm detection. Invest Radiol. 2023;58:121–125. [DOI] [PubMed] [Google Scholar]
- 15.Campbell-Washburn AE Ramasawmy R Restivo MC, et al. Opportunities in interventional and diagnostic imaging by using high-performance low-field-strength MRI. Radiology. 2019;293:384–393. [DOI] [PMC free article] [PubMed] [Google Scholar]
- 16.Heiss R Nagel AM Laun FB, et al. Low-field magnetic resonance imaging: a new generation of breakthrough technology in clinical imaging. Invest Radiol. 2021;56:726–733. [DOI] [PubMed] [Google Scholar]
- 17.Vosshenrich J Breit HC Bach M, et al. Economic aspects of low-field magnetic resonance imaging: acquisition, installation, and maintenance costs of 0.55 T systems [in German]. Radiologe. 2022;62:400–404. [DOI] [PMC free article] [PubMed] [Google Scholar]
- 18.Runge VM, Heverhagen JT. Advocating the development of next-generation, advanced-design low-field magnetic resonance systems. Invest Radiol. 2020;55:747–753. [DOI] [PubMed] [Google Scholar]
- 19.Talmaceanu D Lenghel LM Bolog N, et al. Imaging modalities for temporomandibular joint disorders: an update. Clujul Med. 2018;91:280–287. [DOI] [PMC free article] [PubMed] [Google Scholar]
- 20.Janka R. Protocol recommendations for imaging of finger joints, feet and temporomandibular joint. German Radiology Society; 2023. Available at: www.ag-msk.drg.de/de_DE/5829/protokollempfehlungen. Accessed June 1, 2023.
- 21.Sudol-Szopinska I Jurik AG Eshed I, et al. Recommendations of the ESSR arthritis subcommittee for the use of magnetic resonance imaging in musculoskeletal rheumatic diseases. Semin Musculoskelet Radiol. 2015;19:396–411. [DOI] [PubMed] [Google Scholar]
- 22.Knoll F Hammernik K Zhang C, et al. Deep-learning methods for parallel magnetic resonance imaging reconstruction: a survey of the current approaches, trends, and issues. IEEE Signal Process Mag. 2020;37:128–140. [DOI] [PMC free article] [PubMed] [Google Scholar]
- 23.Jabas A Abello Mercado MA Altmann S, et al. Single-energy metal artifact reduction (SEMAR) in ultra-high-resolution CT angiography of patients with intracranial implants. Diagnostics (Basel). 2023;13:620. [DOI] [PMC free article] [PubMed] [Google Scholar]
- 24.Vollbrecht TM Hart C Zhang S, et al. Fetal cardiac cine MRI with Doppler US gating in complex congenital heart disease. Radiol Cardiothorac Imaging. 2023;5:e220129. [DOI] [PMC free article] [PubMed] [Google Scholar]
- 25.Hori M Hagiwara A Goto M, et al. Low-field magnetic resonance imaging: its history and renaissance. Invest Radiol. 2021;56:669–679. [DOI] [PMC free article] [PubMed] [Google Scholar]
- 26.Poluha RL Cunha CO Bonjardim LR, et al. Temporomandibular joint morphology does not influence the presence of arthralgia in patients with disk displacement with reduction: a magnetic resonance imaging-based study. Oral Surg Oral Med Oral Pathol Oral Radiol. 2020;129:149–157. [DOI] [PubMed] [Google Scholar]
- 27.Li L Shi H Xie H, et al. MRI assessment and histopathologic evaluation of subchondral bone remodeling in temporomandibular joint osteoarthritis: a retrospective study. Oral Surg Oral Med Oral Pathol Oral Radiol. 2018;126:355–362. [DOI] [PubMed] [Google Scholar]
- 28.Matsubara R Yanagi Y Oki K, et al. Assessment of MRI findings and clinical symptoms in patients with temporomandibular joint disorders. Dentomaxillofac Radiol. 2018;47:20170412. [DOI] [PMC free article] [PubMed] [Google Scholar]
- 29.Rabelo KA Sousa Melo SL Torres MGG, et al. Assessment of condyle position, fossa morphology, and disk displacement in symptomatic patients. Oral Surg Oral Med Oral Pathol Oral Radiol. 2017;124:199–207. [DOI] [PubMed] [Google Scholar]
- 30.Rusche T Breit HC Bach M, et al. Potential of stroke imaging using a new prototype of low-field MRI: a prospective direct 0.55 T/1.5 T scanner comparison. J Clin Med. 2022;11:2798. [DOI] [PMC free article] [PubMed] [Google Scholar]
- 31.Yilmaz D, Kamburoğlu K. Comparison of the effectiveness of high resolution ultrasound with MRI in patients with temporomandibular joint disorders. Dentomaxillofac Radiol. 2019;48:20180349. [DOI] [PMC free article] [PubMed] [Google Scholar]
- 32.Garstka AA Kozowska L Kijak K, et al. Accurate diagnosis and treatment of painful temporomandibular disorders: a literature review supplemented by own clinical experience. Pain Res Manag. 2023;2023:1002235. [DOI] [PMC free article] [PubMed] [Google Scholar]
- 33.Dimitroulis G. Management of temporomandibular joint disorders: a surgeon's perspective. Aust Dent J. 2018;63(Suppl 1):S79–S90. [DOI] [PubMed] [Google Scholar]
- 34.Manoliu A Spinner G Wyss M, et al. Quantitative and qualitative comparison of MR imaging of the temporomandibular joint at 1.5 and 3.0 T using an optimized high-resolution protocol. Dentomaxillofac Radiol. 2016, 45;:20150240. [DOI] [PMC free article] [PubMed] [Google Scholar]


