

Abstract
Susceptibility to decompression sickness (DCS) is characterized by a wide inter-individual variability, the origins of which are still poorly understood. We selectively bred rats with at least a 3-fold greater resistance to DCS than standard rats after 6 generations. In order to better understand DCS mechanisms, we compared the static genome expression of these resistant rats from the 10th generation to their counterparts of the initial non-resistant Wistar strain, by a microarray transcriptomic approach coupled and crossed with a PCR plates miRnome study. Thus, we identified differentially expressed genes on selected males and females, as well as gender differences in those genes, and we crossed these transcripts with the respective targets of the differentially expressed microRNAs. Our results highlight pathways involved in inflammatory responses, circadian clock, cell signaling and motricity, phagocytosis or apoptosis, and they confirm the importance of inflammation in DCS pathophysiology.
Subject terms: Gene expression, Predictive markers
Static hepatic gene expression of resistant rats crossed with their circulating miRnome highlight the role of inflammatory pathways in the susceptibility and pathophysiology of decompression sickness.
Introduction
Decompression sickness is a protean pathology that occurs when we are subjected to a drop in ambient pressure, and it can affect divers, tunnel workers or astronauts. It is acknowledged that the primum movens for DCS is the formation of bubbles due to the release of gas dissolved in the body before the decompression1,2. However, it is also considered that the highest levels of Vascular Gas Embolism (VGE) are associated to a risk of DCS of only 10%3,4 and that other physiological factors modulate the power of VGE to trigger DCS. Among the other factors suspected of playing a role in DCS onset, coagulation5,6 and inflammation7,8, oxidative stress9, or vascular dysfunction10,11 are often cited. However, the exact sequence of the physio/pathological events leading from the hyperbaric exposure and the formation of VGE to the development of DCS still remains poorly understood.
There is some evidence that wide inter and intra-individual variability exists for susceptibility to DCS12. This so-called “probabilistic nature of decompression sickness”13 has been well documented by experiments from animal models of DCS, which provide many examples of this inter-individual variability14,15. These examples suggest that inter-individual variability therefore also exists in the physiological factors that drive the probability of DCS occurrence after a given dive. Given the technical and ethical complexity of studying DCS in humans, we previously developed a lineage of rats resistant to DCS16,17, which provides a unique tool to decipher the mechanisms of DCS resistance by comparing the resistant animals with standard non-resistant Wistar rats. Besides providing the first evidence of a role of heritability in DCS susceptibility16–18, our early investigations showed that, when compared to non-resistant rats, these animals exhibited increased leukocyte counts, lower coagulability and mitochondrial basal oxygen consumption, lower vascular smooth muscle relaxation in response to a NO donor17 and arterial pressure19, and modifications of the gut microbiota20. Interestingly, previous data from this rat model indicated that the phenotypic characteristics associated with resistance to DCS were different between males and females. For example, resistant males but not resistant females had higher neutrophil and lymphocyte counts, and higher prothrombin time but lower mitochondrial basal O2 consumption and citrate synthase activity, compared to their non-resistant counterparts.
However, DCS is an acute pathology and all the animals that we have characterized so far were never submitted to any simulated dive. Instead, they were descendants from animals having undergone the selection protocol. That gave us access to a rat population more resistant to DCS without any preconditioning, allowing us to focus on their basal state for the study reported herein, instead of measuring their diving responses, in order to study the stationary characteristics possibly involved in their resistance to DCS.
The first aim of the present study was to investigate physiological pathways associated with resistance to DCS through a transcriptomic approach assessed by microarray. We chose to focus on the stationary hepatic transcriptome because the liver, in which we often observe bubbles on animals with DCS signs21, is an important place of circulating protein synthesis22, and such proteins play a key role in innate immune response23 and coagulation24,25. We also studied circulating miRnome on PCR plates, as DCS can be seen as a systemic disease that may be mediated by circulating markers like microparticles (MPs)7,8. MPs can contain miRs, which can quickly modify the expression levels of their targets26–28. As our end goal is to better understand DCS mechanisms in humans and as it will be too invasive to sample liver tissue from patients, and as microRNAs (miRs) are well conserved between species, we focused on circulating miRnome, hoping to correlate in the future some of our differentially expressed genes with differentially expressed miRs.
It is likely that some of the regulatory processes of gene expression involved in DCS mechanisms or DCS resistance cannot be evaluated through a stationary study on rats that have never been submitted to any hyperbaric exposure. In addition, the microarray and PCR plates are limited compared to RNA sequencing. However, our goal was to identify at least some of the differentially expressed genes and microRNAs in the resistant animals, in order to be able to later study their effects on decompression sickness outcomes. Our different approaches, both separately and combined, confirm the importance of immune responses, cell signaling and circadian rhythm in susceptibility to decompression sickness.
Results
Microarray-based gene expression analysis
The transcriptomic results (on microarray chips, from liver samples), compared the resistant rats to the Wistar (non-resistant) rats and showed significant male versus female differences. The P FDR < 0.01 (Benjamini Hochberg’s correction) (Supplementary Fig. 1) shows only 3 genes down regulated when comparing Wistar (non-resistant) males against Wistar females, and in contrast 3 up and 9 down regulated when comparing resistant males against resistant females. While P FDR < 0.05 is the correct test for this type of experiment, in order to maintain a practical number of genes to study, we chose not to use it because it highlighted hundreds of genes, and that number was too great for a reasonably sized continuing study (Supplementary Table 1). We therefore used an alternative method to determine genes of significance. Since, conversely, no gene’s expression was differentially expressed in resistant males when using P FDR < 0.01, we chose to opt for a hardened raw p-value < 0.0001 in males (Supplementary Tables 1 and 2) as this was an exploratory study with the goal of directing future research. Nevertheless, we kept the P FDR for the females, and we displayed both thresholds in our Volcano Plots (Figs. 1 and 2). However, the raw p-value < 0.0001 (Fig. 3, Supplementary Table 2) showed 6 upregulated and 64 downregulated when comparing non-resistant males against non-resistant females, and 32 up and 41 downregulated when comparing resistant males against resistant females. A total of 33 genes were downregulated in resistant males compared to non-resistant males, and 65 genes were upregulated. The same comparison showed 11 genes up and 32 downregulated in the resistant females compared to non-resistant females. For example, Arntl or Nfil3 transcript are upregulated in the resistant females compared to Wistar (non-resistant) females while Dbp, Nr1d1, Nr1d2 or Rpml transcripts are downregulated (see Fig. 1, Supplementary Fig. 2 and Supplementary Table 3). Amtn, Fbp1, Syne1 or Vsig4 are downregulated in the resistant males compared to non-resistant males while Nepn, Fnbp4 or Cxcl11 are upregulated (see Fig. 2, Supplementary Fig. 3 and Supplementary Table 4).
Fig. 1. Volcano plot of the comparison between Wistar (non-resistant) females against the 10th generation resistant females (n = 4).

The up-regulated genes in this plot are those overexpressed in non-resistant rats compared to the resistant rats. Only the most significant are named, and all the differentially expressed genes are represented by yellow dots (raw p-value < 10-4) or purple dots (adjusted p-value < 10-2). The names of the genes have been added manually, as well as the red circles to highlight the genes that had several probes on the microarray. The ordinate is also expressed in Log of Odds for clarity (raw volcano plots generated with MaGIC Volcano are available in the Supplemental data).
Fig. 2. Volcano Plot of the comparison between Wistar (non-resistant) males against the 10th generation resistant males (n = 4).

The up-regulated genes in this plot are those overexpressed in non-resistant rats compared to the resistant rats. Only the most significant are named, and all the differentially expressed genes are represented by yellow dots (raw p-value < 10-4) or purple dots (adjusted p-value < 10-2). The names of the genes have been added manually, as well as the red circles to highlight the genes that had several probes on the microarray. The ordinate is also expressed in Log of Odds for clarity (raw volcano plots generated with MaGIC Volcano are available in the Supplemental data).
Fig. 3. Venn Diagram of the comparison between the groups.
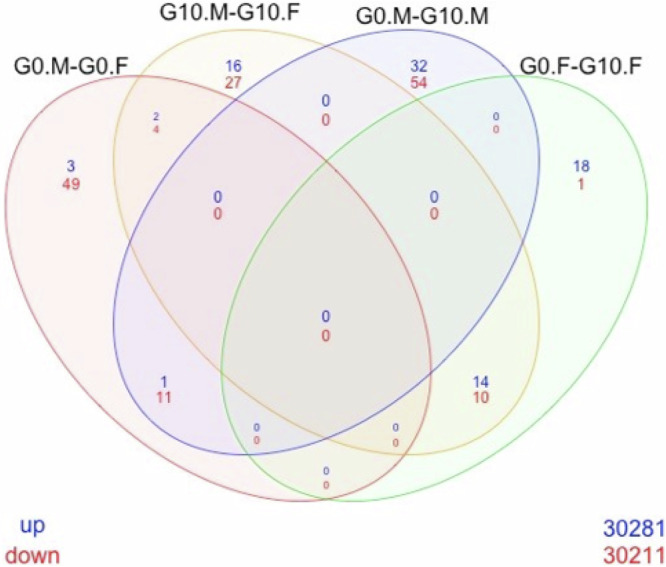
Wistar (non-resistant) females (G0.F), Wistar (non-resistant) males (G0.M), resistant females (G10.F) and resistant males (G10.M); raw p-value < 0.0001 (n = 4).
Principal component analysis (PCA)
The PCA showed that Dimensions 1 and 2 accounted for about 80% of the variability (respectively 45.08 and 33.79%) for the 40 DEGs we have selected among the rat transcriptome, based on their higher significance (Fig. 4 and Supplementary Fig. 4). We can clearly distinguish 4 groups of genes in the correlation circle (Fig. 4): one along the positive side of the dimension 1 which includes Per3, Nr1d1 or Cyp2e1; another one negatively correlated to the first one, which includes Eln, Arntl or Nfil3; a third one non correlated to the first two, on the positive side of dimension 2 and the negative side of dimension 1, which includes Nepn, Fnbp4 or Nxf1; a last one negatively correlated to the third, which includes Fbp1, Syne1, Vsig4 and Mfge8. On the Heat Map displayed in Fig. 5, we can see that the first group corresponds to genes upregulated in the resistant males compared to non-resistant males, while the second group corresponds of genes downregulated in the resistant females compared to non-resistant females.
Fig. 4. Principal Component Analysis of the most significant differentially expressed genes.

(Graph of variables or correlation circle; n = 4).
Fig. 5. Clustered Heat Map of the most significant differentially expressed genes (n = 4).

Down-regulated genes are in blue, and up-regulated in yellow. G0M are the non-resistant males, G10M are the resistant males, G0F the non-resistant females and G10F the resistant females.
Validation by qPCR
We then validated these results by qPCR by selecting differentially expressed genes on DNA chips. For Dbp, the results on chips showed in females a decrease in level of expression of around 22.4 fold between non-resistant rats and the resistant rats, while the qPCR showed a decrease of around 12.4 fold. For Nr1d1, the results on the chips showed a reduction in level of expression by a factor of 7.7 in the resistant females, whereas the qPCR showed a reduction by a factor of 4.8. For Tef, the results on chips showed a reduction by a factor of 3.6 in expression level in females, whereas the qPCR showed a reduction by a factor of 3.5. These qPCR results therefore showed amplification or reduction in the same direction as the results on chips, but the magnitudes were attenuated in qPCR (see Supplementary Fig. 5).
Gene Ontology
The full results of the gene ontology aspects of this research are beyond the scope of this publication but are available upon request to the authors. However, in summary, this functional analysis showed (in both males and females), changes in the expression levels of transcripts involved in immunity and inflammatory responses.
The biological processes associated with the transcripts that are most up regulated in females are related to cellular aging, circadian rhythm, and response to external stimuli. Co-expressions are linked to cancers, oxidative stress, or the response to hypoxia. In males, the co-expressions are mainly linked to immunity and to T lymphocytes and dendritic cells.
The co-expressions associated with the down-regulated transcripts are linked in males with immunity, aging and cancer; in females they are linked to cancers, dendritic cells, and infections (see Supplementary Table 5).
Circulating miRnome on PCR arrays
32 miRs were differentially expressed between the male non-resistant rats and the males selected for their resistance to DCS (Fig. 6, Supplementary Table 6 and Supplementary Fig. 6). When comparing resistant females to non-resistant females (Fig. 7 and Supplementary Table 7), we observe 19 differentially expressed miRs. Each miR can have several hundred targets (sometimes more than 600, which are mRNAs involved in different physiological functions and pathways), so to consolidate our results, we chose to cross the differentially expressed miRs with their potential targets who were also differentially expressed in the transcriptomic part of our study (see Crossed results: Transcriptome versus miRnome).
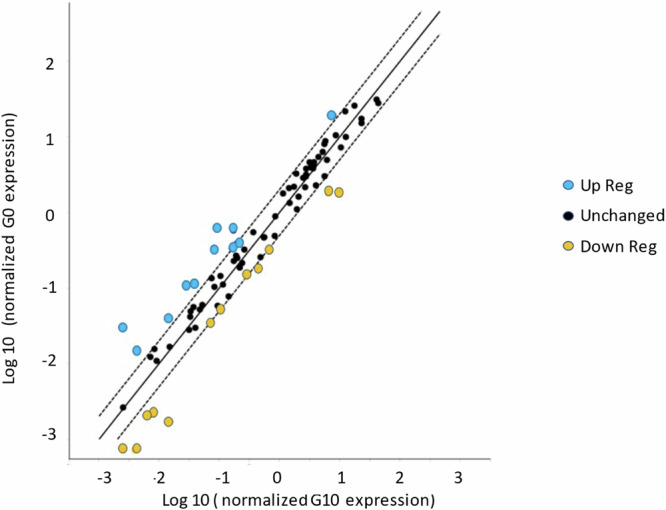
Fig. 6. Scatterplot of changes in expression of circulating miRs between the male non-resistant rats (G0M) and the resistant males of the 10th generation (G10M).

Up-regulated miRs are in blue, above the dotted line, and down-regulated miRs in yellow, below the dotted line. The legends have been manually modified for more clarity, as well as the significant modified blue and yellow dots, that have been enlarged from the original file generated by GeneGlobe (n = 4).
Fig. 7. Scatterplot of changes in expression of circulating miRs between the female non-resistant rats (G0F) and the resistant females of the 10th generation (G10F).
Up-regulated miRs are in blue above the dotted line and down-regulated miRs in yellow below the dotted line. The legends have been manually modified for more clarity, as well as the significant modified blue and yellow dots, that have been enlarged from the original file generated by GeneGlobe (n = 4).
The results presented in Supplementary Tables 6 and 7 are obtained from PCR arrays for circulating miRnome, and they show a large number of changes in the expression of miRs, after 10 generations of animals selected for their resistance to DCS from rats derived from the non-resistant strain. We observed, among other things, that on the PCR plate used for the study, more than half of the 84 circulating miRs appeared to be differentially expressed, even if a small number of results cannot be considered as certain given either the small number of copies in the samples or the wide 95% confidence interval. However, some expression changes were indicated via statistical significance. This was the case for miRs 122-5p, 223-3p, 128-3p, 145-5p and 191a-5p, all of which were down-regulated in the resistant males compared to non-resistant males. In females, the expression levels of miRs 215, 122-5p, 375-3p, 195-5p, 30d-5p and 199a-3p were different in the resistant rats compared to the non-resistant rats.
Considering only the most robust results (fold regulation >2 or <-2), the expression of 18 miRs was altered in the resistant males, whether increased or decreased, compared to the non-resistant strain from which they are derived. At the same time, in female rats, we observed 12 miRs whose expression was altered in resistant animals. Among these miRs, few of them were differentially expressed in both resistant males and females, including 499-5p, 204-5p, 200b-3p, 499-5p and 10b-5p (see Tables 1 and 2).
Table 1.
Cross-comparison of differentially expressed circulating miRs against differentially expressed transcripts, between resistant males and non-resistant males
| miR | Fold Regulation | p-value | Target mRNA | Functions and pathways | associated pathologies |
|---|---|---|---|---|---|
| rno-miR-499-5p | -74.8816 | 0.273858 | Fnbp4 | cytoskeleton dynamics | Waardenburg-anophthalmia syndrome |
| rno-miR-128-3p | 2.1106 | 0.180892 | Nxf1 | mRNA export including HSP70 | |
| rno-miR-204-5p | -4.2326 | 0.443815 | Epha5 | prot family TyrK, development including NS, synaptic plasticity, pancreatic cell communication | Susceptibility to lung cancer, Leber congenital amaurosis |
| rno-miR-200b-3p | -54.1556 | 0.425488 | |||
| rno-miR-499-5p | -74.8816 | 0.273858 | Amtn | calcium phosphate mineralization | Imperfect amelogenesis |
MiRs highlighted in bold are modified in both males and females. The functions and pathways or associated pathologies columns respectively present those as referenced in GeneCards (n = 4).
Table 2.
Cross-comparison of differentially expressed circulating miRs against differentially expressed transcripts, between resistant females and non-resistant females
| miR | Fold Regulation | p-value | mRNA | functions and pathways | associated pathologies |
|---|---|---|---|---|---|
| rno-miR-10b-5p | -5.4341 | 0.1063 | Nr1d2 | circadian rhythm, lipid and carbohydrate metabolism, Arntl regulation, inflammatory response, fatty acid oxidation, mitochondrial biogenesis, neutrophils and lung inflammation | atrioventricular septum defect |
| Arntl | circadian rhythm, leukocyte recruitment and vascular inflammation, thrombin generation |
MiRs highlighted in bold are modified in both males and females. The functions and pathways or associated pathologies columns respectively present those as referenced in GeneCards (n = 4).
Crossed results: Transcriptome versus miRnome
To consolidate the results obtained from the transcriptome and Gene Ontology, we cross-compared the plasma miRnome with differentially expressed hepatic transcripts, between the resistant and non-resistant rats, to investigate potential regulators of our DEGs. We thus obtained the results presented in Tables 1 and 2 and we sought the functions of the genes involved, to be able to compare them with the functions highlighted by Gene Ontology.
At the end, our miRnome versus transcriptome crossing seems to be coherent with the Gene Ontology and our results point to genes involved in immunity and inflammatory responses, as well as associated pathways and functions like circadian rhythm, complement cascade, cell signaling and cytoskeleton dynamics.
Pathway analysis
We conducted pathway analysis on the hepatic transcriptome results, with both GeneCards and Reactome, and they highlighted similar pathways related to the differentially expressed genes. Among the major pathways to which they point, we can cite inflammatory or immune responses (Tef, Vsig4, Nr1d1, Zcchc7, Cyp2e1, Cyp1a1, or Fnbp4), Circadian rhythm, (which might also influence inflammatory processes29 with Arntl, Nr1d1, Per2, Nfil3, or Nr1d2), complement cascade (Vsig4, Arntl or Nr1d1) cell signaling (Vsig4, Arntl, Fnbp4, Sstr3, Epha5, Amtn, Zcchc7, Nr1d1 or Rgs2), or cytoskeleton dynamics for Fnbp4 in GeneCards.
We also conducted another Reactome pathway analysis on the circulating miRnome results and interestingly, among the 51 miRs differentially expressed, 50 showed the same 3 pathways: miRs biogenesis, Miro GTPase Cycle and Signaling by Rho GTPases, Miro GTPases and RHOBTB3 (which are part Ras family or RAS-like families). The last miR, rno-miR-1-3p, seems to be also involved in 4 other pathways: Progressive trimming of alpha-1,2-linked mannose residues from Man9/8/7GlcNAc2 to produce Man5GlcNAc2, CLEC7A (Dectin-1) induces NFAT activation, CLEC7A (Dectin-1) signaling and Synthesis, secretion, and inactivation of Glucagon-like Peptide-1 (GLP-1).
If we extend the last miRnome pathway analysis to human miRs, we obtain the same pathways and also approximately thirty more, and that might be explained either by different actions between human and rat miRs on their targets or more likely by a better knowledge of human miR pathways. These pathways are involved mostly with cell migration, innate immune responses, ROS production or cell signaling.
Interaction networks
After having identified 7 transcripts from comparing the circulating miRnome vs hepatic transcriptome results, we searched for the interaction networks of the proteins coded by these transcripts in the bioinformatics analysis tool STRING v11.5 and we obtained different networks of interactions. However, caution should be exercised, as these interactions are speculative, and the same messenger RNA can be translated in many ways. While these networks only revealed a single direct interaction between the different encoded proteins (between Mfge8 and Amtn; see Fig. 8), each of the gene transcripts individually interacts with many other proteins that are critical to major functions (see Supplementary Fig. 7).
Fig. 8. Network of interactions referenced in the STRING v11.5 database between the 7 proteins encoded by the gene transcripts that emerge in the miRnome/transcriptome cross-comparison (n = 4).
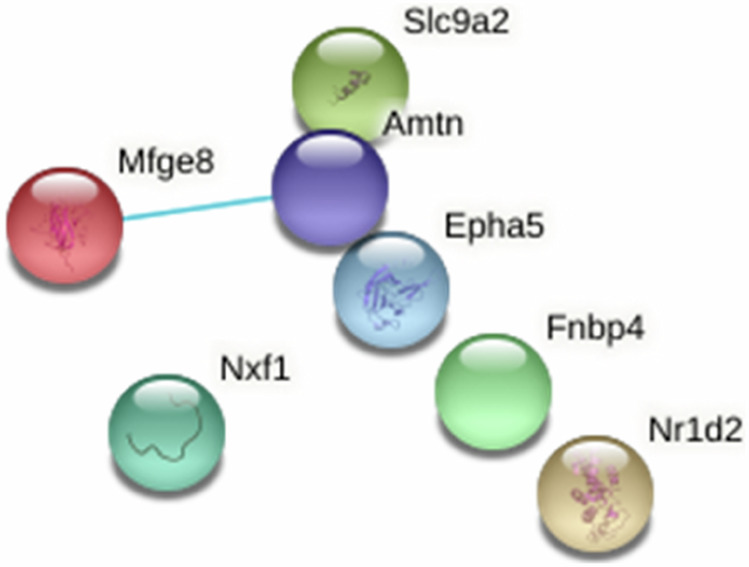
The only interaction between these proteins is represented by the line between Mfge8 and Amtn.
Among the interaction networks, Nr1d2 interacts with many proteins, including Clock, which plays a major role in the regulation of the circadian rhythm, and the vitamin D binding protein (Dbp). Mfge8 interacts with Interleukin 6 (IL6), the protein C3 of the complement system, and Apolipoprotein E (ApoE), one of whose forms is known as a genetic risk factor of Alzheimer’s disease. Amtn interacts with the bone morphogenetic protein BMP4, which belongs to the family of growth factors having an action mediated by the TGF-β pathway. Epha5 interacts with the EPH families (Ephrine family), which is a family of tyrosine kinase receptors involved in the development of the nervous system and erythropoiesis.
Arntl did not directly arise in the miRnome/transcriptome cross-comparison, but its transcript was differentially expressed, and it also plays a key role in the circadian rhythm, along CLOCK and Nr1d1. Arntl codes for the BMAL1 gene that “regulates time-dependent inflammatory responses following Toll-like receptor 4 (TLR4) activation by modulating enhancer activity”30.
Discussion
Previous studies on microparticles (MPs), which are extracellular vesicles (EVs) of 0.1 to 1 µm, have shown that MPs arise after decompression and are found to be elevated in subjects exposed to high pressures31. When these MPs are purified and injected into naïve mice, they trigger DCS-like symptoms8, indicating a link with the disease. EVs and MPs are also known to present or contain possible inflammatory mediators (e.g., proteins or micro RNAs)26,27, and they may provide a nucleation site for inert gas uptake by enlarging during the decompression phase32.
Beyond bubbles, high pressure exposures without proper decompression might trigger a MP release, as might high inert gas pressures31. Cytoskeletal instability might also be linked to MP release, as Thom et al.33 have also shown that neutrophils may respond by releasing MPs following oxidative stress. All these observations are consistent with our results, which point in particular towards inflammatory processes and even cytoskeleton dynamics cell signaling for Fnbp4. However, our results were obtained from an animal stationary model, and although it seems that MP release in murine cells is similar to human cells (albeit on a longer time scale for murine cells)33, our results will need to be confirmed in humans.
Interestingly, MPs are known to contain microRNAs that are short nucleotides ( ≈ 20 bp) also involved in many key cellular processes like inflammation through gene expression regulations26–28. In the present study, we focused on the stationary state of DCS resistant rats, transmitted among generations, and our results support the importance of inflammatory mechanisms in the triggering of clinical DCS, even if they do not settle the question of the initial trigger for these inflammatory processes. As DCS can also be seen as a systemic disease, we primarily focused our transcriptomic study on the liver, since it is the place of synthesis for many circulating proteins22 that can play major roles in immune responses and coagulation23–25. As miRs are well preserved along evolutionary pathways and can quickly regulate their targets, including circulating proteins26–28, we also screened the circulating miRnome, which is more easily accessible to search for DCS susceptibility or onset biomarkers.
Since the beginning of the selection protocol, we have observed many gender differences, starting with an earlier gain in resistance in females (at the 2nd generation whereas this gain in resistance only appeared in the 3rd generation in males), highlighting the heritable nature of this DCS resistance16. We later observed a difference in an allelic frequency of a Tag SNP located on the X chromosome of the 6th generation of our resistant rats17, compared to non-resistant rats. The gene Ophn1 is located in position 3’ of this Tag SNP, and it interacts with the Rho proteins. Ophn1 is also involved in the regulation of the circadian rhythm through Arntl34, which is upregulated in the resistant females.
Interestingly, all the miRs differentially expressed in our resistant rats seem to be related to the Ras or Ras-like proteins families, which include the Rho GTPases, known to play a role in platelet aggregation, by affecting the dynamics of the platelet cytoskeleton35–37, as well as on thrombosis38. Ophn1 also seems to play a role in the transduction of intracellular glutamatergic signals, synaptic maturation and plasticity, cell migrations39, inflammation and apoptosis40.
In the end, these results might also explain the gender differences previously observed in our rats, as it seems the DEGs’ profiles and the PCA clustering both show major gender differences with no correlation between the first and the third groups in Fig. 5, described in the PCA section of the results. Interestingly, the pathway analysis of the differentially expressed miRs points to 3 pathways only, and 2 of these pathways are related to the RAS-like gene families, which raises the question of a few genes or miRs responsible for these differential expressions. Beside the genes and miRs cited above, our results are also consistent with the phenotypes previously observed in our resistant rats, whether it be the decreased expression of the Nr1d2 transcript in females (involved in inflammation, mitochondrial biogenesis and the circadian rhythm) by the potential action of rno-miR-10b-5p (increased in G10 males and females) or the increased expression of rno-miR-128-3p (appears only in males) acting on Nxf1 (which is known for its role on HSP70) and Nr1d2.
HSP70, which transcript export is potentially regulated by Nxf1, activates Toll like receptors (TLRs) 2 and 4 when it is translocated into the extracellular medium41,42 or acts on NOS and transthyretin (TTR)43–45, both of which are suspected to play a role in DCS.
TLRs are major pattern recognition receptors (PRRs) and can initiate innate immune response and bridge it with specific immunity46. TLR2-KO and TLR4-KO have been reported to impair neutrophil migration47; our resistant males have higher expression levels of rno-miR-128-3p and Nxf1, which can act on TLR2 and TLR4 through HSP70, and would therefore possibly explain the higher neutrophil count of the resistant males17.
The overexpression of Mbtps2 in our DCS resistant rats supports the previously published theory that the TTR protein plays a role in DCS risk. TTR, which has been shown to lose its quaternary structure in rats facing DCS events48, also appeared to be slightly elevated during saturation diving, before the decompression phase49. TTR is involved in the formation of transthyretin amyloidosis50,51, which results from an accumulation of TTR monomers, which are then subject to quality control by the endoplasmic reticulum52. This quality control is thought to prevent an adaptive unfolded protein response (UPR) which goes through signaling pathways in which the gene Mbtps2 intervenes53. Mbtps2 is overexpressed in resistant males and is the target of rno-miR-181a-5p, which is itself slightly under-expressed in females and slightly over-expressed in males (Fold Regulations of -1.3895 and +1.4396 respectively).
Our results are consistent with the rare human studies on gene expressions related to diving. One such study showed that some genes associated with inflammation and innate immunity (TNRF1, TLR4 and HSP70 or NFκB) are upregulated in frequent divers54, which is coherent with our results. Another study explored the leukocyte transcriptome of divers presenting skin bends DCS symptoms by RNA-Sequencing, and they observed an upregulation of transcripts related to acute inflammation, activation of innate immunity and free radical scavenging55; however, the main genes differentially expressed in the acute onset of DCS in humans seem to be different. A third study of commercial divers showed an upregulation of genes involved in immune and inflammatory responses after a saturation dive56. Although there appears to be a common denominator, caution is still required as we don’t know if inflammation was caused by the gene expression modifications or if these modifications were caused by inflammation.
In order to further investigate this question, future work may include assessment of the effects of some miR mimic like rno-miR-10b-5p or 128-3p on the phenotypes observed in rats. In particular, this assessment may be relevant to examine changes in neutrophil count, basal oxygen consumption, and volume of mitochondria in skeletal striated muscle or coagulation factors, while in parallel assaying HSP70 mRNAs and verifying the effects on the inflammatory response and resistance to decompression sickness. In addition, the differentially expressed genes of these rats could be examined after a simulated dive and the onset of DCS-like symptoms. It would then be appropriate to compare the effects of these miRmimics in males compared to females to better elucidate potential male vs female differences.
We chose the Wistar (non-resistant) strain because it was considered to be less inbred than the Sprague-Dawley16,57, but of the 48 SNP markers targeted on the starting Wistar rats, only 18 exhibited polymorphisms17. It would therefore seem logical that the resistance factors highlighted during our study may not be the only ones that exist in nature, and although it seems complicated to repeat such an experiment on wild rats, it is perhaps possible to work with another, less inbred strain or to cross our resistant strain with other animals to increase the heterogeneity and discover more resistance factors58.
Although animal models provide some insights on human pathophysiology, our end goal is to transfer our results to humans to better understand, diagnose, and prevent DCS. Thus, it will be interesting to compare the expression levels of certain circulating miRs whose crossing with the transcriptome has been conclusive between divers who have already been treated for DCS and control divers with no DCS history. The modifications of the expression levels of the same miRs both before and after a dive could also provide valuable information on the pathophysiology of DCS.
Methods
Ethics committee
This protocol complies with Directive 2010/63/EU of the European Parliament, of the council on the protection of animals used for scientific research, and with articles of French laws R214-87 to R214-137 of the Rural Code and their subsequent modifications. It follows the 3Rs rule and has been approved by the University of Brest ethics committee for animal experimentation (APAFIS authorization #10395-2017061909495511).
Animals
We have complied with all relevant ethical regulations for animal use. The rats used came from a selection protocol started with a batch of 52 males and 52 females of the Wistar strain from Janvier Labs (Le Genest-Saint-Isle, France). Received in our laboratory at the age of 6 weeks, they were housed in the central animal facility of the university until the selection protocol, under controlled temperature (21 ± 1 °C) and light conditions (12 hours of light from 6 a.m. to 6 p.m.). The animals were fed ad libitum. They were equipped with electronic chips for identifiers. The selection protocol is described in the article by Lautridou et al.16. Control animals came from the same strain and from the same approved breeder and they were housed in the same animal facility (under the same conditions) during the 2 weeks preceding sampling. In order to avoid any bias linked to a persistent effect of diving on the expression of transcripts or miRs, the animals included in the study had never been exposed to any hyperbaric protocol before.
Transcriptomic samples
Four groups containing 4 animals (n = 4) each, all aged 11 weeks, were examined: 4 males and 4 females of the 10th generation (sometimes designated as G10) of selected rats, as well as 4 males and 4 females of the control strain Wistar (sometimes designated as G0). Before sampling, the animals were anesthetized and analgesized using a cocktail of Ketamine 1000 (80 mg/kg) and Xylazine 2% (12 mg/kg) administered intraperitoneally. A lobe of liver was then removed and placed in cryotubes then in liquid nitrogen before storing at - 80°C. We limited our study to 4 animals per group to maximize the power while limiting the costs. We calculated that number using the “optimal design” introduced by the RNASeqDesign tool59 for NGS sequencing. All the samples were taken in the morning between 10 h and 12 h to limit chronobiological effects between groups.
Transcriptome library preparation (microarray)
RNA extractions were performed from livers ground in liquid nitrogen, then homogenized using an Ultra-Turrax. Total RNAs were extracted on Nucleospin columns in the presence of NucleoZOL (Macherey Nagel; Düren, Germany). The concentrations of RNAs were measured using a Nanodrop, and their quality was verified with the Bioanalyzer (2100 expert from Agilent, on Eukaryote Total RNA Nano chips). Only samples whose RIN (RNA Integrity Number) was greater than or equal to 8.0 were used for DNA chip analyses. Internal standards (RNA Spike-In kit One color, Agilent) were added to 100 ng of RNA from each sample before being reverse transcribed in the presence of a T7-oligodT promoter. The cDNAs thus obtained then undergo a new transcription using T7 RNA polymerase in the presence of nucleotides (NTP) and Cya3- CTP. Finally, the complementary RNAs labeled with Cyanine 3 were purified on a column using of the RNeasy mini kit (Qiagen). The concentrations and labeling efficiency were again verified with Nanodrop before hybridization on Sureprint G3 rat GE 8x60k biochips (60,000 probes/field) from Agilent Technologies. Hybridization took place for an incubation period of 17 h at 65°C. The reading was done using the Agilent G2565CA scanner and its Scan Control 8.5 software from Agilent Technologies.
RTqPCR validation
From the mRNA samples used for the microarray experiment, cDNAs were produced using a qScript kit (QUANTA organic, VWR). Some genes differentially expressed between experimental conditions (dbp, Nr1d1 and tef) were amplified by quantitative PCR on ABI Prism 7500 fast using specific primers. The mRNA levels thus obtained were normalized with those of beta actin (used as a reference gene).
MiRnome samples
The animals used are the same as those of the transcriptomic study. We collected at least 1 ml of blood per animal by intracardiac puncture, then we centrifuged the samples a first time for 10 min at 1900 g and 4 °C, then a second time for 10 min at 16,000 g and 4 °C. The plasma obtained was then placed in cryotubes and then in liquid nitrogen before storing it at ˗80 °C.
MiRnome library preparation
The extractions of the miRs were carried out on a dedicated miRNeasy serum and plasma kit (Qiagen, Hilden, Germany). The miRs were then reverse-transcribed with the Qiagen miScript kit and analyzed on Qiagen MIRN-106ZC-12—miScript miRNA PCR Array Rat Serum & Plasma rat plasma miRnome PCR plates (96 wells). The plates were then read on an ABI Prism 7500 fast plate reader from Applied Biosystems (USA).
Transcriptome statistics and analysis
Agilent Sureprint G3 rat GE 8 x 60k biochips have eight hybridization fields (1 hybridized sample per field) which each include 30,000 probes spanning the entire rat genome. On-chip hybridization data processing Single-color DNA was produced using RStudio software and the Limma package (from the Bioconductor suite). Prior to statistical analysis, the intensities measured for each spot were corrected by the background noise value of the corresponding slide.
A standardization between slides was then carried out by the “Quantile” method to overcome technical variations. For each probe present on the biochip, Student’s t-tests were carried out to determine whether the expression of the corresponding genes was significantly changed between two conditions (p < 0.00001). Four comparisons were carried out: (1) non-resistant males versus non-resistant females, (2) resistant males versus resistant females (sex effect), (3) non-resistant males versus resistant males (generation effect for males), and (4) non-resistant females versus resistant females (generation effect for females). In order to take into account the number of false positives generated by multiple comparisons, the results of the statistical tests were corrected by Benjamini Hochberg tests. This test allows adjustment of p-values by taking into account the number of repetitions to limit the rate of false positives (FDR or False Discovery Rate). In our analysis, to identify a practical-length list of differentially expressed genes between two conditions, rather than a p FDR < 0.05, we use a threshold of p FDR less than 0.01 for the females and a raw p-value < 0.0001 for the males (Supplementary Tables 1 and 2).
The Principal Component Analysis was conducted with R Commander, RcmdrPlugin.FactoMineR, FactoMineR and corrplot R packages from 40 of the most significantly differentially expressed genes. The clustered Heat Map for the transcripts was realized with Heatmapper (www.heatmapper.ca/expression)60 from the same 40 genes.
RTqPCR statistics and analysis
DNA chip data validations were performed with 2-factor ANOVA (generation and gender) associated with Tukey’s tests, to compare the 4 groups with each other, but also to look for a gender (sex) or generation effect.
Bioinformatics analysis (Ontology)
We performed a functional analysis enriched by ontology on the ToppGene platform (https://toppgene.cchmc.org/), by analyzing 4 distinct groups: up-regulated transcripts in males, down-regulated transcripts in males, up-regulated transcripts in females and down-regulated transcripts in females. The significance level wasn’t modified, and we used a value of P FDR < 0.05 with a correction based on the Benjamini-Hochberg method, coupled in the ToppGene tool with corrections of Bonferroni and Benjamini-Yekutieli.
MiRnome statistics and analysis
The analysis was carried out on the GeneGlobe Data Analysis Center provided for this purpose by Qiagen. For the geNorm and Total Molecular Tag Count normalization methods, the p values are calculated based on a Student’s t-test of the replicate normalized miRNA expression values for each miRNA in non-resistant groups (males and females) and resistant groups (males and females). For the DESeq2 and Trimmed Mean of M (edgeR) normalization methods, the p values listed were returned by the respective Bioconductor software packages. The significance threshold was set at p < 0.05.
As the mathematical concept of differentially expressed genes differs from the biological concept61, and due to our limited number of samples, we also considered differential expression of miRs in terms of fold regulation (FR < -2 or FR > 2), and we crossed them with their differentially expressed targets (mirdb.org).
Gene Ontology
All the files and analyses are available in figshare62.
Statistics and reproducibility
All statistical analyses are described in detail in each section (software and tests).
Limitations of the study
We were able to work on only a limited number of animals (n = 4), due to the high cost of these experiments, and within the scope of this first study we were not able to verify in vivo the effects of the miRs we identified, so at this stage we can at best make assumptions about their effects. Nevertheless, we cross-compared our miRnome results against the transcriptome and gene ontology, with the goal of using that cross-comparison to provide a preliminary verification of our findings. We could also have carried out a transcriptomic spatial study, but we chose to focus on the liver as it is a key organ for circulating protein synthesis. We tried to compare mRNA expression levels with circulating miRnome, which can affect all the organism and might be used as a DCS or inflammatory witness. Due to the higher cost of RNA-Seq, we used microarrays and PCR plates for our hepatic transcriptome and circulating miRnome studies, and these technics don’t allow novel isoforms or alternative splicing detection.
Reporting summary
Further information on research design is available in the Nature Portfolio Reporting Summary linked to this article.
Supplementary information
Acknowledgements
We would like to thank Dr Rachel Lance for her precious help to review and correct this manuscript, as well as Pr Bernard Simon for his help on the PCA analysis and figure generation, especially for his help with R codes.
Author contributions
E.D.: conceptualization, data curation, formal analysis, funding acquisition, investigation, methodology, project administration, resources, software, validation, visualization, writing–original draft, writing–review and editing. A.G.: conceptualization, data curation, methodology, project administration, resources, supervision, validation, visualization, writing–original draft, and writing–review. J.O.: formal analysis, investigation, validation and visualization. F.G.: conceptualization, data curation, funding acquisition, methodology, project administration, resources, supervision, validation, visualization, writing–original draft, and writing–review.
Peer review
Peer review information
Communications Biology thanks Ingrid Eftedal and Nikolai Paul Pace for their contribution to the peer review of this work. Primary Handling Editors: Joao Manuel de Sousa Valente, George Inglis and Aylin Bircan. [A peer review file is available.]
Data availability
All transcriptome and miRnome data analyzed in this article are publicly available in figshare63. All the datasets are available through public repositories to support reproducibility, and the corresponding author can provide any detail or material on reasonable request.
Code availability
The codes of model simulation, data analysis, and visualization of this study are also available in figshare64.
Competing interests
The authors declare no competing interests.
Footnotes
Publisher’s note Springer Nature remains neutral with regard to jurisdictional claims in published maps and institutional affiliations.
Supplementary information
The online version contains supplementary material available at 10.1038/s42003-024-06963-3.
References
- 1.Imbert, J. et al. Static Metabolic Bubbles as Precursors of Vascular Gas Emboli During Divers’ Decompression: A Hypothesis Explaining Bubbling Variability. Frontiers in Physiology10, 807 (2019). [DOI] [PMC free article] [PubMed] [Google Scholar]
- 2.Papadopoulou, V. et al. A Critical Review of Physiological Bubble Formation in Hyperbaric Decompression. Advances in Colloid and Interface Science191–192, 22–30 (2013). [DOI] [PubMed] [Google Scholar]
- 3.Mahon, R. T. & Regis, D. P. Decompression and Decompression Sickness. Comprehensive Physiology4, 1157–1175 (2014). [DOI] [PubMed] [Google Scholar]
- 4.Gardette, B. & Plutarque, M. COMEX, 50 Years of Research and Innovations. Club des anciens de COMEX (2012).
- 5.Pontier, J.-M., Blatteau, J.-E. & Vallée, N. Blood Platelet Count and Severity of Decompression Sickness in Rats after a Provocative Dive. Aviation, Space, and Environmental Medicine79, 761–764 (2008). [DOI] [PubMed] [Google Scholar]
- 6.Pontier, J. M., Jimenez, C. & Blatteau, J. E. Blood Platelet Count and Bubble Formation After a Dive to 30 Msw for 30 min. Aviation, Space, and Environmental Medicine79, 1096–1099 (2008). [DOI] [PubMed] [Google Scholar]
- 7.Yang, M. et al. Microparticle Enlargement and Altered Surface Proteins after Air Decompression Are Associated with Inflammatory Vascular Injuries. Journal of Applied Physiology112, 204–211 (2012). [DOI] [PMC free article] [PubMed] [Google Scholar]
- 8.Yang, M. et al. Microparticles Generated by Decompression Stress Cause Central Nervous System Injury Manifested as Neurohypophysial Terminal Action Potential Broadening. Journal of Applied Physiology115, 1481–1486 (2013). [DOI] [PMC free article] [PubMed] [Google Scholar]
- 9.Wang, Q. et al. Antioxidants, Endothelial Dysfunction, and DCS: In Vitro and in Vivo Study. Journal of Applied Physiology119, 1355–1362 (2015). [DOI] [PubMed] [Google Scholar]
- 10.Mazur, A. et al. Influence of Decompression Sickness on Vasocontraction of Isolated Rat Vessels. Journal of Applied Physiology (Bethesda, Md.: 1985)120, 784–791 (2016). [DOI] [PubMed] [Google Scholar]
- 11.Lambrechts, K. et al. Venous Gas Emboli Are Involved in Post-Dive Macro, but Not Microvascular Dysfunction. European Journal of Applied Physiology117, 335–344 (2017). [DOI] [PubMed] [Google Scholar]
- 12.Doolette, D. J. & Murphy, F. G. Within-Diver Variability in Venous Gas Emboli (VGE) Following Repeated Dives. Diving and Hyperbaric Medicine Journal53, 333–339 (2023). [DOI] [PMC free article] [PubMed] [Google Scholar]
- 13.Berghage, T. E., Woolley, J. M. & Keating, L. J. The Probabilistic Nature of Decompression Sickness. Undersea Biomedical Research1, 189–196 (1974). [PubMed] [Google Scholar]
- 14.Buzzacott, P. et al. A Ternary Model of Decompression Sickness in Rats. Computers in Biology and Medicine55, 74–78 (2014). [DOI] [PubMed] [Google Scholar]
- 15.Lillo, R. S. & Parker, E. C. Mixed-Gas Model for Predicting Decompression Sickness in Rats. Journal of Applied Physiology89, 2107–2116 (2000). [DOI] [PubMed] [Google Scholar]
- 16.Lautridou, J. et al. Evidence of Heritable Determinants of Decompression Sickness in Rats. Medicine & Science in Sports & Exercise49, 2433–2438 (2017). [DOI] [PubMed] [Google Scholar]
- 17.Lautridou, J. et al. Physiological Characteristics Associated with Increased Resistance to Decompression Sickness in Male and Female Rats. Journal of Applied Physiology129, 612–625 (2020). [DOI] [PubMed] [Google Scholar]
- 18.Vallée, N. et al. Highlighting of the Interactions of MYD88 and NFKB1 SNPs in Rats Resistant to Decompression Sickness: Toward an Autoimmune Response. Frontiers in Physiology14, 1253856 (2023). [DOI] [PMC free article] [PubMed] [Google Scholar]
- 19.Dugrenot, E., Orsat, J. & Guerrero, F. Blood Pressure in Rats Selectively Bred for Their Resistance to Decompression Sickness. Diving and Hyperbaric Medicine Journal52, 119–125 (2022). [DOI] [PMC free article] [PubMed] [Google Scholar]
- 20.Vallee, Nicolas et al. Evidence of a Hormonal Reshuffle in the Cecal Metabolome Fingerprint of a Strain of Rats Resistant to Decompression Sickness. Scientific Reports11, 8317 (2021). [DOI] [PMC free article] [PubMed] [Google Scholar]
- 21.L’Abbate, A. et al. Gas Embolization of the Liver in a Rat Model of Rapid Decompression. American Journal of Physiology. Regulatory, Integrative and Comparative Physiology299, R673–R682 (2010). [DOI] [PubMed] [Google Scholar]
- 22.Miller, L. L., Bly, C. G., Watson, M. L. & Bale, W. F. The Dominant Role of the Liver in Plasma Protein Synthesis; a Direct Study of the Isolated Perfused Rat Liver with the Aid of Lysine-Epsilon-C14. The Journal of Experimental Medicine94, 431–453 (1951). [DOI] [PMC free article] [PubMed] [Google Scholar]
- 23.Ehlting, C., Wolf, S. D. & Bode, J. G. Acute-Phase Protein Synthesis: A Key Feature of Innate Immune Functions of the Liver. Biological Chemistry402, 1129–1145 (2021). [DOI] [PubMed] [Google Scholar]
- 24.Cohen, L. et al. Prothrombin Synthesis in the Adult and Fetal Liver. Thrombosis and Haemostasis78, 1468–1472 (1997). [PubMed] [Google Scholar]
- 25.Miao, C. H., Leytus, S. P., Chung, D. W. & Davie, E. W. Liver-Specific Expression of the Gene Coding for Human Factor X, a Blood Coagulation Factor. The Journal of Biological Chemistry267, 7395–7401 (1992). [PubMed] [Google Scholar]
- 26.van Niel, G., D’Angelo, G. & Raposo, G. Shedding Light on the Cell Biology of Extracellular Vesicles. Nature Reviews Molecular Cell Biology19, 213–228 (2018). [DOI] [PubMed] [Google Scholar]
- 27.Diehl, P. et al. Microparticles: Major Transport Vehicles for Distinct MicroRNAs in Circulation. Cardiovascular Research93, 633–644 (2012). [DOI] [PMC free article] [PubMed] [Google Scholar]
- 28.Krol, J., Loedige, I. & Filipowicz, W. The Widespread Regulation of MicroRNA Biogenesis, Function and Decay. Nature Reviews Genetics11, 597–610 (2010). [DOI] [PubMed] [Google Scholar]
- 29.Xu, H. et al. The Circadian Clock and Inflammation: A New Insight. Clinica Chimica Acta; International Journal of Clinical Chemistry512, 12–17 (2021). [DOI] [PubMed] [Google Scholar]
- 30.Oishi, Y. et al. Bmal1 Regulates Inflammatory Responses in Macrophages by Modulating Enhancer RNA Transcription. Scientific Reports7, 7086 (2017). [DOI] [PMC free article] [PubMed] [Google Scholar]
- 31.Arya, A. K. et al. Elevations of Extracellular Vesicles and Inflammatory Biomarkers in Closed Circuit SCUBA Divers. International Journal of Molecular Sciences24, 5969 (2023). [DOI] [PMC free article] [PubMed] [Google Scholar]
- 32.Thom, S. R. et al. Intramicroparticle Nitrogen Dioxide Is a Bubble Nucleation Site Leading to Decompression-Induced Neutrophil Activation and Vascular Injury. Journal of Applied Physiology114, 550–558 (2013). [DOI] [PubMed] [Google Scholar]
- 33.Thom, S. R., Bhopale, V. M. & Yang, M. Neutrophils Generate Microparticles during Exposure to Inert Gases Due to Cytoskeletal Oxidative Stress. Journal of Biological Chemistry289, 18831–18845 (2014). [DOI] [PMC free article] [PubMed] [Google Scholar]
- 34.Valnegri, P. et al. A Circadian Clock in Hippocampus Is Regulated by Interaction between Oligophrenin-1 and Rev-Erbα. Nature Neuroscience14, 1293–1301 (2011). [DOI] [PubMed] [Google Scholar]
- 35.Aslan, JosephE. Platelet Rho GTPase Regulation in Physiology and Disease. Platelets30, 17–22 (2019). [DOI] [PubMed] [Google Scholar]
- 36.Elvers, M., Beck, S., Fotinos, A., Ziegler, M. & Gawaz, M. The GRAF Family Member Oligophrenin1 Is a RhoGAP with BAR Domain and Regulates Rho GTPases in Platelets. Cardiovascular Research94, 526–536 (2012). [DOI] [PubMed] [Google Scholar]
- 37.Elvers, M. RhoGAPs und Rho-GTPasen in Thrombozyten. Hämostaseologie36, 168–177 (2016). [DOI] [PubMed] [Google Scholar]
- 38.Fotinos, A. et al. Loss of Oligophrenin1 Leads to Uncontrolled Rho Activation and Increased Thrombus Formation in Mice. Journal of Thrombosis and Haemostasis13, 619–630 (2015). [DOI] [PubMed] [Google Scholar]
- 39.Compagnucci, C., Barresi, S., Petrini, S., Bertini, E. & Zanni, G. Rho-Kinase Signaling Controls Nucleocytoplasmic Shuttling of Class IIa Histone Deacetylase (HDAC7) and Transcriptional Activation of Orphan Nuclear Receptor NR4A1. Biochemical and Biophysical Research Communications459, 179–183 (2015). [DOI] [PubMed] [Google Scholar]
- 40.Niermann, C. et al. Oligophrenin1 Protects Mice against Myocardial Ischemia and Reperfusion Injury by Modulating Inflammation and Myocardial Apoptosis. Cellular Signalling28, 967–978 (2016). [DOI] [PubMed] [Google Scholar]
- 41.Asea, A. Heat Shock Proteins and Toll-Like Receptors. In Toll-Like Receptors (TLRs) and Innate Immunity, édité par Stefan Bauer et Gunther Hartmann, 183:111-27. Handbook of Experimental Pharmacology. Berlin, Heidelberg: Springer Berlin Heidelberg, 2008. [DOI] [PubMed]
- 42.Katahira, J., Inoue, H., Hurt, E. & Yoneda, Y. Adaptor Aly and co-adaptor Thoc5 function in the Tap-p15-mediated nuclear export of HSP70 mRNA. The EMBO Journal28, 556–567 (2009). [DOI] [PMC free article] [PubMed] [Google Scholar]
- 43.Wang, X. et al. The Systemic Amyloid Precursor Transthyretin (TTR) Behaves as a Neuronal Stress Protein Regulated by HSF1 in SH-SY5Y Human Neuroblastoma Cells and APP23 Alzheimer’s Disease Model Mice. Journal of Neuroscience34, 7253–7265 (2014). [DOI] [PMC free article] [PubMed] [Google Scholar]
- 44.Park, S. L. et al. HSP70-1 Is Required for Interleukin-5-Induced Angiogenic Responses through ENOS Pathway. Scientific Reports7, 44687 (2017). [DOI] [PMC free article] [PubMed] [Google Scholar]
- 45.Shin, Y. C., Choi, K. Y. & Kim, W. G. Cyclosporin A Has a Protective Effect with Induced Upregulation of Hsp70 and NNOS on Severe Spinal Cord Ischemic Injury in Rabbits. Journal of Investigative Surgery20, 113–120 (2007). [DOI] [PubMed] [Google Scholar]
- 46.Li, D. & Wu, M. Pattern Recognition Receptors in Health and Diseases. Signal Transduction and Targeted Therapy6, 291 (2021). [DOI] [PMC free article] [PubMed] [Google Scholar]
- 47.Breda, L. C. D. et al. Fonsecaeapedrosoi Conidia and Hyphae Activate Neutrophils Distinctly: Requirement of TLR-2 and TLR-4 in Neutrophil Effector Functions. Frontiers in Immunology11, 540064 (2020). [DOI] [PMC free article] [PubMed] [Google Scholar]
- 48.Lautridou, J. et al. Effect of Simulated Air Dive and Decompression Sickness on the Plasma Proteome of Rats. Proteomics. Clinical Applications10, 614–620 (2016). [DOI] [PubMed] [Google Scholar]
- 49.Domoto, H. et al. Up-Regulation of Antioxidant Proteins in the Plasma Proteome during Saturation Diving: Unique Coincidence under Hypobaric Hypoxia. PloS One11, e0163804 (2016). [DOI] [PMC free article] [PubMed] [Google Scholar]
- 50.Liz, M. A. et al. A Narrative Review of the Role of Transthyretin in Health and Disease. Neurology and Therapy9, 395–402 (2020). [DOI] [PMC free article] [PubMed] [Google Scholar]
- 51.Azevedo, E. P. et al. Inflammatory Profiling of Patients with Familial Amyloid Polyneuropathy. BMC Neurology19, 146 (2019). [DOI] [PMC free article] [PubMed] [Google Scholar]
- 52.Chen, JohnJ., Joseph, C. Genereux, et, R. & Luke Wiseman Endoplasmic Reticulum Quality Control and Systemic Amyloid Disease: Impacting Protein Stability from the inside Out. IUBMB Life67, 404–413 (2015). [DOI] [PMC free article] [PubMed] [Google Scholar]
- 53.Al-Maskari, M. et al. Site-1 Protease Function Is Essential for the Generation of Antibody Secreting Cells and Reprogramming for Secretory Activity. Scientific Reports8, 14338 (2018). [DOI] [PMC free article] [PubMed] [Google Scholar]
- 54.Eftedal, I. et al. Acute and Potentially Persistent Effects of Scuba Diving on the Blood Transcriptome of Experienced Divers. Physiological Genomics45, 965–972 (2013). [DOI] [PubMed] [Google Scholar]
- 55.Magri, K. et al. Acute Effects on the Human Peripheral Blood Transcriptome of Decompression Sickness Secondary to Scuba Diving. Frontiers in Physiology12, 660402 (2021). [DOI] [PMC free article] [PubMed] [Google Scholar]
- 56.Kiboub, F. Z. et al. Blood Gene Expression and Vascular Function Biomarkers in Professional Saturation Diving. Frontiers in Physiology9, 937 (2018). [DOI] [PMC free article] [PubMed] [Google Scholar]
- 57.Klöting, I., Nitschke, C. & van den Brandt, J. Impact of Genetic Profiles on Experimental Studies: Outbred versus Wild Rats. Toxicology and Applied Pharmacology189, 68–71 (2003). [DOI] [PubMed] [Google Scholar]
- 58.Sathiaseelan, R. et al. A Genetically Heterogeneous Rat Model with Divergent Mitochondrial Genomes. The Journals of Gerontology: Series A78, 771–779 (2023). [DOI] [PMC free article] [PubMed] [Google Scholar]
- 59.Lin, C. W. et al. RNASeqDesign: A Framework for Ribonucleic Acid Sequencing Genomewide Power Calculation and Study Design Issues. Journal of the Royal Statistical Society Series C: Applied Statistics68, 683–704 (2019). [DOI] [PMC free article] [PubMed] [Google Scholar]
- 60.Babicki, S. et al. Heatmapper: Web-Enabled Heat Mapping for All. Nucleic Acids Research44, W147–W153 (2016). [DOI] [PMC free article] [PubMed] [Google Scholar]
- 61.McCarthy, D. & Smyth, G. K. Testing Significance Relative to a Fold-Change Threshold Is a TREAT. Bioinformatics25, 765–771 (2009). [DOI] [PMC free article] [PubMed] [Google Scholar]
- 62.Dugrenot, E. Gene Ontology DCS Resistant rats. figshare. Journal contribution. 10.6084/m9.figshare.25697232.v1 (2024).
- 63.Dugrenot, E. DCS resistant rats data (miRnome, transcriptome, etc). figshare. Journal contribution. 10.6084/m9.figshare.26166049.v1 (2024).
- 64.Dugrenot, E. DCS resistant rats transcriptomic_ R codes. figshare. Journal contribution. 10.6084/m9.figshare.26166469.v1 (2024).
Associated Data
This section collects any data citations, data availability statements, or supplementary materials included in this article.
Supplementary Materials
Data Availability Statement
All transcriptome and miRnome data analyzed in this article are publicly available in figshare63. All the datasets are available through public repositories to support reproducibility, and the corresponding author can provide any detail or material on reasonable request.
The codes of model simulation, data analysis, and visualization of this study are also available in figshare64.