Abstract
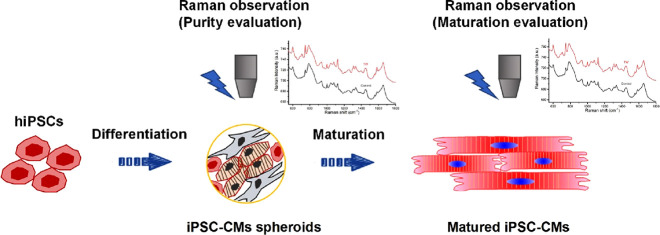
I. Background: Human induced pluripotent stem cell (hiPSC) derived cardiomyocytes (CMs) have been utilized in drug toxicity evaluation, drug discovery, and treating heart failure patients, showing substantial effects. Ensuring the quality, purity, and maturation of hiPSC-CMs during large-scale production is crucial. There is a growing demand for a novel method to characterize cell molecular profiles without labels and without causing damage. II. Methods: In this study, we employed label-free Raman microscopy to evaluate hiPSC-derived CMs. The study involved the characterization of cell molecular profiles without labels and without causing damage. The correlation between Raman spectroscopy of specific components, such as cytochrome c and myoglobin, and CM purity and maturation following hiPSC differentiation was investigated. Additionally, the validation of this correlation was performed by assessing mixtures of commercially available CMs (iCell cardiomyocytes2) and fibroblasts at various ratios as well as hiPSC-derived CMs with different efficiencies. Furthermore, CMs were matured using rapid pacing of traveling waves, and the Raman profiles of matured CMs were compared to those of immature ones. III. Results: Raman spectroscopy indicated that the cytochrome c and myoglobin showed correlation with the purity and maturation of CMs following differentiation of hiPSCs. This correlation was validated through experiments involving different CM-fibroblast mixtures and hiPSC-derived CMs with varying efficiencies. Moreover, matured CMs exhibited markedly different Raman profiles compared to immature ones, indicating the potential of Raman imaging as a tool for assessing CM maturation. IV. Conclusions: We discovered that Raman spectroscopy of certain components, such as cytochrome c and myoglobin, correlates with the CM purity and maturation following hiPSC differentiation. The findings of this study highlight the potential of label-free Raman microscopy as a nondestructive, high-content, and time-efficient method for quality control of hiPSC-derived CMs. This approach could significantly contribute to ensuring the quality and maturity of hiPSC-CMs for various applications in drug discovery and regenerative medicine.
Introduction
Cardiovascular disease remains the primary cause of global mortality. Human induced pluripotent stem cell (hiPSC)-derived cardiomyocytes (CMs) hold promise for heart failure treatment. Our group conducted pioneering allogeneic iPSC-CMs transplantation, affirming its efficacy and safety in multiple patients.1,2,3,4 On the other hand, using human cardiomyocytes instead of animal experiments for drug toxicity testing and screening drugs for heart disease treatment is considered to have broader application prospects.5 Quality control is paramount for large-scale hiPSC-CM production, focusing on parameters such as CM purity and maturation. Purity may be compromised by non-CMs, including residual iPSCs, potentially leading to teratoma formation post-transplantation. Evaluating CM maturity is crucial for assessing therapeutic efficacy post-transplantation and obtaining a more accurate response to drugs.6 Current gold-standard molecular biology methods, such as flow cytometry and immunostaining, often induce cell damage during fixation.
The prevailing approach for CM preparation involves 3D differentiation protocols. Despite lacking superior alternatives to flow cytometry and genetic analysis, it is imperative to dissociate 3D spheroids into single cells for evaluation, although this may impact cell viability due to stress. There is a pressing need for a novel, nondestructive, and label-free technology to assess cells or 3D spheroid without dissociation, offering an alternative to traditional molecular biology assessments.
Raman microscopy is a potent, label-free, and nondestructive tool capable of monitoring live tissue based on the chemically specific vibrations of intrinsic cellular biomolecules.7−9 It has been utilized to identify various cellular phenomena such as the cell death stage in apoptotic cells,10 the stages of tumorigenesis,11 and the developmental stages of hiPSC-derived neurons.12 Furthermore, the accumulation of functional molecules in hepatocytes derived from hiPSCs during differentiation and maturation has been observed.8
A previous study demonstrated that Raman spectroscopy can distinguish CMs from the surrounding fibrotic area in a rat heart7 and non-CMs in culture dish,13 suggesting its potential utility in distinguishing CMs from non-CMs in the hiPSC-derived mixture. Raman microscopy was also used to distinguish the CMs from the non-CMs,14,15 with a reported specificity of 97% and a sensitivity of 96% for dissociated single CMs.15 In addition, Brauchle et al. have shown that Raman can be employed to obtain biochemical fingerprints of atrial and ventricular CMs differentiated from embryonic stem (ES) cells, while also distinguishing fibroblasts from CMs.16 However, most of these reports are confined to analyses at the single-cell level. Notably, there is a lack of reports comparing Raman data with results from molecular biology assays, such as flow cytometry, immunostaining, and genetic analysis, particularly regarding CMs with varying differentiation efficiencies and purities. Additionally, although the potential of Raman spectroscopy for assessing CMs has been demonstrated, specific markers for evaluating CMs have yet to be identified.
In this study, we employed line-illumination Raman microscopy to directly observe 3D cardiac tissue, enabling the acquisition of several hundred spectra with a single exposure. The spatial resolution for visualizing living cells is comparable to that of laser scanning confocal microscopy. Reference samples were prepared by mixing commercially available iCell CMs and fibroblasts at different ratios in a v-bottom 96-well plate. Genetic and immunostaining analyses were utilized to confirm the content of iCell/fibroblast spheroids. Notably, Raman microscopy revealed a significant trend in iCell/fibroblast spheroids with different mixing ratios. To further validate these results, the Raman spectrum of 3D spheroids differentiated from iPSCs exhibited a similar trend to the reference samples, as confirmed using flow cytometry. Among these peaks, specific markers such as cytochrome c and myoglobin were identified, which may serve as potential markers for quantifying CMs purity.
The iPSC-CMs tend to display an immature phenotype compared with adult CMs, in terms of sarcomere structure, electrophysiology, contractile function, and calcium-handling properties.17 These differences may impede their application in disease modeling and regenerative therapy. Shen et al. utilized Raman analysis to compare hESC-derived CMs at various maturation stages, revealing distinct bands and indicating that the trained CMs resemble fetal CMs more closely than the control CMs.18 However, due to the use of a 785 nm laser, the information regarding cytochromes was not revealed. In this study, we employed line-illumination Raman microscopy at an excitation wavelenght of 532 nm to observe CMs with different maturation levels generated using our previously developed traveling wave-based method.19−21 This approach revealed significantly distinct Raman spectra and enabled the visualization of living cells among different groups. Notably, the expression of cytochrome c and myoglobin was higher in CMs with advanced maturation levels compared with control group. We demonstrated that cytochrome c and myoglobin can serve as markers for noninvasively assessing the purity and maturation of CMs through Raman-based measurements.
Results and Discussion
Raman Spectra of Spheroid Mixture of iCell and Fibroblast at Different Ratios
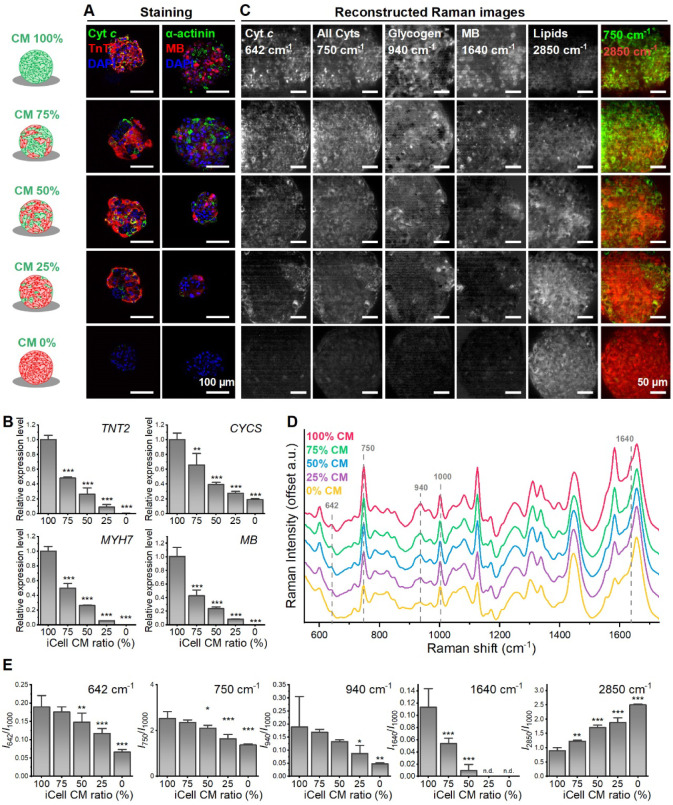
The spheroids made by using different ratios of CMs and fibroblasts were subjected to immunostaining, RT-PCR, and Raman evaluation (Figure 1). Immunostaining data confirmed changes in composition within the iCell/fibroblast spheroids across different mixture ratios. Lower expression levels of cytochrome c, TnT2, α-actinin, and myoglobin were observed in groups with lower CMs content (Figure 1A), a trend corroborated by the RT-PCR data (Figure 1B). Raman spectra of these samples revealed significant linear decreases in Raman shift at 642 cm–1 (cytochrome c) and 750 cm–1 (all cytochromes) as the CM content decreased (Figure 1C–E). Additionally, Raman peaks at 940 cm–1 and 1,640 cm–1 indicated reduced glycogen and myoglobin (MB) content, respectively. Increased lipid droplets (2,850 cm–1) were observed in groups with lower CMs ratio.
Figure 1.
Raman observation on mixture of iCell with fibroblast. (A) Representative confocal images of iCell/fibroblast spheroid with different mixing ratio on day 3. The spheroids were stained with anti-TnT2, anti-cytochrome c (Cyt c), anti-α-actinin, anti-myoglobin (anti-MB), and DAPI. (B) Relative gene expression of TnT2, cytochrome c (CYCS), β-Myosin Heavy Chain (MYH7), myoglobin (MB) (Mean ± SD, n = 3 biologically independent samples, **p < 0.01, ***p < 0.001). (C) Reconstructed Raman images at 642, 750, 940, 1,640, and 2,850 cm–1. (D) Comparison of average Raman signal for iCell/fibroblast spheroid with different mixing ratios. (E) Quantitative analysis of the Raman intensity at 642, 750, 940, 1,640, and 2,850 cm–1 (mean ± SD, n = 3 biologically independent samples, *p < 0.05, **p < 0.01, ***p < 0.001).
Raman Microscopy for Analyzing the Efficiency of Differentiation in Live Cardiac Spheroids During Differentiation
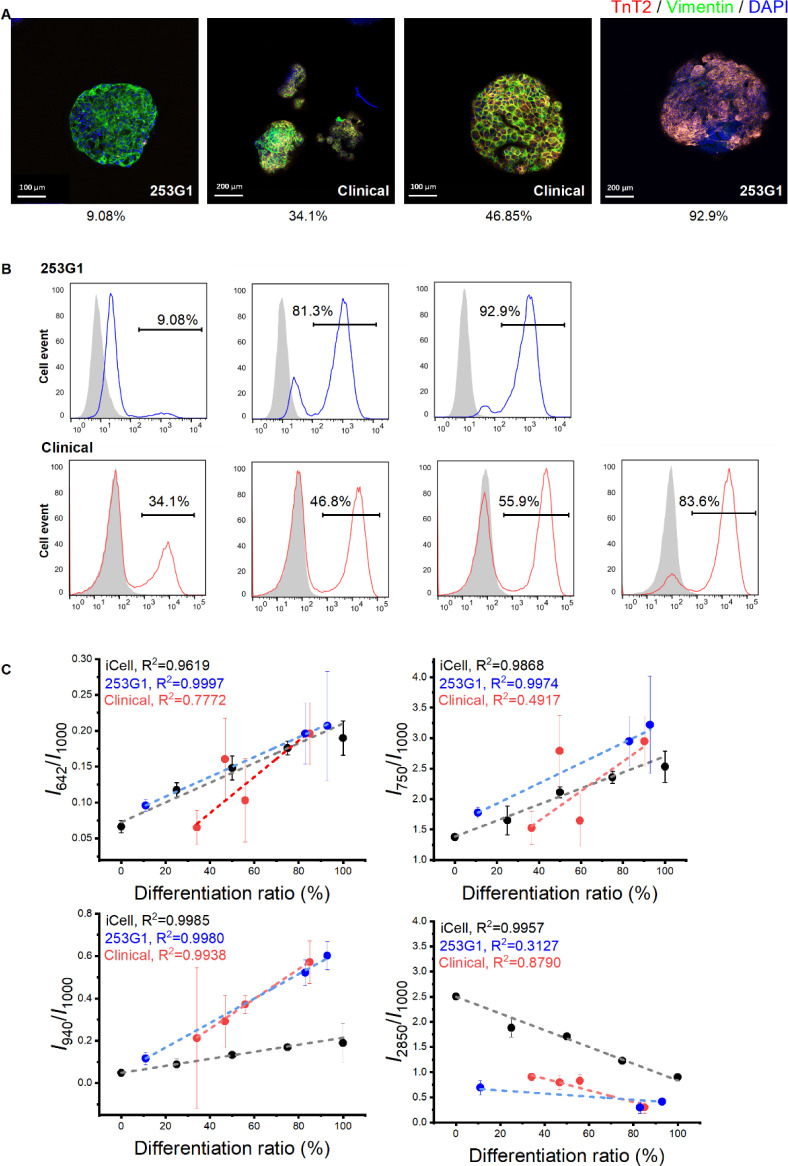
In addition to the Raman observation of iCell/fibroblast spheroids, we further analyzed the Raman spectra of CM spheroids differentiated from two hiPSC cell lines (research grade: 253G1 and clinical grade: QHJI14s04, Supplementary Figures 1 and 2). The CMs with different TnT2 positive ratios were used for Raman microscopy. The immunostaining and flow cytometry data confirmed the various contents of hiPSC-derived CM spheroids (Figure 2A,B). Spheroids in the same production lots were used for Raman spectroscopy analysis (Figure 2C). Linear increases were observed in both 253G1 (R2 = 0.9997) and QHJI14s04 (R2 = 0.7772) groups in Raman shift at 642 cm–1, similar to the iCell group (R2 = 0.9619), indicating an increased cytochrome c content in the group with a higher TnT2 positive ratio. Additionally, the Raman shift at 750 cm–1 (all cytochromes) showed a linear increase in the 253G1 group (R2 = 0.9974), but not in the QHJI14s04 group (R2 = 0.4917), in which all the data points were distributed around the iCell trendline (R2 = 0.9868). The QHJI14s04 group exhibited a significant linear increase in glycogen (940 cm–1, R2 = 0.9938) and a decrease in lipid contents (2,850 cm–1, R2 = 0.879) respectively, correlating with a higher TnT2 positive ratio, similar to the findings in the iCell group (940 cm–1: R2 = 0.9985; 2,850 cm–1: R2 = 0.9957). However, this trend exists only in glycogen (940 cm–1: R2 = 0.998), but not in lipid (2,850 cm–1: 0.3127) for the 253G1 cell line. These data indicate that although there is a variation in the Raman profiles among different cell lines, certain Raman spectra, such as that of cytochrome c, may be used as a universal marker for assessing the CM content in the hiPSC-derived mixture.
Figure 2.
Raman observation on human induced pluripotent stem cells (hiPSCs) differentiated cardiac spheroids. (A) Representative confocal images of hiPSC differentiated cardiac spheroids. The spheroids were stained with anti-TnT2, anti-vimentin and DAPI. The TnT2 positive ratios obtained by fluorescence-activated cell sorting were illustrated in the bottom. (B) Representative flow cytometry data of cTnT-positive cells differentiated from hiPSCs (253G1 and clinical cell line: QHJI14s04) in different experimental batches. (C) Quantitative analysis of the Raman intensity at 642, 750, 940, and 2,850 cm–1 (mean ± SD, each point represents average value from 3 to 5 spheroids from one independent differentiation).
CMs constitute approximately 30–40% of the cell numbers in the heart, with the majority of the remaining cells being nonmyocytes, primarily comprised of fibroblasts.22 Similarly, the hiPSC-derived CMs mixture predominantly exhibits positivity for the cardiac marker troponin T (TnT2), while the non-CMs predominantly express the fibroblast marker vimentin (>70%), the smooth muscle marker (∼30%), and to a lesser extent, the endothelial cell marker CD31 (∼2%).23 The CMs derived from hiPSCs may continue beating for the long-term and consume much more oxygen than non-CMs in the heart.24,25 MB, an essential oxygen-binding protein present exclusively in muscle cells, plays a critical role in providing energy through oxygen storage and transportation. Additionally, cytochrome is a component of the mitochondrial electron transport chain involved in ATP production for cardiac cell contraction.26 These align well with the linear relationship observed between MB and cytochrome c, as well as the CM content in the hiPSC-derived mixture.
Although there is variations among iPSC-CM spheroids, even from the same production batch, which may cause significant differences during the Raman evaluation (Figure 2C), increasing the number of sampled spheroids in the assay may mitigate this variation in the data and could also impose higher throughput requirements. The scanning speed for current Raman observations remains insufficient, thus limiting assay throughput. To address this limitation, our future efforts will concentrate on enhancing scanning speed, increasing scanning points, optimizing spheroid arrangement, and implementing more efficient analysis. We have recently developed a 96-well-plate-based Raman system for the simultaneous analysis of multiple spheroids27 and upgraded single-line illumination to multiline illumination.28 These enhanced systems could be leveraged for future large-scale analysis of hiPSC-derived cardiac tissue, potentially increasing throughput by two to three orders of magnitude compared to the current system.
Preparing Mature hiPSC-Derived CM Tissue by Using Traveling Wave Promotion
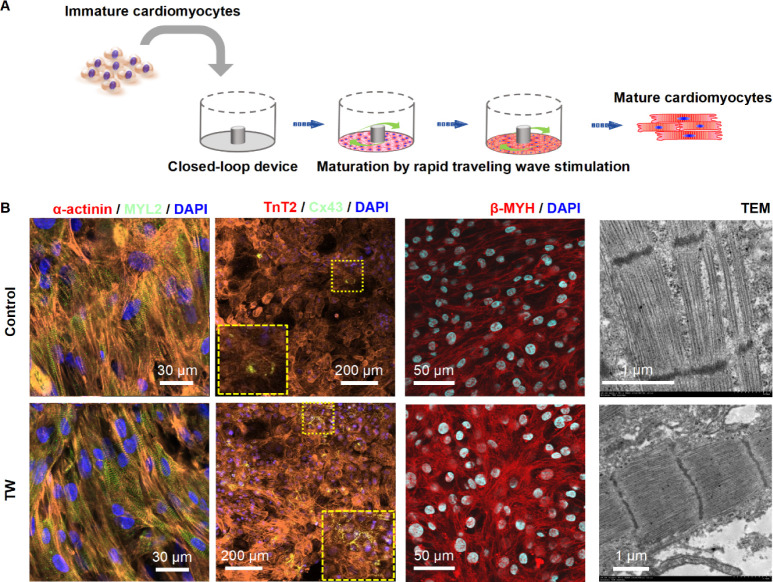
We previously developed a spontaneously originating traveling wave (TW)-based method for promoting the maturation of hiPSC-derived CMs (Figure 3A).19,21 After a 2-week training period with TW, the CMs exhibited improved sarcomeric organization, upregulated expression of cardiac-specific genes, enhanced Ca2+ handling properties, increased oxygen consumption rate, and enhanced contractile force. In the present study, we cultured mature hiPSC-derived cardiac tissues in a monolayer formation for observation using Raman spectroscopy (Figure 3A). The mature TW group demonstrated significantly increased expression of the gap junction marker (Cx43), and the mature CMs marker (α-actinin, MYL2, β-myosin heavy chain [β-MHC]). Additionally, electron microscopy revealed that the CMs in the TW group exhibited larger sarcomere bundles and well-defined Z disks, I-bands, and myofibrils compared to those in the control group (Figure 3B).
Figure 3.
Rapid pacing of traveling wave promote maturation of hiPSC-derived cardiomyocytes (CMs). (A) Schematic and image describing the cell plating and traveling wave origination in the close-loop device. (B) Representative confocal images of cardiac tissue with or without traveling wave (TW) on day 14. CMs were stained with anti-α-actinin, anti-MYL2, anti-TnT2, anti-Cx43, anti-β-MHC, and DAPI. Transmission electron microscopy (TEM) analysis of cardiac tissue was performed for both the TW training and control groups on day 14.
Raman Microscopy for Analyzing Cardiac Tissue with Different Maturation Levels
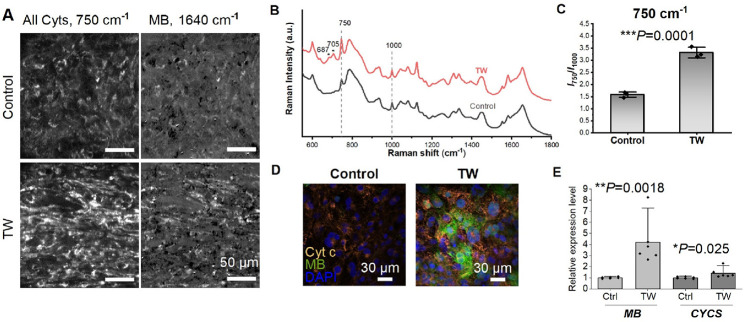
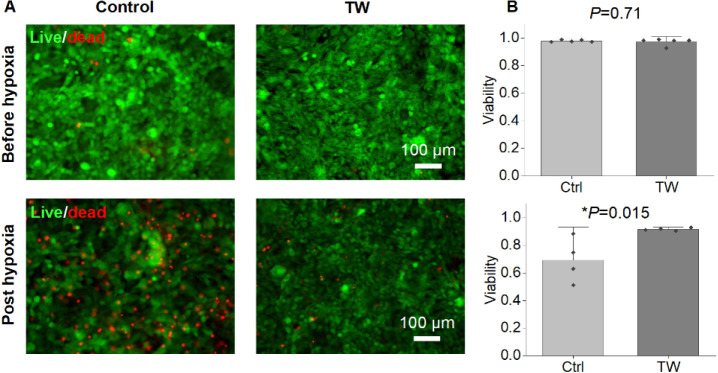
We utilized line-illumination Raman microscopy to characterize both the mature TW group and the control group. The TW group exhibited increased expression (as depicted in Figure 4A–C) of cytochromes (750 cm–1) and MB (1,640 cm–1). The heightened expression of cytochrome c and MB was validated through both immunostaining and reverse transcription polymerase chain reaction (RT-PCR) (Figure 4D,E). Maturation of hiPSC-derived cardiac tissue was associated with enhanced cytochrome c activity.29−31 Moreover, hearts rich in MB outperformed those with lower MB levels under hypoxic conditions,32 and animals acclimated to low-oxygen environments exhibited increased concentrations of MB in skeletal or cardiac muscle.33,34 We further assessed the survival rates under hypoxic conditions for both groups with varying levels of MB expression (Figure 5). While there was no discernible difference in viability between the TW and control groups prior to hypoxic culture, following 5 days of hypoxic culture, the TW group displayed viability significantly greater than that of the control group (Figure 5). This suggests that the heightened expression of MB may have augmented the survival of TW CMs due to (1) enhancement of the cells’ ability to acquire oxygen through MB;32 and (2) cardio-protective effects of MB.35
Figure 4.
Raman analysis of hiPSC-derived cardiac tissue at different maturation levels. (A) Reconstructed Raman images at 750 and 1,640 cm–1. (B) Comparison of average Raman signal for hiPSC-derived cardiac tissue with (TW) or without (Control) TW training. (C) Quantitative analysis of the Raman intensity at 750 cm–1 (mean ± SD, n = 3 biologically independent samples, *p < 0.05, **p < 0.01, ***p < 0.001). (D) Representative confocal images of hiPSC-derived cardiac tissue with different maturation level on day 14. The cells were stained with anti with anti-Cyt c, anti-MB, and DAPI. (E) Relative gene expression of Cyt-c (CYCS) and MB. (mean ± SD, n = 6 biologically independent samples, *p < 0.05, **p < 0.01).
Figure 5.
Mature CMs showed enhanced survival post hypoxia. (A) Representative images for live/dead staining on hiPSC-derived cardiac tissue at different maturation level before and after hypoxia culture (5% oxygen) for 5 d. (B) Quantitative analysis of the viability for both groups (mean ± SD, n = 4 biologically independent samples, *p < 0.05).
The maturation level of iPSC-derived CMs is crucial for their clinical applications and disease modeling.17,36 CM maturity can be assessed using various molecular biology techniques such as immunostaining, RT-PCR, and transmission electron microscopy (TEM). However, these methods require sample treatment, rendering the cells unusable for further applications after evaluation. Raman microscopy, distinguished by its marker-free and nondestructive nature, necessitates no specific sample treatment. In a prior investigation, significant differences in Raman spectra were observed among hESC-derived CMs at varying maturation stages.18 Nonetheless, only a limited number of Raman peaks have been reported to be associated with CM maturation. In addition, the Raman spectra have been used for evaluating amount of MB and cytochrome c in the cardiomyocytes,37,38 through which cellular function such as mitochondrial respiration could be monitored.39 In this study, we identified MB and cytochrome c as indicators of CM maturation, both crucial for oxygen transport and ATP generation, which are fundamental activities in muscle cells. Oxygen consumption rates vary substantially among different cell types,24,25,40 and several previous studies, including our own, have noted that iPSC-derived CMs exhibit greater oxygen consumption when they have undergone higher levels of maturation compared to their immature counterparts.19,41−43 Furthermore, the rate of oxygen consumption, which correlates with ATP synthesis in CMs, is linked to the fraction of cytochrome present.44,45 MB functions as both a reservoir and transporter of oxygen to support mitochondrial respiration.46,47 The expression profile of MB is positively associated with the maturation of cardiac lineage cells,48 including hiPSC-derived CMs matured by long-term culture.49 Mature cardiac tissue typically exhibits elevated cytochrome c activity29−31 and MB expression.19,48,50 Taken together, these findings suggest that Raman microscopy could serve as an ideal tool for assessing the maturation and purity of hiPSC-derived cardiac tissue (Figure 6).
Figure 6.
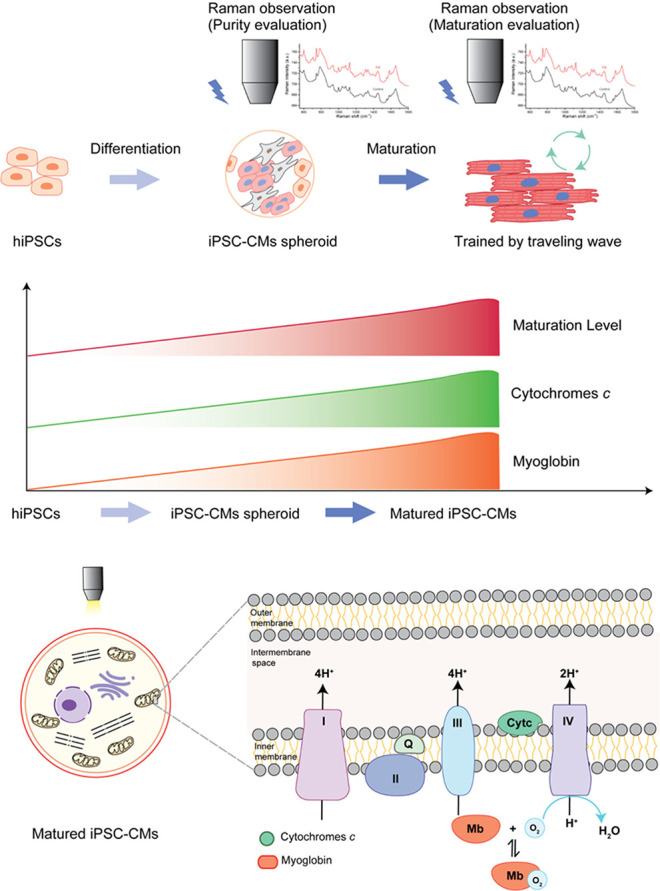
Cytochrome c and myoglobin content increase during the iPSC differentiation into CMs and their maturation.
Conclusions
In summary, label-free Raman microscopy has been employed to evaluate hiPSC-derived cardiac tissue. The obtained Raman spectroscopy data reveal a direct correlation between the Raman peaks associated with cytochrome c and myoglobin and the purity of hiPSC-derived CM spheroids. Furthermore, a comparison of hiPSC-CMs at different maturation stages shows that the cytochrome c and myoglobin peaks also positively correlate with CM maturation. These findings suggest that Raman microscopy holds potential as a novel tool for real-time assessment of both the purity and maturation status of hiPSC-derived cardiac tissue.
Acknowledgments
Funding was provided by the Japan Society for the Promotion of Science (JSPS; 22K12801, 22H03157). This research was also supported by the JST COI-NEXT under Grant JPMJPF2009.
Supporting Information Available
The Supporting Information is available free of charge at https://pubs.acs.org/doi/10.1021/acs.analchem.4c03871.
Methods, the preparation of iCell/fibroblast spheroids, preparation of hiPSCs and differentiation into CMs, flow cytometry, promoting maturation ofhiPSC-CM tissue by using traveling wave, immunostaining and imaging, live/dead assay, transmission electronmicroscopy (TEM), etc. (PDF)
Author Present Address
∇ Shenzhen Medical Academy of Research and Translation, Shenzhen 518107, China
Author Contributions
○ J.L. and M.L. contributed equally. J.L., M.L., Y.N., K.F., and L.L. conceived the concept; J.L., M.L., and Y.N. designed the experiments with the help of Y.S., K.F., and L.L.; J.L., M.L., Y.N., Y.L., K.B., Y.H., and L.S. performed the experiments; J.L., M.L., and Y.N. analyzed the data; Y.N. and S.F. provided tools for Raman measurement and analysis; Y.N. and M.L., carried out the optical alignment; J.L., M.L., K.F., and L.L. wrote the manuscript with input from all authors. All authors have read and agreed to submit the manuscript. All authors confirm their consent for publication.
The authors declare that they have not used artificial intelligence in this study.
The authors declare no competing financial interest.
Supplementary Material
References
- Miyagawa S.; Kainuma S.; Kawamura T.; Suzuki K.; Ito Y.; Iseoka H.; Ito E.; Takeda M.; Sasai M.; Mochizuki-Oda N.; et al. Case report: Transplantation of human induced pluripotent stem cell-derived cardiomyocyte patches for ischemic cardiomyopathy. Front. Cardiovasc. Med. 2022, 9, 950829. 10.3389/fcvm.2022.950829. [DOI] [PMC free article] [PubMed] [Google Scholar]
- Li J.; Liu L.; Zhang J.; Qu X.; Kawamura T.; Miyagawa S.; Sawa Y. Engineered Tissue for Cardiac Regeneration: Current Status and Future Perspectives. Bioengineering 2022, 9 (11), 605. 10.3390/bioengineering9110605. [DOI] [PMC free article] [PubMed] [Google Scholar]
- Kawamura T.; Ito Y.; Ito E.; Takeda M.; Mikami T.; Taguchi T.; Mochizuki-Oda N.; Sasai M.; Shimamoto T.; Nitta Y. Safety confirmation of induced pluripotent stem cell-derived cardiomyocyte patch transplantation for ischemic cardiomyopathy: first three case reports. Front. Cardiovasc. Med. 2023, 10, 1182209. 10.3389/fcvm.2023.1182209. [DOI] [PMC free article] [PubMed] [Google Scholar]
- Li J.; Minami I.; Shiozaki M.; Yu L.; Yajima S.; Miyagawa S.; Shiba Y.; Morone N.; Fukushima S.; Yoshioka M. Human pluripotent stem cell-derived cardiac tissue-like constructs for repairing the infarcted myocardium. Stem Cell Rep. 2017, 9 (5), 1546–1559. 10.1016/j.stemcr.2017.09.007. [DOI] [PMC free article] [PubMed] [Google Scholar]
- Blinova K.; Dang Q.; Millard D.; Smith G.; Pierson J.; Guo L.; Brock M.; Lu H. R.; Kraushaar U.; Zeng H.; Shi H.; Zhang X.; Sawada K.; Osada T.; Kanda Y.; Sekino Y.; Pang L.; Feaster T. K.; Kettenhofen R.; Stockbridge N.; Strauss D. G.; Gintant G. International Multisite Study of Human-Induced Pluripotent Stem Cell-Derived Cardiomyocytes for Drug Proarrhythmic Potential Assessment. Cell Rep. 2018, 24 (13), 3582–3592. 10.1016/j.celrep.2018.08.079. [DOI] [PMC free article] [PubMed] [Google Scholar]
- Goversen B.; van der Heyden M. A.; van Veen T. A.; de Boer T. P. The immature electrophysiological phenotype of iPSC-CMs still hampers in vitro drug screening: Special focus on IK1. Pharmacol. Ther. 2018, 183, 127–136. 10.1016/j.pharmthera.2017.10.001. [DOI] [PubMed] [Google Scholar]
- Ogawa M.; Harada Y.; Yamaoka Y.; Fujita K.; Yaku H.; Takamatsu T. Label-free biochemical imaging of heart tissue with high-speed spontaneous Raman microscopy. Biochem. Biophys. Res. Commun. 2009, 382 (2), 370–374. 10.1016/j.bbrc.2009.03.028. [DOI] [PubMed] [Google Scholar]
- Li M.; Ueyama-Toba Y.; Lindley M.; Kongklad G.; Nawa Y.; Kumamoto Y.; Ishida S.; Kanda Y.; Fujita S.; Mizuguchi H. Label-Free Evaluation of Maturation and Hepatotoxicity of Human iPSC-Derived Hepatocytes Using Hyperspectral Raman Imaging. Anal. Chem. 2023, 95, 9252–9262. 10.1021/acs.analchem.3c00976. [DOI] [PubMed] [Google Scholar]
- Li M.; Nawa Y.; Ishida S.; Kanda Y.; Fujita S.; Fujita K. Label-free chemical imaging of cytochrome P450 activity by Raman microscopy. Commun. Biol. 2022, 5 (1), 778. 10.1038/s42003-022-03713-1. [DOI] [PMC free article] [PubMed] [Google Scholar]
- Brauchle E.; Thude S.; Brucker S. Y.; Schenke-Layland K. Cell death stages in single apoptotic and necrotic cells monitored by Raman microspectroscopy. Sci. Rep. 2014, 4 (1), 4698. 10.1038/srep04698. [DOI] [PMC free article] [PubMed] [Google Scholar]
- Kar S.; Jaswandkar S. V.; Katti K. S.; Kang J. W.; So P. T.; Paulmurugan R.; Liepmann D.; Venkatesan R.; Katti D. R. Label-free discrimination of tumorigenesis stages using in vitro prostate cancer bone metastasis model by Raman imaging. Sci. Rep. 2022, 12 (1), 8050. 10.1038/s41598-022-11800-w. [DOI] [PMC free article] [PubMed] [Google Scholar]
- Hsu C.-C.; Xu J.; Brinkhof B.; Wang H.; Cui Z.; Huang W. E.; Ye H. A single-cell Raman-based platform to identify developmental stages of human pluripotent stem cell-derived neurons. Proc. Natl. Acad. Sci. U. S. A. 2020, 117 (31), 18412–18423. 10.1073/pnas.2001906117. [DOI] [PMC free article] [PubMed] [Google Scholar]
- Pascut F. C.; Goh H. T.; Welch N.; Buttery L. D.; Denning C.; Notingher I. Noninvasive Detection and Imaging of Molecular Markers in Live Cardiomyocytes Derived from Human Embryonic Stem Cells. Biophys. J. 2011, 100 (1), 251–259. 10.1016/j.bpj.2010.11.043. [DOI] [PMC free article] [PubMed] [Google Scholar]
- Pascut F. C.; Kalra S.; George V.; Welch N.; Denning C.; Notingher I. Non-invasive label-free monitoring the cardiac differentiation of human embryonic stem cells in-vitro by Raman spectroscopy. Biochimica Et Biophysica Acta (BBA)-General Subjects 2013, 1830 (6), 3517–3524. 10.1016/j.bbagen.2013.01.030. [DOI] [PubMed] [Google Scholar]
- Chan J. W.; Lieu D. K.; Huser T.; Li R. A. Label-free separation of human embryonic stem cells and their cardiac derivatives using Raman spectroscopy. Anal. Chem. 2009, 81 (4), 1324–1331. 10.1021/ac801665m. [DOI] [PMC free article] [PubMed] [Google Scholar]
- Brauchle E.; Knopf A.; Bauer H.; Shen N.; Linder S.; Monaghan M. G.; Ellwanger K.; Layland S. L.; Brucker S. Y.; Nsair A. Non-invasive chamber-specific identification of cardiomyocytes in differentiating pluripotent stem cells. Stem Cell Rep. 2016, 6 (2), 188–199. 10.1016/j.stemcr.2015.12.007. [DOI] [PMC free article] [PubMed] [Google Scholar]
- Li J.; Hua Y.; Miyagawa S.; Zhang J.; Li L.; Liu L.; Sawa Y. hiPSC-Derived Cardiac Tissue for Disease Modeling and Drug Discovery. Int. J. Mol. Sci. 2020, 21 (23), 8893. 10.3390/ijms21238893. [DOI] [PMC free article] [PubMed] [Google Scholar]
- Shen N.; Knopf A.; Westendorf C.; Kraushaar U.; Riedl J.; Bauer H.; Pöschel S.; Layland S. L.; Holeiter M.; Knolle S.; Brauchle E.; Nsair A.; Hinderer S.; Schenke-Layland K. Steps toward Maturation of Embryonic Stem Cell-Derived Cardiomyocytes by Defined Physical Signals. Stem Cell Rep. 2017, 9 (1), 122–135. 10.1016/j.stemcr.2017.04.021. [DOI] [PMC free article] [PubMed] [Google Scholar]
- Li J.; Zhang L.; Yu L.; Minami I.; Miyagawa S.; Hörning M.; Dong J.; Qiao J.; Qu X.; Hua Y. Circulating re-entrant waves promote maturation of hiPSC-derived cardiomyocytes in self-organized tissue ring. Commun. Biol. 2020, 3 (1), 122. 10.1038/s42003-020-0853-0. [DOI] [PMC free article] [PubMed] [Google Scholar]
- Zhang L.; Li J.; Liu L.; Tang C. Analysis of circulating Waves in tissue Rings derived from Human induced pluripotent Stem cells. Sci. Rep. 2020, 10 (1), 2984. 10.1038/s41598-020-59803-9. [DOI] [PMC free article] [PubMed] [Google Scholar]
- Li J.; Hua Y.; Liu Y.; Qu X.; Zhang J.; Ishida M.; Yoshida N.; Tabata A.; Miyoshi H.; Shiba M.; Higo S.; Sougawa N.; Takeda M.; Kawamura T.; Matsuura R.; Okuzaki D.; Toyofuku T.; Sawa Y.; Liu L.; Miyagawa S. Human induced pluripotent stem cell-derived closed-loop cardiac tissue for drug assessment. iScience 2024, 27 (2), 108992. 10.1016/j.isci.2024.108992. [DOI] [PMC free article] [PubMed] [Google Scholar]
- Camelliti P.; Borg T. K.; Kohl P. Structural and functional characterisation of cardiac fibroblasts. Cardiovasc. Res. 2005, 65 (1), 40–51. 10.1016/j.cardiores.2004.08.020. [DOI] [PubMed] [Google Scholar]
- Miyagawa S.; Kawamura T.; Ito E.; Takeda M.; Iseoka H.; Yokoyama J.; Harada A.; Mochizuki-Oda N.; Imanishi-Ochi Y.; Li J.; et al. Evaluation of the Efficacy and Safety of a Clinical Grade Human Induced Pluripotent Stem Cell-Derived Cardiomyocyte Patch: A Pre-Clinical Study. bioRxiv 2021, 10.1101/2021.04.07.438744. [DOI] [PMC free article] [PubMed] [Google Scholar]
- Sekine K.; Kagawa Y.; Maeyama E.; Ota H.; Haraguchi Y.; Matsuura K.; Shimizu T. Oxygen consumption of human heart cells in monolayer culture. Biochem. Biophys. Res. Commun. 2014, 452 (3), 834–839. 10.1016/j.bbrc.2014.09.018. [DOI] [PubMed] [Google Scholar]
- Wagner B. A.; Venkataraman S.; Buettner G. R. The rate of oxygen utilization by cells. Free Radical Biol. Med. 2011, 51 (3), 700–712. 10.1016/j.freeradbiomed.2011.05.024. [DOI] [PMC free article] [PubMed] [Google Scholar]
- Almohammedi A.; Kapetanaki S.; Wood B. R.; Raven E. L.; Storey N.; Hudson A. J. Spectroscopic analysis of myoglobin and cytochrome c dynamics in isolated cardiomyocytes during hypoxia and reoxygenation. J. R. Soc., Interface 2015, 12 (105), 20141339. 10.1098/rsif.2014.1339. [DOI] [PMC free article] [PubMed] [Google Scholar]
- Liao H.-X.; Bando K.; Li M.; Fujita K. Multifocal Raman Spectrophotometer for Examining Drug-Induced and Chemical-Induced Cellular Changes in 3D Cell Spheroids. Anal. Chem. 2023, 95 (39), 14616–14623. 10.1021/acs.analchem.3c02129. [DOI] [PubMed] [Google Scholar]
- Mochizuki K.; Kumamoto Y.; Maeda S.; Tanuma M.; Kasai A.; Takemura M.; Harada Y.; Hashimoto H.; Tanaka H.; Smith N. I. High-throughput line-illumination Raman microscopy with multislit detection. Biomed. Opt. Express 2023, 14 (3), 1015–1026. 10.1364/BOE.480611. [DOI] [PMC free article] [PubMed] [Google Scholar]
- Shadrin I. Y.; Allen B. W.; Qian Y.; Jackman C. P.; Carlson A. L.; Juhas M. E.; Bursac N. Cardiopatch platform enables maturation and scale-up of human pluripotent stem cell-derived engineered heart tissues. Nat. Commun. 2017, 8 (1), 1825. 10.1038/s41467-017-01946-x. [DOI] [PMC free article] [PubMed] [Google Scholar]
- Guo Y.; Pu W. T. Cardiomyocyte Maturation. Circ. Res. 2020, 126 (8), 1086–1106. 10.1161/CIRCRESAHA.119.315862. [DOI] [PMC free article] [PubMed] [Google Scholar]
- Chirico N.; Kessler E. L.; Maas R. G.; Fang J.; Qin J.; Dokter I.; Daniels M.; Šarić T.; Neef K.; Buikema J.-W. Small molecule-mediated rapid maturation of human induced pluripotent stem cell-derived cardiomyocytes. Stem Cell Res. Ther. 2022, 13 (1), 531. 10.1186/s13287-022-03209-z. [DOI] [PMC free article] [PubMed] [Google Scholar]
- Driedzic W. R.; Stewart J. M.; Scott D. L. The protective effect of myoglobin during hypoxic perfusion of isolated fish hearts. J. Mol. Cell. Cardiol. 1982, 14 (11), 673–677. 10.1016/0022-2828(82)90164-X. [DOI] [PubMed] [Google Scholar]
- Jaspers R. T.; Testerink J.; Della Gaspera B.; Chanoine C.; Bagowski C. P.; van der Laarse W. J. Increased oxidative metabolism and myoglobin expression in zebrafish muscle during chronic hypoxia. Biology Open 2014, 3 (8), 718–727. 10.1242/bio.20149167. [DOI] [PMC free article] [PubMed] [Google Scholar]
- De Miranda M. A. Jr; Schlater A. E.; Green T. L.; Kanatous S. B. In the face of hypoxia: myoglobin increases in response to hypoxic conditions and lipid supplementation in cultured Weddell seal skeletal muscle cells. J. Exp. Biol. 2012, 215 (5), 806–813. 10.1242/jeb.060681. [DOI] [PubMed] [Google Scholar]
- Hendgen-Cotta U. B.; Kelm M.; Rassaf T. Myoglobin functions in the heart. Free Radical Biol. Med. 2014, 73, 252–259. 10.1016/j.freeradbiomed.2014.05.005. [DOI] [PubMed] [Google Scholar]
- Khanna A.; Oropeza B. P.; Huang N. F. Cardiovascular human organ-on-a-chip platform for disease modeling, drug development, and personalized therapy. J. Biomed Mater. Res. A 2024, 112, 512–523. 10.1002/jbm.a.37602. [DOI] [PMC free article] [PubMed] [Google Scholar]
- Brazhe N. A.; Treiman M.; Brazhe A. R.; Find N. L.; Maksimov G. V.; Sosnovtseva O. V. Mapping of Redox State of Mitochondrial Cytochromes in Live Cardiomyocytes Using Raman Microspectroscopy. PLoS One 2012, 7 (9), e41990 10.1371/journal.pone.0041990. [DOI] [PMC free article] [PubMed] [Google Scholar]
- El-Said W. A.; Fouad D. M.; El-Safty S. A. Ultrasensitive label-free detection of cardiac biomarker myoglobin based on surface-enhanced Raman spectroscopy. Sens. Actuators, B 2016, 228, 401–409. 10.1016/j.snb.2016.01.041. [DOI] [Google Scholar]
- Ohira S.; Tanaka H.; Harada Y.; Minamikawa T.; Kumamoto Y.; Matoba S.; Yaku H.; Takamatsu T. Label-free detection of myocardial ischaemia in the perfused rat heart by spontaneous Raman spectroscopy. Sci. Rep. 2017, 7 (1), 42401. 10.1038/srep42401. [DOI] [PMC free article] [PubMed] [Google Scholar]
- Zhao J.; Gao J.-L.; Zhu J.-X.; Zhu H.-B.; Peng X.; Jiang M.; Fu Y.; Xu J.; Mao X.-H.; Hu N. The different response of cardiomyocytes and cardiac fibroblasts to mitochondria inhibition and the underlying role of STAT3. Basic Res. Cardiol. 2019, 114, 12. 10.1007/s00395-019-0721-6. [DOI] [PubMed] [Google Scholar]
- Ronaldson-Bouchard K.; Ma S. P.; Yeager K.; Chen T.; Song L.; Sirabella D.; Morikawa K.; Teles D.; Yazawa M.; Vunjak-Novakovic G. Advanced maturation of human cardiac tissue grown from pluripotent stem cells. Nature 2018, 556 (7700), 239. 10.1038/s41586-018-0016-3. [DOI] [PMC free article] [PubMed] [Google Scholar]
- Yoshida S.; Miyagawa S.; Fukushima S.; Kawamura T.; Kashiyama N.; Ohashi F.; Toyofuku T.; Toda K.; Sawa Y. Maturation of human induced pluripotent stem cell-derived cardiomyocytes by soluble factors from human mesenchymal stem cells. Mol. Ther. 2018, 26 (11), 2681–2695. 10.1016/j.ymthe.2018.08.012. [DOI] [PMC free article] [PubMed] [Google Scholar]
- Nunes S. S.; Miklas J. W.; Liu J.; Aschar-Sobbi R.; Xiao Y.; Zhang B.; Jiang J.; Massé S.; Gagliardi M.; Hsieh A.; Thavandiran N.; Laflamme M. A.; Nanthakumar K.; Gross G. J.; Thavandiran N.; Laflamme M. A.; Nanthakumar K.; Gross G. J. Biowire: a platform for maturation of human pluripotent stem cell–derived cardiomyocytes. Nat. Methods 2013, 10 (8), 781–787. 10.1038/nmeth.2524. [DOI] [PMC free article] [PubMed] [Google Scholar]
- Wilson D. F.; Harrison D. K.; Vinogradov A. Mitochondrial cytochrome c oxidase and control of energy metabolism: measurements in suspensions of isolated mitochondria. J. Appl. Physiol. 2014, 117 (12), 1424–1430. 10.1152/japplphysiol.00736.2014. [DOI] [PubMed] [Google Scholar]
- Ow Y.-L. P.; Green D. R.; Hao Z.; Mak T. W. Cytochrome c: functions beyond respiration. Nat. Rev. Mol. Cell Biol. 2008, 9 (7), 532–542. 10.1038/nrm2434. [DOI] [PubMed] [Google Scholar]
- Wittenberg B. A.; Wittenberg J. B. Myoglobin-mediated oxygen delivery to mitochondria of isolated cardiac myocytes. Proc. Natl. Acad. Sci. U. S. A. 1987, 84 (21), 7503–7507. 10.1073/pnas.84.21.7503. [DOI] [PMC free article] [PubMed] [Google Scholar]
- Wittenberg B.; Wittenberg J.; Caldwell P. Role of myoglobin in the oxygen supply to red skeletal muscle. J. Biol. Chem. 1975, 250 (23), 9038–9043. 10.1016/S0021-9258(19)40690-X. [DOI] [PubMed] [Google Scholar]
- Hsieh M.-Y. A.High Gradient Labelling-Free Isolation of Cardiomyocytes from Heterogeneous Populations. Ph.D. Thesis, University of Toronto, Toronto, ON, Canada, 2016. [Google Scholar]
- Cai W.; Zhang J.; Lange W. J. D.; Gregorich Z. R.; Karp H.; Farrell E. T.; Mitchell S. D.; Tucholski T.; Lin Z.; Biermann M.; McIlwain S. J.; Ralphe J. C.; Kamp T. J.; Ge Y. An Unbiased Proteomics Method to Assess the Maturation of Human Pluripotent Stem Cell–Derived Cardiomyocytes. Circ. Res. 2019, 125 (11), 936–953. 10.1161/CIRCRESAHA.119.315305. [DOI] [PMC free article] [PubMed] [Google Scholar]
- Kanatous S. B.; Mammen P. P. Regulation of myoglobin expression. J. Exp. Biol. 2010, 213 (16), 2741–2747. 10.1242/jeb.041442. [DOI] [PMC free article] [PubMed] [Google Scholar]
Associated Data
This section collects any data citations, data availability statements, or supplementary materials included in this article.


