

Abstract

Carglumic acid, also known as N-carbamyl-l-glutamic acid, is a medication used in the treatment of a rare genetic disorder called N-acetylglutamate synthase (NAGS) deficiency. To the authors’ knowledge, there was no method reported in the literature for the determination of degradation products suitable for quality control analyses of carglumic acid. Thus, the aim of the presented study is to develop an impurity method with a UHPLC/DAD detector configuration compatible with industrial standards from the European Pharmacopeia and the United States Pharmacopeia, making the drug more accessible for developing and underdeveloped countries through its precise evaluation. The method involved the separation of carglumic acid and its degradation products using a reverse-phase C18 column (Waters, BEH 150 mm × 2.1 mm, 1.7 μm) at a flow rate of 0.39 mL/min with a stop time of 10 min. To separate all unknown and known impurities, a gradient elution (phosphate buffer, pH 2.4, and acetonitrile) system was used. The detection was performed at 214 nm. Forced degradation studies were conducted under different stress conditions, including acidic, basic, oxidative, thermal, and photolytic stress. Placket–Burman statistical experimental design was used to demonstrate the robustness of this method, and the suitability of the method was confirmed under the applied conditions. Box–Behnken design was used to provide the optimum resolution between the peaks determined to be critical during the optimization. The developed method was validated according to ICH guidelines for specificity, linearity, accuracy, precision, and robustness. The limit of detection and limit of quantification were 0.7 and 0.15 μg/mL for carglumic acid, respectively.
1. Introduction
In the framework of the pharmaceutical and chemical fields, the development of robust and efficient analytical techniques holds significant importance in ensuring the quality, safety, and effectiveness of products. Carglumic acid, a synthetic structural analogue of N-acetylglutamate,1 has gained considerable attention due to its pivotal role in the treatment of inherited disorders of the urea cycle.2−11 As the demand for precise and accurate analysis of carglumic acid increases, the implementation of a systematic and efficient analytical method becomes imperative. In this context, the separation of critical peaks and overall chromatographic performance are evaluated using the design of experiment (DoE) approach.12−23 This allows for a better understanding of the impact of the chromatographic parameters on the method and the development of a statistical solution.
There is no compendial method for carglumic acid currently, there is only a method proposed in the United States Pharmacopeia (USP), Compendium, but this method was rejected in 2015.24 Apart from this, there is a determination method using HPLC/Tandem MS, but the purpose of this method is to determine carglumic acid in animal products and this method does not contain information about impurities.25 That is why developing this type of method has become more critical. While developing the method here, the methods in the current ICH (International Council for Harmonisation of Technical Requirements for Pharmaceuticals for Human Use) guidelines, Analytical Procedure Development Q14,26−28 and Quality Risk Management Q9 (R1)29 guidelines were taken into consideration and the method was validated according to the ICH Q2 (R1) guideline.30
DoE represents a paradigm shift from the traditional “empirical” approach to analytical method development,31 allowing for the creation of methods tailored to the specific attributes of the analyte. This approach employs a holistic understanding of critical method parameters (CMPs) and their impact on the critical quality attributes (CQAs) of the analyte.32 By utilizing scientific principles, risk assessment, and statistical tools, DoE facilitates the optimization of methods, enhances method robustness, and streamlines the method validation process.33
Carglumic acid’s unique physicochemical properties and therapeutic significance34 necessitate an analytical method that is sensitive, accurate, precise, and selective. Traditional trial-and-error approaches often consume time and resources, leading to suboptimal methods that might not fully address the nuances of carglumic acid analysis. The DoE approach offers a systematic methodology to identify, understand, and control the sources of variability that may impact method performance.35
This paper aims to explore the application of the DoE approach in the development of an analytical method for carglumic acid and its degradation products.36 The list of known impurities in carglumic acid is given in Figure 1. By focusing on critical method parameters such as the pH of the mobile phase, column temperature, and flow rate, we aim to design a method that consistently meets predefined analytical quality attributes. The integration of design of experiments (DoE), risk assessment, and multivariate analysis enables a comprehensive exploration of the method space, leading to a robust and well-optimized analytical method.37 For this purpose, the Box–Behnken design via Design Expert 13 was used during the method development process.38 Here, among the known impurities, the resolution between HPA and pyroglutamic acid, the total analysis time, and the tailing of carglumic acid were selected as critical parameters. For this purpose, an experimental design was created. At the end of the method development studies, a Plackett–Burman experimental design (Minitab 19) was used to demonstrate and prove the robustness of the method, and it was shown that the method was not affected by the minor changes made.39,40
Figure 1.

Chemical structures of carglumic acid, related compound a (HPA), pyroglutamic acid, pyrocarglumic acid, and dicarbamoyl l-glutamic acid.
One of the aims of this study was to obtain the minimum possible analysis time with high separation performance, thus developing a method that increases laboratory efficiency such as device usage time and the amount of chemicals wasted. Therefore, the UHPLC/DAD device was preferred, and the appropriate C18 column was used. The DAD detector was used to identify the most suitable wavelength for this analysis.41
The application of the design of experiments (DoE) in the development of an analytical method for carglumic acid has the potential to transform the design, optimization, and control of methods. This approach ensures that the analytical method does not only fit for purpose but is also capable of providing reliable and accurate results for carglumic acid analysis, thereby contributing to the overall quality and safety of therapeutic interventions for patients with urea cycle disorders.42,43−21
2. Materials and Methods
Carglumic acid (N-Carbamyl-l-Glutamic acid) was obtained from Nuray Chemicals (Assay with 99.6% w/w as-is basis). HPLC grade Acetonitrile (LiChrosolv, Darmstadt, Germany), ortho-Phosphoric acid 85% (LiChropur, Darmstadt, Germany), and potassium dihydrogen phosphate (LiChropur, Darmstadt, Germany) were purchased from Supelco (Merck). Milli-Q water from the Millipore purification system was used as diluent and mobile phases. Known impurities as L-Hydantoin-5-propionic acid (related compound A/HPA), pyrocarglumic acid, pyroglutamic acid, and dicarbamoyl l-glutamic acid were also obtained from Nuray Chemicals (Tamilnadu, India) as primary standards. The molecular structures of these chemicals are shown in Figure 1.
2.1. Instrumentation
In this study, Agilent 1290 Infinity II, UHPLC system with 1290 Flexible Pump (G7104A), 1290 Multisampler (G7167B), 1290 MCT column oven (G7116B), and 1290 DAD FS detector (G7117A) were used along with Mettler Toledo analytical balances (XPR205) and pH meters (SevenExcellence S475-K). The column was Waters BEH C18 (186002353, 150 × 2.1 mm, 1.5 μm).
2.2. Preparation of Mobile Phase
Ten mM potassium dihydrogen phosphate solution was prepared, and pH of this solution was adjusted to 2.40 ± 0.01 with phosphoric acid. This solution was also used as a diluent and filtered through a 0.45 μm PVDF filter.
2.3. Preparation of Standard Solution
40.0 mg of carglumic acid reference standard is weighed into a 5 mL volumetric flask and diluted to 5.0 mL with the diluent. The solution is stirred with a magnetic stirrer for 30 min until completely dissolved (8000 μg/mL carglumic acid). The standard solution is stable for 12 h at 5 °C.
2.4. Preparation of Impurity Standard Solution
1.6 mg of each pyroglutamic acid reference standard, impurity A reference standard, pyrocarglumic acid reference standard, and dicarbamoyl l-glutamic acid reference standard were weighed into a 20 mL volumetric flask, diluted to 20.0 mL with diluent. The solution was stirred with a magnetic stirrer for 30 min (80 μg/mL pyroglutamic acid, 80 μg/mL Impurity A, 80 μg/mL pyrocarglumic acid, and 80 μg/mL dicarbamoyl l-glutamic acid). The impurity standard solution is stable for 5 days at 5 °C.
2.5. Preparation of Test Solution
Ten tablets are weighed, the weighing is recorded, and the tablets are ground. 100.0 mg of tablet powder (containing 40 mg of carglumic acid) from the mixture of powder is weighed into a 5 mL volumetric flask and diluted to 5.0 mL with the diluent. The solution is stirred with a magnetic stirrer for 5 min (8000 μg/mL carglumic acid). The test solution is prepared fresh.
2.6. Method Development Studies
Upon initiation of the method development research, the spectrum of the standards was assessed by using a diode array detector (DAD). Subsequently, tests were conducted, varying the pH and organic solvent ratios in accordance with the pKa (2.50, 3.55, 8.60)44 values. Although the chromatogram in Figure 3 exhibits partial resolution, it is important to assess pyroglutamic acid and its related component A (HPA) as crucial peaks in terms of resolution. Furthermore, the determination of the retention period of the final peak and the assessment of the tailing factor values of the principal peak were pivotal aspects in the process of method development. The Box–Behnken design (BBD) was employed to analyze the data, with the response variable being utilized to determine the optimal condition. A total of 17 trials were conducted to obtain this study. Figure 4 depicts the graphical representations of the analysis results (Table 1) derived from the implementation of factorial design. The significance of the values obtained during the analysis of this experimental design is presented in Table 1. The parameters derived from the BBD analysis were utilized under validation conditions to assess their appropriateness. To enhance the reliability and resilience of this approach, a Plackett–Burman design was employed as a supplementary experimental design. A method was devised and verified utilizing chemometric approaches with the aid of two distinct experimental designs.
Figure 3.
Separation of carglumic acid and known impurities at early stages of method development.
Figure 4.

Box–Behnken design response surface graphs for resolution (A), retention time (B), and tailing factor (C).
Table 1. Box–Behnken Runs and Responses for Critical Method Parameters.
| Run | Factor 1 A: pH | Factor 2 B: Column Temperature °C | Factor 3 C: Flow Rate(mL/min) | Response 1 Resolution | Response 2 Retention time (min) | Response 3 Tailing factor |
|---|---|---|---|---|---|---|
| 1 | 2.2 | 20 | 0.40 | 2.99 | 6.91 | 1.26 |
| 2 | 2.0 | 30 | 0.35 | 1.47 | 6.31 | 1.18 |
| 3 | 2.0 | 25 | 0.40 | 1.91 | 6.09 | 1.20 |
| 4 | 2.2 | 25 | 0.35 | 2.59 | 6.99 | 1.29 |
| 5 | 2.0 | 25 | 0.30 | 2.47 | 8.55 | 1.29 |
| 6 | 2.2 | 20 | 0.30 | 3.86 | 7.60 | 1.21 |
| 7 | 2.2 | 25 | 0.35 | 2.76 | 7.22 | 1.29 |
| 8 | 2.2 | 30 | 0.40 | 1.87 | 5.55 | 1.19 |
| 9 | 2.4 | 25 | 0.30 | 3.99 | 7.61 | 1.27 |
| 10 | 2.0 | 20 | 0.35 | 3.13 | 6.77 | 1.25 |
| 11 | 2.4 | 20 | 0.35 | 4.57 | 7.26 | 1.19 |
| 12 | 2.4 | 30 | 0.35 | 2.86 | 5.67 | 1.30 |
| 13 | 2.2 | 30 | 0.30 | 2.17 | 7.46 | 1.23 |
| 14 | 2.2 | 25 | 0.35 | 2.65 | 7.11 | 1.20 |
| 15 | 2.2 | 25 | 0.35 | 2.62 | 7.10 | 1.26 |
| 16 | 2.2 | 25 | 0.35 | 2.64 | 7.14 | 1.19 |
| 17 | 2.4 | 25 | 0.40 | 3.17 | 5.42 | 1.27 |
2.7. Chromatographic Conditions
After method optimizations, the flow rate was 0.39 mL/min, the column temperature was 22 °C, and the pH of the mobile phase was 2.4. The device was controlled by the OpenLab program. A gradient program was used as the flow type. Details of this program are given in Table 2. For the sample and test solutions to remain stable, the auto sampler temperature was set at 5 °C and the injection volume was determined as 2 μL. The most suitable wavelength range for carglumic acid was determined as 210–220 nm. All mobile phase and diluents were prepared by filtration through a PVDF membrane filter (Millex) due to compatibility with an aqueous solution of this filter. Standard and sample solutions were filtered through a 0.22 μm hydrophilic PTFE filter (Millex) as a result of filter selection study. Chromatographic conditions are also listed in Table 2.
Table 2. Final Method Parameters.
| Parameters | ||
|---|---|---|
| Column | Waters BEH C18 (130 Å, 150 × 2.1 mm, 1.7 μ) | |
| Wavelength (nm) | 214 nm | |
| Mobile Phase | 10 mM phosphate buffer pH 2.4: Acetonitrile | |
| Flow Rate (mL/min) | 0.39 mL/min | |
| Injection Volume (μL) | 2 μL | |
| Column Temperature (°C) | 22 °C | |
| Run Time (min) | 10 min | |
| Post Time (min) | 3 min | |
| Gradient Program | Time (min) | Acetonitrile (%) |
| 0 | 0 | |
| 7 | 0 | |
| 10 | 20 | |
2.8. Validation Parameters
The process of method validation, as defined by the ICH, is a crucial step in ensuring the reliability and accuracy of analytical methods used in the pharmaceutical industry. The method was developed in accordance with the ICH Q2 (R1) guidelines and (EP). The validation process encompassed various parameters, including stress conditions, specificity, system suitability, precision, linearity and range, robustness, limit of quantification (LOQ), and limit of detection (LOD). This comprehensive validation ensured that the analytical process was appropriate for its proposed application. Additionally, stability investigations were conducted under various storage settings.29,45
2.8.1. System Suitability
The administration of this test is an essential element in the process of method development, as it guarantees the capability of the LC equipment and the established technique to deliver reliable outcomes. The system suitability test was conducted by six consecutive injections of the same standard solution. The estimated results were obtained by measuring the capacity factor (k’), retention time (tR), theoretical plates, peak area, and tailing factor of carglumic acid at a wavelength of 214 nm. The percentage relative standard deviation (RSD) was calculated for various factors, including peak area, tR, theoretical plates, and tailing factor. According to the recommendations set forth by EP/European Directorate for the Quality of Medicines and HealthCare (EDQM), it is required that the relative standard deviation (RSD) for peak area in this test must be below 0.85% for a total of six consecutive injections. The tailing factor should ideally fall within the range of 0.8–2, while the number of theoretical plates in the column should be above 2000.
2.8.2. Specificity
This parameter is a crucial element in UHPLC and signifies the capability of the analytical system to separate the analyte from the complex mixture, hence ensuring the absence of any further interferences from the solvent in the chromatograms of carglumic acid and its impurities at the specified wavelength. The chromatograms of the blank solution (comprising the mobile phase and solvent), placebo, and their mixture were studied systematically at quality control (QC) levels to assess the specificity.
2.8.3. Forced Degradation Studies
In all forced degradation experiments, it was aimed to obtain degradation between 5 and 20%. The following conditions were determined.23
2.8.3.1. Acid Hydrolysis
A 100.0 mg sample was introduced into a 5 mL volumetric flask, followed by the addition of 1 mL of a 0.1 N hydrochloric acid (HCl) solution. The solution was placed in a water bath maintained at a temperature of 25 °C for a period of 2 h. At the completion of the experimental duration, the solution turned neutral with the addition of 1 mL of a 0.1 N sodium hydroxide (NaOH) solution, followed by dilution to a final volume of 5.0 mL by using a diluent.
2.8.3.2. Alkali Hydrolysis
A sample weighing 100.0 mg was introduced into a volumetric flask with a volume of 5 mL. Afterward, 1 mL of a 0.1N NaOH solution was added to the flask. The solution was placed in a water bath at a temperature of 25 °C for a duration of 2 h. At the end of the experimental period, the solution turned neutral with the introduction of 1 mL of a 0.1 N hydrochloric acid (HCl) solution. Following that, the resulting mixture was further diluted to a final volume of 5.0 mL by using a suitable diluent.
2.8.3.3. Oxidative Degradation
In a 5 mL volumetric flask, 100.0 mg of sample and 1 mL of a 3% peroxide solution were both added. The solution was kept in a water bath maintained at a temperature of 25 °C for a duration of 24 h. Following the end of the experimental period, the solution was diluted, resulting in a final volume of 5.0 mL, achieved by incorporating a diluent.
2.8.3.4. Thermal Degradation
A sample weighing 100.0 mg was introduced into a volumetric flask with a capacity of 5 mL. The flask was then placed in an oven set at a temperature of 90 °C and left undisturbed for 21 days. After the designated period, the sample was permitted to reach room temperature and subsequently diluted to a volume of 5.0 mL using a suitable diluent.
2.8.3.5. Photolytic (UV/Vis) Degradation
Photostability study of the carglumic acid dispersible tablet drug product is determined by evaluating an acceptable change occurs at the end of the light exposure test, as described in the Decision Flowchart for Photostability Testing of Pharmaceutical Products in the ICH Q1B guideline.45
2.8.4. Linearity and Range
Various concentrations of five calibration solutions were prepared with the aim to assess linearity, with a range covering from 4 to 9600 μg/mL. A calibration curve was constructed for the carglumic acid plotting concentration on the x-axis and peak area on the y-axis. The regression equation was generated from this data. The response ratio (also known as the response factor) was determined by dividing the peak area by the concentration.
2.8.5. Response Factor
For the relative response factor parameter, in the range between 0.05% and 1% of study concentration, five different concentrations of solutions were prepared. The solutions were prepared one for each and transferred into the vials by filtering through a 0.4 μm hydrophilic PTFE filter. The solutions were injected once.
2.8.6. Accuracy
For this study, three samples were prepared for the reporting threshold, specification value, and 130% concentration. The purpose here is to examine the compatibility of the expected and experimental results with each other. While doing this, the criteria for each result to be less than 2% as RSD in the range of 95–105% were determined.
2.8.7. Precision
Precision evaluates the repeatability and reproducibility of the analytical method. To do this, different factors were changed, and it was examined that their changes did not affect the method and these parameters.
• Interday,
• Different analytical column (different lot number from same brand),
• Different instruments.
2.8.8. Limit of Quantification (LOQ) and Limit of Detection (LOD)
The sensitivity of the approach was assessed by determining the limit of quantification (LOQ) and limit of detection (LOD), which are crucial factors in the identification of impurities. The limit of quantification (LOQ) was determined as the minimum concentration at which precise quantification could be reliably performed, whereas the limit of detection (LOD) denoted the minimum detectable quantity of impurities. The method’s capacity to consistently quantify contaminants at low concentrations strengthens its suitability in pharmaceutical quality control, guaranteeing precise measurement of even minute quantities of impurities. After calculating the LOQ, the important point is that the LOQ must be at a concentration lower than or equal to the reporting threshold. LOQ value should have an s/N value higher than or equal to 10, and the LOD value should be between 2 and 3.
2.8.9. Solution Stability
To evaluate the practical applicability of the suggested methodology, a comprehensive investigation was conducted to assess the stability of the carglumic acid solutions. The maintenance of solution stability is of utmost importance to preserve the integrity of the impurity profile, thereby accurately reflecting the circumstances observed in real-world scenarios. The findings of the study demonstrated that the solutions containing carglumic acid exhibited stability over the designated storage duration, thereby affirming the reliability and appropriateness of the analytical method for regular analysis.
2.8.10. Filter Selection
The choice of a suitable filter is pivotal in impurity analysis, influencing both the accuracy and precision. Extensive research and testing were conducted to identify the optimal filter for sample preparation, ensuring the effective removal of interference while retaining the target impurities. The selected filter as Hydrophilic PTFE demonstrated superior performance in terms of impurity retention and minimal sample loss, contributing to the overall efficiency and reliability of the method. To determine this, the samples prepared with different filters were analyzed with the HPLC system as six consecutive injection and were compared to the nonfiltered sample (obtained by centrifugation).
2.8.11. Robustness (with Plackett–Burman)
A systematic strategy, known as a robustness study, utilizing the Plackett–Burman design, is employed to assess the impact of several factors on the performance of an analytical method, specifically the method used for analyzing impurities in carglumic acid. The main aim of this study is to determine key elements that could potentially impact the robustness of the approach and evaluate the method’s sensitivity to modifications in these aspects.
3. Results and Discussion
3.1. Early-Stage Method Development Studies
During the initial stages of method development, studies were conducted to determine the most suitable UV wavelength for various impurities and carglumic acid. To minimize sample usage, the UHPLC-DAD system was utilized, and the wavelength of each impurity was examined. The individual wavelengths for each impurity can be found in Figure 2. When the wavelength was selected, it was necessary to consider the baseline noise, as most of these molecules produce signals below 230 nm. Therefore, a wavelength of 214 nm was chosen as the optimum choice. Although the signal strength increases at lower wavelengths, the baseline noise from the HPLC system also increases. Due to the varying responses exhibited by the molecules, it was deemed necessary to investigate the relative response factor. Initially, a Waters, Acquity Premier BEH 50 mm × 2.1 mm, 1.7 μm column was attempted for column selection. However, it was seen that this column was unable to separate all of the peaks. Consequently, a column with the same diameter and particle size characteristics, specifically a 150 mm × 2.1 mm, 1.7 μm column, ended up being used alternatively.
Figure 2.

UV spectrum of carglumic acid, related compound a (HPA), pyroglutamic acid, pyrocarglumic acid, and dicarbamoyl l-glutamic acid.
At the onset of the method studies, UHPLC was initially favored due to its ability to reduce analysis time, expedite method development studies, and create a robust and valuable method for quality control analyses. The parameters that impact the separation between impurities and carglumic acid were identified as column temperature, flow rate, and pH. Considering the pKa (2.50, 3.55, and 8.60)46 and the value of carglumic acid, studies were conducted within the pH range of 2.5–3.5, resulting in the chromatogram depicted in Figure 3. Isocratic elution (mobile phase with phosphate buffer at pH 2.8) was used on this part of the studies. Despite the limited study time, the resolution, particularly between pyroglutamic and HPA molecules, was weak. The important method parameter for determining the separation between these two molecules was the separation of other peaks, which was achieved under all of the examined conditions. The preliminary method experiments conducted here allowed for the determination of the key method parameters, specifically the resolution between HPA and pyroglutamic acid, the retention time of the last peak in the chromatogram (which also impacts the total analysis time), and the tailing factor (1.21) of carglumic acid. It was determined that employing an experimental design would yield substantial cost and time savings compared with the trial-and-error approach.
3.2. Method Development Studies with DoE
The essential parameters for the Box–Behnken Design were selected as a pH range of 2.0–2.4, a flow rate range of 0.30–0.40 mL/min (considering the pressure in LC), and a column temperature range of 20–30 °C. The separation between these two degradation products increases as pH decreases but decreases as pH 2 approaches. Therefore, a narrow working range of pH 2.0–2.4 was chosen. The analysis protocol and the corresponding results obtained under these specified conditions are provided in Table 1. The analysis obtained the response surfaces and eqs 1–3 illustrated in Figure 4. The importance table used to determine the optimal experimental conditions is presented in Table 3. The objective was to achieve maximum resolution and minimum analysis time and generate a tailing factor as close to 1 as possible. Upon analyzing the results, it was found that the impact of the parameters on the analysis time was reduced in an inverse relationship with the column temperature and flow rate, aligning with theoretical expectations. The software (Design Expert 13) optimizes the resolution and tailing factor by solving these equations. The time-consuming process of achieving the optimal conditions through empirical methods has been resolved by this design of experiment approach.
Table 3. Numerical Optimization Criteria for Box–Behnken Design.
| Independent Variable | Range | Constraint | Importance |
|---|---|---|---|
| pH of mobile Phase | 2.0–2.4 | In range | +++ |
| Flow rate(mL/min) | 0.30–0.40 | In range | +++ |
| Column temperature (°C) | 20–30 | In range | +++ |
| Dependent variable | Constraint | Importance | |
| Resolution | Maximum | +++++ | |
| Retention time | Minimum | +++ | |
| Tailing factor | Target = 1 | +++ |
 |
1 |
| 2 |
| 3 |
3.3. Results of Analytical Method Validation
3.3.1. System Suitability
During the system suitability study, the solution containing spiked impurities at the limit concentration and the standard solutions of carglumic acid for quantification were injected six times in a row from the same vial. The results showed a relative standard deviation (RSD) of less than or equal to 2% for the peak areas. The values of the spiked standard solution are presented in Table 4. The system suitability evaluation revealed that the number of plates exceeded 2000, the tailing factor was below 2, and the capacity factor was above 2 for all peaks. Furthermore, the resolution for each impurity was determined to be greater than 2. Additional system compatibility results are provided in supplementary Table S1.
Table 4. System Suitability Results for Carglumic Acid and its Impurities for Spiked Standard Solution.
| Peak Name | Mean Area | RSD % for Area(n = 6) | Plate Count | Resolution | Tailing factor | Capacity Factor(k’) |
|---|---|---|---|---|---|---|
| Carglumic acid | 17.39 | %0.21 | 3578 | - | 1.21 | 2.11 |
| Pyroglutamic acid | 48.60 | %0.15 | 5207 | 5.71 | 1.20 | 3.24 |
| Related compound A | 60.96 | %0.11 | 6418 | 7.74 | 1.27 | 3.76 |
| Pyrocarglumic acid | 184.01 | %0.08 | 6140 | 7.41 | 1.24 | 6.05 |
| Dicarbamoyll-glutamic acid | 342.90 | %0.12 | 5879 | 12.33 | 1.10 | 7.67 |
3.3.2. Specificity
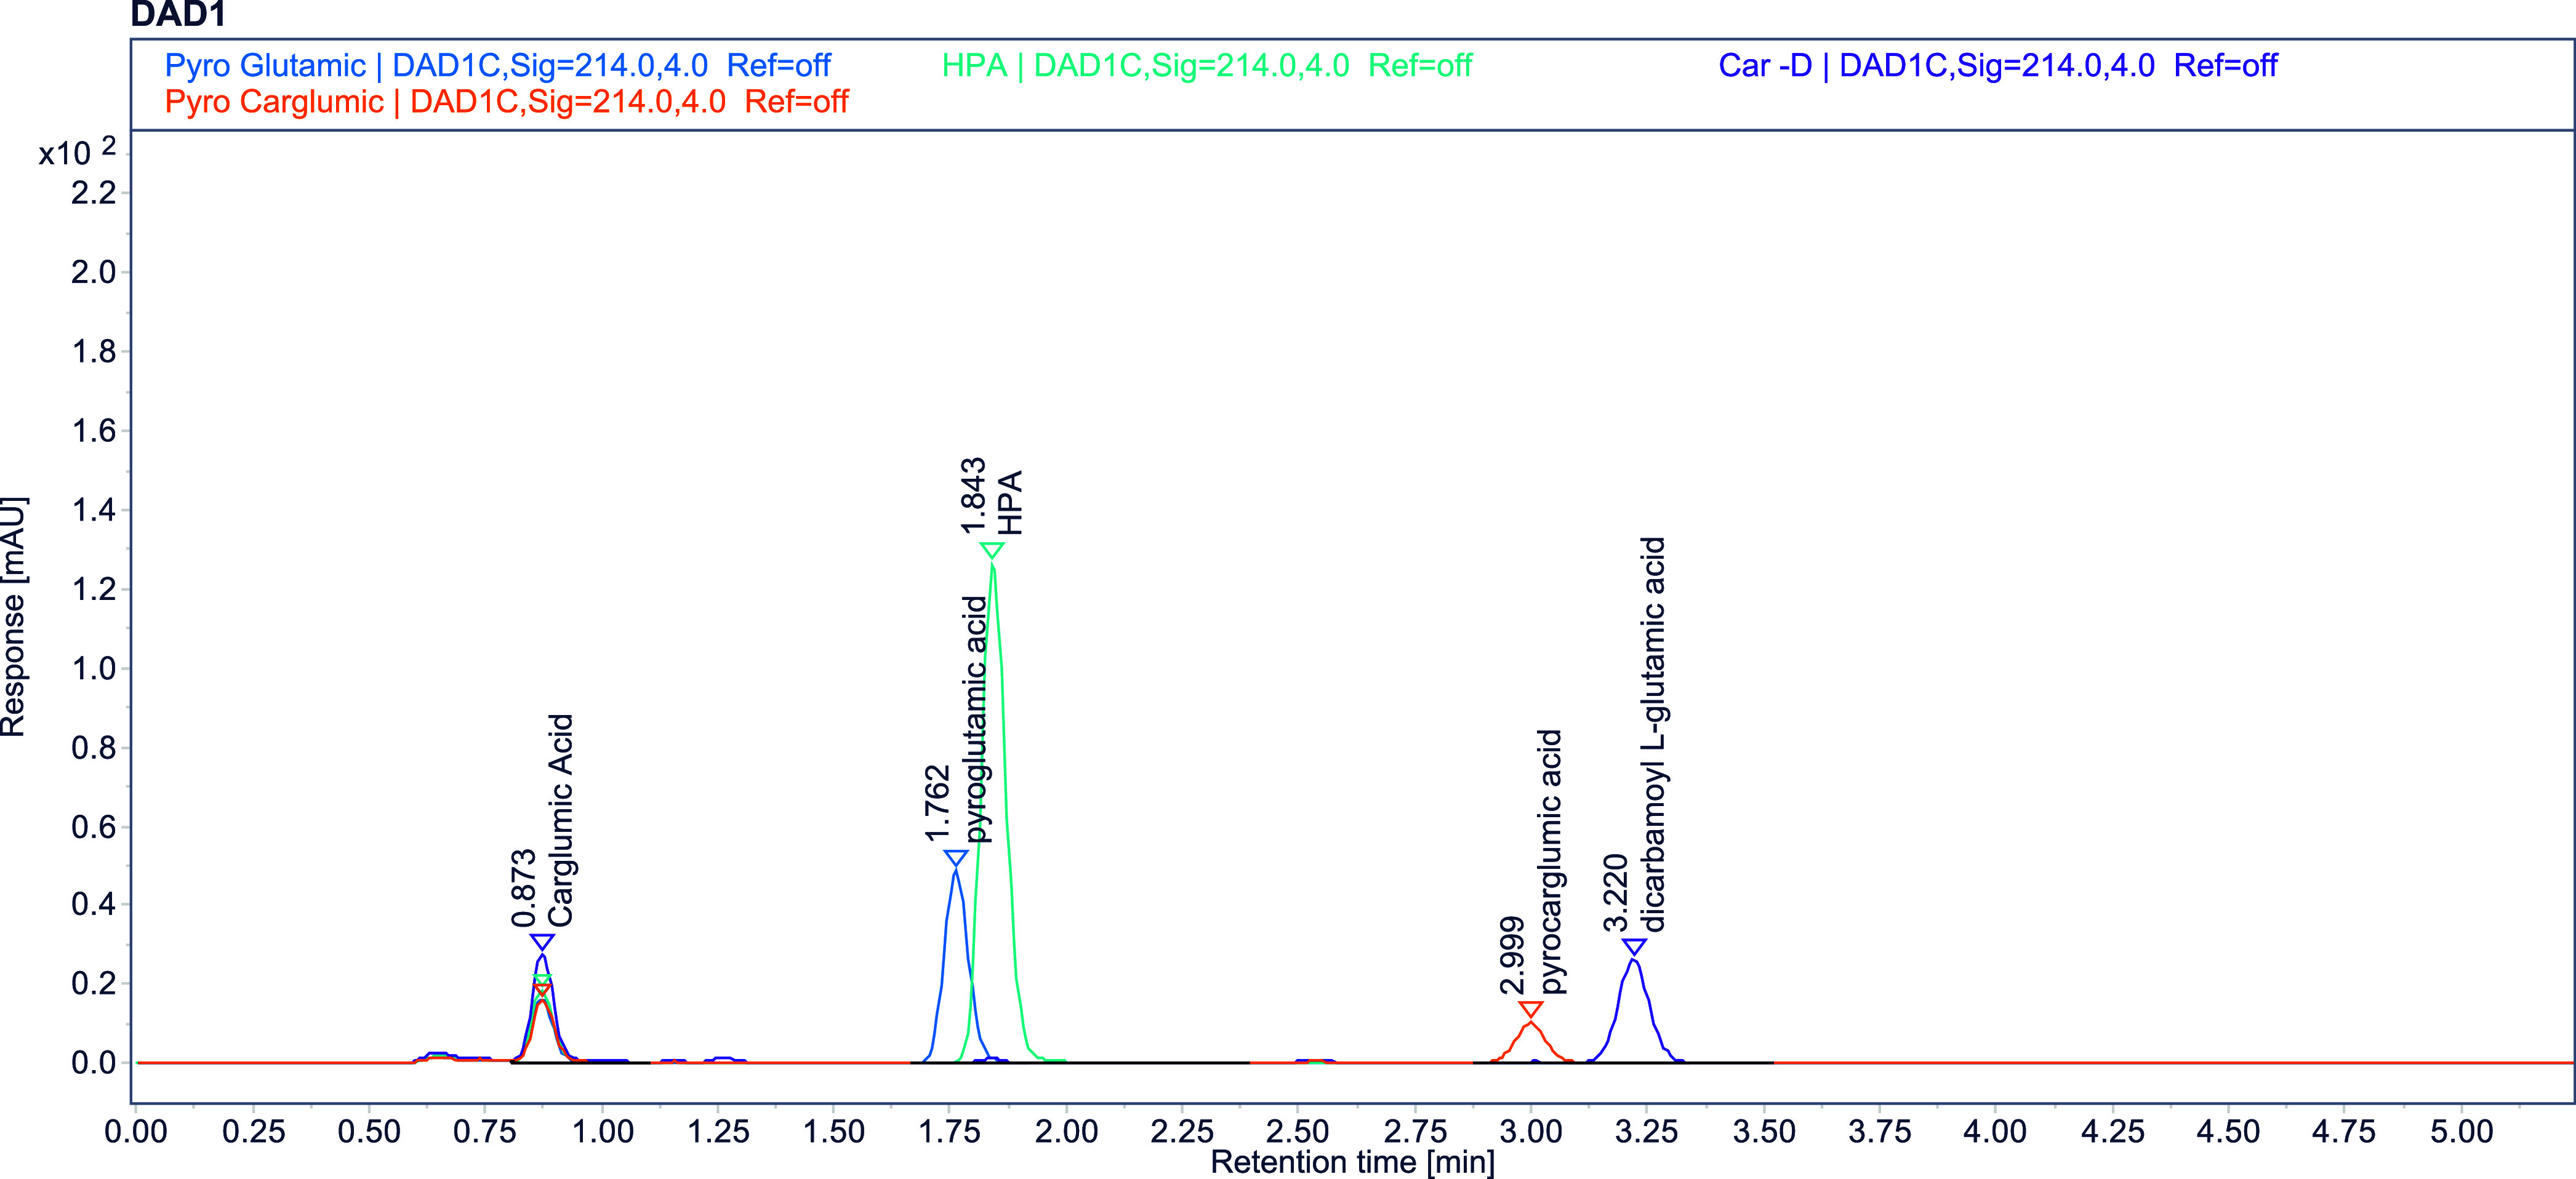
This study demonstrated that there was no interference between the peaks of carglumic acid and impurities (40 μg/mL), as well as between the chromatograms of the blank, placebo, standard, and test solutions (9600 μg/mL). These investigation’s chromatograms are shown in Figures 5,6. In this study, solutions prepared at the concentration to be used for quantification and spiked standard solutions at the limit concentration were utilized, respectively. Furthermore, a forced degradation analysis was conducted to validate this method is stability-indicating.
Figure 5.

Impurity spiked standard solution at a limit concentration.
Figure 6.

Overlapped chromatogram of blank (a), test (b), standard (c), and placebo solution at assay concentration.
3.3.3. Forced Degradation Studies
The acid, alkaline, oxidative, thermal, and photolytic stress conditions described in the method section were implemented on the samples as instructed, resulting in the degradation ratios provided in Table 5. The table presents the calculated %Mass Balance and %Purity values of the carglumic acid peak under several stress situations using the OpenLab software.
Table 5. Results of Forced Degradation Experiment.
| Forced Degradation Conditions | Degradation (%) | Mass Balance (%)a | Purity of Carglumic acid (%) |
|---|---|---|---|
| Untreated solution | - | - | 99.50 |
| Acid degradation (0.1 N HCl 2 h) | 11.6 | 98.1 | 99.08 |
| Alkali degradation (0.1 N NaOH 2 h) | 5.2 | 98.9 | 98.51 |
| Oxidative degradation (3% H2O2 1 h) | 8.6 | 99.5 | 99.41 |
| Thermal degradation (90 °C 21 days) | 7.6 | 98.3 | 99.35 |
| Photolytic degradation (1200 lx) | 1.2 | 99.9 | 99.47 |
| Accelerated stability condition (6 month 40° 75% Rh) | 0.33 | 98.5 | 99.04 |
Mass balance equation; % assay of stressed sample + %impurities × 100/% assay of unstressed sample.
3.3.4. Linearity and Range
Analysis for carglumic acid was carried out in the range of 4–9600 μg/mL (0.05–120%), so that the working concentration was suitable for both impurity and assay analysis. The R2 value was found as 1.0000, and the ANOVA results for the graph were shared in Supporting Information. Here, the statistical suitability of the graph was evaluated by checking the p-value for the intercept and x variable. Here, values of p > 0.05 for intercept and p < 0.05 for x variable were accepted as control criteria and were observed to be met.
3.3.5. Response Factor
Due to the high cost of impurities, it was decided to evaluate all impurities according to the carglumic acid peak by studying the relative response factor (RRF) instead of the external standard method, and in this sense, RRF values were calculated using the slopes of the samples analyzed in the range of 4–800 μg/mL (0.05–10.00%). The results regarding this are given in Table 6.
Table 6. Linearity Results for Each Impurities and Carglumic Acid for Relative Response Factor Calculation, Graphs of Each Impurity Was Given in Figures S1–S5 and Tables S2–S6.
| Name | R2 | Slope | Relative Response Factor (RRF) |
|---|---|---|---|
| Carglumic acid | 0.9999 | 0.4429 | 1.0 |
| Pyroglutamic acid | 0.9999 | 1.2426 | 2.8 |
| Related compound A | 1.0000 | 1.5426 | 3.5 |
| Pyrocarglumic acid | 0.9999 | 4.6072 | 10.4 |
| Dicarbamoyll-glutamic acid | 0.9999 | 8.744 | 19.7 |
3.3.6. Accuracy
To show the accuracy of the method, three samples of carglumic acid at concentrations of 4 μg/mL (0.05%), 8000 μg/mL (100%), and 9600 μg/mL (120%) were weighed and analyzed by spiking placebo. Here, the results being in the range of 98–102% for each concentration level was accepted as the control criterion, and the results are shown in the supplementary.
3.3.7. Precision
While deciding on precision, six samples were analyzed simultaneously, and results were found with an RSD value of less than two. To demonstrate intermediate precision, the same analysis was repeated on a different analytical column (same brand but different Lot number), 1 day later, and on a different HPLC instrument. The RSD between these analyses was found to be lower than two. The t and f-test results are added as supporting to show the statistical results of the difference between these analyses.
3.3.8. LOQ and LOD
LOQ and LOD values were found to be 0.7 and 0.15 μg/mL, respectively, considering S/N noise values. To see the reproducibility of these results, six consecutive injections of the LOQ solution were given, and the RSD value was checked. LOD solution was given in two consecutive injections, and S/N values were compared. The relevant results appear in Table 8.
Table 8. Results of Placket–Burmann experimental design.
| ObtainedP Values |
R2 Value | |||||
|---|---|---|---|---|---|---|
| Results | Wavelength | Column Temperature | Flow Rate | pH Value of Mobile Phase | Model | Model |
| Carglumic acid assay (%) | 0.415 | 0.652 | 0.771 | 0.951 | 0.512 | 0.7812 |
| Related compound A (%) | 0.598 | 0.142 | 0.598 | 0.028 | 0.116 | 0.6102 |
| Pyrocarglumic acid | 0.879 | 0.197 | 0.454 | 0.008 | 0.054 | 0.6951 |
| Dicarbamoyll-glutamic acid | 1.000 | 0.104 | 0.104 | 0.104 | 0.125 | 0.6000 |
| Pyroglutamic acid | 0.423 | 0.785 | 0.785 | 0.423 | 0.802 | 0.1869 |
| Total impurities | 0.415 | 0.127 | 0.536 | 0.415 | 0.378 | 0.4134 |
3.3.9. Solution Stability
To determine the stability of the solutions, the samples kept in the 4 °C autosampler were analyzed at certain time intervals. As a result of this analysis, it was determined that the sample and standard were stable for 48 h. The results of this analysis are given in Table S8.
3.3.10. Filter Selection
The sample had to be filtered before being injected into the HPLC column due to the insoluble placebo it contained. Therefore, different filters were examined, and it was observed whether there was any adhesion in terms of the active ingredient and impurities in the sample. For this purpose, hydrophilic PTFE, nylon, and CE filters were studied. As a result of this study, a 0.45 μm hydrophilic PTFE filter was selected as the most suitable and used for the entire analysis. The results of these analyzes were presented in Table S9.
3.3.11. Robustness (with Plackett–Burman)
Statistical experimental design was employed to investigate the robustness parameters. The Plackett–Burman experimental design was applied to determine the significance of each modification under the chromatographic conditions on the sample. A separate standard solutions and test solutions were each prepared and injected for each parameter. The information on the alterations performed to the chromatographic conditions and experimental design parameters were given in Table 7. Also, the results of this analysis were added to Table 8.
Table 7. Robustness Conditions and Plackett–Burman Experimental Design Conditions.
| Level |
|||
|---|---|---|---|
| Parameters | Low (−) | Real | High (+) |
| Wavelength (nm) | 212 | 214 | 216 |
| Column temperature (°C) | 24.2 | 25 | 25.8 |
| Flow r(mL/min) | 0.38 | 0.39 | 0.40 |
| pH Value of mobile phase | 2.3 | 2.4 | 2.5 |
| Conditions | ||||
|---|---|---|---|---|
| Injection | Wavelength (nm) | Column Temperature (°C) | Flow Rate (mL/min) | pH Value of Mobile Phase |
| 1 | + | + | – | + |
| 2 | + | – | – | – |
| 3 | – | + | – | + |
| 4 | – | + | + | – |
| 5 | – | – | + | – |
| 6 | + | + | – | – |
| 7 | – | + | + | + |
| 8 | + | – | + | + |
| 9 | + | + | + | – |
| 10 | – | – | – | – |
| 11 | + | – | + | + |
| 12 | – | – | – | + |
When these results were evaluated statistically, it was concluded that the model established was not significant and had a low descriptive coefficient. According to this established model, it was concluded that only the effect of the change in pH value of mobile phase A of HPA and pyrocarglumic acid was significant, but the effect on the other results was not significant. Even though the developed analytical method works well, even when small changes are performed, it is important to pay close attention to changes in the pH value of mobile phase A during the analyses.
Summary of all analytical validation results are given in Table 9.
Table 9. Summary of Results of Analytical Validation Parameters.
| Validation Parameters | Acceptance Criteria | Results | ||
|---|---|---|---|---|
| System suitability | RSD % ≤ 0.85 for six consecutive injections | Complies (Table 4) | ||
| Specificity | No interference from blank, placebo or forced degradation related products between carglumic acid and known impurities | No interference observed (Table and5Figure 6) | ||
| Linearity and range | R2 ≥ 0.99 | Complies | ||
| P value | ≥0.05 for intercept | |||
| ≤0.05 for x value | ||||
| Accuracy | 4 μg/mL (0.05%), 8000 μg/mL (100%), 9600 μg/mL (120%) | Should be within limit 98%–102% for each injection | Complies (Table S10) | |
| Precision | RSD ≤ 2 N = 6each day, between days | Complies (Tables S7 and S11–12) | ||
| LOD/LOQ | LOQ s/N ≥ 10 (RSD % ≤ 10 N = 6) | x̅ s/N = 14.1 (RSD= 0.95) | ||
| LOD 2 ≤ s/N ≤ 3 | s/N= 2.1, 2.2 | |||
3.4. Applications of the Developed Method in Pharmaceutical Industry
This newly developed method enables the identification of certain impurities and degradation products with carglumic acid. UHPLC was used to guarantee minimal solvent usage and minimize the need for organic solvents. Thus, the environment was conserved, and laboratory costs were reduced. Furthermore, the cost of carboxylic acid impurities is relatively high. However, in this approach, the standard cost for these impurities was avoided by employing relative response factors. Furthermore, the implementation of Box–Behnken and Plackett–Burman DoE experimental designs in method development studies resulted in a reduction in the time required for method development. Given that this method has been validated in accordance with the requirements set by the International Council for Harmonization of Technical Requirements for Pharmaceuticals for Human Use (ICH), it can be employed in research related to the development of drugs and has made a significant contribution in this regard.
4. Conclusions
In summary, the utilization of the Box–Behnken design in the construction of a methodology for the detection of impurities in carglumic acid signifies a notable advancement in the field of pharmaceutical analysis. The implementation of this robust experimental design enabled the systematic investigation of key aspects that impact impurity detection as well as the enhancement of analytical conditions through optimization. The findings derived from this investigation emphasize the significance of utilizing statistical methodologies, such as the Box–Behnken design, in the process of method development. These techniques provide more effective and dependable identification of contaminants.
The effective execution of this approach exhibits significant potential in guaranteeing the quality and safety of pharmaceutical formulations containing carglumic acid. The refined methodology exhibits improved sensitivity and selectivity while also providing a standardized and replicable strategy for impurity profiling. The present study provides significant contributions to the field of pharmaceutical analysis by highlighting the need to utilize advanced experimental designs to improve the reliability and effectiveness of analytical methods.
In addition, to enhance the robustness of the devised methodology for the determination of carglumic acid impurities, a complementary Plackett–Burman analysis was performed. This supporting measure is intended to discover and evaluate the potential elements that may have an effect on the performance of the approach. The Plackett–Burman design was utilized to systematically assess the primary impacts of different parameters, so facilitating a full comprehension of the method’s susceptibility to external circumstances. This robustness evaluation enhances the dependability and usefulness of the approach.
In summary, the integration of Box–Behnken and Plackett–Burman designs in the methodology development for the study of carglumic acid impurities gives a comprehensive and systematic approach. The incorporation of these statistical methodologies not only enhances the technique’s sensitivity and selectivity but also guarantees its resilience when confronted with various external circumstances. The use of this dual approach enhances the overall caliber and dependability of the analytical process, hence bolstering the assurance of the precision of impurity measurements for carglumic acid formulations. The integration of systematic and inclusive techniques in method development is crucial to fulfill the rigorous demands of contemporary pharmaceutical analysis, as pharmaceutical standards undergo ongoing evolution.
Acknowledgments
This work is financially supported by Elixir Pharmaceuticals Corporation.
Supporting Information Available
The Supporting Information is available free of charge at https://pubs.acs.org/doi/10.1021/acsomega.4c01183.
Detailed analysis results of each validation parameters as tables and figures (PDF)
The authors declare no competing financial interest.
Supplementary Material
References
- Carglumic Acid: New Preparation. An Advance in Rare Urea Cycle Disorders. Prescrire Int., 2004; 13, (69), , 3–4.. [PubMed] [Google Scholar]
- Shi D.; Zhao G.; Ah Mew N.; Tuchman M. Precision Medicine in Rare Disease: Mechanisms of Disparate Effects of N-Carbamyl-L-Glutamate on Mutant CPS1 Enzymes. Mol. Genet. Metab. 2017, 120 (3), 198–206. 10.1016/j.ymgme.2016.12.002. [DOI] [PMC free article] [PubMed] [Google Scholar]
- Kiykim E.; Zubarioglu T. Low Dose of Carglumic Acid for Treatment of Hyperammonemia Due to N-Acetylglutamate Synthase Deficiency. Indian Pediatr. 2014, 51 (9), 755–756. [PubMed] [Google Scholar]
- Singh R. H.; Rhead W. J.; Smith W.; Lee B.; King L. S.; Summar M. Nutritional Management of Urea Cycle Disorders. Crit. Care Clin. 2005, 21 (4), S27–S35. 10.1016/j.ccc.2005.08.003. [DOI] [PubMed] [Google Scholar]
- Kasapkara C. S.; Ezgu F. S.; Okur I.; Tumer L.; Biberoglu G.; Hasanoglu A. N-Carbamylglutamate Treatment for Acute Neonatal Hyperammonemia in Isovaleric Acidemia. Eur. J. Pediat. 2011, 170 (6), 799–801. 10.1007/s00431-010-1362-9. [DOI] [PubMed] [Google Scholar]
- Hart E. J.; Powers-Lee S. G. Role of Cys-1327 and Cys-1337 in Redox Sensitivity and Allosteric Monitoring in Human Carbamoyl Phosphate Synthetase. J. Biol. Chem. 2009, 284 (9), 5977–5985. 10.1074/jbc.M808702200. [DOI] [PMC free article] [PubMed] [Google Scholar]
- Abacan M.; Boneh A. Use of Carglumic Acid in the Treatment of Hyperammonaemia during Metabolic Decompensation of Patients with Propionic Acidaemia. Mol. Genet. Metab. 2013, 109 (4), 397–401. 10.1016/j.ymgme.2013.05.018. [DOI] [PubMed] [Google Scholar]
- Levrat V.; Forest I.; Fouilhoux A.; Acquaviva C.; Vianey-Saban C.; Guffon N. Carglumic Acid: An Additional Therapy in the Treatment of Organic Acidurias with Hyperammonemia?. Orphanet J. Rare Dis. 2008, 3 (1), 2. 10.1186/1750-1172-3-2. [DOI] [PMC free article] [PubMed] [Google Scholar]
- Valayannopoulos V.; Baruteau J.; Delgado M. B.; Cano A.; Couce M. L.; Toro M. D.; Donati M. A.; Garcia-Cazorla A.; Gil-Ortega D.; Gomez-de Quero P.; et al. Carglumic Acid Enhances Rapid Ammonia Detoxification in Classical Organic Acidurias with a Favourable Risk-Benefit Profile: A Retrospective Observational Study. Orphanet J. Rare Dis. 2016, 11 (1), 32. 10.1186/s13023-016-0406-2. [DOI] [PMC free article] [PubMed] [Google Scholar]
- Alfadhel M.; Nashabat M.; Saleh M.; Elamin M.; Alfares A.; Othaim A. A.; Umair M.; Ahmed H.; Ababneh F.; Mutairi F. A.; et al. Long-Term Effectiveness of Carglumic Acid in Patients with Propionic Acidemia (PA) and Methylmalonic Acidemia (MMA): A Randomized Clinical Trial. Orphanet J. Rare Dis. 2021, 16 (1), 422. 10.1186/s13023-021-02032-8. [DOI] [PMC free article] [PubMed] [Google Scholar]
- Sattar Y.; Wasiq S.; Yasin W.; Khan A. M.; Adnan M.; Shrestha S.; Patel N. B.; Latchana S. Carglumic Acid Treatment of a Patient with Recurrent Valproic Acid-Induced Hyperammonemia: A Rare Case Report. Cureus 2018, 10, e3292 10.7759/cureus.3292. [DOI] [PMC free article] [PubMed] [Google Scholar]
- Garg L. K.; Reddy V. S.; Sait S. S.; Krishnamurthy T.; Vali S. J.; Reddy A. M. Quality by Design: Design of Experiments Approach Prior to the Validation of a Stability-Indicating HPLC Method for Montelukast. Chromatographia 2013, 76 (23–24), 1697–1706. 10.1007/s10337-013-2509-4. [DOI] [Google Scholar]
- Yadav N. K.; Raghuvanshi A.; Sharma G.; Beg S.; Katare O. P.; Nanda S. QbD-Based Development and Validation of a Stability-Indicating HPLC Method for Estimating Ketoprofen in Bulk Drug and Proniosomal Vesicular System. J. Chromatogr. Sci. 2016, 54 (3), 377–389. 10.1093/chromsci/bmv151. [DOI] [PubMed] [Google Scholar]
- Patil T. S.; Deshpande A. S. Development of an Innovative Quality by Design (QbD) Based Stability-Indicating HPLC Method and Its Validation for Clofazimine from Its Bulk and Pharmaceutical Dosage Forms. Chromatographia 2019, 82 (2), 579–590. 10.1007/s10337-018-3660-8. [DOI] [Google Scholar]
- Sahu P. K.; Ramisetti N. R.; Cecchi T.; Swain S.; Patro C. S.; Panda J. An Overview of Experimental Designs in HPLC Method Development and Validation. J. Pharm. Biomed. Anal. 2018, 147, 590–611. 10.1016/j.jpba.2017.05.006. [DOI] [PubMed] [Google Scholar]
- Patel M. N.; Kothari C. S. Multivariate Approaches for Simultaneous Determination of Avanafil and Dapoxetine by UV Chemometrics and HPLC-QbD in Binary Mixtures and Pharmaceutical Product. J. AOAC Int. 2016, 99 (3), 649–663. 10.5740/jaoacint.15-0259. [DOI] [PubMed] [Google Scholar]
- Menda J.; Chintala V.; Kanuparthy P. R.; Katari N. K.; Kowtharapu L. P.; Jonnalagadda S. B. Quality by Design Tool Assessed Ultraperformance Liquid Chromatography Method for the Analysis of Remogliflozin and Teneligliptin in Oral Dosage Form. ACS Omega 2024, 9, 12553–12563. 10.1021/acsomega.3c04589. [DOI] [PMC free article] [PubMed] [Google Scholar]
- Shamim A.; Ansari M. J.; Aodah A.; Iqbal M.; Aqil M.; Mirza M. A.; Iqbal Z.; Ali A. QbD-Engineered Development and Validation of a RP-HPLC Method for Simultaneous Estimation of Rutin and Ciprofloxacin HCl in Bilosomal Nanoformulation. ACS Omega 2023, 8 (24), 21618–21627. 10.1021/acsomega.3c00956. [DOI] [PMC free article] [PubMed] [Google Scholar]
- Rathee A.; Solanki P.; Verma S.; Vohora D.; Ansari M. J.; Aodah A.; Kohli K.; Sultana Y. Simultaneous Determination of Posaconazole and Hemp Seed Oil in Nanomicelles through RP-HPLC via a Quality-by-Design Approach. ACS Omega 2023, 8 (33), 30057–30067. 10.1021/acsomega.3c02097. [DOI] [PMC free article] [PubMed] [Google Scholar]
- Žigart N.; Časar Z. Development of a Stability-Indicating Analytical Method for Determination of Venetoclax Using AQbD Principles. ACS Omega 2020, 5 (28), 17726–17742. 10.1021/acsomega.0c02338. [DOI] [PMC free article] [PubMed] [Google Scholar]
- Azhakesan A.; Kuppusamy S. Analytical Quality by Design-Assisted HPLC Method for Quantification of Canagliflozin and Stability Studies. ACS Omega 2023, 8 (8), 7407–7414. 10.1021/acsomega.2c06038. [DOI] [PMC free article] [PubMed] [Google Scholar]
- Kovač L.; Časar Z.; Trdan Lušin T.; Roškar R. Development of an Analytical Method for Determination of Related Substances and Degradation Products of Cabotegravir Using Analytical Quality by Design Principles. ACS Omega 2022, 7 (10), 8896–8905. 10.1021/acsomega.1c07260. [DOI] [PMC free article] [PubMed] [Google Scholar]
- Blessy M.; Patel R. D.; Prajapati P. N.; Agrawal Y. K. Development of Forced Degradation and Stability Indicating Studies of Drugs - A Review. J. Pharm. Anal. 2014, 4, 159–165. 10.1016/j.jpha.2013.09.003. [DOI] [PMC free article] [PubMed] [Google Scholar]
- United States Pharmacopeia. USP-NF Carglumic Acid PF476.
- Ma Y.; Zeng Z.; Kong L.; Chen Y.; He P. Determination of N-Carbamylglutamate in Feeds and Animal Products by High Performance Liquid Chromatography Tandem Mass Spectrometry. Molecules 2019, 24 (17), 3172. 10.3390/molecules24173172. [DOI] [PMC free article] [PubMed] [Google Scholar]
- Pawar R.; Naresh P.; Kalva B.; Kumar M. R.; Ravichandiran V.; Ramalingam P. Analytical Quality by Design Approach for the Development of High-performance Liquid Chromatography Method for Simultaneous Analysis of Metformin and Sitagliptin in the Presence of Major Degradation Products. J. Sep. Sci. 2024, 47 (5), 2300605. 10.1002/jssc.202300605. [DOI] [PubMed] [Google Scholar]
- Sathuluri K.; Bakam R.; Jain R.; Dande A.; Gajbhiye R.; Ravichandiran V.; Peraman R. Analytical Quality by Design (AQbD) in the ICHQ14 Guidelines for Analytical Procedure Development. Accredit. Qual. Assur. 2024, 1–14. 10.1007/s00769-024-01587-w. [DOI] [Google Scholar]
- ICH. Analytical Procedure Development Q14; ICH, 2022. [Google Scholar]
- ICH International Conference On Harmonization Of Technical Requirements For Registration Of Pharmaceuticals For Human Use. Harmonised Guideline Quality Risk Management Q9(R1); ICH, 2023. [Google Scholar]
- ICH International conference on harmonisation of technical requirements for registration of pharmaceuticals for human use ich harmonised tripartite guideline validation of analytical procedures: text and methodology q2(r1); ICH, 2005. [Google Scholar]
- De Backer B.; Debrus B.; Lebrun P.; Theunis L.; Dubois N.; Decock L.; Verstraete A.; Hubert P.; Charlier C. Innovative Development and Validation of an HPLC/DAD Method for the Qualitative and Quantitative Determination of Major Cannabinoids in Cannabis Plant Material. J. Chromatogr. B 2009, 877 (32), 4115–4124. 10.1016/j.jchromb.2009.11.004. [DOI] [PubMed] [Google Scholar]
- Prajapati P.; Patel M.; Shah S. A Robust High-Performance Thin-Layer Chromatography Method for the Simultaneous Estimation of Chlorthalidone and Metoprolol Succinate Using Quality Risk Assessment and Design of Experiments-Based Enhanced Analytical Quality by Design Approach. J. Planar Chromatogr.- Mod. TLC 2021, 34 (3), 229–242. 10.1007/s00764-021-00107-7. [DOI] [Google Scholar]
- Tome T.; Žigart N.; Časar Z.; Obreza A. Development and Optimization of Liquid Chromatography Analytical Methods by Using AQbD Principles: Overview and Recent Advances. Org. Process Res. Dev. 2019, 23, 1784–1802. 10.1021/acs.oprd.9b00238. [DOI] [Google Scholar]
- Carglumic Acid: A Second Look. Confirmed Progress in a Rare Urea Cycle Disorder. Prescrire Int., 2008; 17, (94), , 50–51.. [PubMed] [Google Scholar]
- Mahrouse M. A.; Lamie N. T. Experimental Design Methodology for Optimization and Robustness Determination in Ion Pair RP-HPLC Method Development: Application for the Simultaneous Determination of Metformin Hydrochloride, Alogliptin Benzoate and Repaglinide in Tablets. Microchem. J. 2019, 147, 691–706. 10.1016/j.microc.2019.03.038. [DOI] [Google Scholar]
- Vogt F. G.; Kord A. S. Development of Quality-by-Design Analytical Methods. J. Pharm. Sci. 2011, 100 (3), 797–812. 10.1002/jps.22325. [DOI] [PubMed] [Google Scholar]
- Rozet E.; Ziemons E.; Marini R. D.; Boulanger B.; Hubert P. Quality by Design Compliant Analytical Method Validation. Anal. Chem. 2012, 84 (1), 106–112. 10.1021/ac202664s. [DOI] [PubMed] [Google Scholar]
- Debrus B.; Guillarme D.; Rudaz S. Improved Quality-by-Design Compliant Methodology for Method Development in Reversed-Phase Liquid Chromatography. J. Pharm. Biomed. Anal. 2013, 84, 215–223. 10.1016/j.jpba.2013.06.013. [DOI] [PubMed] [Google Scholar]
- Hibbert D. B. Experimental Design in Chromatography: A Tutorial Review. J. Chromatogr. B 2012, 910, 2–13. 10.1016/j.jchromb.2012.01.020. [DOI] [PubMed] [Google Scholar]
- Ferreira S. L. C.; Bruns R. E.; da Silva E. G. P.; dos Santos W. N. L.; Quintella C. M.; David J. M.; de Andrade J. B.; Breitkreitz M. C.; Jardim I. C. S. F.; Neto B. B. Statistical Designs and Response Surface Techniques for the Optimization of Chromatographic Systems. J. Chromatogr. A 2007, 1158, 2–14. 10.1016/j.chroma.2007.03.051. [DOI] [PubMed] [Google Scholar]
- EDQM 2 2.46. Chromatographic Separation techniques european pharmacopoeia 11.0; EDQM, 2023. [Google Scholar]
- Sharma S.; Gupta P.; Gupta A.; Kawish S.; Iqbal Z.; Vohora D.; Kohli K. Rapid Analytical Method Development and Validation of RP-HPLC Method for the Simultaneous Estimation of Exemestane and Genistein with Specific Application in Lipid-Based Nanoformulations. ACS Omega 2023, 8, 25101. 10.1021/acsomega.3c01791. [DOI] [PMC free article] [PubMed] [Google Scholar]
- Shamim A.; Ansari M. J.; Aodah A.; Iqbal M.; Aqil M.; Mirza M. A.; Iqbal Z.; Ali A. QbD-Engineered Development and Validation of a RP-HPLC Method for Simultaneous Estimation of Rutin and Ciprofloxacin HCl in Bilosomal Nanoformulation. ACS Omega 2023, 8 (24), 21618–21627. 10.1021/acsomega.3c00956. [DOI] [PMC free article] [PubMed] [Google Scholar]
- Center for drug evaluation and research application number: 22–562 chemistry review(s).
- European Medicines Agency (EMA) ICH Topic Q1B Photostability Testing of New Active Substances and Medicinal Products; European Medicines Agency (EMA), 1998 [Google Scholar]
- Center for drug evaluation and research application number: 22–562 clinical pharmacology and biopharmaceutics review(s).
Associated Data
This section collects any data citations, data availability statements, or supplementary materials included in this article.