Abstract
Textile wastewater poses a substantial environmental challenge due to the persistence of organic dyes. This study introduces a novel approach using photovoltaic (PV) powered electro-Fenton (EF) technology for effective treatment of textile wastewater. Acid orange 7 (AO7), methylene blue (MB), and malachite green (MG) were selected as representative organic dyes to validate the method under varying experimental conditions. Analysis of variance (ANOVA) highlighted the significant influence of pollutant type, pH levels, and current density on the degradation efficiency of the system, with optimal conditions observed at pH = 3 and high current density. To underscore the environmental benefits, a comprehensive life cycle assessment (LCA) was conducted. The PV-powered EF system, when implemented in a textile mill, exhibited an energy payback time (EPBT) of 9.53 years, a greenhouse gas payback time (GPBT) of 4.45 years, and a life cycle cost (LCC) of 1.9 × 10⁵ RMB. Comparative analysis with conventional Fenton and EF processes revealed substantial energy savings, with carbon emissions reduced by 95% and 78%, and energy consumption reduced by 87% and 52%, respectively.
1. Introduction
Significant environmental pressures are brought about by rapid population growth and urbanization.1,2 Water pollution, particularly, is considered a critical concern,3,4 with organic dyes from textile manufacturing posing substantial challenges.5 These dyes are known to persist in water bodies, disrupting ecological equilibrium,6,7 and their carcinogenic properties further contribute to environmental and health risks.8,9 Traditional methods like biological oxidation and chemical flocculation have been found to struggle with effectively addressing these pollutants,10,11 necessitating advancements in textile wastewater treatment technologies.
The potential of the Fenton reaction has been identified as a solution,12 where organic dyes are degraded using H2O2 and Fe2+.13 However, challenges in the production and storage of these chemicals have hindered widespread adoption.14,15 An alternative, the electro-Fenton (EF) process, operates on electrochemical principles, continuously generating Fe2+ ions and hydroxyl radicals (HO•) to enhance dye degradation efficiency.16,17 Despite its effectiveness, the EF process remains reliant on grid electricity, leading to high energy consumption.18 To address this issue, the integration of renewable energy sources, such as solar energy, is considered crucial. Photovoltaic (PV) panels can be strategically installed in unused spaces such as textile mill roofs and cesspool covers to harness solar power, reducing reliance on conventional grid sources.
Life cycle assessment (LCA) methodology provides a robust framework for evaluating energy consumption and carbon emissions in textile wastewater treatment systems.19 Estévez et al. performed LCA of technologies for decolorization strategies in textile wastewater to analyze their environmental impacts and economic benefits;20 Grisales et al. applied LCA to evaluate the impacts of multiple constituents of textile wastewater on the Fenton process;21 Zhang et al. conducted an LCA of sludge waste reuse in the EF process;22 Magdy et al. used the LCA approach to compare five methods of chemical removal of phenol and its transformation products containing EF.23 These studies have applied LCA to assess various aspects of wastewater treatment technologies in the textile sector, highlighting its utility in assessing environmental impacts and economic feasibility.
While existing research has focused on LCA applications in textile wastewater treatment, there remains a gap in evaluating the integration of solar energy to enhance energy efficiency and sustainability. This study aims to fill this gap by implementing a PV-powered EF system and evaluating its performance under varying operational conditions. An LCA of the system is conducted to compare its environmental and economic benefits against conventional Fenton and EF processes.
The system design and methodology are presented in Section 2. Experimental results are presented in Section 3, followed by the LCA findings in Section 3.2. The main findings of the study are summarized in Section 4.
2. Research Method
2.1. PV-Powered EF System
2.1.1. Experimental Instruments and Materials
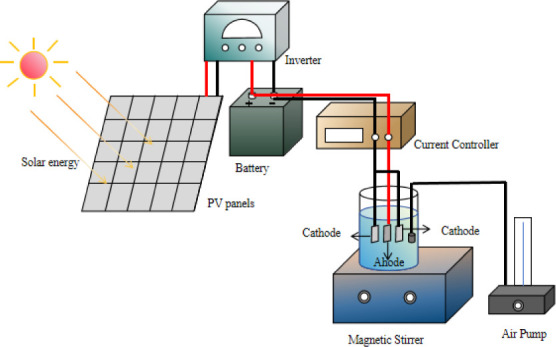
The PV-powered EF system is primarily composed of a PV system and an EF wastewater treatment system, as depicted in Figure 1’s flowchart. The experimental setup can be seen in Figures 2 and 3.
Figure 1.
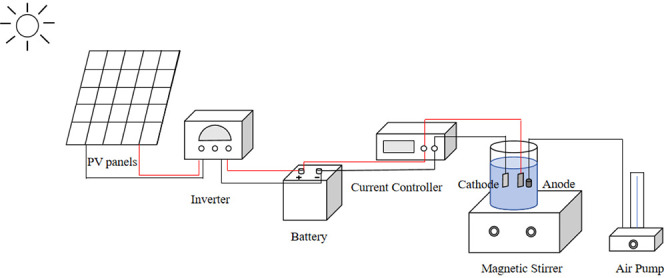
Flowchart of experimental apparatus.
Figure 2.
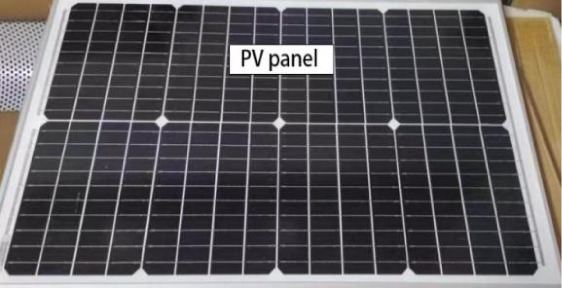
PV panel used in the experiment.
Figure 3.
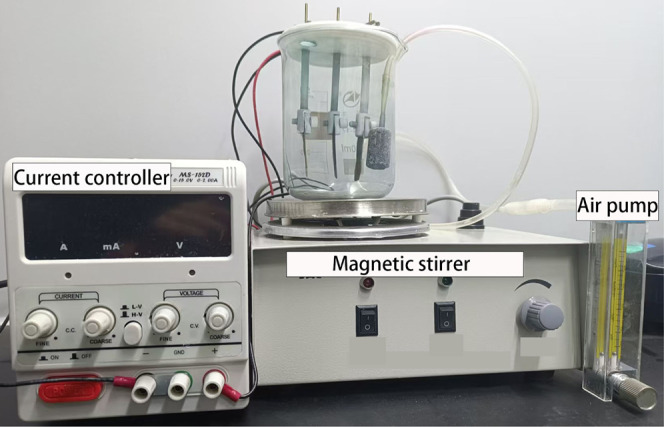
Experimental platform of the EF method.
The PV system includes PV panels connected sequentially to an inverter and then to a battery. Solar energy is absorbed by the PV panels to generate electricity, which is converted from direct current (DC) to alternating current (AC) by the inverter. Any surplus electricity produced is stored in the battery for future use. Situated in Chengdu, China (longitude: 104.00 degrees, latitude: 30.56 degrees north), the experimental platform features PV panels oriented southward at a 30-degree angle from the ground. This orientation optimizes solar energy capture for efficient power generation.
The EF system for wastewater treatment employs nickel foam as the cathode and graphite electrodes as the anode, arranged parallel to the solution. The positive PV pole connects to the anode, while the negative PV pole connects to the cathode, establishing a complete current loop. In the experiment, 400 mL of organic dye wastewater served as the target solution. Continuous oxygenation of the solution was ensured, and degradation rates were monitored by measuring the absorbance using a UV spectrophotometer.
2.1.2. PV System
The Sandia model24 was used to calculate and evaluate the power production of the PV system. According to calculations performed with this model, the PV system in this experiment is expected to generate 37 kW h annually.
2.1.3. EF Degradation Model
In the experiments, an EF model was used to study the degradation of organic dyes. The process utilizes an electrochemical technique based on the Fenton reaction. The addition of Fe2+ acted as a catalyst, initiating the generation of hydroxyl radicals (HO•) crucial for this process, as depicted by eq 1.25 These hydroxyl radicals possess strong oxidative capabilities, efficiently facilitating the oxidation of organic dyes.
| 1 |
2.2. Analysis of Variance Technique
The statistical analysis of the data was conducted using SPSS software.26 Multifactor analysis of variance (ANOVA) was employed to determine the statistical significance of differences between data groups, with a significance level set at p ≤ 0.05. The influence of each factor on the degradation rate was evaluated based on the magnitude of the P-value. Specifically, the analysis concentrated on the individual effects of the three factors, with no consideration of their three-factor interaction.
2.3. Life Cycle Assessment
The LCA method offers a comprehensive approach to evaluate the environmental impact of products, utilizing metrics like energy payback time (EPBT) and greenhouse gas payback time (GPBT).27 These metrics rely on parameters such as global warming potential (GWP) and primary energy demand (PED) within the LCA framework. The efootprint software, utilizing data primarily sourced from the Ecoinvent database, facilitates online LCA analysis.
2.3.1. Life Cycle Inventory
The system implemented in this experiment is customized for textile mills, with all necessary equipment and materials manufactured in China. The system is designed to operate over a service life of 20 years, encompassing five distinct stages: production, transportation, construction, operation, and waste management. The system’s boundary conditions are illustrated in Figure 4. During the production phase, components including PV panels, batteries, inverters, current controllers, and air pumps are manufactured. Transportation primarily involves light diesel trucks for road transport, while construction activities are localized within the textile mill premises. In the operational phase, energy consumption primarily stems from the PV system. Waste generated during the system’s lifecycle is typically managed through methods such as adsorption or REDOX processes.
Figure 4.
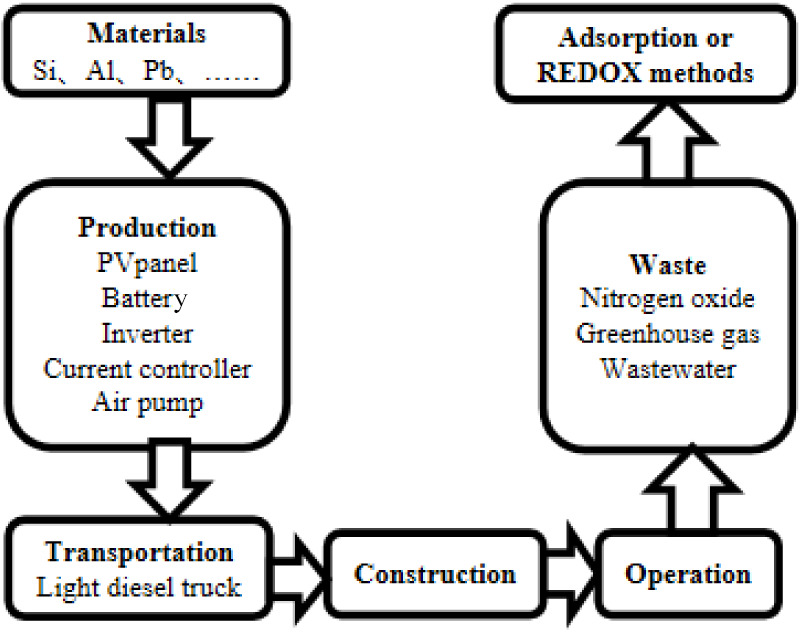
Boundary conditions of the system.
2.3.2. Environmental Impact Assessment
2.3.2.1. Energy Payback Time
EPBT signifies the duration in years that a PV system requires to generate sufficient energy throughout its lifecycle to offset the energy consumed during its production. The calculation formula for EPBT is expressed in eq 2:
| 2 |
where:
Einput is the primary energy demand (PED) of the PV component during its lifecycle (kW h),
EBOS is the energy required for the balance of system (BOS) (kW h),
Eoutput is the annual primary energy saved by the PV system through power generation (kW h).
2.3.2.2. Greenhouse Gas Payback Time
GPBT signifies the duration in years required for a PV system to mitigate carbon emissions over its lifecycle to offset the emissions associated with its production and operation. The calculation formula for GPBT is given by eq 3:
| 3 |
where:
GHGPV is the global warming potential (GWP) of the PV component during its lifecycle (kgCO2eq),
GHGBOS is the greenhouse gas emissions from the balance of system (BOS) (kgCO2eq),
GHGoutput is the annual primary energy saved by the PV system through power generation (kgCO2eq).
2.3.3. Life Cycle Cost
Life cycle cost (LCC) serves as a comprehensive metric for evaluating the economic aspects of a system, encompassing all expenses incurred from procurement through to decommissioning. LCC includes costs associated with procurement, transportation, installation, operation, maintenance, management, and decommissioning over the system’s lifecycle. The calculation method for LCC considers fixed costs, variable costs, maintenance and operation expenses, salvage value, and other pertinent factors specific to PV panels.28
3. Results and Discussion
3.1. The Experiment on the Degradation of Organic Dyes
The experimental setup in the controlled laboratory conditions was as follows: the temperature was maintained at 16 °C, using a 400 mL sample of pollutant solution with a concentration of 20 mg/L. Oxygen was supplied via an oxygen pump at a rate of 0.6 L/min, and Fe2+ was added to maintain a controlled concentration of 200 μmol/L. The absorbance of the solution was measured continuously. Samples were collected every minute following the initiation of current injection to calculate the degradation rate of pollutants.
The study investigated the degradation rates of three different organic dyes—acid orange 7 (AO7), methylene blue (MB), and malachite green (MG)—under varying conditions of organic dye type, current density, and pH. These dyes were chosen due to their diverse colors and chemical structures. The findings contribute to verifying the general applicability of the system for treating organic dye effluents in textile mills. Specifically, the output current was varied by 5 mA, 10 mA, and 15 mA, while pH conditions ranged from 2, 3, to 4.
3.1.1. Effect of the Type of Organic Dye
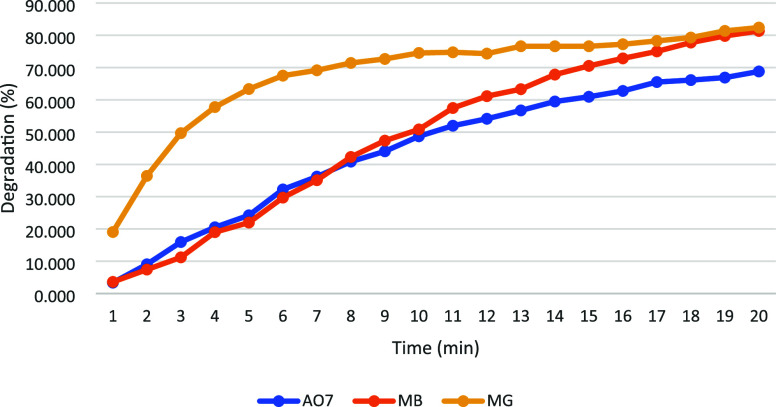
Various organic dyes are extensively used in textile factories, and their degradation efficiencies vary across different EF systems, which determines the suitability of PV-powered EF systems for treating textile factory wastewater. Therefore, AO7, MB, and MG organic dyes were selected for degradation under controlled conditions: pollutant concentration of 20 mg/L, current density set at 10 mA, and pH maintained at 3. The experimental results are illustrated in Figure 5.
Figure 5.
Comparison of degradation rate of three kinds of pollutants.
Effective degradation capabilities for all three pollutants were demonstrated by the system, with degradation rates exceeding 50% within 20 min. The highest degradation efficiency was exhibited by MG, achieving a maximum degradation rate of 82% within 20 min, closely followed by MB at 81%. In contrast, a lower degradation rate of only 69% was shown by AO7. This variation was attributed to the differing numbers of readily oxidizable functional groups in the molecular structures of the pollutants.
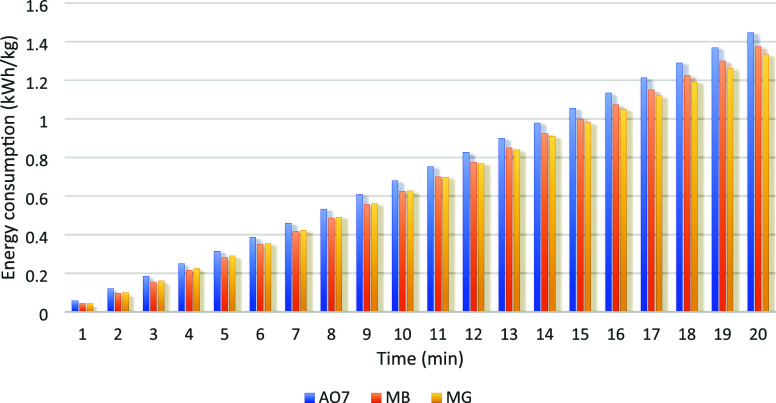
In Figure 6, the energy consumption during the degradation of the three pollutants through the EF process is illustrated. It is observed from the comparison that under identical experimental conditions, the energy consumption for AO7 degradation is the highest, followed by MB, while MG shows the lowest energy consumption. This difference is likely associated with the degradation rate, where faster degradation generally corresponds to lower energy consumption.
Figure 6.
Energy loss in the degradation process of three pollutants.
3.1.2. Effect of pH
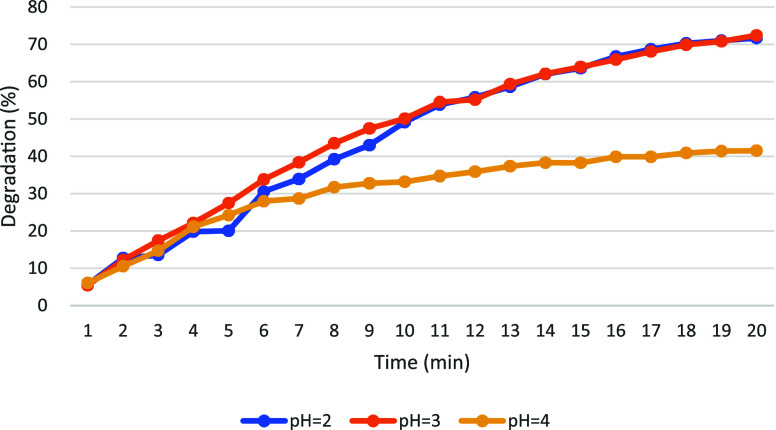
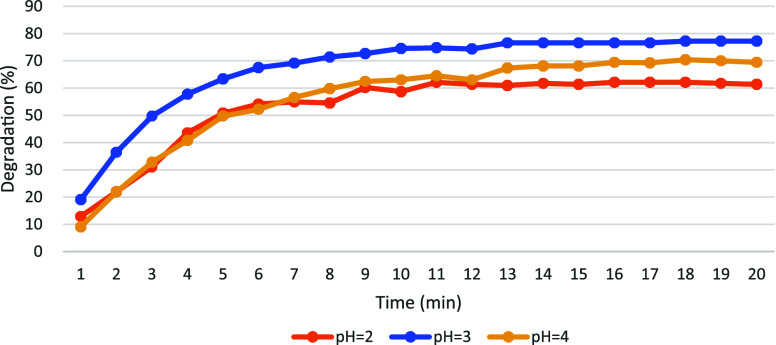
The efficiency of EF degradation is notably influenced by pH levels. The degradation rate of AO7 under pH conditions adjusted to 2, 3, and 4 is illustrated in Figure 7. Upon comparison of the degradation rates after 20 min across these pH conditions, it was observed that pH 3 yielded the highest degradation rate, approximately 72%. Furthermore, the degradation of pollutants remained consistently high throughout the experiment under pH 3 conditions. Thus, pH around 3 is identified as the optimal condition for EF-mediated removal of target pollutants.
Figure 7.
PH affects the degradation rate of AO7.
The degradation efficacy can be adversely impacted by a decrease in pH, possibly due to an excess of hydrogen ions. At low pH levels, the stability of H2O2 in solution is enhanced by the presence of hydronium ions (H3O2+).29 Simultaneously, hydrogen gas is produced through cathodic reduction, resulting in the reduction of hydroxyl radicals (HO•) production and thereby reducing oxidation efficiency.30 Conversely, a significant decline in degradation efficiency is brought about by increasing solution pH, likely attributable to the reduced availability of Fe2+ ions. As Fe2+ is oxidized to Fe3+ and precipitates at higher pH levels, the concentration of Fe2+ required for catalyzing the Fenton reaction is diminished.31
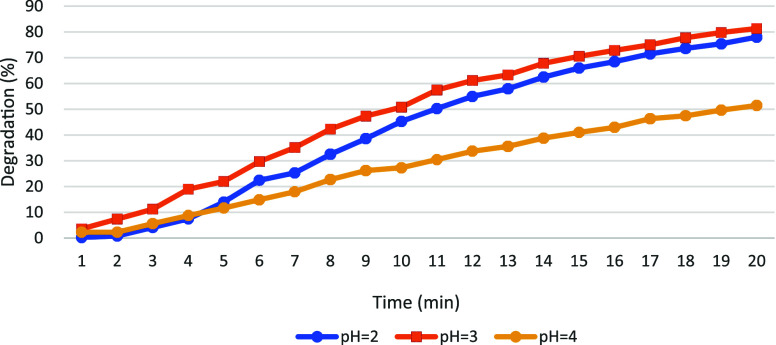
Under the same experimental conditions, MB and MG were selected as pollutants for further investigation, and the results are presented in Figures 8 and 9. The experimental outcomes for MB were found to be consistent with the previously drawn conclusions, confirming their alignment. After a certain duration, stabilization of the degradation rate curve for MG is observed, indicating sustained degradation of the pollutant without further rate increase. Specifically, stability is reached in approximately 10 min under pH = 3, around 11 min under pH = 2, and after about 13 min under pH = 4. These findings support the conclusion that stable degradation of pollutants is maintained under optimal pH conditions around 3. The experimental results corroborate the earlier conclusions regarding the effect of pH on pollutant degradation efficiency.
Figure 8.
PH affects the degradation rate of MB.
Figure 9.
PH affects the degradation rate of MG.
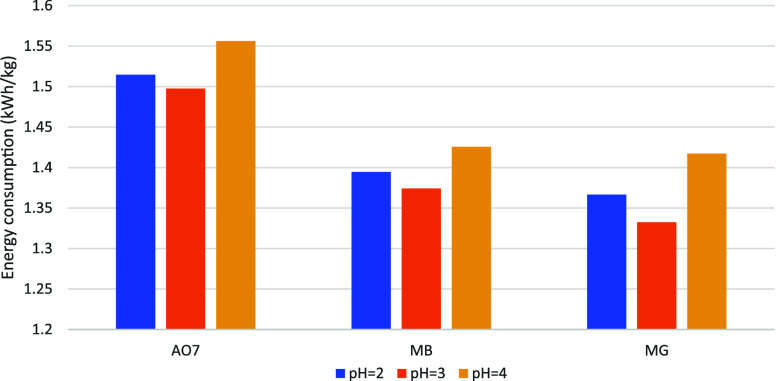
Figure 10 depicts the energy consumption associated with the degradation processes of AO7, MB, and MG by the EF system under pH conditions of 2, 3, and 4. It was observed that the lowest energy consumption for all three pollutants was recorded at pH 3. Additionally, considering that the degradation efficiencies of AO7, MB, and MG were highest at pH 3, a correlation between degradation rate and energy consumption is hypothesized. At higher degradation rates, the concentration of dyes in the solution is reduced, leading to a decrease in the consumption of HO• generated during the EF process. The accumulation of HO• is subsequently diminished, reducing their production rate and thereby lowering the overall power consumption of the current loop and energy consumption.
Figure 10.
PH affects the energy consumption of the three organic dyes.
3.1.3. Effect of Current Density
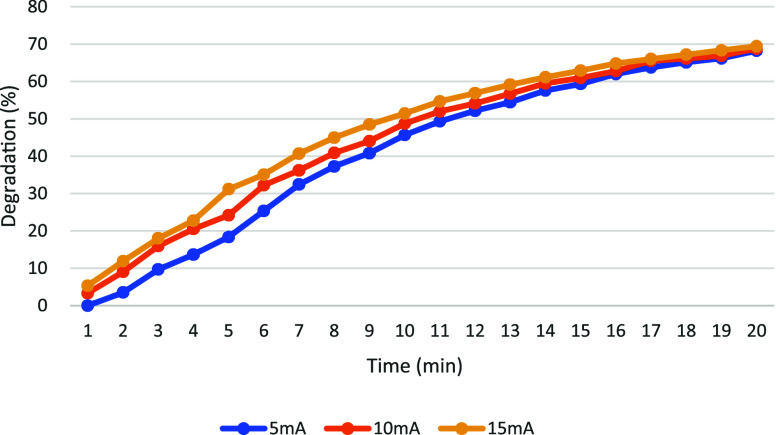
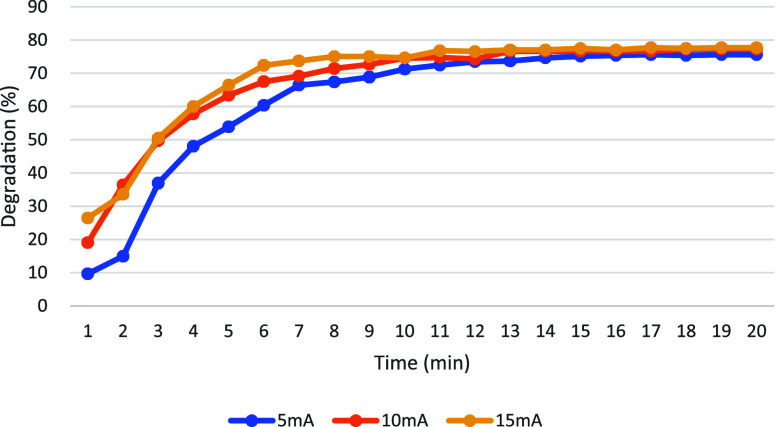
The efficiency of oxygen reduction in the EF system is influenced directly by the applied current. Figure 11 illustrates the degradation rates of acid AO7 under current densities of 5 mA, 10 mA, and 15 mA. After 20 min of treatment, AO7 was degraded to 67% at 5 mA, 68% at 10 mA, and 69% at 15 mA. Furthermore, an increase in the slope of the degradation curve was noted with higher current densities, indicating that the degradation rate was accelerated with increased current. It was observed that AO7 degradation is more effective at higher current densities. This phenomenon is attributed to the higher cathode-imposed potential at increased currents, which enhances the conversion of pumped oxygen to H2O2 and increases the production of HO• through electrolysis. The role played by these radicals in accelerating the oxidative degradation of pollutants is crucial.32
Figure 11.
Current density affects the degradation rate of AO7.
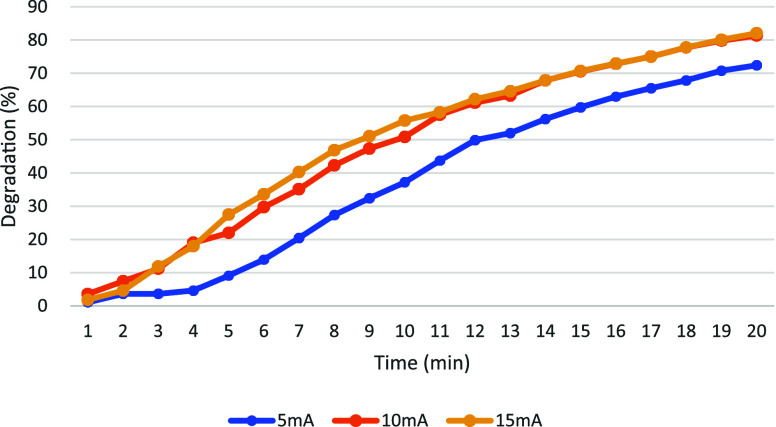
Figures 12 and 13 illustrate the degradation results of MB and MG under current densities of 5 mA, 10 mA, and 15 mA, respectively. For MB, an improvement in degradation efficiency was observed with increasing current density. Specifically, higher degradation rates were achieved at 15 mA compared to 10 mA and 5 mA conditions. Under different current conditions, the degradation rate of MG is stabilized over time: approximately 14 min at 5 mA, 13 min at 10 mA, and only 11 min at 15 mA. A positive correlation between degradation efficiency and higher current densities is confirmed by this observation. The beneficial impact of higher currents in enhancing the effectiveness of both MB and MG degradation in the EF system is underscored by these findings.
Figure 12.
Current density affects the degradation rate of MB.
Figure 13.
Current density affects the degradation rate of MG.
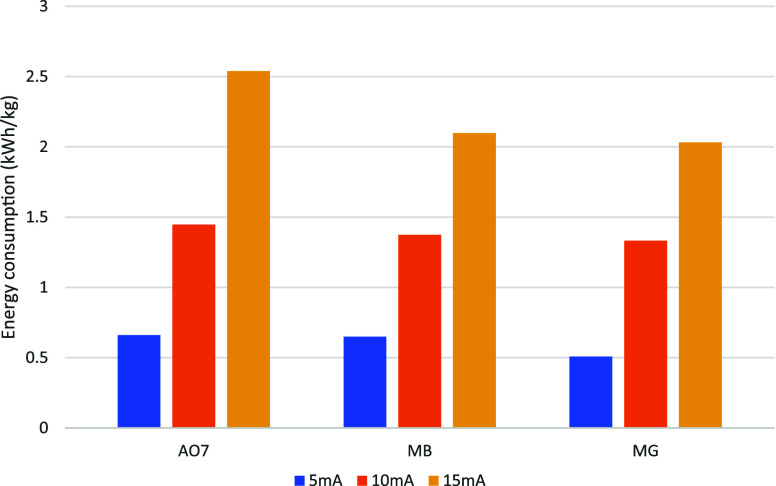
Figure 14 depicts the energy loss associated with the degradation processes of AO7, MB, and MG under the current density conditions of 5 mA, 10 mA, and 15 mA. Throughout the EF process system, increased power consumption is caused by higher current densities, which accelerate reaction rates and induce higher potential differences. The generation of more HO• is driven by this heightened potential difference, and an excess of these radicals accumulates in the solution, resulting in additional energy consumption.
Figure 14.
Current density affects the energy consumption of the three organic dyes.
3.1.4. Analysis of Variance
The results of multifactor ANOVA were summarized in Table 1 based on the analysis of experimental data. It was found that degradation rates are significantly influenced by the type of organic dyes, pH, and current density. Among the factors analyzed, the most substantial impact on degradation rates was exerted by the type of organic dyes, followed by current density. The effect of pH, however, was observed to be comparatively less significant.
Table 1. ANOVA Results of Degradation Rate.
| Factor | Degrees of Freedom | Sum of Squares | Mean Square | F-Value | P-Value | |
|---|---|---|---|---|---|---|
| organic dye types | 2 | 0.029761 | 0.014880 | 232.58 | <0.0001 | significant |
| pH | 2 | 0.005415 | 0.002707 | 8.46 | 0.0260 | significant |
| current density | 2 | 0.016293 | 0.008146 | 24.27 | 0.0017 | significant |
3.2. The Life Cycle Assessment of the PV-Powered EF System
In this section, the LCA of the PV-powered EF system is presented. Initially, the system was applied for wastewater treatment at a textile mill located in Chengdu. The environmental impact of the system was comprehensively analyzed, followed by an evaluation of its cost-effectiveness and economics. Subsequently, comparisons were made between the energy consumption and carbon emissions of the PV-powered EF system and those of conventional Fenton and EF processes to highlight its energy-saving advantages.
3.2.1. The LCA of the System in a Textile Mill
The feasibility of the PV-powered EF system was assessed by selecting a textile mill in Chengdu as the study site. Each day 15,000 m3 of textile wastewater containing organic dyes is processed at this mill. The existing deep treatment process is replaced by the PV-powered EF system to enhance the degradation of organic dyes during wastewater treatment. A PV capacity of 4.5 MWp has been installed at the textile mill, meeting the energy requirements for operating the system. The electricity generated by the PV system is used to power EF system components such as agitators and air pumps, reducing dependence on the municipal grid.
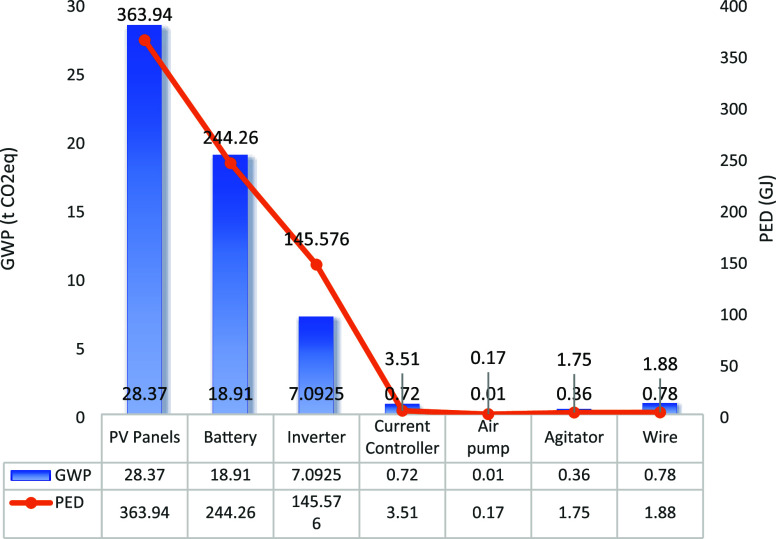
Figure 15 depicts the GWP and PED of each component in the PV-powered EF system utilized for wastewater treatment at the textile mill. The total PED of the system amounts to 7.61 × 10⁵ MJ, with 3.64 × 10⁵ MJ attributed to PV panels (47.8% of the total). The GWP of the system is 56.24 tCO2eq, with PV panels contributing 28.37 tCO2eqs (50.4% of the total). Batteries and inverters also exert significant influence on the environmental assessment of the entire system.
Figure 15.
Environmental impact assessment of each component of the system used in a textile mill.
3.2.2. Environmental Influence
Eqs 2 and 3 were used to calculate the EPBT and GPBT for the entire PV-powered EF system at the textile mill. Throughout its life cycle, the total PED of the system amounts to 7.61 × 10⁵ MJ, which translates to 2.11 × 10⁵ kW h. The total GWP of the system is computed as 56.24 tCO2eq. Annually, 22.15 MW h of electricity is generated by the PV power generation system installed at the textile plant, resulting in a reduction of approximately 12.63 tons of CO2 emissions per year. The system’s EPBT is calculated to be 9.53 years, with a GPBT of 4.45 years, both falling within the 20-year system design life, indicating feasible energy recovery and carbon emission reduction over the entire life cycle.
3.2.3. Life Cycle Cost of the System in a Textile Mill
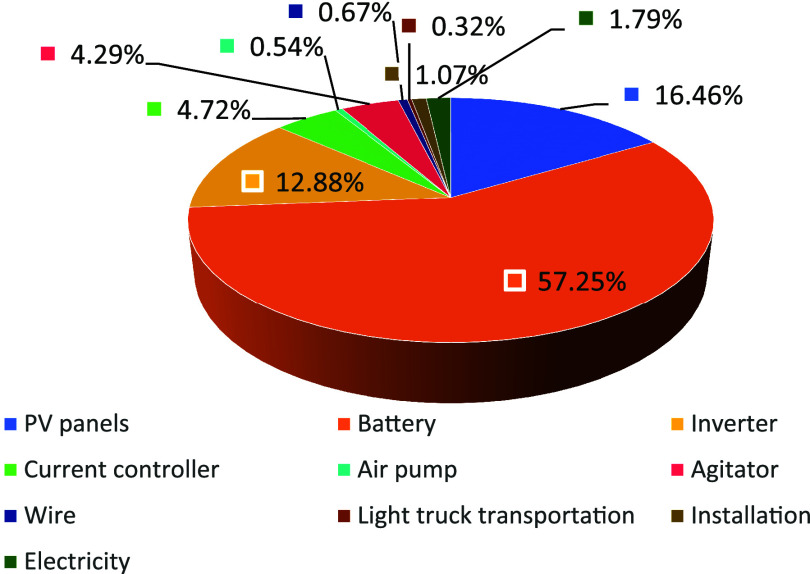
The calculated investment costs for equipping the textile mill with the PV-powered EF system are presented in Table 2. The LCC of the system in the textile mill amounts to 1.9 × 10⁵ RMB. Figure 16 illustrates the cost distribution among various components of the system. The majority of the total expenditure is constituted by the acquisition costs of PV panels, batteries, inverters, and current controllers. Importantly, the overall cost structure is significantly influenced by the high market prices of batteries, inverters, and PV panels. Therefore, to enhance economic efficiency, thorough comparisons should be conducted during equipment procurement. Consideration should be given to selecting batteries, inverters, and PV panels based on their pricing and their ability to meet operational requirements.
Table 2. Cost of Investment in the EF Powered by PV System.
| Item | Unit Price | Quantity | Total Price (RMB) |
|---|---|---|---|
| PV panels | 0.1 yuan/W | 260 kW | 2.6 × 10⁴ |
| battery | 3680 yuan/piece | 30 pieces | 1.1 × 10⁵ |
| inverter | 808 yuan/piece | 30 pieces | 2.4 × 10⁴ |
| current controller | 1900 yuan/piece | 4 pieces | 7.6 × 10³ |
| air pump | 14 yuan/piece | 40 pieces | 5.6 × 10² |
| agitator | 3500 yuan/piece | 2 pieces | 7 × 10³ |
| wire | 0.94 yuan/m | 1000 m | 9.4 × 10² |
| light truck transportation | 0.1 yuan/(t·km) | 1500 t·km | 1.5 × 10² |
| installation | 57 yuan/m2 | 260 m2 | 1.5 × 10⁴ |
| electricity | 0.63 yuan/kW h | 404 kWh | 2.5 × 10³ |
| sum | 1.9 × 10⁵ |
Figure 16.
Percentage of cost for each piece of equipment.
The annual electricity generation from the PV system applied to the wastewater treatment system of this textile mill amounts to 22.15 MW h. If this electricity had been sourced from the city’s grid, it would have incurred a cost of 1.4 × 10⁴ RMB annually. Based on this comparison, the LCC of the PV-powered EF system applied to the textile mill can be recovered within 13.57 years.
It is indicated by this calculation that beyond 13.57 years of service life, the economic benefits of implementing the PV-powered EF system will surpass those of the conventional EF system. The long-term economic viability and financial advantages associated with adopting renewable energy solutions for wastewater treatment in industrial settings are underscored.
3.2.4. Advantages of the System
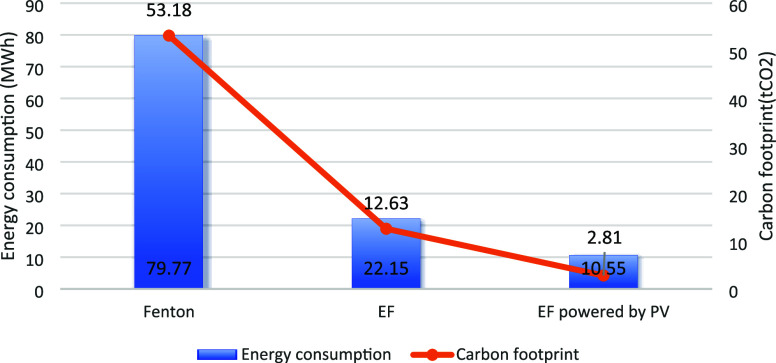
If the target textile mill were to adopt the Fenton process, annual consumption of H2O2 would amount to 26.59 tons. The average production and storage energy consumption per ton of H2O2 is 3 MW h, resulting in a carbon footprint of approximately 2 tons. The total energy consumption for this process reaches 79.77 MW h, with a corresponding carbon footprint of 53.18 tons. Alternatively, using the EF process would entail an annual electricity consumption of about 22.15 MW h, leading to emissions equivalent to 12.63 tons of CO2.
In contrast, if the PV-powered EF system constructed in this study were adopted, the energy consumption for the target textile mill would be reduced to 10.55 MWh. This represents an 87% reduction compared to the Fenton method and a 52% reduction compared to the EF method. In terms of carbon emissions, the system would emit only 2.81 tons of CO2, marking a 95% reduction compared to the Fenton method and a 78% reduction compared to the EF method. Figure 17 compares the LCA results of the three systems, highlighting the substantial environmental benefits and efficiency gains of the PV-powered EF system over traditional Fenton and EF methods.
Figure 17.
Comparison of energy consumption and carbon footprint of the three systems.
The energy consumption of the EF process is primarily influenced by the energy used in the production, installation, and operational electricity requirements of its equipment. In contrast, significantly more energy is required for the production and storage of Fenton reagents in the traditional Fenton process compared to the EF process. As a result, substantial advantages in terms of energy efficiency and reduced carbon emissions are provided by the EF process.
In this paper, the energy supply structure is transformed by integrating PV modules that harness solar energy, a renewable resource, to replace the reliance on the urban grid for powering the EF process. This transition resulted in a reduction in urban grid power consumption, particularly in terms of carbon emissions. Significant CO2 emissions are typically produced by urban power generation, whereas the clean characteristics of solar energy led to a marked decrease in the carbon footprint of the system compared to both the Fenton and EF processes.
4. Conclusion
The development of a PV-powered EF system for the degradation of organic dyes in wastewater treatment is presented in this paper. A significant advancement in achieving energy-efficient solutions for deep wastewater treatment processes is represented by the system. Through LCA, the system’s environmental benefits and economic feasibility are evaluated. Several advantages are offered by implementing the PV-powered EF system in textile mills. Reliance on the grid and conventional energy sources is reduced, leading to anticipated savings in energy costs and improvements in overall economic efficiency. By leveraging solar energy, a renewable resource, lower carbon emissions are contributed by the system compared to traditional wastewater treatment methods.
-
1
A PV-powered EF degradation system for organic dyes was constructed. The system integrates a PV system with an EF system, designed to enhance the deep treatment process of textile mill wastewater and achieve efficient degradation of organic dyes, accompanied by significant economic benefits. Furthermore, the system demonstrates notable energy-saving advantages in terms of reduced energy consumption and carbon emissions.
-
2
The degradation rate and energy consumption of various organic dyes under different operational conditions were systematically investigated to validate the system’s efficacy in textile mill wastewater treatment. Notably, the degradation efficiencies for AO7, MB, and MG reached 82%, 81%, and 69%, respectively, within a 20 min time frame. Optimal experimental conditions were identified at pH = 3 and the highest current density of 15 mA. Additionally, there exists an inverse relationship between energy consumption and degradation rate magnitude. Statistical analysis using ANOVA confirmed significant effects of pollutant type, pH, and current density on the system’s degradation rate.
-
3
This paper conducted an LCA of the PV-powered EF system applied to wastewater treatment in textile mills. The EPBT for the system installed in a Chengdu textile mill was estimated at 9.53 years, with a GPBT of 4.45 years. The LCC was calculated at 1.9 × 10⁵ RMB, ensuring energy recovery over the system’s service life. Furthermore, comparing the LCA results with traditional Fenton and EF processes, the PV-powered EF system demonstrated an 87% reduction in energy consumption compared to Fenton and a 52% reduction compared to EF. Carbon emissions were similarly reduced by 95% compared to Fenton and 78% compared to EF, highlighting its substantial energy-saving advantages.
Areas for improvement in this study are still noted, which also point to directions for future research. (1) Three specific organic dyes in the wastewater treatment system of textile mills were focused on, without consideration of potential interactions among various dyes commonly found in actual textile mill effluents. Future research could explore the mixed conditions of different dyes to better reflect real-world scenarios. (2) The LCA conducted in this study relied solely on statistical data, lacking error analysis that could affect result accuracy. Future studies should incorporate error analysis to account for uncertainties and enhance the robustness of LCA findings.
Acknowledgments
This research has been funded by the Sichuan Science and Technology Program, China (2023YFG0256), the China Construction Eighth Engineering Division (21H1149), and the Sichuan University Creative Research Project (2023SCUH0087).
Supporting Information Available
The Supporting Information is available free of charge at https://pubs.acs.org/doi/10.1021/acsomega.4c03397.
The life cycle inventory and relevant parameters of the main instruments and materials of the experiment (PDF)
The authors declare no competing financial interest.
Supplementary Material
References
- Zhang L.; Gu Q.; Li C.; Huang Y. Characteristics and Spatial-Temporal Differences of Urban “Production, Living and Ecological” Environmental Quality in China. Int. J. Environ. Res. Public Health 2022, 19 (22), 15320. 10.3390/ijerph192215320. [DOI] [PMC free article] [PubMed] [Google Scholar]
- Cao Y.; Kong L.; Ouyang Z. Characteristics and Driving Mechanism of Regional Ecosystem Assets Change in the Process of Rapid Urbanization—A Case Study of the Beijing–Tianjin–Hebei Urban Agglomeration. Remote Sens. (Basel) 2022, 14 (22), 5747. 10.3390/rs14225747. [DOI] [Google Scholar]
- Wu J.; Zhang Q.; Guo C.; Li Q.; Hu Y.; Jiang X.; Zhao Y.; Wang J.; Zhao Q. Effects of Aeration on Pollution Load and Greenhouse Gas Emissions from Agricultural Drainage Ditches. Water (Basel) 2022, 14 (22), 3783. 10.3390/w14223783. [DOI] [Google Scholar]
- Moiseenko T. I. Surface Water under Growing Anthropogenic Loads: From Global Perspectives to Regional Implications. Water (Basel) 2022, 14 (22), 3730. 10.3390/w14223730. [DOI] [Google Scholar]
- Zhang W.; Liu Y.; Du L. Sol-Gel Preparation of Photocatalytic Sm2Ti2O7/HZSM-5 Composite on Degradation of Reactive Brilliant Red X-3B. Mater. Sci. 2018, 24 (3), 307–311. 10.5755/j01.ms.24.3.18853. [DOI] [Google Scholar]
- Abdelhameed R. M.; Emam H. E. Modulation of metal organic framework hybrid cotton for efficient sweeping of dyes and pesticides from wastewater. Sustainable Mater. Technol. 2022, 31, e00366 10.1016/j.susmat.2021.e00366. [DOI] [Google Scholar]
- Roa K.; Oyarce E.; Boulett A.; ALSamman M.; Oyarzún D.; Pizarro G. D. C.; Sánchez J. Lignocellulose-Based Materials and Their Application in the Removal of Dyes from Water: A Review. Sustainable Mater. Technol. 2021, 29, e00320 10.1016/j.susmat.2021.e00320. [DOI] [Google Scholar]
- de Oliveira Cruz F. S.; Nascimento M. A.; Puiatti G. A.; de Oliveira A. F.; Mounteer A. H.; Lopes R. P. Textile Effluent Treatment Using a Fixed Bed Reactor Using Bimetallic Fe/Ni Nanoparticles Supported on Chitosan Spheres. J. Environ. Chem. Eng. 2020, 8 (5), 104133. 10.1016/j.jece.2020.104133. [DOI] [Google Scholar]
- Salimi M.; Salar Balou S.; Kohansal K.; Babaei K.; Tavasoli A.; Andache M. Optimizing the Preparation of Meso- and Microporous Canola Stalk-Derived Hydrothermal Carbon via Response Surface Methodology for Methylene Blue Removal. Energy Fuels 2017, 31 (11), 12327–12338. 10.1021/acs.energyfuels.7b02440. [DOI] [Google Scholar]
- Kumar P.; Prasad B.; Mishra I. M.; Chand S. Treatment of Composite Wastewater of a Cotton Textile Mill by Thermolysis and Coagulation. J. Hazard. Mater. 2008, 151 (2–3), 770–779. 10.1016/j.jhazmat.2007.06.052. [DOI] [PubMed] [Google Scholar]
- Can O. T.; Kobya M.; Demirbas E.; Bayramoglu M. Treatment of the Textile Wastewater by Combined Electrocoagulation. Chemosphere 2006, 62 (2), 181–187. 10.1016/j.chemosphere.2005.05.022. [DOI] [PubMed] [Google Scholar]
- Wan W.; Zhang Y.; Ji R.; Wang B.; He F. Metal Foam-Based Fenton-like Process by Aeration. ACS Omega 2017, 2 (9), 6104–6111. 10.1021/acsomega.7b00977. [DOI] [PMC free article] [PubMed] [Google Scholar]
- Divyapriya G.; Nidheesh P. V. Importance of Graphene in the Electro-Fenton Process. ACS Omega 2020, 5 (10), 4725–4732. 10.1021/acsomega.9b04201. [DOI] [PMC free article] [PubMed] [Google Scholar]
- Elias B.; Guihard L.; Nicolas S.; Fourcade F.; Amrane A. Effect of Electro-Fenton Application on Azo Dyes Biodegradability. Environ. Prog. Sustainable Energy 2011, 30 (2), 160–167. 10.1002/ep.10457. [DOI] [Google Scholar]
- Zhang S.; Pang X.; Yue Z.; Zhou Y.; Duan H.; Shen W.; Li J.; Liu Y.; Cheng Q. Sulfonamides Removed from Simulated Livestock and Poultry Breeding Wastewater Using an In-Situ Electro-Fenton Process Powered by Photovoltaic Energy. Chem. Eng. J. 2020, 397, 125466. 10.1016/j.cej.2020.125466. [DOI] [Google Scholar]
- Berl E. A New Cathodic Process for the Production of H2O2. Trans. Electrochem. Soc. 1939, 76 (1), 359. 10.1149/1.3500291. [DOI] [Google Scholar]
- Berhe R. N.; Kassahun S. K.; Kang J. W.; Lee I.; Verma M.; Kim H. Performance Evaluation of Fe3O4@ACF-Supported Bio-Electro Fenton System for Simultaneous Sewage Treatment and Methyl Orange Degradation. Mater. Today Commun. 2023, 35, 106331. 10.1016/j.mtcomm.2023.106331. [DOI] [Google Scholar]
- Gao G.; Zhang Q.; Hao Z.; Vecitis C. D. Carbon Nanotube Membrane Stack for Flow-through Sequential Regenerative Electro-Fenton. Environ. Sci. Technol. 2015, 49 (4), 2375–2383. 10.1021/es505679e. [DOI] [PubMed] [Google Scholar]
- Shen W.; Tian Z.; Zhao L.; Qian F. Life Cycle Assessment and Multiobjective Optimization for Steam Cracking Process in Ethylene Plant. ACS Omega 2022, 7 (18), 15507–15517. 10.1021/acsomega.2c00189. [DOI] [PMC free article] [PubMed] [Google Scholar]
- Estévez S.; Angelucci D. M.; Moreira M. T.; Tomei M. C. Techno-Environmental and Economic Assessment of Color Removal Strategies from Textile Wastewater. Sci. Total Environ. 2024, 913, 169721. 10.1016/j.scitotenv.2023.169721. [DOI] [PubMed] [Google Scholar]
- Grisales C. M.; Salazar L. M.; Garcia D. P. Treatment of Synthetic Dye Baths by Fenton Processes: Evaluation of Their Environmental Footprint through Life Cycle Assessment. Environ. Sci. Pollut. Res. Int. 2018, 26, 4300–4311. 10.1007/s11356-018-2757-9. [DOI] [PubMed] [Google Scholar]
- Zhang D.; Hu S.; Cao Z.; Cao H.; Zhao Y.; Zhao H. Reuse of Sludge Waste in Electro-Fenton: Performance and Life Cycle Assessment. Resour., Conserv. Recycl. 2022, 185, 106475. 10.1016/j.resconrec.2022.106475. [DOI] [Google Scholar]
- Magdy M.; Alalm M. G.; El-Etriby H. K. Comparative Life Cycle Assessment of Five Chemical Methods for Removal of Phenol and Its Transformation Products. J. Cleaner Prod. 2021, 291, 125923. 10.1016/j.jclepro.2021.125923. [DOI] [Google Scholar]
- King D. L.; Boyson W. E.; Kratochvil J. A.. Photovoltaic Array Performance Model; Sandia National Laboratories, 2004. [Google Scholar]
- Wang X.; Xu C.; Zhu Y.; Zhou C.; Yang Y.; Miao J.; Zhou W.; Shao Z. The Recent Progress of Cathode Materials for Heterogeneous Electro-Fenton Reactions. Surf. Interfaces 2024, 44, 103820. 10.1016/j.surfin.2023.103820. [DOI] [Google Scholar]
- Rasweefali M. K.; Sabu S.; Sunooj K. V.; Sasidharan A.; Xavier K. A. M. Consequences of Chemical Deacetylation on Physicochemical, Structural and Functional Characteristics of Chitosan Extracted from Deep-Sea Mud Shrimp. Carbohydr. Polym. Technol. Appl. 2021, 2, 100032. 10.1016/j.carpta.2020.100032. [DOI] [Google Scholar]
- Peng J.; Lu L.; Yang H. Review on Life Cycle Assessment of Energy Payback and Greenhouse Gas Emission of Solar Photovoltaic Systems. Renewable Sustainable Energy Rev. 2013, 19, 255–274. 10.1016/j.rser.2012.11.035. [DOI] [Google Scholar]
- Singh D.; Singh S.; Yadav A. K.; Khan O.; Dewangan A.; Alkahtani M. Q.; Islam S. From Theory to Practice: A Sustainable Solution to Water Scarcity by Using a Hybrid Solar Distiller with a Heat Exchanger and Aluminum Oxide Nanoparticles. ACS Omega 2023, 8 (37), 33543–33553. 10.1021/acsomega.3c03283. [DOI] [PMC free article] [PubMed] [Google Scholar]
- Zhou M.; Yu Q.; Lei L.; Barton G. Electro-Fenton Method for the Removal of Methyl Red in an Efficient Electrochemical System. Sep. Purif. Technol. 2007, 57 (2), 380–387. 10.1016/j.seppur.2007.04.021. [DOI] [Google Scholar]
- Ting W.-P.; Lu M.-C.; Huang Y.-H. Kinetics of 2,6-Dimethylaniline Degradation by Electro-Fenton Process. J. Hazard. Mater. 2009, 161 (2–3), 1484–1490. 10.1016/j.jhazmat.2008.04.119. [DOI] [PubMed] [Google Scholar]
- Solozhenko E. G.; Soboleva N. M.; Goncharuk V. Decolorization of Azo Dye Solutions by Fenton Oxidation. Water Res. 1995, 29 (9), 2206–2210. 10.1016/0043-1354(95)00042-J. [DOI] [Google Scholar]
- Luo H.; Li C.; Wu C.; Dong X. In Situ Electrosynthesis of Hydrogen Peroxide with an Improved Gas Diffusion Cathode by Rolling Carbon Black and PTFE. RSC Adv. 2015, 5 (80), 65227–65235. 10.1039/C5RA09636G. [DOI] [Google Scholar]
Associated Data
This section collects any data citations, data availability statements, or supplementary materials included in this article.


