

Abstract

Nonvesicular lipid trafficking pathways are an important process in every domain of life. The mechanisms of these processes are poorly understood in part due to the difficulty in kinetic characterization. One important class of glycolipids, lipopolysaccharides (LPS), are the primary lipidic component of the outer membrane of Gram-negative bacteria. LPS are synthesized in the inner membrane and then trafficked to the cell surface by the lipopolysaccharide transport proteins, LptB2FGCADE. By characterizing the interaction of a fluorescent probe and LPS, we establish a quantitative assay to monitor the flux of LPS between proteoliposomes on the time scale of seconds. We then incorporate photocaged ATP into this system, which allows for light-based control of the initiation of LPS transport. This control allows us to measure the initial rate of LPS transport (3.0 min–1 per LptDE). We also find that the rate of LPS transport by the Lpt complex is independent of the structure of LPS. In contrast, we find the rate of LPS transport is dependent on the proper function of the LptDE complex. Mutants of the outer membrane Lpt components, LptDE, that cause defective LPS assembly in live cells display attenuated transport rates and slower ATP hydrolysis compared to wild type proteins. Analysis of these mutants reveals that the rates of ATP hydrolysis and LPS transport are correlated such that 1.2 ± 0.2 ATP are hydrolyzed for each LPS transported. This correlation suggests a model where the outer membrane components ensure the coupling of ATP hydrolysis and LPS transport by stabilizing a transport-active state of the Lpt bridge.
Introduction
The proper biogenesis of membranes is essential for life.1 Disruption of this process is proposed to underlie a broad range of diseases.2 Membrane biogenesis requires the coordination of the rates of lipid synthesis and transport at rates to allow membrane expansion during cell growth and division.3,4 Substantial work to track the transport of bulk lipids via vesicles has established that specific protein–protein interactions promote the expansion of the target membrane by the fusion of vesicles.5−10 In this process the roles of the proteins are to target the vesicles to the correct organellar membrane and to lower the barrier to the mixing of membranes. However, a growing number of lipid transport processes have now been discovered where vesicle trafficking does not occur.11−20 In many of these processes, lipid transport is proposed to occur over a continuous protein bridge. These protein bridges would serve as conduits to facilitate the transport of individual lipids, building a membrane block by block. Currently the best studied of these protein bridges is the lipid transporter that facilitates transport of lipopolysaccharides from the inner to the outer membrane in Gram-negative bacteria (Figure 1). Here we report the initial rate of lipopolysaccharide transport between membranes; this is the first kinetics characterization of intermembrane lipid transport mediated by a protein bridge.
Figure 1.

LPS structure (left) and schematic depicting LPS transport in vivo (right). Seven lipopolysaccharide transport proteins, LptB2FGCADE, form a transenvelope bridge to move LPS from the inner membrane to the cell surface upon ATP binding and hydrolysis.
Lipopolysaccharide (LPS, Figure 1) is a unique component of the outer membrane (OM) of Gram-negative bacteria.21,22 These organisms contain two membrane bilayers where the inner membrane (IM) is composed of phospholipids and the OM is an asymmetric bilayer with the inner leaflet containing phospholipids and the fatty acyl chains of LPS comprising the outer leaflet.23−25 The biosynthesis of LPS does not occur at the OM. Therefore, after its biosynthesis, LPS must be extracted from the IM and trafficked across the aqueous periplasm and assembled on the outer leaflet of the outer membrane.23,26 Around 2 million LPS are transported to the cell surface of Escherichia coli in the 20–30 min between divisions.27 Once assembled LPS provides a barrier to the entry of both hydrophobic and hydrophilic molecules, which in part provides Gram-negative bacteria an innate resistance to antibiotics.28−33 While the importance of LPS was known for decades, it took until the 2000s before the components of the protein bridge responsible for LPS transport, LptB2FGCADE, were discovered (Figure 1).11,19,34−39 The IM components of the LPS transporter, LptB2FGC, bind and hydrolyze cytoplasmic ATP to power the extraction of LPS from the IM into the periplasm.40−42 In the periplasm, LptC binds to the LptADE complex forming a hydrophobic groove (LptFCAD) to allow LPS to traverse the periplasm.40,43,44 The LptDE complex translocates LPS from the periplasmic bridge across the OM assembling it onto the cell surface.45
In order to study the function of the Lpt complex, it can be reconstituted into proteoliposomes from pure components (Figure 2A).19,46,47 The transport of LPS from the IM proteoliposome into the interior leaflet of the OM proteoliposome by the Lpt complex mimics the transport process in cells.46 The encapsulation of a dansylated polymyxin B derivative (dansyl-PMBN) that increases in fluorescence when complexed with LPS allows for the detection of LPS transport from one membrane to another.46,48 Herein we develop a system capable monitoring the flux of LPS between proteoliposomes at the resolution of seconds by detecting changes in dansyl-PMBN fluorescence. This has allowed us to interrogate how the rate of LPS transport depends on individual components of the Lpt complex.
Figure 2.

Continuous fluorescence assay to monitor the flux of LPS through Lpt transporter. (A) Assay design using IM and OM proteoliposomes. Protein complexes and LPS are drawn to highlight the productive orientation. Proteins are incorporated in both directions in liposomes and LPS would be distributed across both leaflets of the IM proteoliposome. Dansyl-PMBN (right) binds LPS once it is translocated into OM proteoliposomes. (B) The fluorescence spectra (λexc = 365 nm) of dansyl-PMBN added to OM proteoliposomes in the presence or absence LPS. (C) Normalized relative QY of dansyl-PMBN with OM proteoliposomes at increasing amounts of LPS. (D) Experimental fluorescence intensity at 510 nm over time normalized to laser-shot power and initial fluorescence intensity in the presence and absence of ATP. (E) LPS transported in OM proteoliposomes. Each data point is the average of 10 consecutive measurements taken 2 s apart.
Materials and Methods
Purification of Enzymes and Reconstitution into Proteoliposomes
Wild type (WT) E. coli LptB2FGC (Uniprot IDs: P0A9V1, P0AF98, P0ADC6, P0ADV9), LptA (Uniprot ID: P0ADV1), and LptDE (Uniprot IDs: P31554, P0ADC1) were expressed and purified from the E. coli strains reported in Table S1 transformed with plasmids reported in Table S2. Methods were as previously reported with minor modifications as detailed in the Supporting Information.19,46,49 LptE mutants were generated by site-directed mutagenesis using a Q5 Site Directed Mutagenesis Kit (NEB) and primers as listed in Table S3. Mutant LptDE complexes were purified in the same way as WT. Purity for all complexes were assessed by SDS-PAGE followed by protein staining (Figures S1–S3).
Proteoliposomes containing LptB2FGC and LPS or LptDE were prepared as previously reported.19,46 Of note, the LPS was added so that the final concentration in all assays was 100 μM, as based on reported work by Xie et al.(46) Detailed methodology and methods used to assess liposome quality are described in the Supporting Information.
Steady State Fluorescence Measurements
Steady state fluorescence measurements were conducted using an Ocean Optics QEPRO-FL spectrometer equipped with a 365 nm fiber coupled LED. Emission was collected at a 90° angle relative to the excitation source with a 400 nm long pass filter (Thorlabs, Newton, NJ, USA) placed between the cuvette holder and detector. For steady state fluorescence measurements, a 100 ms integration time and 5 averages were used. Steady state fluorimetry measurements were conducted in a Starna Cell 45 μL Fluorimeter Sub-Micro quartz cuvette (Atascadero, CA, USA). The relative fluorescence quantum yield (QY) for dansyl-PMBN in the presence of phospholipids and LPS were determined by titrating increasing amounts of dansyl-PMBN into solutions containing proteoliposomes in the presence and absence of LPS. Detailed considerations for steady state measurements are provided in the Supporting Information.
Time-Resolved Emission Detection of LPS Transport
Time-dependent emission of dansyl-PMBN was monitored on a custom-built nanosecond pulsed laser system. A pump pulse (∼8 ns pulse width) at 355 nm is provided by the third harmonic of a 10 Hz Nd:YAG laser (Spectra Physics, Milpitas, CA) and the shot power was attenuated to 0.5 mJ/shot to minimize sample photobleaching. Excitation and emission from the sample were collected from the same face of the cuvette to maximize emission signal. Emission from the sample was focused through a 450 nm long-pass filter (Thorlabs, Newton, NJ), a monochromator set to 510 nm and detected by a photomultiplier tube (PMT) (Hamamatsu, Shizuoka, Japan) biased at −1 kV. The output of the photomultiplier tube was analyzed and recorded by a 1 GHz oscilloscope (WaveSurfer 4104HD, Teledyne LeCroy). Recording by the oscilloscope is initiated by a photodiode detector (Thorlabs) triggered by a portion of the pump beam, which was split off by a beam sampler placed before the sample, and the output of the photodiode detector is simultaneously recorded by the oscilloscope for laser power normalizations. A shutter (Thorlabs) was placed between the laser and the samples to afford the ability to broadly adjust the sampling time to values greater than 100 ms by adjusting the shutter open and close time.
Measurements collected on the PMT and photodiode were collected and analyzed using MatLab. The code is available on GitHub (https://github.com/SroweKahne/Nava-Rowe-LPS-Transport.git) alongside raw data. In brief, there are three functions that convert the raw data from the oscilloscope into Matlab matrices, process the data to boxcar average 10 measurements together and then normalize the data to the initial intensity and intensity of the light excitation. Detailed descriptions of both the laser setup and data processing are described in the Supporting Information.
Measurement of LPS Transport
Sample reactions were prepared according to the following general specifications. Prepared IM and OM proteoliposomes in 20 mM Tris HCl, 150 mM NaCl (1× TBS) and 10% glycerol were mixed at a 1:1 v:v ratio, each accounting for 45% of the volume of the final solution (90% together). These liposomes were allowed to equilibrate for 10 min. At this point, a mixture of MgCl2, ATP or NPE-ATP, glutathione, and potassium phosphate in 1× TBS + 10% glycerol was added to the sample, mixed, transferred to cuvette and either immediately measured (ATP, roughly 50 s after addition) or allowed to incubate for 10 min to allow for diffusion of the initiation buffer (NPE-ATP). The final volume for each reaction was 15 μL with the following concentrations: 20 mM Tris HCl (pH 8.0), 150 mM NaCl, 10% glycerol, 345 nM LptADE, 150 nM LptB2FGC, 100 μM LPS, 11.1 μM encapsulated dansyl-PMBN, 2 mM MgCl2, 2 mM ATP/NPE-ATP, 2 mM glutathione, and 4 mM HK2PO4. Samples were mixed gently by pipet and then degassed by sonication for 10 s. After degassing, samples were transferred to a Starna Cell 10 μL Fluorimeter Sub-Micro quartz cuvette (16.10F-Q-10, Atascadero, CA, USA) for measurement by the laser system. Detailed methodology, reasoning, and data are supplied in the Supporting Information.
Assaying ATPase Activity
ATPase reactions of proteoliposomes were performed in 20 mM Tris–HCl (pH 8.0), 150 mM NaCl, and 10% glycerol with 360 nM LptB2FGC (45% v/v), 100 μM LPS, and 760 nM LptADE (45% v/v) initiated by addition of initiation buffer. After addition of initiation buffer, reactions contained 2 mM MgCl2 and 0 or 2 mM ATP. Proteoliposomes were mixed and allowed to incubate at 30 °C for 10 min. Reactions were initiated at 30 °C by the addition of preheated initiation buffer containing different components dependent on experiment. ATPase activity was monitored by the production of phosphate. The production of phosphate was monitored by using a modified malachite green–molybdate assay.50−52 Details regarding individual ATPase experiments can be found in the Supporting Information.
Results and Discussion
Dansyl-PMBN displays unique fluorescence signals that allow LPS transport to be monitored quantitatively. Previous work by ourselves and others has shown dansyl-PMBN is an effective probe to detect LPS.48,53 By incorporating LptB2FGC and LPS or LptADE into proteoliposomes (referred to as IM and OM proteoliposomes respectively), it had been shown that LPS transport can be qualitatively detected by dansyl-PMBN.46 We found that dansyl-PMBN interacts with phospholipids to produce a fluorescent band with an emission maximum at 530 nm (Figures S4–S6). This allowed us to now directly measure the concentration of dansyl-PMBN encapsulated in OM proteoliposomes (Figures S7). This peak emission wavelength shifts to 510 nm upon the addition of LPS with a concomitant increase in the fluorescence QY (Figure 2B). The fluorescence increase maximizes at a ratio of 1 LPS to 1 dansyl-PMBN in our system (Figures 2C, S8–S10, Table S4). Since we can measure the amount of dansyl-PMBN encapsulated in OM proteoliposomes, we can measure the concentration of dansyl-PMBN in complex with LPS by measuring the increase in fluorescence at 510 nm, providing a quantitative readout of LPS concentration.
Rapid sampling of dansyl-PMBN fluorescence allows for continuous detection of LPS transport. Based on our previous results,46 LPS transport in the reconstituted system begins within 10 min of the initiation of ATP hydrolysis indicating the potential for a lag phase. In that work, a lag phase was observed which could have resulted from discontinuous measurements on individual systems, slow ATP diffusion across the IM proteoliposome, or a phenomenon intrinsic to the transport process. To resolve the first of these issues and interrogate the initial steps of LPS transport, the system we design here permits a proteoliposome sample to be excited every 100 ms by a laser; furthermore, the addition of a shutter in the path of the laser allows us to adjust the time between sample excitations (Figure S11). Figure 2D plots the normalized fluorescence intensity of Lpt-bridged proteoliposome samples in the presence and absence of ATP (added exogenously before measurement). To control for variability introduced by all components in the system, each data point is the average of 10 consecutive excitations spaced 2 s apart (Figures S12–S14). In the absence of ATP, where no LPS transport can occur, the fluorescent signal decreases rapidly due to photobleaching of dansyl-PMBN. However, in the presence of ATP, the fluorescent signal decreases more slowly. In this sample, the photobleaching of the probe is compensated by signal arising from the binding of dansyl-PMBN to LPS that is transported to the OM proteoliposome. By subtracting the signal obtained in the absence of ATP from that in the presence of ATP we can determine the increase in fluorescence QY at every time point that is due to the formation of the dansyl-PMBN:LPS complex (Figures S15–S18). Comparing the measured increase to the maximum possible increase yields the amount of LPS transported over time (Figures 2E, S19). LPS transport begins within the first minute after ATP addition and the fluorescence signal continues to increase until 20 min, after which there is no longer any detectable change due to the saturation of the dansyl-PMBN probe.
Given that ATP hydrolysis is required for LPS transport, we wanted to correlate fluorescence measurements with ATP hydrolysis. We note that previous efforts to measure LPS transport in vitro demonstrated similar ATP dependent transport of LPS by IM proteoliposomes.19,47 These previous efforts relied on long reaction times to measure ATP hydrolysis rates and ensure that ATP had diffused across the leaky IM liposome membrane. To measure the formation of small amounts of inorganic phosphate produced by ATP hydrolysis during the first minutes, we adapted a malachite green and molybdate assay to work in the presence of phospholipids (Figures S20–S22).50−52 We found that ATP hydrolysis in our reconstitution begins within the first 30 s after the addition of ATP and remains linear over 20 min. One explanation for this is that LptB2FGC that is in a nonproductive orientation in the liposome (i.e., LptB external) can immediately hydrolyze ATP and only after ATP has diffused across the leaky LPS containing membrane may LPS transport begin. We note that our initial transport measurements were unable to resolve the corresponding first minute of LPS transport due to limitations in simultaneously introducing ATP to begin LPS transport and probing dansyl-PMBN.
To overcome this shortcoming, we employ “caged ATP” to allow LPS transport to be photoinitiated after caged ATP diffusion. The [1-(2-nitrophenyl)ethyl (NPE)] group conjugated to ATP may be photocleaved at a rate of 105 s–1 and a QY of ∼50% upon 355 nm photolysis (Figure 3A).54−57 The byproducts of NPE-ATP photolysis in the presence of glutathione did not affect ATP hydrolysis by LptB2FGC (Figures S23–S25). Omission of light excitation to photolyze NPE-ATP resulted in no detectable production of inorganic phosphate. Thus, we can incubate NPE-ATP with IM proteoliposomes prior to the initiation of ATP hydrolysis allowing for it to diffuse across the proteoliposome membrane. Since LPS transport requires ATP hydrolysis, the phototriggered release of ATP allows LPS transport to be initiated simultaneously with the detection of fluorescence. LPS transport begins promptly upon photodecaging of ATP (Figures 3B, S26) and increases monotonically over 5 min (Figures 3C, S27). To calculate the initial rate from this data we assume that every LptDE complex is oriented in a productive conformation and is engaged in LPS transport giving a concentration of active complexes equivalent to the amount of LptDE in solution. Given the concentration of LptDE is 0.345 μM and the rate of LPS transport is 1.0 ± 0.3 μM/min, we find that the initial rate of LPS transport is 3.0 ± 1.1 min–1 per LptDE.
Figure 3.
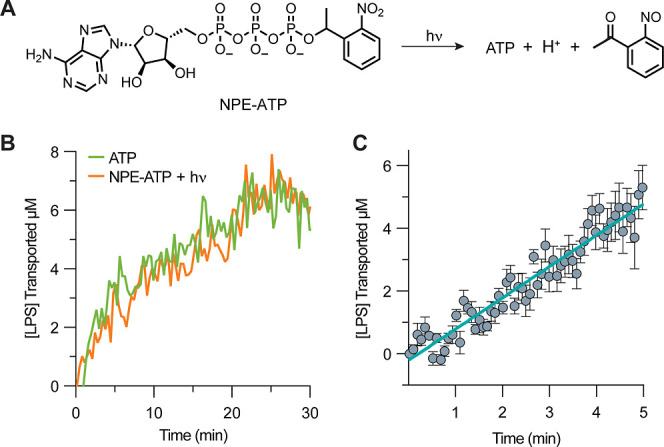
Photolysis of adenosine 5′-triphosphate, P3-(1-(2-nitro-phenyl)ethyl) ester (NPE-ATP) allows for temporal control of LPS transport. (A) Decaging photoreaction of NPE-ATP is a photolyzable precursor to ATP. (B) Lpt complex transport of LPS using either ATP (purple) or photolyzed NPE-ATP (orange). (C) Determination of initial rate of LPS transport. Error bars indicate the average of 5 technical replicates, where each time point is the average of 10 consecutive measurements taken 500 ms apart.
Recent work has suggested that about 500 LPS are assembled on the cell surface per min per Lpt bridge.58 These calculations were based on the estimated number of LPS on the cell surface, the maximum number of Lpt bridges possible (given the copy number of each component), and the dynamics of Lpt bridges in vivo.27,58,59 Our measured in vitro rate is 2 orders of magnitude slower than this estimated in vivo rate. This discrepancy is in part explained by the assumptions made about the efficiency and number of bridges in our system compared to the cell. We have assumed the number of bridges based on the number of LptDE; however, we know this assumption will overestimate the number of bridges because LptDE complexes are distributed in both directions in liposomes and not every LptDE will be bridged during measurement. These assumptions would thus lead to an underestimation of the rate of LPS transport in our assay relative to functioning Lpt bridges in cells. Beyond these technical limitations, other factors in the cell that are not accounted for in this reconstitution may also contribute to a faster rate of LPS transport. Notable differences include the cell wall which is sandwiched between the IM and OM in vivo, that the IM and OM are a defined distance apart in cells, the differences in architecture and composition of both the IM and OM, and other possible cellular factors that could influence activity. Assembly of bridges is also likely to be more efficient than our artificial reconstitution. Thus, it seems reasonable that a membrane-to-membrane reconstitution of LPS transport might only be 1% efficient compared to the cellular system.
The rate of transport does not depend on the structure of LPS. LPSs are glycolipids containing a conserved Lipid A moiety (which embeds LPS into the OM), a relatively conserved oligosaccharide core, and a highly variable O-antigen composed of up to hundreds of sugars.60−62 It has been previously shown that Lpt complex can transport LPS containing only Lipid A in vivo(63) and in vitro;46 however, strains that lack the core oligosaccharide have increased OM instability and are more susceptible to antibiotics.64 To test whether these phenotypes reflect a defect in LPS transport, we incorporated three LPS variants with different core oligosaccharide structures into our reconstitution (Figures 4A, S28)61,62,65,66 Because the structure of LPS can alter the spectrum of the LPS:dansyl-PMBN complex,48,53 we determined the relative QY for each LPS:dansyl-PMBN complex at 510 nm (Figures S29, S30, Table S5). There were no significant differences in the initial rates of transport for the different LPS structures (Figures 4B, S31, S32). Thus, the rate of transport by the Lpt complex is independent of the core oligosaccharide structure. This is consistent with the fact that the Lpt complex in vivo must transport the many different LPS structures that compose the OM.61 We did observe that there is less variance in the transport rate of Lipid A (3.0 ± 0.3 min–1 per LptDE) than either Rd2 LPS or Ra LPS (3.2 ± 0.9 min–1 per LptDE and 3.0 ± 1.1 min–1 per LptDE, respectively) (Figure 4C). The transport of LPS is known to be sensitive to the concentration of LPS46 and LPS is known to have lateral interactions between core oligosaccharides that encourage aggregation.67 It has previously been reported for Ra LPS that a range of 62.5 to 125 μM optimize LPS transport over long time frames, with higher and lower concentrations reducing the rate of transport.46 This implies that it is the effective concentration of monomeric LPS available to the transporter that affects transport rate rather than bulk. It thus seems reasonable that the variability of LPS transport rates will increase when there are more possible lateral interactions between LPS, which would more readily change the effective concentration of monomeric LPS.
Figure 4.

LPS transport rates are independent of LPS core oligosaccharide structure. (A) Structures of LPS variants used in this study. Abbreviations used: KDO = 3-deoxy-d-manno-octulosonic acid, Hep = Heptose, PPEtN = diphosphorylethanloamine, P = phosphate, Gal = galactose, Glc = glucose, GlcNAc = N-acetylglucosamine. (B) Lpt complex mediated transport of different LPS variants. (C) Average transport rates and standard deviation for LPS variants.
We explored whether the in vitro assay had the fidelity to detect changes in the function of the components of the Lpt transporter. LptD (a beta-barrel) and LptE (a lipoprotein “plug”) facilitate the movement of LPS off the periplasmic components of the Lpt bridge and into the OM.68,69 Lpt complexes containing two mutations in LptE (R91D and K136D) are known to increase the permeability of cells to antibiotics, affect the ability of LptE to bind LPS,70 and alter the transport of LPS in vitro.46 Given that the in vivo experiments previously published were in strains with LPS similar in size to Ra LPS, thus we tested the ability of LptE mutants to transport Ra LPS. Utilizing the same assumptions as before, we find that a single point mutation in LptEK136D (1.7 ± 0.6 min–1 per LptDE) slows the rate of transport and a double mutant, LptER91D,K136D (0.8 ± 0.6 min–1 per LptDE), has barely detectable levels of transport (Figures 5A, S33, S34). Notably, only the double mutant displays defective OM assembly phenotypes70 which is consistent with only the double mutant having a significant reduction in transport rates (Figure 5B). We therefore conclude that the rate of LPS insertion in vivo must be above a certain threshold to allow for proper assembly of the OM or else the cell is permeable.
Figure 5.

Mutations in LptE attenuate both Ra LPS transport and ATP hydrolysis. (A) Ra LPS transport of LptE mutants. (B) Average Ra LPS transport rates and standard deviation for LptE mutants. (C) ATP hydrolysis rates of LptE mutants. (D) Comparison of Ra LPS transport (B) and ATP hydrolysis rates (C).
Because ATP binding and hydrolysis are required for LPS transport, we measured the ATP hydrolysis rates for these mutants during LPS transport. The double mutant LptER91D,K136D (12.2 ± 0.4 min–1 per LptB2FGC) statistically significantly slows the rate of ATP hydrolysis compared to LptEWT (14.9 ± 0.8 min–1 per LptB2FGC); the single mutant LptEK136D has a rate (13.7 ± 1.3 min–1 per LptB2FGC) an intermediate rate of ATP hydrolysis relative to either LptEWT or LptR91D,K136D(Figures 5C, S35). It is remarkable that changing two amino acids in the OM LptADE translocon affects ATP hydrolysis rates in the IM proteoliposome. The simplest model for how LptADE coordinates LPS transport and ATP hydrolysis is that ATPase activity depends on the presence of the Lpt bridge. As previously shown, proteoliposomes containing LptB2FGC and LptADE spontaneously form bridges in vitro in the absence of an energy source.19,49 Notably, these bridges do not engender the fusion of liposomes.19 Because the mutants in LptADE cannot perturb ATP hydrolysis by direct interaction with LptB, conformational changes in the OM translocon resulting from mutations in LptE are likely transmitted to LptB through LptA, LptC, and LptFG. For a system lacking LptA (and thereby unable to transport LPS) we measure a rate of ATP hydrolysis of 11.2 ± 1.1 min–1 per LptB2FGC (Figure S36) which agrees well with rates obtained by other methods.42 Strikingly, linearly plotting the rate of LPS transport vs rate of ATP hydrolysis estimates a hydrolysis rate of 11.3 ± 0.6 min–1 per LptB2FGC when the LPS transport rate is set to 0 (Figure 5D). Given this, it is apparent that the presence of the LptADE translocon increases ATP hydrolysis above the basal level in a manner concomitant with LPS transport and that the extent of this increase depends on proper translocon function. The slope of the regression line thus yields an estimate of the energetic cost for transporting LPS of 1.2 ± 0.2 ATP hydrolyzed per LPS transported. Therefore, if we assume that transport of each LPS in vivo along the Lpt bridge requires the consumption of about 1 ATP, each LPS bridge in vivo would consume an estimated 500 ATP min–1. This rate is similar to the rate of the paradigmatic ATPase ClpXP which is known to consume 600 ATP min–1 when it translocates its substrate.71
Conclusions
One model for how LptE can couple ATP hydrolysis rates and LPS transport rates is by stabilizing a transport-active state of the Lpt bridge which has an increased ATP hydrolysis rate. We recently reported that the presence of LPS within the IM LptB2FGC complex lowers the barrier to bridge formation in vivo,58 potentially by facilitating key interactions between protein components.49,72 Given that the mutations in LptE reduce its affinity for LPS70 and these mutations slow LPS transport, a simple explanation would be that the LptE mutants stabilize the bridge in a transport-inactive state with LPS unable to translocate and ATP hydrolysis at the IM attenuated. What we do not yet know is where LPS has stalled in the process of transport and why mutations in LptE influence the normal function of the transporter in this way. Further research into where LPS stalls in these bridges and the structure of an actively transporting Lpt bridge will help us understand the role of LptE in LPS transport.
The strategies detailed here could be adapted to study other transenvelope lipid transporters or the processes that transport other membrane components. Recently, we showed how previous assays that report on qualitative measures of LPS transport were instrumental in identifying the mechanism of a drug that targets the IM LptB2FGC.73 In this case, the drug was identified by a high-throughput screen looking for bactericidal activity in cells.74 Our reconstitution and observations reported herein lay the groundwork for pathway directed discovery of small molecules that interfere with LPS transport by interfering with any of the functions of the Lpt transporter.
Acknowledgments
This work acknowledges Dr. Ran Xie for preliminary studies on the feasibility of decaging experiments. This work acknowledges Dr. Yangzhong Qin and Dr. Bryan Kudisch for their helpful discussions regarding optical experiments and separately Dr. Vadim Baidin and Bailey Plaman for their help with ATP hydrolysis experiments. We are honored to have this work appear in the issue "A Tribute to Christopher T. Walsh". Chris Walsh was an original and is irreplaceable. We miss him.
Supporting Information Available
The Supporting Information is available free of charge at https://pubs.acs.org/doi/10.1021/acs.biochem.4c00379.
Detailed methodology, reasoning, and data (PDF)
Author Present Address
‡ Department of Chemistry and Biochemistry, University of California at Los Angeles, Los Angeles, CA 90095, United States
Author Contributions
† M.N. and S.J.R. contributed equally.
This work was supported by AFOSR FA9550-19-1-0246 and NIH GM047274 (D.G.N.) and NIH AI149778 (D.K.).
The authors declare no competing financial interest.
Special Issue
Published as part of Biochemistry special issue “A Tribute to Christopher T. Walsh”.
Supplementary Material
References
- Rothfield L. I.Biological membranes: An overview at the molecular level. In Structure and Function of Biological Membranes; Academic Press, 1971; pp 3–9. [Google Scholar]
- Yarwood R.; Hellicar J.; Woodman P. G.; Lowe M. Membrane trafficking in health and disease. Dis. Models Mech. 2020, 13, dmm043448. 10.1242/dmm.043448. [DOI] [PMC free article] [PubMed] [Google Scholar]
- De Weer P. A century of thinking about cell membranes. Annu. Rev. Physiol. 2000, 62, 919–926. 10.1146/annurev.physiol.62.1.919. [DOI] [PubMed] [Google Scholar]
- Lundstedt E.; Kahne D.; Ruiz N. Assembly and maintenance of lipids at the bacterial outer membrane. Chem. Rev. 2021, 121, 5098–5123. 10.1021/acs.chemrev.0c00587. [DOI] [PMC free article] [PubMed] [Google Scholar]
- Rothman J. E.; Wieland F. T. Protein sorting by transport vesicles. Science 1996, 272, 227–234. 10.1126/science.272.5259.227. [DOI] [PubMed] [Google Scholar]
- Idevall-Hagren O.; De Camilli P. Detection and manipulation of phosphoinositides. Biochim. Biophys. 2015, 1851, 736–745. 10.1016/j.bbalip.2014.12.008. [DOI] [PMC free article] [PubMed] [Google Scholar]
- Karatekin E.; Di Giovanni J.; Iborra C.; Coleman J.; O’Shaughnessy B.; Seagar M.; Rothman J. E. A fast, single-vesicle fusion assay mimics physiological SNARE requirements. Proc. Natl. Acad. Sci. U.S.A. 2010, 107, 3517–3521. 10.1073/pnas.0914723107. [DOI] [PMC free article] [PubMed] [Google Scholar]
- Nordlund G.; Brzezinski P.; von Ballmoos C. SNARE-fusion mediated insertion of membrane proteins into native and artificial membranes. Nat. Commun. 2014, 5, 4303. 10.1038/ncomms5303. [DOI] [PubMed] [Google Scholar]
- Ghanbarpour A.; Valverde D. P.; Melia T. J.; Reinisch K. M. A model for a partnership of lipid transfer proteins and scramblases in membrane expansion and organelle biogenesis. Proc. Natl. Acad. Sci. U.S.A. 2021, 118, e2101562118 10.1073/pnas.2101562118. [DOI] [PMC free article] [PubMed] [Google Scholar]
- Valverde D. P.; Yu S.; Boggavarapu V.; Kumar N.; Lees J. A.; Walz T.; Reinisch K. M.; Melia T. J. ATG2 transports lipids to promote autophagosome biogenesis. J. Cell Biol. 2019, 218, 1787–1798. 10.1083/jcb.201811139. [DOI] [PMC free article] [PubMed] [Google Scholar]
- Chng S. S.; Gronenberg L. S.; Kahne D. Proteins required for lipopolysaccharide assembly in Escherichia coli form a transenvelope complex. Biochemistry 2010, 49, 4565–4567. 10.1021/bi100493e. [DOI] [PMC free article] [PubMed] [Google Scholar]
- Mesmin B. Mitochondrial lipid transport and biosynthesis: A complex balance. J. Cell Biol. 2016, 214, 9–11. 10.1083/jcb.201606069. [DOI] [PMC free article] [PubMed] [Google Scholar]
- Mejia E. M.; Nguyen H.; Hatch G. M. Mammalian cardiolipin biosynthesis. Chem. Phys. Lipids 2014, 179, 11–16. 10.1016/j.chemphyslip.2013.10.001. [DOI] [PubMed] [Google Scholar]
- Posor Y.; Jang W.; Haucke V. Phosphoinositides as membrane organizers. Nat. Rev. Mol. Cell Biol. 2022, 23, 797–816. 10.1038/s41580-022-00490-x. [DOI] [PMC free article] [PubMed] [Google Scholar]
- Romanauska A.; Köhler A. The inner nuclear membrane is a metabolically active territory that generates nuclear lipid droplets. Cell 2018, 174, 700–715.e18. 10.1016/j.cell.2018.05.047. [DOI] [PMC free article] [PubMed] [Google Scholar]
- Deng B.; Shen W. J.; Dong D.; Azhar S.; Kraemer F. B. Plasma membrane cholesterol trafficking in steroidogenesis. FASEB J. 2019, 33, 1389–1400. 10.1096/fj.201800697RRR. [DOI] [PMC free article] [PubMed] [Google Scholar]
- Gault C. R.; Obeid L. M.; Hannun Y. A. An overview of sphingolipid metabolism: from synthesis to breakdown. Adv. Exp. Med. Biol. 2010, 688, 1–23. 10.1007/978-1-4419-6741-1_1. [DOI] [PMC free article] [PubMed] [Google Scholar]
- Giacometti S. I.; MacRae M. R.; Dancel-Manning K.; Bhabha G.; Ekiert D. C. Lipid transport across bacterial membranes. Annu. Rev. Cell Dev. Biol. 2022, 38, 125–153. 10.1146/annurev-cellbio-120420-022914. [DOI] [PubMed] [Google Scholar]
- Sherman D. J.; Xie R.; Taylor R. J.; George A. H.; Okuda S.; Foster P. J.; Needleman D. J.; Kahne D. Lipopolysaccharide is transported to the cell surface by a membrane-to-membrane protein bridge. Science 2018, 359, 798–801. 10.1126/science.aar1886. [DOI] [PMC free article] [PubMed] [Google Scholar]
- Kumar S.; Ruiz N. Bacterial AsmA-like proteins: bridging the gap in intermembrane phospholipid transport. Contact 2023, 6, 25152564231185931. 10.1177/25152564231185931. [DOI] [PMC free article] [PubMed] [Google Scholar]
- Miura T.; Mizushima S. Separation by density gradient centrifugation of two types of membranes from spheroplast membrane of Escherichia coli K12. Biochim. Biophys. Acta 1968, 150, 159–161. 10.1016/0005-2736(68)90020-5. [DOI] [PubMed] [Google Scholar]
- Glauert A. M.; Thornley M. J. The topography of the bacterial cell wall. Annu. Rev. Microbiol. 1969, 23, 159–198. 10.1146/annurev.mi.23.100169.001111. [DOI] [PubMed] [Google Scholar]
- Muhlradt P. F.; Golecki J. R. Asymmetrical distribution and artifactual reorientation of lipopolysaccharide in the outer membrane bilayer of Salmonella typhimurium. Eur. J. Biochem. 1975, 51, 343–352. 10.1111/j.1432-1033.1975.tb03934.x. [DOI] [PubMed] [Google Scholar]
- Kamio Y.; Nikaido H. Outer membrane of Salmonella typhimurium: Accessibility of phospholipid head groups to phospholipase c and cyanogen bromide activated dextran in the external medium. Biochemistry 1976, 15, 2561–2570. 10.1021/bi00657a012. [DOI] [PubMed] [Google Scholar]
- Osborn M. J.; Gander J. E.; Parisi E.; Carson J. Mechanism of assembly of the outer membrane of Salmonella typhimurium. J. Biol. Chem. 1972, 247, 3962–3972. 10.1016/S0021-9258(19)45127-2. [DOI] [PubMed] [Google Scholar]
- Mühlradt P. F.; Menzel J.; Golecki J. R.; Speth V. Outer membrane of Salmonella: sites of export of newly synthesised lipopolysaccharide on the bacterial surface. Eur. J. Biochem. 1973, 35, 471–481. 10.1111/j.1432-1033.1973.tb02861.x. [DOI] [PubMed] [Google Scholar]
- Lima S.; Guo M. S.; Chaba R.; Gross C. A.; Sauer R. T. Dual molecular signals mediate the bacterial response to outer-membrane stress. Science 2013, 340, 837–841. 10.1126/science.1235358. [DOI] [PMC free article] [PubMed] [Google Scholar]
- Breijyeh Z.; Jubeh B.; Karaman R. Resistance of Gram-negative bacteria to current antibacterial agents and approaches to resolve it. Molecules 2020, 25, 1340. 10.3390/molecules25061340. [DOI] [PMC free article] [PubMed] [Google Scholar]
- Wu K. J. Y.; Tresco B. I. C.; Ramkissoon A.; Aleksandrova E. V.; Syroegin E. A.; See D. N. Y.; Liow P.; Dittemore G. A.; Yu M.; Testolin G.; Mitcheltree M. J.; Liu R. Y.; Svetlov M. S.; Polikanov Y. S.; Myers A. G. An antibiotic preorganized for ribosomal binding overcomes antimicrobial resistance. Science 2024, 383, 721–726. 10.1126/science.adk8013. [DOI] [PMC free article] [PubMed] [Google Scholar]
- Zgurskaya H. I.; Rybenkov V. V. Permeability barriers of gram-negative pathogens. Ann. N.Y. Acad. Sci. 2020, 1459, 5–18. 10.1111/nyas.14134. [DOI] [PMC free article] [PubMed] [Google Scholar]
- Andersson D. I.; Hughes D. Antibiotic resistance and its cost: Is it possible to reverse resistance?. Nat. Rev. Microbiol. 2010, 8, 260–271. 10.1038/nrmicro2319. [DOI] [PubMed] [Google Scholar]
- Prasad N. K.; Seiple I. B.; Cirz R. T.; Rosenberg O. S. Leaks in the pipeline: A failure analysis of gram-negative antibiotic development from 2010 to 2020. Antimicrob. Agents Chemother. 2022, 66, e0005422 10.1128/aac.00054-22. [DOI] [PMC free article] [PubMed] [Google Scholar]
- Nikaido H. Molecular basis of bacterial outer membrane permeability revisited. Microbiol. Mol. Biol. Rev. 2003, 67, 593–656. 10.1128/MMBR.67.4.593-656.2003. [DOI] [PMC free article] [PubMed] [Google Scholar]
- Braun M.; Silhavy T. J. Imp/OstA is required for cell envelope biogenesis in Escherichia coli. Mol. Microbiol. 2002, 45, 1289–1302. 10.1046/j.1365-2958.2002.03091.x. [DOI] [PubMed] [Google Scholar]
- Bos M. P.; Tefsen B.; Geurtsen J.; Tommassen J. Identification of an outer membrane protein required for the transport of lipopolysaccharide to the bacterial cell surface. Proc. Natl. Acad. Sci. U.S.A. 2004, 101, 9417–9422. 10.1073/pnas.0402340101. [DOI] [PMC free article] [PubMed] [Google Scholar]
- Sperandeo P.; Pozzi C.; Deho G.; Polissi A. Non-essential KDO biosynthesis and new essential cell envelope biogenesis genes in the Escherichia coli yrbG-yhbG locus. Res. Microbiol. 2006, 157, 547–558. 10.1016/j.resmic.2005.11.014. [DOI] [PubMed] [Google Scholar]
- Wu T.; McCandlish A. C.; Gronenberg L. S.; Chng S. S.; Silhavy T. J.; Kahne D. Identification of a protein complex that assembles lipopolysaccharide in the outer membrane of Escherichia coli. Proc. Natl. Acad. Sci. U.S.A. 2006, 103, 11754–11759. 10.1073/pnas.0604744103. [DOI] [PMC free article] [PubMed] [Google Scholar]
- Ruiz N.; Gronenberg L. S.; Kahne D.; Silhavy T. J. Identification of two inner-membrane proteins required for the transport of lipopolysaccharide to the outer membrane of Escherichia coli. Proc. Natl. Acad. Sci. U.S.A. 2008, 105, 5537–5542. 10.1073/pnas.0801196105. [DOI] [PMC free article] [PubMed] [Google Scholar]
- Ruiz N.; Kahne D.; Silhavy T. J. Transport of lipopolysaccharide across the cell envelope: The long road of discovery. Nat. Rev. Microbiol. 2009, 7, 677–683. 10.1038/nrmicro2184. [DOI] [PMC free article] [PubMed] [Google Scholar]
- Narita S.; Tokuda H. Biochemical characterization of an ABC transporter LptBFGC complex required for the outer membrane sorting of lipopolysaccharides. FEBS Lett. 2009, 583, 2160–2164. 10.1016/j.febslet.2009.05.051. [DOI] [PubMed] [Google Scholar]
- Okuda S.; Freinkman E.; Kahne D. Cytoplasmic ATP hydrolysis powers transport of lipopolysaccharide across the periplasm in E. coli. Science 2012, 338, 1214–1217. 10.1126/science.1228984. [DOI] [PMC free article] [PubMed] [Google Scholar]
- Cina N. P.; Frank D. W.; Klug C. S. Residues within the LptC transmembrane helix are critical for Escherichia coli LptB2FGC ATPase regulation. Protein Sci. 2024, 33, e4879 10.1002/pro.4879. [DOI] [PMC free article] [PubMed] [Google Scholar]
- Schultz K. M.; Feix J. B.; Klug C. S. Disruption of LptA oligomerization and affinity of the LptA-LptC interaction. Protein Sci. 2013, 22, 1639–1645. 10.1002/pro.2369. [DOI] [PMC free article] [PubMed] [Google Scholar]
- Schultz K. M.; Schneider J. R.; Fischer M. A.; Cina N. P.; Riegert M. O.; Frank D. W.; Klug C. S. Binding and transport of LPS occurs through the coordinated combination of an array of sites across the entire Escherichia coli LPS transport protein LptA. Protein Sci. 2023, 32, e4724 10.1002/pro.4724. [DOI] [PMC free article] [PubMed] [Google Scholar]
- Chng S. S.; Ruiz N.; Chimalakonda G.; Silhavy T. J.; Kahne D. Characterization of the two-protein complex in Escherichia coli responsible for lipopolysaccharide assembly at the outer membrane. Proc. Natl. Acad. Sci. U.S.A. 2010, 107, 5363–5368. 10.1073/pnas.0912872107. [DOI] [PMC free article] [PubMed] [Google Scholar]
- Xie R.; Taylor R. J.; Kahne D. Outer membrane translocon communicates with inner membrane ATPase to stop lipopolysaccharide transport. J. Am. Chem. Soc. 2018, 140, 12691–12694. 10.1021/jacs.8b07656. [DOI] [PMC free article] [PubMed] [Google Scholar]
- Owens T. W.; Taylor R. J.; Pahil K. S.; Bertani B. R.; Ruiz N.; Kruse A. C.; Kahne D. Structural basis of unidirectional export of lipopolysaccharide to the cell surface. Nature 2019, 567, 550–553. 10.1038/s41586-019-1039-0. [DOI] [PMC free article] [PubMed] [Google Scholar]
- Moison E.; Xie R.; Zhang G.; Lebar M. D.; Meredith T. C.; Kahne D. A fluorescent probe distinguishes between inhibition of early and late steps of lipopolysaccharide biogenesis in whole cells. ACS Chem. Biol. 2017, 12, 928–932. 10.1021/acschembio.7b00159. [DOI] [PMC free article] [PubMed] [Google Scholar]
- Falchi F. A.; Taylor R. J.; Rowe S. J.; Moura E. C. C. M.; Baeta T.; Laguri C.; Simorre J. P.; Kahne D. E.; Polissi A.; Sperandeo P. Suppressor mutations in LptF bypass essentiality of LptC by forming a six-protein transenvelope bridge that efficiently transports lipopolysaccharide. mBio 2023, 14, e0220222 10.1128/mbio.02202-22. [DOI] [PMC free article] [PubMed] [Google Scholar]
- Chifflet S.; Torriglia A.; Chiesa R.; Tolosa S. A method for the determination of inorganic phosphate in the presence of labile organic phosphate and high concentrations of protein: application to lens ATPases. Anal. Biochem. 1988, 168, 1–4. 10.1016/0003-2697(88)90002-4. [DOI] [PubMed] [Google Scholar]
- Martínez Gache S. A.; Recoulat Angelini A. A.; Sabeckis M. L.; González Flecha F. L. Improving the stability of the malachite green method for the determination of phosphate using Pluronic F68. Anal. Biochem. 2020, 597, 113681. 10.1016/j.ab.2020.113681. [DOI] [PubMed] [Google Scholar]
- Biswas T.; Resto-Roldán E.; Sawyer S. K.; Artsimovitch I.; Tsodikov O. V. A novel non-radioactive primase-pyrophosphatase activity assay and its application to the discovery of inhibitors of Mycobacterium tuberculosis primase DnaG. Nucleic Acids Res. 2013, 41, e56 10.1093/nar/gks1292. [DOI] [PMC free article] [PubMed] [Google Scholar]
- Tsubery H.; Ofek I.; Cohen S.; Fridkin M. Structure-function studies of polymyxin B nonapeptide: implications to sensitization of gram-negative bacteria. J. Med. Chem. 2000, 43, 3085–3092. 10.1021/jm0000057. [DOI] [PubMed] [Google Scholar]
- Kaplan J. H.; Forbrush B. III; Hoffman J. F. Rapid photolytic release of adenosine 5′-triphosphate from a protected analog: Utilization by the sodium:potassium pump of human red blood cell ghosts. Biochemistry 1978, 17, 1929–1935. 10.1021/bi00603a020. [DOI] [PubMed] [Google Scholar]
- Choi J.; Terazima M. Photoreaction of caged ATP studied by the time-resolved transient grating method. Photochem. Photobiol. Sci. 2003, 2, 767–773. 10.1039/b301745a. [DOI] [PubMed] [Google Scholar]
- Barth A.; Hauser K.; Maentele W.; Corrie J. E. T.; Trentham D. R. Photochemical release of ATP from “caged ATP” studied by time-resolved infrared spectroscopy. J. Am. Chem. Soc. 1995, 117, 10311–10316. 10.1021/ja00146a015. [DOI] [Google Scholar]
- Il’ichev Y. V.; Schwörer M. A.; Wirz J. Photochemical reaction mechanisms of 2-nitrobenzyl compounds: Methyl ethers and caged ATP. J. Am. Chem. Soc. 2004, 126, 4581–4595. 10.1021/ja039071z. [DOI] [PubMed] [Google Scholar]
- Törk L.; Moffatt C. B.; Bernhardt T. G.; Garner E. C.; Kahne D. Single-molecule dynamics show a transient lipopolysaccharide transport bridge. Nature 2023, 623, 814–819. 10.1038/s41586-023-06709-x. [DOI] [PMC free article] [PubMed] [Google Scholar]
- Li G.-W.; Burkhardt D.; Gross C.; Weissman J. S. Quantifying absolute protein synthesis rates reveals principles underlying allocation of cellular resources. Cell 2014, 157, 624–635. 10.1016/j.cell.2014.02.033. [DOI] [PMC free article] [PubMed] [Google Scholar]
- Shands J. W.; Graham J. A.; Nath K. The morphologic structure of isolated bacterial lipopolysaccharide. J. Mol. Biol. 1967, 25, 15–21. 10.1016/0022-2836(67)90275-6. [DOI] [PubMed] [Google Scholar]
- Raetz C. R.; Whitfield C. Lipopolysaccharide endotoxins. Annu. Rev. Biochem. 2002, 71, 635–700. 10.1146/annurev.biochem.71.110601.135414. [DOI] [PMC free article] [PubMed] [Google Scholar]
- Inagaki M.; Kawaura T.; Wakashima H.; Kato M.; Nishikawa S.; Kashimura N. Different contributions of the outer and inner R-core residues of lipopolysaccharide to the recognition by spike H and G proteins of bacteriophageφX174. FEMS Microbiol. Lett. 2003, 226, 221–227. 10.1016/S0378-1097(03)00601-3. [DOI] [PubMed] [Google Scholar]
- Reynolds C. M.; Raetz C. R. Replacement of lipopolysaccharide with free lipid A molecules in Escherichia coli mutants lacking all core sugars. Biochemistry 2009, 48, 9627–9640. 10.1021/bi901391g. [DOI] [PMC free article] [PubMed] [Google Scholar]
- Meredith T. C.; Aggarwal P.; Mamat U.; Lindner B.; Woodard R. W. Redefining the requisite lipopolysaccharide structure in Escherichia coli. ACS Chem. Biol. 2006, 1, 33–42. 10.1021/cb0500015. [DOI] [PubMed] [Google Scholar]
- Schmidt G.; Jann B.; Jann K. Immunochemistry of R lipopolysaccharides of Escherichia coli. Studies on R mutants with an incomplete core, derived from E. coli O8:K27. Eur. J. Biochem. 1970, 16, 382–392. 10.1111/j.1432-1033.1970.tb01092.x. [DOI] [PubMed] [Google Scholar]
- Jansson P. E.; Lindberg B.; Lindberg A. A.; Wollin R. Structural studies on the hexose region of the core in lipopolysaccharides from Enterobacteriaceae. Eur. J. Biochem. 1981, 115, 571–577. 10.1111/j.1432-1033.1981.tb06241.x. [DOI] [PubMed] [Google Scholar]
- Santos N. C.; Silva A. C.; Castanho M. A.; Martins-Silva J.; Saldanha C. Evaluation of lipopolysaccharide aggregation by light scattering spectroscopy. Chembiochem 2003, 4, 96–100. 10.1002/cbic.200390020. [DOI] [PubMed] [Google Scholar]
- Freinkman E.; Chng S. S.; Kahne D. The complex that inserts lipopolysaccharide into the bacterial outer membrane forms a two-protein plug-and-barrel. Proc. Natl. Acad. Sci. U.S.A. 2011, 108, 2486–2491. 10.1073/pnas.1015617108. [DOI] [PMC free article] [PubMed] [Google Scholar]
- Qiao S.; Luo Q.; Zhao Y.; Zhang X. C.; Huang Y. Structural basis for lipopolysaccharide insertion in the bacterial outer membrane. Nature 2014, 511, 108–111. 10.1038/nature13484. [DOI] [PubMed] [Google Scholar]
- Malojcic G.; Andres D.; Grabowicz M.; George A. H.; Ruiz N.; Silhavy T. J.; Kahne D. LptE binds to and alters the physical state of LPS to catalyze its assembly at the cell surface. Proc. Natl. Acad. Sci. U.S.A. 2014, 111, 9467–9472. 10.1073/pnas.1402746111. [DOI] [PMC free article] [PubMed] [Google Scholar]
- Kenniston J. A.; Baker T. A.; Fernandez J. M.; Sauer R. T. Linkage between ATP consumption and mechanical unfolding during the protein processing reactions of an AAA+ degradation machine. Cell 2003, 114, 511–520. 10.1016/S0092-8674(03)00612-3. [DOI] [PubMed] [Google Scholar]
- Martorana A. M.; Moura E. C. C. M.; Sperandeo P.; Di Vincenzo F.; Liang X.; Toone E.; Zhou P.; Polissi A. Degradation of Components of the Lpt Transenvelope Machinery Reveals LPS-Dependent Lpt Complex Stability in Escherichia coli. Front. Mol. Biosci. 2021, 8, 758228. 10.3389/fmolb.2021.758228. [DOI] [PMC free article] [PubMed] [Google Scholar]
- Pahil K. S.; Gilman M. S. A.; Baidin V.; Clairfeuille T.; Mattei P.; Bieniossek C.; Dey F.; Muri D.; Baettig R.; Lobritz M.; Bradley K.; Kruse A. C.; Kahne D. A new antibiotic traps lipopolysaccharide in its intermembrane transporter. Nature 2024, 625, 572–577. 10.1038/s41586-023-06799-7. [DOI] [PMC free article] [PubMed] [Google Scholar]
- Zampaloni C.; Mattei P.; Bleicher K.; Winther L.; Thäte C.; Bucher C.; Adam J. M.; Alanine A.; Amrein K. E.; Baidin V.; Bieniossek C.; Bissantz C.; Boess F.; Cantrill C.; Clairfeuille T.; Dey F.; Di Giorgio P.; du Castel P.; Dylus D.; Dzygiel P.; Felici A.; García-Alcalde F.; Haldimann A.; Leipner M.; Leyn S.; Louvel S.; Misson P.; Osterman A.; Pahil K.; Rigo S.; Schäublin A.; Scharf S.; Schmitz P.; Stoll T.; Trauner A.; Zoffmann S.; Kahne D.; Young J. A. T.; Lobritz M. A.; Bradley K. A. A novel antibiotic class targeting the lipopolysaccharide transporter. Nature 2024, 625, 566–571. 10.1038/s41586-023-06873-0. [DOI] [PMC free article] [PubMed] [Google Scholar]
Associated Data
This section collects any data citations, data availability statements, or supplementary materials included in this article.