

Abstract
Block copolymers are recognized as a valuable platform for creating nanostructured materials. Morphologies formed by block copolymer self-assembly can be transferred into a wide range of inorganic materials, enabling applications including energy storage and metamaterials. However, imaging of the underlying, often complex, nanostructures in large volumes has remained a challenge, limiting progress in materials development. Taking advantage of recent advances in X-ray nanotomography, we noninvasively imaged exceptionally large volumes of nanostructured hybrid materials at high resolution, revealing a single-diamond morphology in a triblock terpolymer–gold composite network. This morphology, which is ubiquitous in nature, has so far remained elusive in block copolymer-derived materials, despite its potential to create materials with large photonic bandgaps. The discovery was made possible by the precise analysis of distortions in a large volume of the self-assembled diamond network, which are difficult to unambiguously assess using traditional characterization tools. We anticipate that high-resolution X-ray nanotomography, which allows imaging of much larger sample volumes than electron-based tomography, will become a powerful tool for the quantitative analysis of complex nanostructures and that structures such as the triblock terpolymer-directed single diamond will enable the generation of advanced multicomponent composites with hitherto unknown property profiles.
Keywords: ptychographic X-ray computed tomography, structural characterization, distortion in soft matter crystals, block copolymer self-assembly, single- and alternating-diamond morphologies
Introduction
X-ray tomography allows nondestructive 3D imaging of large sample volumes due to the large penetration depth of X-rays. Originally used mainly for biological samples,1,2 it is now being extended to materials science, including lithium-ion batteries3,4 with recent improvements in resolution now allowing nanoscale imaging.5,6 X-ray nanotomography,7−9 particularly that based on X-ray ptychography, has recently enabled 3D imaging of nanostructures in integrated circuits10 and nanoparticle arrays.11 Despite the enormous utility of this emerging technique for the characterization of nanostructured materials, its application to self-assembled nanostructures12 remains largely underrepresented. One area where X-ray nanotomography can be particularly useful is in the study of nanostructured materials generated by the self-assembly of block copolymers, especially those with 3D network structures. Their continuous pathways in all three spatial directions are important for applications involving transport of electrons13 or ions,14 while their distinct morphologies produce metamaterials with emerging properties15,16 whose performance is closely linked to structural details of the underlying network.17
However, the identification of networks formed by the self-assembly of block copolymers remains challenging. Unlike their natural counterparts, for example in butterflies,18 they often exhibit symmetry-breaking distortions19 that are difficult to assess using conventional characterization techniques such as X-ray scattering.20 The situation is exacerbated by the transition from diblock copolymer to triblock terpolymer-derived materials, as reported herein, which exhibit even more complex phase behavior, including multiple network structures.21 Here we show that X-ray nanotomography allows the unambiguous assignment of a rarely observed network structure in self-assembled synthetic materials and visualizes its structural changes over mesoscopic distances in a multigrain sample.
Results and Discussion
The experimental system consists of the previously unreported polyisoprene-b-polystyrene-b-poly(glycidyl methacrylate) (PI-b-PS-b-PGMA, ISG) triblock terpolymer, the chemical structure of which is shown in Figure 1a. ISG was synthesized by sequential anionic polymerization according to established procedures23,24 described in the Methods. The asymmetric composition of the ISG terpolymer, with volume fractions of fPI = 0.29, fPS = 0.52, and fPGMA = 0.19, allows curved interfaces between the phases formed by the different blocks, characteristic of 3D network structures, while its molar mass of 67.4 kg/mol is sufficiently high to induce self-assembly.21 Large grains of 3D block copolymer networks are typically formed by slow solvent casting, often over several days.19,25 A similar protocol was used here to produce a well-ordered nanostructured network in an ISG terpolymer film by controlled swelling in the vapor of the organic solvent tetrahydrofuran (THF), followed by slow drying over a period of 44 h. The dried film was voided by selective removal of the PI phase. The resulting nanoporous polymer template was then backfilled with gold by electrodeposition to replicate the network structure created by the PI phase26 and enhance X-ray contrast (Figure 1b; details of the sample preparation are given in Methods). The structural agreement between the polymer film and the Au replica was confirmed by X-ray scattering (Supporting Information Figure S1).
Figure 1.

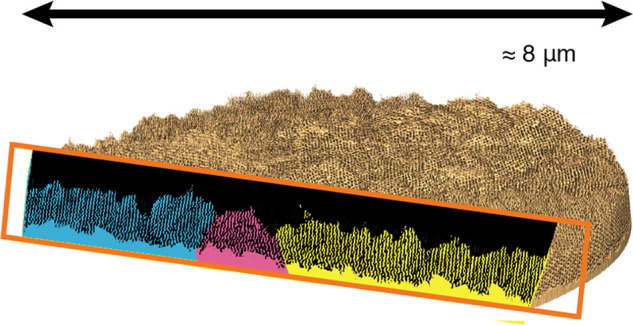
Replication of a self-assembled polymer network and its volumetric reconstruction. (a) Chemical structure of polyisoprene-block-polystyrene-block-poly(glycidyl methacrylate) (PI-b-PS-b-PGMA, ISG), where PI is shown in blue, PS in red, and PGMA in green. (b) Scheme of sample preparation. From an ISG terpolymer film prepared by solvent vapor annealing, the PI phase is selectively removed to form a voided film, which is backfilled with gold by electrodeposition. PI is shown in blue, PS in red, PGMA in green, and gold in yellow. (c) 3D reconstruction of the gold network determined by PXCT and exemplary cross-section. (d) Comparisons between cross-sections extracted from the reconstructed volume obtained by PXCT (left) and cross-sections of the single diamond (SD) according to the level-set model in eq 1 (right). The Miller indices of the SD level-set are written as ⟨hkl⟩. (e) Entire reconstructed volume containing three grains (yellow, green, and blue), separated by grain boundaries (pink). Full analysis of these grain boundaries (see also Karpov et al.22) revealed a pair of topological defects (black circles). Across the different grains and grain boundaries, cross-sections were extracted along the black dashed lines, intersecting at one of the topological defects. (f) Cross-section across yellow and blue grains separated by a defect (pink). The strut patterns agree with selected SD level sets (eq 1; shown as insets) but change their orientation and compress when moving toward the defect. (g) Cross-section across the yellow, green, and blue grains and their respective boundaries, revealing that the strut pattern rotates and deforms as the domains approach a grain boundary and defects. Scale bars: 100 nm in panel d, 1 μm in panel e, and 500 nm in panels f and g.
For the unambiguous morphological assignment of 3D network structures, tomographic imaging and 3D reconstruction of the structure are essential. Established 3D imaging using TEM tomography typically produces volumes of 10s to 100s of unit cells, allowing quantitative structural analysis,27,28 while more recent FIB-SEM tomography extends this to 1000s of unit cells.19,20 The ptychographic X-ray computed tomography (PXCT)7,10,11 reported here allows imaging of about 70000 unit cells of a 3D network structure (as detailed below) with an estimated half-pitch resolution of approximately 11 nm, i.e., substantially larger sample volumes than with any previous technique. From a cylindrical pillar sample with a diameter of 8 μm, the 3D gold network within a PS polymer matrix was reconstructed with a voxel size of 6.04 nm, resulting in the tomogram shown in Figure 1c,e. The PXCT experiment and the pillar sample preparation are described in detail in Methods.
Morphological analysis of the network is greatly facilitated by the ability to extract a virtually unlimited number of cross sections from the tomogram, which can be compared with cross sections calculated from model structures. Several distinctive patterns were observed in the cross sections extracted from the reconstructed volume of the 3D gold network at various orientations. Despite some angular distortion, a matching plane was found in the single-diamond (SD) network for each of these cross sections (Figures 1d and S2). The quality and number of matching cross sections found between the experimental and calculated data allow confident assignment of the network to the SD. For the calculation of the planes in an ideal SD—a triply periodic minimal surface with space group Fd3̅m (Q227)—its isosurface was approximated by the following level-set equation:18
| 1 |
where t = 2.4(f – 0.5) is a parameter related to the fill fraction f of the solid network phase. A volumetric SD is then defined by filling the channels bounded by one side of the isosurface (the other side being the matrix) while its skeleton is the network passing through the middle of each strut.
For the ISG terpolymer network, this means that a PS matrix separates SDs of PI and PGMA, forming what is known as an alternating diamond AD. Figure 1b (BCP film) shows an ISG AD, plotted from the level-set equation (eq 1) with fPI = 0.29, fPS = 0.52, and fPGMA = 0.19. In general, the AD is characterized by the same Fd3̅m space group (Q227) as the SD, whereas the double diamond (DD), for which both networks are made of the same material, is described by the Pn3̅m space group (Q224). This distinction is crucial for self-assembled structures: since the two networks are made of different materials, only an AD can serve as a template for an SD that can be accessed by the described gold replication protocol (see Figure 1b, Au backfilled film).
After data segmentation and rendering, a reconstructed network of three distinct grains separated by boundaries is observed (Figure 1e). Cross-sectional images of the entire volume reveal spatial heterogeneities in the network within the grains as one approaches a boundary (Figure 1f,g). Away from grain boundaries, the network structure agrees well with the SD level-sets. However, approaching a grain boundary increases apparent strain, resulting in compression and bending of the strut network. To analyze these spatially heterogeneous deformations, we first examine the network away from grain boundaries in this manuscript, while the analysis of network deformations near grain boundaries is addressed in a companion paper.22
In a more refined and quantitative analysis, three pairwise orthogonal slices were extracted from inside a grain, away from any grain boundary (yellow grain in Figure 1e). These slices consisted of one parallel and two perpendicular to the substrate (Figure 2a) and were matched to pairwise (approximately) orthogonal cross sections of a level-set generated SD (Figure 2b). This simultaneous agreement between experimental and simulated slices in all three spatial directions not only proves the morphological assignment of an SD, but also allows the orientation of the network to be determined and its distortion to be quantified. Based on the matching orthogonal slices, a substrate normal of the SD of n⃗ = (0.71, 0.70, 0.03) was determined, approximating a ⟨110⟩ out-of-plane orientation, i.e. a substrate-parallel orientation of the (110) planes. The two micrometre-wide grains reconstructed from the micropillar sample (yellow and green grains in Figure 1e) both show a uniform orientation of their (110) planes across the thickness of the extracted sample (Figure S3). We imagine that such uniformity in the orientation of the sample is valuable, for example, in the interaction with light.
Figure 2.

Experimental and simulated orthoslices. (a) Representative subvolume extracted from within the yellow grain of the tomogram, away from any grain boundary, with orthogonal slices shown on the left and the corresponding cross-sections with color-matched frames shown on the right. Scale bars: 200 nm. (b) Cross-sections of an SD level set computed from eq 1, matching the experimental cross-sections of panel a. The angles between the computed slices are αgb = 92°, αgr = 107°, and αrb = 97°, indicating that the experimental network is distorted compared to the ideal SD in the level set model. The green outlined cross-section, corresponding to a substrate-parallel orientation, is close to the (110) plane of the SD.
Following previous arguments,29 we rationalize the observed orientation of the lattice underlying the self-assembled ISG terpolymer network by comparing the composition of the (110) and other distinct planes of the AD morphology (Figure S4). The composition of the 110 planes differs from the other planes in that (i) it has the largest variation in the volume fraction of the matrix phase, and (ii) it has the overall highest value of the maximum volume fraction of the matrix phase (74%), which represents a significant deviation from its bulk volume average of 52% (=fPS). This maximum is reached when the other two phases (PI and PGMA) form centered rectangular lattices shifted by half a unit cell (Figure S4a). Preferred lattice orientations are commonly observed for other cubic morphologies in self-assembled block copolymer films. The double gyroid and the alternating gyroid, for example, favor a substrate-parallel orientation of their (211)30 and (110)31 planes, respectively. Analogous to the alternating diamond studied here, these are the planes with the greatest compositional variation. Preferred orientations also extend to noncubic morphologies, such as block copolymer lamellae and cylinders, which typically orient in the plane of the film.32,33 While this behavior is commonly attributed to the preferential wetting of one of the blocks at the film interfaces, the orientation of a block copolymer morphology also depends on the annealing kinetics and the solvent used.34
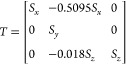
Based on the assignment of the orientation, the {100} family of planes was located in the reconstructed volume to extract the experimental conventional unit cell (Figure 3). This gives unit cell parameters of 75, 108, and 49 nm, and angles between the [100], [010], and [001] directions of α = 89°, β = 90°, and γ = 117°, approximating a monoclinic unit cell. Its evident angular deformation is most pronounced between the two planes separated by γ. Note that the replication process did not result in any observable structural changes based on SAXS data (Figure S1). Furthermore, the structure of the micropillar sample remained stable under X-ray exposure throughout the PXCT measurement (Figure S11). Instead, the observed deformation aligns with the vertical shrinkage commonly observed in films of self-assembled morphologies during drying (Figure 3a). Shrinkage during solvent processing has previously been shown to induce significant lattice distortions in cubic gyroids.35,36 Since the unit cell obtained here also differs from a cubic unit cell (Figure 3f), a deformed single diamond (DSD) was generated by modifying the SD level-set model to match the experimental unit cell parameters. This was achieved by scaling and shearing an SD with all lattice parameters equal to about 71 nm, which corresponds to a volume-conserving 3D affine transformation represented by the following matrix:
 |
2 |
where Sx ≈ 0.94, Sy ≈ 1.53, and Sz ≈ 0.72 are the scaling factors. The resulting DSD is shown in Figure 3c,d and is in excellent agreement with the experimentally determined unit cell shown in Figure 3a,b. The model, therefore, suggests that the observed monoclinic distortion of the unit cell can be described by affine transformations of an ideal cubic SD.
Figure 3.

Unit cell distortion. (a) Conventional unit cell within a translucent volume rendering of the reconstructed network, with the substrate-normal facing up as indicated by the orange arrow. (b) Conventional unit cell extracted from the tomogram along with the determined unit cell parameters (a, b, c, α, β, γ). The stripe patterns seen on the unit cell surface are characteristic of the {100} family of planes. The plane with the blue outline is parallel to the sample normal. (c) Conventional unit cell in a translucent volume rendering of the DSD with the [110] direction pointing upward, which corresponds to the orientation of the experimental data. (d) DSD unit cell resulting from the affine transformation of a cubic unit cell according to eq 2. (e) Conventional cubic unit cell in a translucent volume rendering of an SD with the [110] direction pointing upward. (f) Conventional cubic unit cell of an SD level set plotted from eq 1 with a fill fraction f = 0.4.
The exceptionally large volume of the full reconstructed network with approximately 70,000 unit cells combined with the small voxel size of 6.04 nm provides an excellent opportunity for statistically meaningful structural analysis down to individual network nodes. This includes the network structure both within a single grain and close to a grain boundary (yellow grain in Figure 1e), which is discussed in a separate research article.22 A subvolume of the full reconstructed data and a representative 4-fold connected node are shown in Figure 4a,b. Skeletonizing such a 3D data set, i.e. replacing volumetric struts connecting two vertices with their medial axis, generates a ball-and-stick model from which structural parameters such as the strut length L, bond angle θ, dihedral angle ϕ and coordination number CN can be extracted (Figure 4d,e). For the experimental data set and the computed DSD, the investigated volumes are V ≈ 1.0 × 1.5 × 0.3 μm3, containing approximately 10,000 nodes. The DSD model agrees well with the experimental data set, both qualitatively (Figure 4f,g) and in the associated quantitative structural analysis (Figure S7).
Figure 4.

Skeletal analysis of the ptychography data. (a) Subvolume (V ≈ (145 nm)3) of the ptychography data set with a single node highlighted in yellow. (b) Extracted single node. (c) Skeleton of a subvolume of the ptychography data set color-coded with the strut length. The short blue struts having a common upward direction are likely caused by shrinkage as the film dries. (d) Definitions of strut length L, bond angle θ, coordination number CN, and dihedral angle φ. (e) Examples of 3-connected and 4-connected struts in a model DSD. (f) Two equivalent subvolumes extracted from the experimental data set (dark blue) and the model DSD (light blue). (g) Comparison of top- and side-view skeletons of subvolumes (V = 430 × 430 × 260 nm3) extracted from the experimental data set (dark blue) and the model DSD (light blue). (h) Strut length (left) and coordination number distributions (right) computed for a model DSD with a resolution of 1 nm and a minimum strut length of 18 nm (see Figure S8 for details).
Given this good agreement, the structural parameters were assessed using the skeleton of a high-resolution DSD model (voxel size 1 nm), which enables a refined structural analysis. The skeleton of this DSD model exhibits a trimodal distribution of strut lengths, centered around 5, 25, and 40 nm (Figure 4h). The skeleton of the experimental data (Figure 4c) features similarly short (blue) struts in the direction approximately orthogonal to the substrate. However, a closer analysis of the skeletonization (Figures 4e and S6) reveals that these struts result from resolution-dependent skeletonization artifacts and are therefore artificial, unlike the bridging struts observed in double gyroid samples using a high-resolution TEM tilt-series.37 Note also that the voxel size should ideally be at most one tenth of the size of the smallest feature in a sample in order to obtain a faithful volumetric reconstruction.38 Imposing a minimal strut length of 18 nm removes these unphysical struts by merging two closely neighboring nodes into one, which yields a perfect 4-fold connectivity (Figures 4h and S8) characteristic of the diamond structure (Figure S5a,c). Although individual struts are not perfectly aligned with the shrinkage direction in the corrected network, shorter struts are mostly in planes perpendicular to the substrate, while longer struts are primarily in the film plane (not shown). The distribution of bond angles shows one peak centered around θ = 80° and three additional peaks between 120–140° (N ≈ 30.000), while the distribution of the dihedral angles displays main peaks at approximately { ± 180°, 0°} (N ≈ 25.000) (Figure S8). Given the unit cell distortion described above, which results from shrinkage of the terpolymer film during drying, these values differ from the values expected for a level-set cubic SD shown in Figure S5 (CN = 4; θ = 109.5°; φ = ±60°, ±180°). The experimental structure is, however, closely related to an SD (see Figure S5a,b), in particular retaining its 4-fold connectivity.
While the SD is commonly observed in the exoskeletons of beetles and weevils,39 it has only recently been achieved synthetically, for example in liquid crystals40 and colloids.41 Our observation of an alternating diamond (consisting of two shifted SDs) in a terpolymer may also be surprising. Indeed, from a thermodynamic standpoint, its formation is predicted only over a very limited region in phase space.42 The scarcity of self-assembled BCP diamonds, especially the alternating diamond observed here, is associated with their higher free energy compared to gyroid networks. This is because three-connected gyroid nodes exert less entropically penalized stretching on the polymer chains than the four-connected diamond nodes.43,44 This unfavorable chain stretching in copolymers can be relieved if the nodes are sufficiently filled with other molecules.45 Following this idea, block copolymer diamonds were stabilized, for example, by adding homopolymer,46 small molecules,47 or by blending copolymers of different chain lengths.48,49 While in the present study solvent molecules were added to the ISG terpolymer during processing, the final structure is dry. The diamond produced therefore consists only of terpolymer. Skeletal analysis of the high-resolution tomogram revealed a distortion of the diamond network and its nodes. However, the effect of such elongated nodes on the overall free energy of the diamond and the degree of chain stretching remains unclear. Alternatively, the diamond may have been stabilized in the presence of the solvent, and then kinetically trapped in the dry film, as previously seen in other network structures.25 These open questions could be addressed using computational approaches such as self-consistent field theory (SCFT), tailored for studying the unknown ISG terpolymers and their interactions with the solvent.
Conclusions
Our observations have been made possible by recent advances in X-ray nanotomography, which now allows for high-resolution imaging of large sample volumes. Analysis of up to 70,000 unit cells in a self-assembled triblock terpolymer network with sub-15 nm half-pitch resolution enabled identification of the elusive single-diamond morphology. Such high-resolution, real-space 3D structural information not only allows the unambiguous assignment of complex network morphologies, but also allows quantification of relevant structural distortions. This capability extends to detecting spatially heterogeneous deformations, which often complicate structural analysis based solely on scattering experiments (as shown in Figure S12). Along with the study of mesoscale defects and grain boundaries,22 this constitutes an emerging area in soft matter crystal analysis.19 In future studies, the noninvasive nature of X-ray nanotomography may further allow such detailed structural information to be directly coupled with subsequent material property investigations. This, in turn, may provide opportunities to establish structure–property relationships at increased levels of structural detail. This is particularly relevant for nanostructured multicomponent materials such as the polymer–metal composites studied here, where structural details are expected to have substantial effects, e.g., on photonic/plasmonic material properties.17
Methods
Triblock Terpolymer Synthesis
Standard Schlenk line techniques were used throughout the synthesis of the polyisoprene-block-polystyrene-block-poly(glycidyl methacrylate) (PI-b-PS-b-PGMA, ISG) triblock terpolymer. Diphenylethylene-end-capped PI-b-PS (IS-DPE) was synthesized from isoprene (99%, Sigma-Aldrich), styrene (≥99%, Sigma-Aldrich) and 1,1-diphenylethylene (Sigma-Aldrich) by sequential anionic polymerization27,50 using sec-butyllithium (Sigma-Aldrich) in benzene. The solvent was exchanged to tetrahydrofuran (THF) containing 5 equiv. lithium chloride with respect to the sec-butyllithium by cryogenic-assisted vacuum distillation (anhydrous, inhibitor-free, 99%, Sigma-Aldrich). Glycidyl methacrylate (>95%, TCI America) monomer was vacuum distilled over calcium hydride and filtered through active alumina (Fisher Scientific) in an inert atmosphere glovebox, then vacuum distilled again over calcium hydride.51 In both distillation processes, the first and the last fractions of the distillate were removed. Glycidyl methacrylate monomer was slowly added to IS-DPE in THF at −78 °C and allowed to react for 2 h. The polymer was then quenched with degassed methanol (Macron Chemicals), immediately precipitated in methanol, and then dried under reduced pressure for 48 h. The total molar mass of the ISG terpolymer was 67.4 kg/mol, as determined by a combination of gel permeation chromatography of the PI block (GPC, Figure S9) and proton nuclear magnetic resonance spectroscopy of the final ISG terpolymer (1H NMR, Figure S10). The polydispersity index of the final ISG terpolymer determined by GPC was 1.08 and its block volume fractions determined by 1H NMR were fPI = 0.29, fPS = 0.52, and fPGMA = 0.19 (Figure S10).
Preparation of Polymer Films
The ISG terpolymer film was prepared using fluorine-doped tin oxide (FTO)-coated glass as substrate. Prior to film processing, the FTO-coated glass was etched in Piranha solution and subsequently functionalized by immersion in a 4.3 mM solution of octyltrichlorosilane (Sigma-Aldrich) in anhydrous cyclohexane (Sigma-Aldrich) for 12 s. The polymer film on an FTO-coated glass substrate was prepared by spin-coating a 10 wt % solution of ISG terpolymer in anhydrous anisole (Sigma-Aldrich) for 60 s at 1200 rpm with an acceleration of 500 rpm/s. Using oxygen plasma cleaned (Diener MRC 100, 100 W, 2 min) silicon substrates, the above protocol resulted in approximately 600 nm thick ISG terpolymer films as determined by thin-film interferometry (not shown).
Solvent Vapor Annealing (SVA)
The ISG terpolymer film was annealed in a sealed polyether ether ketone (PEEK) chamber. Two gas lines were connected to the chamber inlet: one pure nitrogen line and one nitrogen line that passed through a solvent reservoir before entering the chamber to enrich the nitrogen carrier gas with solvent vapor. Gas flow in these lines was controlled by digital mass flow controllers (MKS Type MF1) with a maximal flow of 100 sccm. Adjusting the flow through the nitrogen and solvent vapor lines allows control of the concentration and the composition of the solvent vapor environment in the chamber. A manual mass flow controller connected to the exhaust line was used to adjust the pressure inside the chamber. THF (Sigma-Aldrich) was used as a solvent.
The temperature in the annealing chamber was held constant at 21.3 °C, controlled by a Peltier element mounted on a copper plate that in turn served to mount the sample. The temperature of the water bath (ThermoFisher ARCTIC SC150-A10B Refrigerated Circulator) containing the solvent reservoir was fixed at ≈23.0 °C. The ambient relative humidity was between 59 and 64% during the SVA experiments. The temperature of the room was controlled to ≈23.7 °C.
The ISG terpolymer film was annealed in THF vapor to a maximum swelling ratio of φ ≈ 2.1 before being subjected to controlled drying over a period of 44 h. The swelling ratio φ, calibrated by measurements of ISG terpolymer films on silicon substrates (not shown), is a dimensionless measure of the relative film thickness and is defined as φ = t/t0, where t is the thickness of the swollen film and t0 is the initial thickness of the film after spin coating.
Templated Electrodeposition of Gold
To create gold replicas of the terpolymer gyroids, the PI block of ISG terpolymer films was degraded by exposure to UV light (Fisher Scientific, λ = 254 nm, 15 W, 11 cm distance between the UV lamp and the sample) for 15 min, and subsequently removed by immersion of the terpolymer film in ethanol for 30 min. The resulting voided network in the terpolymer films was replicated into gold by electrodeposition using a three-electrode cell with Ag/AgCl with KCl (Metrohm) as the reference electrode, a Pt electrode tip (Metrohm) as the counter electrode, and the FTO-coated glass substrate as the working electrode. A cyclic voltammetry scan between −0.4 V and −1.15 V at a rate of 0.05 V/s was used to nucleate gold crystals, while deposition was performed at a constant potential of −0.756 V to subsequently fill the terpolymer template with gold. Electroplating was performed using an AutoLab PGSTAT302N potentiostat (Metrohm) with an Au plating solution (matt ECF 60, Metalor) modified by the addition of 0.5% v/v of a brightener consisting of a 66.7 mM aqueous solution of As2O3 (Sigma-Aldrich). KOH was used to adjust the pH to approximately 14.
Small-Angle X-ray Scattering (SAXS)
Transmission SAXS measurements were performed at beamline I22 of the Diamond Light Source using an X-ray energy of 12.4 keV and a sample-to-detector distance (SDD) of 9.8 m, which was determined by calibration to a silver behenate (AgBe) standard. Scattering patterns were captured on a Pilatus P3–2 M detector (Dectris) with a 10 s exposure time and reduced using the open-source software package DAWN.52
Grazing-incidence SAXS (GISAXS) measurements were carried out at the Advanced Photon Source, sector 8 ID-E, at Argonne National Lab.53 The X-ray energy used was 10.915 keV and the SDD was calibrated to be 2.165 m using an AgBe standard. Two-dimensional scattering images were collected at an angle of incidence of αi = 0.14° on a PILATUS 1 M detector (Dectris) and reduced using Nika,54 a software package for IGOR Pro 6 (WaveMetrics).
Micropillar Sample Preparation with Focused Ion Beams
To perform tomographic measurements, single-diamond micropillar samples were extracted from the gold-filled polymer template (Figure 1b). The micropillar was shaped by FIB (Focused Ion Beam) processing using a Carl Zeiss Microscopy NVision40 FIB-SEM with Ga ion source. First, a layer of carbon 1.5 μm thick was deposited on the surface of the gold-filled polymer film in the FIB sample chamber, in order to prevent damage to the single-diamond layer by the ion beam. Next, a 30 kV/13 nA Ga+ beam excavated a square area of the protection layer and underlying layers to 12 μm depth to begin defining a pillar-shape. The final shape and diameter (approximately 8 μm) of the pillar-shaped samples measured in the study was refined by a 30 kV/3 nA Ga+ beam, used to excavate to the final 15 μm depth to minimize the possibility of beam damage to the pillar.
After FIB milling, each pillar sample was picked up by a Kleindiek NanoControl NC40 micromanipulator system integrated with the NVision40 FIB/SEM. The micromanipulator was fixed to the top of the pillar’s carbon protection layer by depositing 0.3 μm thick carbon patch and the bottom of the pillar was cut from the glass substrate by a 30 kV/150 pA Ga+ beam. Then the pillar was picked up and fixed close to the tip of a custom OMNY pin55 (see separate publication for details22) by further carbon deposition around its base.
Ptychographic X-ray Computed Tomography (PXCT)
Instrumentation and Data Acquisition
PXCT measurements were performed at the cSAXS beamline of the Swiss Light Source at the Paul Scherrer Institute in Villigen, Switzerland. In X-ray ptychography, the sample is spatially scanned across a coherent, confined beam, in such a way that neighboring illuminated areas on the sample partially overlap.8 At each scan position, coherent far-field diffraction patterns are recorded in a transmission geometry. Iterative phase retrieval algorithms are then used to reconstruct the image of the sample with quantitative phase and absorption contrast.8,56 In ptychography, the spatial resolution is not limited by the size of the illumination or the step size of the scan, but by the angular extent of the scattering at which the diffraction patterns can be measured with a sufficient signal-to-noise ratio. In practice, however, mechanical vibrations can limit the resolution, and positioning error motions can cause distortions in the reconstructed image. To suppress such vibrations, we used the flexible tOMography Nano Imaging (flOMNI) end-station10,57 (see also separate publication22). This instrument features accurate sample positioning with respect to the beam-defining optics using external laser interferometry combined with sample rotation capabilities for tomography.58 This setup ensured distortion-free acquisition of projections of the sample at 2400 equally spaced angular positions ranging from 0 to 180 deg. The total data acquisition time was approximately 35 h, including the overhead time due to stage movement in between acquisitions. We estimate that the total dose deposited on the sample during this measurement was approximately 1.0 × 10¹⁰ Gy.
For the PXCT measurements, coherent X-rays with a photon energy of 6.2 keV were focused through a Fresnel zone plate (FZP) of 170 μm diameter and 60 nm outermost zone width, in combination with a central stop and an order-sorting aperture, to define a coherent illumination on the sample with a flux of 3.3 × 10⁸ photons/s. The FZP had locally displaced zones specifically designed to produce an optimal nonuniform illumination for ptychography.59 The sample was placed at about 0.5 mm downstream of the focus, where the beam had a size of about 2 μm. For the ptychographic scans, we used a combined motion between the sample and the FZP, as described elsewhere,60 to minimize the scanning time. Ptychographic scans were performed following the positions of a Fermat spiral pattern61 with an average step size of 0.5 μm, covering a field of view of 12.5 × 3.7 μm2. At each scan position, diffraction patterns were recorded with an acquisition time of 0.1 s using an in-vacuum 1.5 M Eiger detector62 with a pixel size of 75 × 75 μm2. The detector was placed at a distance of 2.264 m from the sample inside an evacuated flight tube to reduce air absorption and scattering background. The ptychographic projections were acquired in a nonsequential angular order according to a binary decomposition scheme.63 In this way, 8 subtomograms, each with 8 times the angular spacing, were acquired consecutively in such a way that the combination of all of them resulted in a uniform angular space. In this way, the stability of the sample could be assessed during acquisition (see Figure S11). The dose D imparted on the sample was estimated as D = μ/ρN0ENp,64 where μ is the linear attenuation coefficient, ρ is the mass density of the sample material, N0 is the flux density incident on the sample in photons per unit area, E is the photon energy, and Np is the number of projections. For the linear attenuation coefficient we used the value for Au.65
Ptychographic and Tomographic Reconstruction
Ptychographic reconstructions were performed using the Ptycho Schelves package developed by the X-ray Coherent Scattering group at the Paul Scherrer Institute.66 For the reconstructions, we selected 1000 × 1000 detector pixels, resulting in a reconstructed pixel size of 6.04 nm. For each 2D projection, we used 500 iterations of a least-squares maximum-likelihood algorithm with compact set approach.67 All phase images acquired at different angles were registered with subpixel accuracy using methods developed by the same group.68,69 In addition to registration, these methods allowed an assessment of the sample stability during acquisition, confirming that the high dose delivered to the sample did not cause any significant change in its structure at the achieved resolution (see Figure S11). After registration, tomographic reconstruction was performed by filter back projection using a Ram Lak filter with a frequency cutoff of 1. A Fourier shell correlation analysis70 of the resulting 3D data set estimated a half-pitch resolution (i.e., half the distance between two resolved features) of approximately 7 nm, while line profile analysis provided a more conservative half-pitch resolution estimate of approximately 11 nm, as detailed elsewhere.22
3D Reconstruction and Analysis
Image stacks were processed using Fiji71 and FEI Avizo for Materials Science 2020.2 software for basic image processing, 3D reconstruction and statistical analysis. A median filter was applied to despeckle and smooth the images. Segmentation was performed in Fiji using the trainable Weka 3D segmentation plug-in.72 Skeletonization was then performed in Avizo using an algorithm based on distance mapping and thinning. The strut length distribution and average coordination number (CN) were computed using Avizo’s built-in features. Bond and dihedral angles were computed in Matlab v.2021b from the positions of all connected nodes derived from the skeleton.
Acknowledgments
This study was financially supported by the Swiss National Science Foundation (SNSF) (163220, 188647, 168223, and 190467), the National Center of Competence in Research Bio-Inspired Materials (51NF40-182881), and the Adolphe Merkle Foundation. This project also received funding from the European Union’s Horizon 2020 research and innovation programme under the Marie Sklodowska-Curie Grant Agreement No. 706329/cOMPoSe (I.G.). This work was also funded under Grant Agreement No. 731019/EUSMI (J.L. and D.K.) and made use of the Cornell Center for Materials Research Shared Facilities supported by the NSF MRSEC program (DMR-1719875). U.B.W. thanks the National Science Foundation (DMR-2307013) for financial support. D.K. acknowledges funding from SNSF under Grant No. 200021_175905. J.L. and S.F. acknowledge support from the Japan Society for the Promotion of Science (JSPS) under KAKENHI 21K04816 and 19H05622, Cooperative Research Projects of CSIS, Tohoku University, and the Graduate Program for Spintronics (GP-Spin), Tohoku University. C.D. acknowledges support from the Max Planck Society Lise Meitner Excellence Program. The authors further acknowledge the Paul Scherrer Institut, Villigen, Switzerland for provision of synchrotron radiation beamtime at beamline X12SA (cSAXS) of the SLS. Additionally, the authors acknowledge Diamond Light Source for time on beamline I22 under proposal SM18392 and thank Andrew Smith for his assistance. Use of the Advanced Photon Source (APS) was supported by the U.S. Department of Energy, Office of Science, Office of Basic Energy Sciences, under Contract No. DE-AC02-06CH11357. The authors extend their thanks to Joseph W. Strzalka, James A. Dolan, Moshe Dolejsi, and Elizabeth Michiko Ashley for their assistance with the APS experiments.
Data Availability Statement
The raw data used in this study are permanently archived at the Paul Scherrer Institute repository and can be accessed at: http://doi.psi.ch/detail/10.16907/409237cf-63de-43ca-b525-a68025a93d63. Additionally, part of the raw data, all derived data, and the Matlab scripts used for data analysis are available in the Zenodo repository under the following DOI: 10.5281/zenodo.7849558.
Supporting Information Available
The Supporting Information is available free of charge at https://pubs.acs.org/doi/10.1021/acsnano.3c10669.
SAXS data; experimental cross-sectional views and slices compared to level sets; composition profiles; comparison of single diamonds and DSD with experiment; voxel size-dependent skeletonization and upsampling effects; GPC elugrams; 1H NMR spectra; additional tomograms (PDF)
Author Present Address
‡ Department of Chemistry, University of Basel, Mattenstr. 24a, BPR-1096, 4058 Basel, Switzerland
Author Present Address
§ Yokkaichi Research Center, JSR Corp., Yokkaichi, Mie 510-8552, Japan
Author Present Address
∥ Simpson Querrey Institute for Bionanotechnology, Northwestern University, Evanston, IL 60208, USA
Author Present Address
¶ Sumitomo Chemical Co., Ltd., 2-7-1 Nihonbashi, Tokyo 103-6020, Japan
Author Contributions
I.G. and J.L. conceived the study and supervised the research, with assistance from B.D.W., S.F., and H.O. The terpolymer was synthesized by T.Y. and H.S. under the supervision of U.B.W. The solvent annealing setup was designed and built by I.G. and B.D.W. The solvent annealing protocol was developed by K.G. under the supervision of I.G. The polymer template and the gold replica were prepared by S.N.A. The micropillar sample was prepared by M.M. under the supervision of J.L., S.F., and H.O. The PXCT experiment was performed by D.K., M.H., C.D., A.D., and J.L. The ptychographic and tomographic reconstruction was performed by D.K. under the supervision of A.D. The image processing, 3D reconstruction, and structural analysis, including the creation of the structural model, were performed by K.D. Additional structural analysis was performed by R.I. The SAXS data were analyzed by K.G and I.G. The manuscript was written by K.D. and I.G. with contributions from all authors, including feedback on results, analysis, and interpretation.
A preprint version of this work was previously posted on arXiv.73
The authors declare no competing financial interest.
Supplementary Material
References
- Shapiro D.; Thibault P.; Beetz T.; Elser V.; Howells M.; Jacobsen C.; Kirz J.; Lima E.; Miao H.; Neiman A. M.; et al. Biological imaging by soft x-ray diffraction microscopy. Proc. Natl. Acad. Sci. U. S. A. 2005, 102, 15343–15346. 10.1073/pnas.0503305102. [DOI] [PMC free article] [PubMed] [Google Scholar]
- Jiang H.; Song C.; Chen C.-C.; Xu R.; Raines K. S.; Fahimian B. P.; Lu C.-H.; Lee T.-K.; Nakashima A.; Urano J.; et al. Quantitative 3D imaging of whole, unstained cells by using X-ray diffraction microscopy. Proc. Natl. Acad. Sci. U. S. A. 2010, 107, 11234–11239. 10.1073/pnas.1000156107. [DOI] [PMC free article] [PubMed] [Google Scholar]
- Wood V. X-ray tomography for battery research and development. Nature Reviews Materials 2018, 3, 293–295. 10.1038/s41578-018-0053-4. [DOI] [Google Scholar]
- Sadd M.; Xiong S.; Bowen J. R.; Marone F.; Matic A. Investigating microstructure evolution of lithium metal during plating and stripping via operando X-ray tomographic microscopy. Nat. Commun. 2023, 14, 854. 10.1038/s41467-023-36568-z. [DOI] [PMC free article] [PubMed] [Google Scholar]
- Sakdinawat A.; Attwood D. Nanoscale X-ray imaging. Nat. Photonics 2010, 4, 840–848. 10.1038/nphoton.2010.267. [DOI] [Google Scholar]
- Withers P. J.; Bouman C.; Carmignato S.; Cnudde V.; Grimaldi D.; Hagen C. K.; Maire E.; Manley M.; Du Plessis A.; Stock S. R. X-ray computed tomography. Nat. Rev. Methods Primers 2021, 1, 18. 10.1038/s43586-021-00015-4. [DOI] [Google Scholar]
- Dierolf M.; Menzel A.; Thibault P.; Schneider P.; Kewish C. M.; Wepf R.; Bunk O.; Pfeiffer F. Ptychographic X-ray computed tomography at the nanoscale. Nature 2010, 467, 436–439. 10.1038/nature09419. [DOI] [PubMed] [Google Scholar]
- Pfeiffer F. X-ray ptychography. Nat. Photonics 2018, 12, 9–17. 10.1038/s41566-017-0072-5. [DOI] [Google Scholar]
- Shapiro D. A.; Babin S.; Celestre R. S.; Chao W.; Conley R. P.; Denes P.; Enders B.; Enfedaque P.; James S.; Joseph J. M.; et al. An ultrahigh-resolution soft x-ray microscope for quantitative analysis of chemically heterogeneous nanomaterials. Science advances 2020, 6, eabc4904. 10.1126/sciadv.abc4904. [DOI] [PMC free article] [PubMed] [Google Scholar]
- Holler M.; Guizar-Sicairos M.; Tsai E. H. R.; Dinapoli R.; Müller E.; Bunk O.; Raabe J.; Aeppli G. High-resolution non-destructive three-dimensional imaging of integrated circuits. en. Nature 2017, 543, 402–406. 10.1038/nature21698. [DOI] [PubMed] [Google Scholar]
- Michelson A.; Minevich B.; Emamy H.; Huang X.; Chu Y. S.; Yan H.; Gang O. Three-dimensional visualization of nanoparticle lattices and multimaterial frameworks. Science 2022, 376, 203–207. 10.1126/science.abk0463. [DOI] [PubMed] [Google Scholar]
- Wilts B. D.; Sheng X.; Holler M.; Diaz A.; Guizar-Sicairos M.; Raabe J.; Hoppe R.; Liu S.-H.; Langford R.; Onelli O. D.; Chen D.; Torquato S.; Steiner U.; Schroer C. G.; Vignolini S.; Sepe A. Evolutionary-Optimized Photonic Network Structure in White Beetle Wing Scales. Adv. Mater. 2018, 30, 1702057. 10.1002/adma.201702057. [DOI] [PubMed] [Google Scholar]
- Robbins S. W.; Beaucage P. A.; Sai H.; Tan K. W.; Werner J. G.; Sethna J. P.; DiSalvo F. J.; Gruner S. M.; Van Dover R. B.; Wiesner U. Block copolymer self-assembly-directed synthesis of mesoporous gyroidal superconductors. Sci. Adv. 2016, 2, e1501119. 10.1126/sciadv.1501119. [DOI] [PMC free article] [PubMed] [Google Scholar]
- Sutton P.; Bennington P.; Patel S. N.; Stefik M.; Wiesner U. B.; Nealey P. F.; Steiner U.; Gunkel I. Surface Reconstruction Limited Conductivity in Block-Copolymer Li Battery Electrolytes. Adv. Funct. Mater. 2019, 29, 1905977. 10.1002/adfm.201905977. [DOI] [Google Scholar]
- Hur K.; Francescato Y.; Giannini V.; Maier S. A.; Hennig R. G.; Wiesner U. Three-Dimensionally Isotropic Negative Refractive Index Materials from Block Copolymer Self-Assembled Chiral Gyroid Networks. Angew. Chem., Int. Ed. 2011, 50, 11985–11989. 10.1002/anie.201104888. [DOI] [PubMed] [Google Scholar]
- Kilchoer C.; Abdollahi N.; Dolan J. A.; Abdelrahman D.; Saba M.; Wiesner U.; Steiner U.; Gunkel I.; Wilts B. D. Strong Circular Dichroism in Single Gyroid Optical Metamaterials. Adv. Opt. Mater. 2020, 8, 1902131. 10.1002/adom.201902131. [DOI] [Google Scholar]
- Dolan J. A.; Dehmel R.; Demetriadou A.; Gu Y.; Wiesner U.; Wilkinson T. D.; Gunkel I.; Hess O.; Baumberg J. J.; Steiner U.; Saba M.; Wilts B. D. Metasurfaces Atop Metamaterials: Surface Morphology Induces Linear Dichroism in Gyroid Optical Metamaterials. Adv. Mater. 2019, 31, 1803478. 10.1002/adma.201803478. [DOI] [PubMed] [Google Scholar]
- Michielsen K.; Stavenga D. G. Gyroid cuticular structures in butterfly wing scales: biological photonic crystals. Journal of The Royal Society Interface 2008, 5, 85–94. 10.1098/rsif.2007.1065. [DOI] [PMC free article] [PubMed] [Google Scholar]
- Feng X.; Burke C. J.; Zhuo M.; Guo H.; Yang K.; Reddy A.; Prasad I.; Ho R.-M.; Avgeropoulos A.; Grason G. M.; Thomas E. L. Seeing mesoatomic distortions in soft-matter crystals of a double-gyroid block copolymer. Nature 2019, 575, 175–179. 10.1038/s41586-019-1706-1. [DOI] [PubMed] [Google Scholar]
- Reddy A.; Feng X.; Thomas E. L.; Grason G. M. Block Copolymers beneath the Surface: Measuring and Modeling Complex Morphology at the Subdomain Scale. Macromolecules 2021, 54, 9223–9257. 10.1021/acs.macromol.1c00958. [DOI] [Google Scholar]
- Meuler A. J.; Hillmyer M. A.; Bates F. S. Ordered Network Mesostructures in Block Polymer Materials. Macromolecules 2009, 42, 7221–7250. 10.1021/ma9009593. [DOI] [Google Scholar]
- Karpov D.; Djeghdi K.; Holler M.; et al. High-resolution three-dimensional imaging of topological textures in nanoscale single-diamond networks. Nat. Nanotechnol. 2024, 10.1038/s41565-024-01735-w. [DOI] [PubMed] [Google Scholar]
- Bailey T. S.; Pham H. D.; Bates F. S. Morphological Behavior Bridging the Symmetric AB and ABC States in the Poly(styrene-bisoprene-b-ethylene oxide) Triblock Copolymer System. Macromolecules 2001, 34, 6994–7008. 10.1021/ma0103371. [DOI] [Google Scholar]
- Hadjichristidis N.; Iatrou H.; Pitsikalis M.; Pispas S.; Avgeropoulos A. Linear and non-linear triblock terpolymers, Synthesis, selfassembly in selective solvents and in bulk. Prog. Polym. Sci. 2005, 30, 725–782. 10.1016/j.progpolymsci.2005.04.001. [DOI] [Google Scholar]
- Chang C.-Y.; Manesi G.-M.; Yang C.-Y.; Hung Y.-C.; Yang K.-C.; Chiu P.-T.; Avgeropoulos A.; Ho R.-M. Mesoscale networks and corresponding transitions from self-assembly of block copolymers. Proc. Natl. Acad. Sci. U. S. A. 2021, 118, e2022275118. 10.1073/pnas.2022275118. [DOI] [PMC free article] [PubMed] [Google Scholar]
- Vignolini S.; Yufa N. A.; Cunha P. S.; Guldin S.; Rushkin I.; Stefik M.; Hur K.; Wiesner U.; Baumberg J. J.; Steiner U. A 3D Optical Metamaterial Made by Self-Assembly. Adv. Mater. 2012, 24, OP23–OP27. 10.1002/adma.201103610. [DOI] [PubMed] [Google Scholar]
- Li Z.; Hur K.; Sai H.; Higuchi T.; Takahara A.; Jinnai H.; Gruner S. M.; Wiesner U. Linking experiment and theory for threedimensional networked binary metal nanoparticle-triblock terpolymer superstructures. Nat. Commun. 2014, 5, 3247. 10.1038/ncomms4247. [DOI] [PubMed] [Google Scholar]
- Wang H.-F.; Chiu P.-T.; Yang C.-Y.; Xie Z.-H.; Hung Y.-C.; Lee J.-Y.; Tsai J.-C.; Prasad I.; Jinnai H.; Thomas E. L.; Ho R.-M.; et al. Networks with controlled chirality via self-assembly of chiral triblock terpolymers. Sci. Adv. 2020, 6, eabc3644. 10.1126/sciadv.abc3644. [DOI] [PMC free article] [PubMed] [Google Scholar]
- Hashimoto T.; Nishikawa Y.; Tsutsumi K. Identification of the “Voided Double-Gyroid-Channel”: a new morphology in block copolymers. Macromolecules 2007, 40, 1066–1066. 10.1021/ma061739h. [DOI] [Google Scholar]
- Lee B.; Park I.; Yoon J.; Park S.; Kim J.; Kim K.-W.; Chang T.; Ree M. Structural Analysis of Block Copolymer Thin Films with Grazing Incidence Small-Angle X-ray Scattering. Macromolecules 2005, 38, 4311–4323. 10.1021/ma047562d. [DOI] [Google Scholar]
- Suzuki J.; Seki M.; Matsushita Y. The tricontinuous double-gyroid structure from a three-component polymer system. J. Chem. Phys. 2000, 112, 4862–4868. 10.1063/1.481089. [DOI] [Google Scholar]
- Fasolka M. J.; Mayes A. M. Block Copolymer Thin Films: Physics and Applications. Annu. Rev. Mater. Res. 2001, 31, 323–355. 10.1146/annurev.matsci.31.1.323. [DOI] [Google Scholar]
- Hamley I. W. Ordering in thin films of block copolymers: Fundamentals to potential applications. Prog. Polym. Sci. 2009, 34, 1161–1210. 10.1016/j.progpolymsci.2009.06.003. [DOI] [Google Scholar]
- Paradiso S. P.; Delaney K. T.; García-Cervera C. J.; Ceniceros H. D.; Fredrickson G. H. Block Copolymer Self Assembly during Rapid Solvent Evaporation: Insights into Cylinder Growth and Stability. ACS Macro Lett. 2014, 3, 16–20. 10.1021/mz400572r. [DOI] [PubMed] [Google Scholar]
- Dolan J. A.; Korzeb K.; Dehmel R.; Gödel K. C.; Stefik M.; Wiesner U.; Wilkinson T. D.; Baumberg J. J.; Wilts B. D.; Steiner U.; Gunkel I. Controlling Self-Assembly in Gyroid Terpolymer Films By Solvent Vapor Annealing. Small 2018, 14, 1802401. 10.1002/smll.201802401. [DOI] [PubMed] [Google Scholar]
- Jo S.; Park H.; Jun T.; Kim K.; Jung H.; Park S.; Lee B.; Lee S.; Ryu D. Y. Symmetry-breaking in double gyroid block copolymer films by non-affine distortion. Applied Materials Today 2021, 23, 101006. 10.1016/j.apmt.2021.101006. [DOI] [Google Scholar]
- Miyata T.; Wang H.-F.; Suenaga T.; Watanabe D.; Marubayashi H.; Jinnai H. Dislocation-Induced Defect Formation in a Double- Gyroid Network. Macromolecules 2022, 55, 8143–8149. 10.1021/acs.macromol.2c01298. [DOI] [Google Scholar]
- Holzer L.; Indutnyi F.; Gasser P.; Münch B.; Wegmann M. Three-dimensional analysis of porous BaTiO3 ceramics using FIB nanotomography. J. Microsc. 2004, 216, 84–95. 10.1111/j.0022-2720.2004.01397.x. [DOI] [PubMed] [Google Scholar]
- Han L.; Che S. An Overview of Materials with Triply Periodic Minimal Surfaces and Related Geometry: From Biological Structures to Self-Assembled Systems. Adv. Mater. 2018, 30, 1705708. 10.1002/adma.201705708. [DOI] [PubMed] [Google Scholar]
- Zeng X.; Poppe S.; Lehmann A.; Prehm M.; Chen C.; Liu F.; Lu H.; Ungar G.; Tschierske C. A Self-Assembled Bicontinuous Cubic Phase with a Single-Diamond Network. Angew. Chem. 2019, 131, 7453–7457. 10.1002/ange.201902677. [DOI] [PubMed] [Google Scholar]
- He M.; Gales J. P.; Ducrot É.; Gong Z.; Yi G.-R.; Sacanna S.; Pine D. J. Colloidal diamond. Nature 2020, 585, 524–529. 10.1038/s41586-020-2718-6. [DOI] [PubMed] [Google Scholar]
- Qin J.; Bates F. S.; Morse D. C. Phase Behavior of Nonfrustrated ABC Triblock Copolymers: Weak and Intermediate Segregation. Macromolecules 2010, 43, 5128–5136. 10.1021/ma100400q. [DOI] [Google Scholar]
- Matsen M. W.; Schick M. Stable and unstable phases of a diblock copolymer melt. Phys. Rev. Lett. 1994, 72, 2660–2663. 10.1103/PhysRevLett.72.2660. [DOI] [PubMed] [Google Scholar]
- Matsen M. W.; Bates F. S. Origins of complex self-assembly in block copolymers. Macromolecules 1996, 29, 7641–7644. 10.1021/ma960744q. [DOI] [Google Scholar]
- Matsen M. W. Phase Behavior of Block Copolymer/Homopolymer Blends. Macromolecules 1995, 28, 5765–5773. 10.1021/ma00121a011. [DOI] [Google Scholar]
- Takagi H.; Yamamoto K.; Okamoto S. Ordered-bicontinuous-double-diamond structure in block copolymer/homopolymer blends. EPL 2015, 110, 48003. 10.1209/0295-5075/110/48003. [DOI] [Google Scholar]
- Sheng Q.; Chen H.; Mao W.; Cui C.; Che S.; Han L. Self-Assembly of Single-Diamond-Surface Networks. Angew. Chem., Int. Ed. 2021, 60, 15236–15242. 10.1002/anie.202102056. [DOI] [PubMed] [Google Scholar]
- Asai Y.; Suzuki J.; Aoyama Y.; Nishioka H.; Takano A.; Matsushita Y. Tricontinuous Double Diamond Network Structure from Binary Blends of ABC Triblock Terpolymers. Macromolecules 2017, 50, 5402–5411. 10.1021/acs.macromol.7b00403. [DOI] [Google Scholar]
- Takagi W.; Suzuki J.; Aoyama Y.; Mihira T.; Takano A.; Matsushita Y. Bicontinuous Double-Diamond Structures Formed in Ternary Blends of AB Diblock Copolymers with Block Chains of Different Lengths. Macromolecules 2019, 52, 6633–6640. 10.1021/acs.macromol.9b00724. [DOI] [Google Scholar]
- Creutz S.; Teyssié P.; Jérôme R. Living Anionic Homopolymerization and Block Copolymerization of (Dimethylamino)ethyl Methacrylate. Macromolecules 1997, 30, 6–9. 10.1021/ma961009h. [DOI] [Google Scholar]
- Hild G.; Lamps J.-P. Diblock copolymers, triblock copolymers andmodel networks synthesized by sequential anionic polymerization of styrene and 2,3-epoxypropyl methacrylate. Polymer 1998, 39, 2637–2649. 10.1016/S0032-3861(97)00578-8. [DOI] [Google Scholar]
- Basham M.; Filik J.; Wharmby M. T.; Chang P. C. Y.; El Kassaby B.; Gerring M.; Aishima J.; Levik K.; Pulford B. C. A.; Sikharulidze I.; Sneddon D.; Webber M.; Dhesi S. S.; Maccherozzi F.; Svensson O.; Brockhauser S.; Náray G.; Ashton A. W. Data Analysis WorkbeNch (DAWN). Journal of Synchrotron Radiation 2015, 22, 853–858. 10.1107/S1600577515002283. [DOI] [PMC free article] [PubMed] [Google Scholar]
- Jiang Z.; Li X.; Strzalka J.; Sprung M.; Sun T.; Sandy A. R.; Narayanan S.; Lee D. R.; Wang J. The dedicated high-resolution grazing-incidence X-ray scattering beamline 8-ID-E at the Advanced Photon Source. Journal of synchrotron radiation 2012, 19, 627–636. 10.1107/S0909049512022017. [DOI] [PubMed] [Google Scholar]
- Ilavsky J. Nika: software for two-dimensional data reduction. J. Appl. Crystallogr. 2012, 45, 324–328. 10.1107/S0021889812004037. [DOI] [Google Scholar]
- Holler M.; Raabe J.; Wepf R.; Shahmoradian S. H.; Diaz A.; Sarafimov B.; Lachat T.; Walther H.; Vitins M. OMNY PINA versatile sample holder for tomographic measurements at room and cryogenic temperatures. Rev. Sci. Instrum. 2017, 88, 113701. 10.1063/1.4996092. [DOI] [PubMed] [Google Scholar]
- Rodenburg J. M.; Faulkner H. M. L. A phase retrieval algorithm for shifting illumination. Appl. Phys. Lett. 2004, 85, 4795–4797. 10.1063/1.1823034. [DOI] [Google Scholar]
- Holler M.; Diaz A.; Guizar-Sicairos M.; Karvinen P.; Färm E.; Härkönen E.; Ritala M.; Menzel A.; Raabe J.; Bunk O. X-ray ptychographic computed tomography at 16 nm isotropic 3D resolution. Sci. Rep. 2014, 4, 3857. 10.1038/srep03857. [DOI] [PMC free article] [PubMed] [Google Scholar]
- Holler M.; Raabe J. Error motion compensating tracking interferometer for the position measurement of objects with rotational degree of freedom. Optical Engineering 2015, 54, 054101–054101. 10.1117/1.OE.54.5.054101. [DOI] [Google Scholar]
- Odstrčil M.; Lebugle M.; Guizar-Sicairos M.; David C.; Holler M. Towards optimized illumination for high-resolution ptychography. Opt. Express 2019, 27, 14981–14997. 10.1364/OE.27.014981. [DOI] [PubMed] [Google Scholar]
- Odstrcil M.; Lebugle M.; Lachat T.; Raabe J.; Holler M. Fast positioning for X-ray scanning microscopy by a combined motion of sample and beam-defining optics. Journal of Synchrotron Radiation 2019, 26, 504–509. 10.1107/S160057751801785X. [DOI] [PMC free article] [PubMed] [Google Scholar]
- Huang X.; Yan H.; Harder R.; Hwu Y.; Robinson I. K.; Chu Y. S. Optimization of overlap uniformness for ptychography. Opt. Express 2014, 22, 12634–12644. 10.1364/OE.22.012634. [DOI] [PubMed] [Google Scholar]
- Dinapoli R.; Bergamaschi A.; Henrich B.; Horisberger R.; Johnson I.; Mozzanica A.; Schmid E.; Schmitt B.; Schreiber A.; Shi X.; et al. EIGER: Next generation single photon counting detector for X-ray applications. Nuclear Instruments and Methods in Physics Research Section A: Accelerators, Spectrometers, Detectors and Associated Equipment 2011, 650, 79–83. 10.1016/j.nima.2010.12.005. [DOI] [Google Scholar]
- Kaestner A. P.; Münch B.; Trtik P. Spatiotemporal computed tomography of dynamic processes. Opt. Eng. 2011, 50, 123201. 10.1117/1.3660298. [DOI] [Google Scholar]
- Howells M.; Beetz T.; Chapman H.; Cui C.; Holton J.; Jacobsen C.; Kirz J.; Lima E.; Marchesini S.; Miao H.; Sayre D.; Shapiro D.; Spence J.; Starodub D. An assessment of the resolution limitation due to radiation-damage in X-ray diffraction microscopy. J. Electron Spectrosc. Relat. Phenom. 2009, 170, 4–12. 10.1016/j.elspec.2008.10.008. [DOI] [PMC free article] [PubMed] [Google Scholar]
- Henke B.; Gullikson E.; Davis J. X-Ray Interactions: Photoabsorption, Scattering, Transmission, and Reflection at E = 50–30,000 eV, Z = 1–92. Atomic Data and Nuclear Data Tables 1993, 54, 181–342. 10.1006/adnd.1993.1013. [DOI] [Google Scholar]
- Wakonig K.; Stadler H.-C.; Odstrcil M.; Tsai E. H. R.; Diaz A.; Holler M.; Usov I.; Raabe J.; Menzel A.; Guizar-Sicairos M. PtychoShelves, a versatile high-level framework for high-performance analysis of ptychographic data. J. Appl. Crystallogr. 2020, 53, 574–586. 10.1107/S1600576720001776. [DOI] [PMC free article] [PubMed] [Google Scholar]
- Odstrčil M.; Menzel A.; Guizar-Sicairos M. Iterative least-squares solver for generalized maximum-likelihood ptychography. Opt. Express 2018, 26, 3108–3123. 10.1364/OE.26.003108. [DOI] [PubMed] [Google Scholar]
- Guizar-Sicairos M.; Diaz A.; Holler M.; Lucas M. S.; Menzel A.; Wepf R. A.; Bunk O. Phase tomography from x-ray coherent diffractive imaging projections. Opt. Express 2011, 19, 21345–21357. 10.1364/OE.19.021345. [DOI] [PubMed] [Google Scholar]
- Odstrčil M.; Holler M.; Raabe J.; Guizar-Sicairos M. Alignment methods for nanotomography with deep subpixel accuracy. Opt. Express 2019, 27, 36637–36652. 10.1364/OE.27.036637. [DOI] [PubMed] [Google Scholar]
- van Heel M.; Schatz M. Fourier shell correlation threshold criteria. J. Struct. Biol. 2005, 151, 250–262. 10.1016/j.jsb.2005.05.009. [DOI] [PubMed] [Google Scholar]
- Schindelin J.; Arganda-Carreras I.; Frise E.; Kaynig V.; Longair M.; Pietzsch T.; Preibisch S.; Rueden C.; Saalfeld S.; Schmid B.; Tinevez J. Y.; White D. J.; Hartenstein V.; Eliceiri K.; Tomancak P.; Cardona A. Fiji: An open-source platform for biological-image analysis. Nat. Methods 2012, 9, 676–682. 10.1038/nmeth.2019. [DOI] [PMC free article] [PubMed] [Google Scholar]
- Arganda-Carreras I.; Kaynig V.; Rueden C.; Eliceiri K. W.; Schindelin J.; Cardona A.; Seung H. S. Trainable Weka Segmentation: A machine learning tool for microscopy pixel classification. Bioinformatics 2017, 33, 2424–2426. 10.1093/bioinformatics/btx180. [DOI] [PubMed] [Google Scholar]
- Djeghdi K., Karpov D., Abdollahi S. N., Godlewska K., Holler M., Donnelly C., Yuasa T., Sai H., Wiesner U. B., Steiner U., Wilts B. D., Musya M., Fukami S., Ohno H., Diaz A., Llandro J., Gunkel I.. X-ray nanotomography reveals formation of single diamonds by block copolymer self-assembly. arXiv Preprint (Condensed Matter, Soft Condensed Matter), 2023. arXiv:2304.12027. https://arxiv.org/abs/2304.12027 (accessed 2024-07-11).
Associated Data
This section collects any data citations, data availability statements, or supplementary materials included in this article.
Supplementary Materials
Data Availability Statement
The raw data used in this study are permanently archived at the Paul Scherrer Institute repository and can be accessed at: http://doi.psi.ch/detail/10.16907/409237cf-63de-43ca-b525-a68025a93d63. Additionally, part of the raw data, all derived data, and the Matlab scripts used for data analysis are available in the Zenodo repository under the following DOI: 10.5281/zenodo.7849558.