

Abstract
Cancer cells are generally exposed to numerous extrinsic stimulations in the tumor microenvironment. In this environment, cancer cells change their expression profiles to fight against circumstantial stresses, allowing their progression in the challenging tissue space. Technological advancements of spatial omics have had substantial influence on cancer genomics. This technical progress, especially that occurring in the spatial transcriptome, has been drastic and rapid. Here, we describe the latest spatial analytical technologies that have allowed omics feature characterization to retain their spatial and histopathological information in cancer tissues. Several spatial omics platforms have been launched, and the latest platforms finally attained single‐cell level or even higher subcellular level resolution. We discuss several key papers elucidating the initial utility of the spatial analysis. In fact, spatial transcriptome analyses reveal comprehensive omics characteristics not only in cancer cells but also their surrounding cells, such as tumor infiltrating immune cells and cancer‐associated fibroblasts. We also introduce several spatial omics platforms. We describe our own attempts to investigate molecular events associated with cancer progression. Furthermore, we discuss the next challenges in analyzing the multiomics status of cells, including their morphology and location. These novel technologies, in conjunction with spatial transcriptome analysis and, more importantly, with histopathology, will elucidate even novel key aspects of the intratumor heterogeneity of cancers. Such enhanced knowledge is expected to open a new path for overcoming therapeutic resistance and eventually to precisely stratify patients.
Keywords: cancer progression, multiomics, single‐cell resolution, spatial transcriptome, tumor microenvironment
Here, we have introduced the latest spatial analytical technologies, which has allowed characterization of omics features retaining their spatial and histopathological information in cancer tissues. We also summarized several key papers elucidating the utility of the spatial omics analysis for cancer research.

1. INTRODUCTION
Technological developments have been expeditiously progressing for spatial omics analyses. 1 , 2 Unlike conventional single‐cell technologies, mRNA expression profiles of cells are obtained while retaining the histopathological characteristics of the tissue. Hence, understanding the diverse behaviors of cancer cells should be the key step towards elucidating the molecular basis for different phonotypes. Growing evidence has indicated that the diverse gene expression status of cancer cells, in addition to their genomic mutations, should provide a molecular base for such diversity, although their details remain elusive. Generally, cancer cells are supposed to obtain a new ability for survival and fit to the environment, enabling their further proliferation, invasion, and acquired resistance to attacks, through epigenomic and transcriptomic changes. 3 , 4 Such changes are also supposed to be realized as a result of the interaction with surrounding normal cells. In addition to cancer cells, cancer tissues include several types of normal cells. These stromal cells initially reveal the expression patterns to exclude cancer cells. Inflammatory cytokines are expressed to recruit cytotoxic immune cells and attack cancer cells. However, at a particular step, they change their expression patterns to provide cancer cells with a favorable condition. These changes are invoked by the interaction with cancer cells and form a distinctive tumor microenvironment (TME). TME conditions constantly change during cancer progression, 5 such as invasiveness, metastasis, 6 relapse, and therapeutic responses, 7 which vary depending on the cancer regions and between different patients. One of the main purposes of the spatial omics analysis is to obtain a comprehensive molecular view of TMEs. To elucidate diverse and locally distinctive omics features of cancer tissues, spatial omics profiling is actively conducted. 8 New technologies are providing a direct measure for molecular mechanisms of cancer progression, which will lead to a new avenue of molecular intervention for therapeutic strategies. In this review, we introduce recent updates of spatial transcriptome platforms and their expanding applications to cancer omics studies.
2. RAPID DEVELOPMENT OF SPATIAL TRANSCRIPTOME PLATFORMS
In the last 10 years, several single‐cell RNA‐seq (scRNA‐seq) 9 studies have unveiled transcriptome features in cancer tissues. 10 However, the spatial information of each individual cell is usually lost when tissues are dissociated for single‐cell separation. A so‐called spatial analysis has been contemplated to overcome this drawback. Spatial omics analysis examines the entire tissue to observe the physical interrelation of their residing cells, not in the cell‐by‐cell manner of the dissociated cells. Thus, the generated data should provide an ideal reference to map the obtained comprehensive cell catalogue from scRNA‐seq. The spatial transcriptome data more directly represents how the gene expressions are influencing each other between cancer cells and stromal cells in situ.
One of the first commercial platforms of spatial transcriptome analysis was Visium (10× Genomics). This platform was developed according to Spatial Transcriptomics 11 and has rapidly spread to numerous research fields including cancer studies. The initial version of Visium measured transcriptome profiles in 5000 spots within a 55‐μm diameter (100‐μm between the centers). Although it did not have a single‐cell resolution, it could capture all the mRNAs which are transcribed in a given region. Briefly, Visium captures poly‐A+ RNAs, which are released from tissue, to the barcoded oligos, which are covalently attached to the slide glass. For those barcodes, their sequences are designed to be unique to each XY coordinate of the spot. The mRNAs, which are captured at each spot, are used as templates for the reverse transcriptions, leading to the generation of the cDNAs with the barcode sequences at their ends. The sequencing library is generated by taking the cDNA pieces together and subjected them to sequencing analysis. To reconstruct the local gene expression profiles, the obtained sequencing tags were separated based on their barcode sequences, which are unique to their originating spot. In the later version of Visium, instead of the endogenous mRNAs, the synthetic probes, which are designed for all genes, are first absorbed in the tissue and used for the following analyses as mRNA surrogates. This step allows the use of formalin‐fixed paraffin‐embedded (FFPE) specimens, in which mRNAs themselves are likely to be highly degraded. In 2024, the almost single‐cell resolution was finally achieved through the reduction of the size of the spot (Visium HD). With Visium as the pioneering and the most common platform, other technologies have been developed, attempting to improve the spatial resolution. In this context, two main types of techniques exist: spatial‐barcoding/sequencing‐based methods and imaging‐based methods 2 (Table 1). There are specific advantages in each platform, for example, regarding spatial resolution, applicable sample types, and the number of detectable genes. 12
TABLE 1.
Characteristics of each spatial transcriptome platform.
| Category | Platform | Detectable genes | Resolution | Analytical region | Staining for cell segmentation |
|---|---|---|---|---|---|
| Sequencing‐based | Visium HD | WT (probe) a | 2‐μm square spot, no gaps | 6.5 mm × 6.5 mm/area (2 areas/slide) | None |
| Sequencing‐based | STOmics | WT | 220‐nm spot in diameter, 500 nm center‐to‐center | 10 mm × 10 mm | Nuclei (ssDNA) |
| Imaging‐based | Xenium | ~480 (tissue panel), 5000 (5000‐plex panel) | <30 nm XY localization, 200 nm per‐pixel resolution | 10.45 mm × 22.45 mm/slide (2 slide/run) | Nuclei (+ membrane, cytoplasmic RNA/protein d ) |
| Imaging‐based | CosMx | 1000 (universal panel), 6000 (6 K panel) | <50 nm XY plane | 15 mm × 20 mm (0.5 mm × 0.5 mm/FOV b ) | Nuclei, membrane, morphology marker proteins e |
| Imaging‐based | MERSCOPE | 500 (pre‐designed), ~1000 (custom) | ≤100 nm | Total ~ 100 mm2 (up to 10 regions), ~300 mm2 c | Nuclei, PolyT, 3 cell boundary stains f |
Abbreviation: WT, whole transcriptome.
Only human and mouse probe sets are provided for Visium HD.
Field of Views (FOVs) should be selected before the run. Increasing the number of FOVs needs more run time.
The next MERSCOPE (MERSCOPE Ultra system) has been announced, which enables measuring the 300 mm2 image area.
Xenium can used with multimodal cell segmentation kit.
Several cell segmentation kits (universal or neuroscience for human and mouse) were provided.
Cell boundary staining kit includes a reagent for staining three proteins.
2.1. Sequencing‐based spatial gene expression platforms
The commercially available sequencing‐based platforms as of 2024 are described in Figure 1.
FIGURE 1.
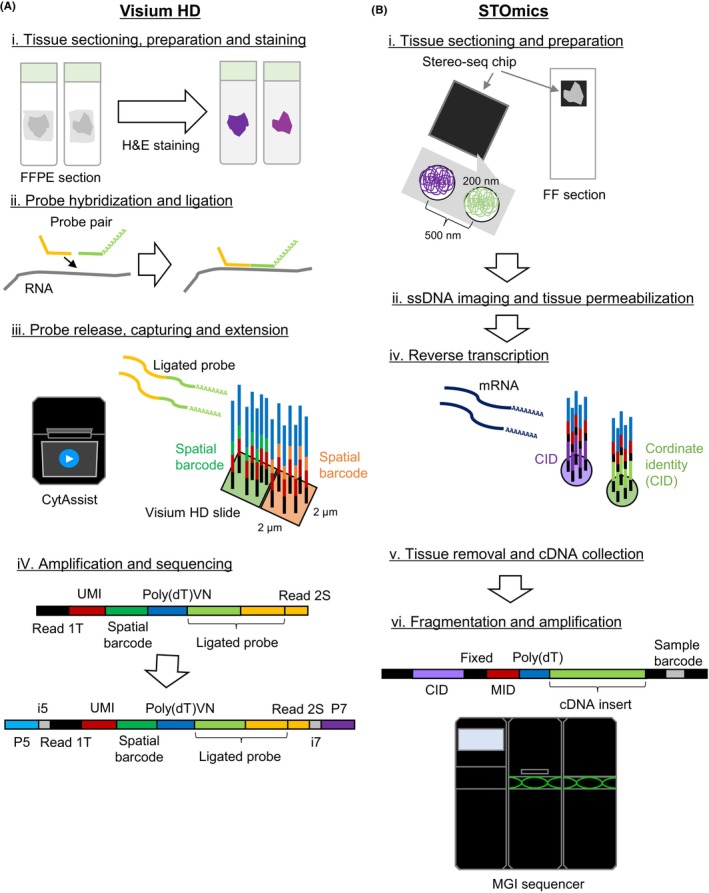
Sequencing‐based spatial transcriptome platforms. The workflows of Visium HD and STOmics are illustrated in (A) and (B), respectively.
2.1.1. Visium HD (10× Genomics)
Visium HD is the latest version of Visium for high resolution analysis (Figure 1A). Although the current application is limited to humans and mice only, it generates a 2‐μm‐resolution whole‐transcriptome profile at minimum. The obtained data are generally collected and summed to the 8‐μm‐square bin (or to any user‐preferred bin size) to conduct the single cell‐level analysis. Importantly, unlike the previous versions of Visium, those bins are “tiled” without any gaps in between and, thus, are not referred to as “spots” anymore. Clustering analyses through a larger bin size (16‐μm square bin) would also be powerful if a larger number of sequencing tags were needed in each bin. It is possible to obtain expression profiles for a single cell, in addition to the bin‐based analysis, by using cell boundary data (cell segmentation data), which is obtained from H&E imaging or other tissue imaging data. Similarly, recounting transcripts (still binned at 2 μm) for each segmented cell area are summed. We have also conducted the Visium HD analysis using four lung cancer tissues. From the total read count of 500 million, we detected 258–416 transcripts per 8‐μm bin. More transcripts were detected in tumor cells than those in other normal regions, reflecting the fact that mRNA contents are higher in cancer cells. However, the sequencing saturation rates are still quite low (31%–63%). Therefore, increasing sequencing depths should enrich the data contents.
2.1.2. Stereo‐seq technology 13
This technology, also known as STOmics (MGI), is another high‐resolution platform of spatial transcriptome analysis (Figure 1B). It is based on DNA Nano Ball arrays of MGI sequencers, including DNBSEQ‐T7 and G400, and allows capturing of mRNA molecules through poly‐dT oligos in each 200‐nm spot (500‐nm distance each). Essentially, the procedure is followed as for Visium. Expression profiles are measured in each binned square (or cell bin), and numerous bin sizes can be selected in accordance with the research purpose. Bin 50 (50 × 50 = 2500 spots) and bin 200 (4000 spots) data, for example, could be used for pathway‐level analyses for tumor cells. A cell bin analysis would be suited for subtyping microenvironmental cells at a single‐cell resolution. In 2024, the protocol for FFPE samples (Stereo‐seq OMNI) was also published. Random primers, referred to as “Free Probe,” are designed to capture total RNA (and also microbial RNA) for analyzing fragmented RNA samples from FFPE specimens. Thus, the strategy is different from the FFPE version of Visium.
2.2. Imaging‐based spatial gene expression analytical platform
Several methods have been developed by combining in situ hybridization (ISH) and fluorescence imaging to attain higher spatially resolved RNA profiling. In particular, FISH‐based methods have been released during the era for spatial analyses, starting from smFISH. 14 Furthermore, Cai's group reported seqFISH 15 and its updated method seqFISH+. 16 seqFISH+ renders primary probes to hybridize to RNAs and readout these probes through fluorescent probes multiple times, finally resulting in 10,000‐gene detections for thousands of cells. Conversely, in situ sequencing, 17 FISSEQ, 18 , 19 and HybISS 20 have also emerged for a more sensitive detection of each of the transcripts. These techniques commonly amplify probes hybridized to RNAs or cDNA molecules by rolling circular amplification (RCA) and decode the RCA amplicons through fluorescence.
As of 2024, below are commercially available platforms in this category (Figure 2).
FIGURE 2.
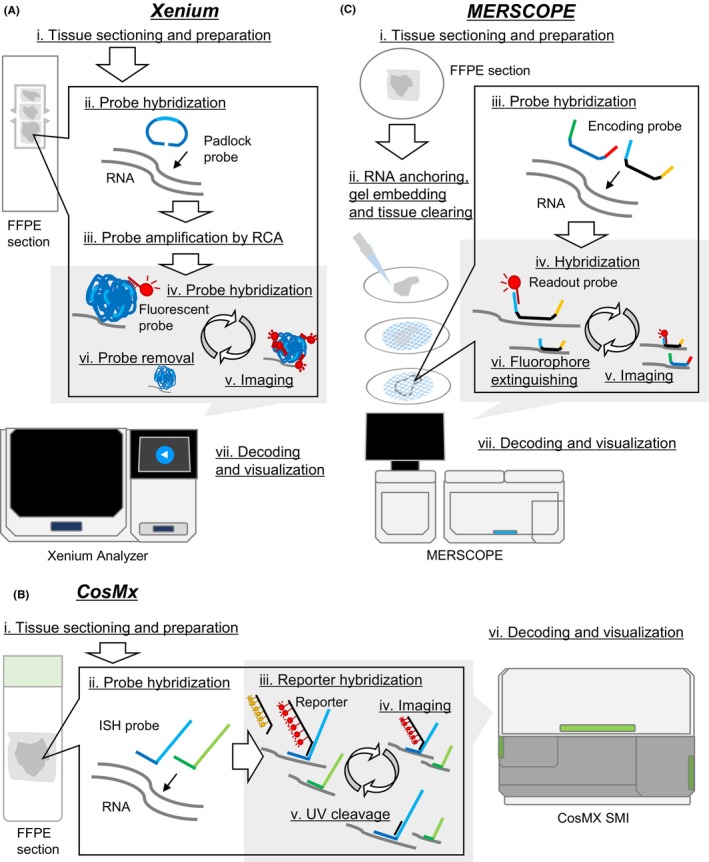
Imaging‐based spatial transcriptome platforms. The Xenium, CosMx, and MERSCOPE workflows are shown in (A), (B), and (C), respectively.
2.2.1. Xenium (10× Genomics) 21 , 22
The most popular commercially launched platform is Xenium. It includes a stable (or relatively heavy) amplification step (Figure 2A). The padlock probes are designed for the target genes in advance, and they are hybridized to RNA within a tissue section and then ligated in the tissue. The probes, which are amplified by RCA, can be decoded through multiple cycles of hybridization and detection of fluorescent probes. Finally, each transcript appears as an amplified “dot” in the image merged with nuclei staining. In our study of lung adenocarcinoma, 23 we detected 105 transcripts (46 genes, median) in each cell using the 302‐gene custom panel, which allowed us to clearly annotate cell types (Figure 3). A benchmarking paper also referred to the high‐detection performance of Xenium. 12 One year after its launch and intensive use worldwide, some shortcomings of Xenium have been observed. Namely, the number of detected genes in Xenium is occasionally insufficient to characterize the key networks of tumor cells on its own. Moreover, the cell type classification would be highly dependent on the panel design. Some types of cells could not be classified when no probes are set to the marker gene. Xenium 5000‐plex is released to overcome these limitations. This update is expected to enable a more comprehensive measurement.
FIGURE 3.
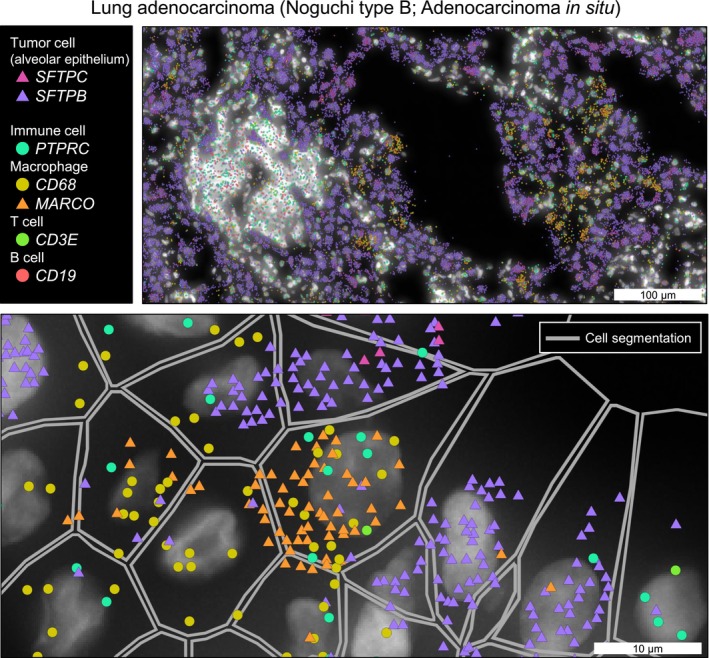
The representative image of single‐cell spatial transcriptome. Xenium analysis image of a representative case of early lung adenocarcinoma. 23 Visualization was performed using Xenium Explorer.
2.2.2. CosMx (NanoString) 24
CosMx is also a representative platform of in situ gene expression profiling (Figure 2B). CosMx uses the ISH probes for hybridizing to target RNAs and the reporters with photocleavable (PC) linkers for detecting the ISH probes. After detection of fluorescent signals, the signals are quickly quenched through cleavage of PC linkers by UV, and the next reporter set hybridizes and the readout cycle starts. Using this platform, Tsubosaka et al. 25 constructed the largest human stomach cell atlas and successfully identified potential uncharacterized stem cell clusters in the gastric mucosa. CosMx has now provided 1000‐gene panels and also just started to release the 6 K Discovery panel for the 6000‐plex analysis.
2.2.3. MERSCOPE (Vizgen)
MERSCOPE is a commercialized platform of MERFISH, 26 which is an extension of smFISH (Figure 2C). Encoding probes are hybridized to target RNAs. For scaling up the detectable numbers of RNA, binary barcoding (absence or presence of fluorescence in each round of detection) is used multiple times; readout probes recognize the hybridized encoding probes, fluorescent signals are detected, the fluorescence is eliminated, and the reaction proceeds to the next round. No amplification for detection is performed, unlike Xenium or CosMX, which is expected to reflect the true intracellular RNA content while requiring more probes to be hybridized. MERSCOPE has currently measured up to 1000 genes at a subcellular level. As an application, Allen Institute has constructed the cell atlas of the whole mouse brain, including approximately 4.3 million cells using this technology. 27
For these imaging‐based platforms, one of the largest common issues to overcome is “cell segmentation.” The technical advances allow generation of gene expression profiles at an increasingly higher spatial resolution than each individual cell. The region of cells needs to be defined to calculate the transcript counts in each cell. In the commercial platforms, their own computational pipelines are provided for this purpose. However, some of these methods initially use only nuclei staining patterns; thus, the obtained results did not appear precise, which is a serious problem. If the cell segmentation is erroneous, some of the transcripts would be incorrectly assigned to the neighbor cells, which will lead to the incorrect interpretation of the spatial transcriptome profiles. Despite the general consensus that the precise cell segmentation should be an essential factor in understanding gene expression patterns in each cell, it is still difficult to completely trace precise cell size and shapes depending on cell types (e.g. dense lymphoid structures with small‐sized immune cells, spindle shapes of fibroblasts, and neurons). The methods are now being improved through simultaneous staining of membrane and cytoplasm in addition to nuclei. The obtained images are integrated with those of mRNAs. Collectively, those pieces of information serve as an input for further development of computational algorithms, occasionally using machine‐learning methods. 24 , 28 , 29 Thus, some computational methods have succeeded in realizing cell segmentation‐free analysis and interpretation, at least in representative tissue types. 30 , 31
3. SPATIAL TRANSCRIPTOME ANALYSIS REVEALS MOLECULAR EVENTS IN CANCER PROGRESSION
Heterogeneous transcriptome features in tumor tissues are being unveiled at a molecular level using spatial gene expression analytical methods. For breast cancers, numerous studies have focused on early invasion mechanisms from ductal carcinoma in situ (DCIS) to invasive ductal carcinoma (IDC). Using Visium combined with large‐scale targeted genome sequencing, Nagasawa et al., 32 one of the first reports of spatial omics analysis of cancers, identified GATA3 and its related pathways as one of the crucial factors for determining invasive phenotypes. Each individual milk duct, in which early breast cancer cells are harbored, is too small to be manually dissected to measure its expression patterns. In a given case of DCIS, through spatial data analysis of Visium, the DCIS lesions were successfully separated into three clusters according to their expression patterns. In particular, clusters 1 and 2 overlapped the duct edges that were invading and the duct center, respectively. In fact, the invading spots were clearly classified into the invasive cluster (cluster 1) and were clearly separated from the more benign/typical proliferative cluster (cluster 2), indicating substantial changes. We also analyzed and found that the upregulation of more malignant signals, such as epithelial–mesenchymal transition and angiogenesis pathways, were triggered in cluster 1. Conversely, pathways of typical proliferative signals of breast cancer, such as estrogen response pathways, were still active in cluster 2 but decreased in cluster 1. As another representative study, 10× Genomics has also reported a single‐cell and spatial transcriptome analysis for breast cancers. They mainly used three single‐cell and spatial transcriptome platforms: scFFPE (single‐cell analysis from FFPE specimens), Visium, and Xenium. They successfully identified myoepithelial boundary cells, which demonstrated intermediate expression of both tumor cell and myoepithelial cell markers. For invasion, the physical and biochemical barrier of myoepithelial cells should prevent tumor cell expansion to ensure that those cells indicate important molecular events in tumor cells invading towards IDC. Spatial transcriptome is powerful in characterizing such unknown status as the cell location can be referred for biological interpretation of the newly identified cell subtypes.
Further, we have analyzed differential molecular events during lung adenocarcinoma progression at very early stages. 23 Stages were separated according to Noguchi classification,33 which is the pathological classification method for small‐sized lung adenocarcinoma, and the expression profiles were inspected depending on different stages. For three early cases (Noguchi types A, B, and C), we conducted Visium analysis and found that expression patterns changed from the SFTPC (surfactant protein C)‐expressing well‐differentiated type to more malignant types in Noguchi type B and type C cases. For example, in a Noguchi type B case, higher FOS and JUN expression was exhibited in the local tissue region with fibrotic foci while surfactant proteins were highly expressed in other regions. These results showed that spatial transcriptome precisely captures gene expression changes in local regions, consistent with histopathological annotations.
4. ELUCIDATION OF TUMOR MICROENVIRONMENT COMPONENTS
The other strong point of spatial transcriptome analysis lies in the fact that it allows elucidation of subtypes and detailed conditions in surrounding normal cells. In our study of early adenocarcinoma, as mentioned above, 23 we also highlighted status changes of TME in addition to tumor cell progression and dedifferentiation. Interestingly, we noted that in the Noguchi type B case, two different types of alveolar macrophages, high FABP4‐expressing (normal‐like) and SPP1‐expressing (anti‐inflammatory) macrophages, mainly existed in the relatively malignant and fibrotic region. By complementing the spatial resolution of Visium, we confirmed these patterns of immune cells using Xenium and successfully verified that those macrophages co‐located there at a single‐cell level.
Molecular states of macrophages would bear the main axis for constructing a microenvironment specific to local regions in diverse subtypes of cancers; thus, they have attracted the interest of numerous researchers. 34 , 35 Mimori's group reported the locally distinctive immune cell distribution patterns and their relations to colon cancer phenotypes. First, focusing on the invasive front, Ozato et al. 36 demonstrated that HLA‐G+ tumor cells induced anti‐inflammatory SPP1+ macrophages through the integrative analysis of Visium and scRNA‐seq data. These macrophages supported immune suppression through repressing T‐cell cytotoxicity and activation of tumor cell progression with cellular interaction by various secreted proteins. In another study, this group also highlighted earlier phase changes of colon cancers. 37 In addition to SPP1+ macrophages, the MDK/SDC4 ligand‐receptor relationship and its mediated network were identified as a key regulator of Treg migration for conforming TME immunosuppression. Spatial transcriptome revealed that the complicated co‐localization and relationships of numerous types of cells and the possible molecular mechanisms for the formation of the anti‐inflammatory and immunosuppressive microenvironment uniquely occurred in each stage of colon cancers.
5. EVALUATION OF THE ASSOCIATION BETWEEN TUMOR MICROENVIRONMENT MOLECULAR FEATURES AND THERAPEUTIC OUTCOMES
The TME demonstrated substantial changes during therapy. In fact, substantial evidence reveals that the TME condition is one of the most important factors influencing the therapeutic outcomes of patients. In particular, dynamic changes of cellular interactions should provide essential information to presume the efficacy of immunotherapy. 38 Kageyama's group showed the changes in immune cell components after radiotherapy during the investigation of immunotherapy combined with RT and when the combination therapies should be used. 39 Combining Visium with scRNA‐seq and multiplex immunofluorescence analyses, PD‐L1+ myeloid cells should play a key role in upregulating immune‐response genes, including different co‐inhibitory factors, such as SIRPA and IDO1, after radiotherapy, which indicate the efficacy of the combinatorial therapy targeted to these molecules. Several other studies identified central factors of the TME niche and consequently constructed TME through spatial analysis, linking the initial efficacy and acquired resistance of therapeutic approaches and paving the way for controlling the TME for the next treatment. 34 , 40 Undoubtedly, the spatial transcriptome should help us in understanding the important association between TME and therapeutic responses. This approach will provide a pivotal guide for appropriate approaches and timing of therapies.
6. CONCLUSION AND FUTURE PERSPECTIVES
In this review, we have described recently developed spatial transcriptome platforms and summarized representative cancer studies using these techniques. Visium has spread very rapidly because of its usability as the first spatial transcriptome platform. The importance of whole‐transcriptome profiling in keeping with its spatial information was realized by the launch of this platform. However, only several years later, it became apparent that the spatial resolution was insufficient for measurement of individual cells, which limits the potential power of the spatial analysis. Several studies attempted to simultaneously obtain scRNA‐seq data and integrated them to complement the resolution and decompose cell type proportions. 41 10× Genomics compared their platforms and evaluated the advantages and weak points of each of the platforms. scFFPE can comprehensively detect gene expression at a single‐cell resolution, but it loses spatial information; Visum allows obtaining of spatial whole‐transcriptome data not at single‐cell levels; and Xenium is applicable for spatially‐ and cellular‐resolved gene expression data for a limited number of genes. As mentioned above, some disadvantages have already been addressed through recent technical updates. It has become an optimal but difficult moment when we have to select an appropriate platform among the latest spatial transcriptome platforms, depending on the purpose.
In particular, in this review, we have focused on spatial omics analysis at a transcriptome layer. However, challenges have already been found in multilayered profiling, such as genomic and epigenomic alterations. These would lead us to an even more precise understanding of how observed spatial diversities are realized and the kind of gene expression regulations and their changes. For genomic mutations, padlock probes can be designed for each mutation 42 ; thus, Xenium and other probe‐based platforms will be used for tracing the clonal evolution of cancers. Several spatial epigenomics which profile chromatin states in local regions have also been reported. 43 , 44 , 45 , 46 In the near future, we will be able to measure multiomics aberrations directly on cancer tissues and understand local cancer progression along with complicated TME statuses with more system‐level features.
Finally, spatial analysis can now analyze the subtle changes within the cell. For intracellular spatial molecular analysis, molecular pixelation technology (Pixelgen Technologies) has recently been released. This is a method that profiles expression, polarity, and mutual relationships of cell‐surface proteins. 47 Cell‐surface proteins are detected with antibody‐oligonucleotide conjugates (AOC), and their colocalization is detected by binding neighboring AOCs with DNA pixels, which are DNA concatemers. A flagship paper by Karlsson et al. 47 revealed that polarization and localization of cell‐surface proteins dynamically changed in T and B cells stimulated by chemokines and antibody drugs. In the current settings, 80 proteins can be simultaneously measured. We are still uncertain of how those intracellular features are read out to be a broader profile, such as effectiveness of drug treatment or clinical outcomes of the patients. However, these novel types of information should shed a brighter light on the cancer cell and TME biology. We need to continually surmise how these technologies should be used in cancer research.
AUTHOR CONTRIBUTIONS
Satoi Nagasawa: Investigation; supervision; writing – original draft; writing – review and editing. Junko Zenkoh: Investigation; visualization; writing – original draft; writing – review and editing. Yutaka Suzuki: Funding acquisition; investigation; project administration; supervision; writing – original draft; writing – review and editing. Ayako Suzuki: Conceptualization; funding acquisition; investigation; project administration; supervision; writing – original draft.
FUNDING INFORMATION
This work was supported by AMED P‐PROMOTE grant number JP23ama221522 and JSPS KAKENHI grant number 22H04925 (PAGS).
CONFLICT OF INTEREST STATEMENT
The authors declare no conflict of interest.
ETHICS STATEMENTS
Approval of the research protocol by an Institutional Review Board: This study was approved by the Ethics Committee of The University of Tokyo, Japan (23‐477).
Informed Consent: N/A.
Registry and the Registration No. of the study/trial: N/A.
Animal Studies: N/A.
ACKNOWLEDGMENTS
None.
Nagasawa S, Zenkoh J, Suzuki Y, Suzuki A. Spatial omics technologies for understanding molecular status associated with cancer progression. Cancer Sci. 2024;115:3208‐3217. doi: 10.1111/cas.16283
REFERENCES
- 1. Marx V. Method of the year: spatially resolved transcriptomics. Nat Methods. 2021;18:9‐14. [DOI] [PubMed] [Google Scholar]
- 2. Bressan D, Battistoni G, Hannon GJ. The dawn of spatial omics. Science. 2023;381:eabq4964. [DOI] [PMC free article] [PubMed] [Google Scholar]
- 3. Kashima Y, Suzuki A, Liu Y, et al. Combinatory use of distinct single‐cell RNA‐seq analytical platforms reveals the heterogeneous transcriptome response. Sci Rep. 2018;8:3482. [DOI] [PMC free article] [PubMed] [Google Scholar]
- 4. Kashima Y, Shibahara D, Suzuki A, et al. Single‐cell analyses reveal diverse mechanisms of resistance to EGFR tyrosine kinase inhibitors in lung cancer. Cancer Res. 2021;81:4835‐4848. [DOI] [PMC free article] [PubMed] [Google Scholar]
- 5. de Visser KE, Joyce JA. The evolving tumor microenvironment: from cancer initiation to metastatic outgrowth. Cancer Cell. 2023;41:374‐403. [DOI] [PubMed] [Google Scholar]
- 6. Quail DF, Joyce JA. Microenvironmental regulation of tumor progression and metastasis. Nat Med. 2013;19:1423‐1437. [DOI] [PMC free article] [PubMed] [Google Scholar]
- 7. Junttila MR, De Sauvage FJ. Influence of tumour micro‐environment heterogeneity on therapeutic response. Nature. 2013;501:346‐354. [DOI] [PubMed] [Google Scholar]
- 8. Nagasawa S, Kashima Y, Suzuki A, Suzuki Y. Single‐cell and spatial analyses of cancer cells: toward elucidating the molecular mechanisms of clonal evolution and drug resistance acquisition. Inflamm Regen. 2021;41:22. [DOI] [PMC free article] [PubMed] [Google Scholar]
- 9. Kashima Y, Sakamoto Y, Kaneko K, Seki M, Suzuki Y, Suzuki A. Single‐cell sequencing techniques from individual to multiomics analyses. Exp Mol Med. 2020;52:1419‐1427. [DOI] [PMC free article] [PubMed] [Google Scholar]
- 10. Lim B, Lin Y, Navin N. Advancing cancer research and medicine with single‐cell genomics. Cancer Cell. 2020;37:456‐470. [DOI] [PMC free article] [PubMed] [Google Scholar]
- 11. Ståhl PL, Salmén F, Vickovic S, et al. Visualization and analysis of gene expression in tissue sections by spatial transcriptomics. Science. 2016;353:78‐82. [DOI] [PubMed] [Google Scholar]
- 12. Wang H, Huang R, Nelson J, et al. Systematic benchmarking of imaging spatial transcriptomics platforms in FFPE tissues. bioRxiv. 2023.
- 13. Chen A, Liao S, Cheng M, et al. Spatiotemporal transcriptomic atlas of mouse organogenesis using DNA nanoball‐patterned arrays. Cell. 2022;185:1777‐1792.e21. [DOI] [PubMed] [Google Scholar]
- 14. Raj A, van den Bogaard P, Rifkin SA, van Oudenaarden A, Tyagi S. Imaging individual mRNA molecules using multiple singly labeled probes. Nat Methods. 2008;5:877‐879. [DOI] [PMC free article] [PubMed] [Google Scholar]
- 15. Lubeck E, Coskun AF, Zhiyentayev T, Ahmad M, Cai L. Single‐cell in situ RNA profiling by sequential hybridization. Nat Methods. 2014;11:360‐361. [DOI] [PMC free article] [PubMed] [Google Scholar]
- 16. Eng CL, Lawson M, Zhu Q, et al. Transcriptome‐scale super‐resolved imaging in tissues by RNA seqFISH+. Nature. 2019;568:235‐239. [DOI] [PMC free article] [PubMed] [Google Scholar]
- 17. Ke R, Mignardi M, Pacureanu A, et al. In situ sequencing for RNA analysis in preserved tissue and cells. Nat Methods. 2013;10:857‐860. [DOI] [PubMed] [Google Scholar]
- 18. Lee JH, Daugharthy ER, Scheiman J, et al. Highly multiplexed subcellular RNA sequencing in situ. Science. 2014;343:1360‐1363. [DOI] [PMC free article] [PubMed] [Google Scholar]
- 19. Lee JH, Daugharthy ER, Scheiman J, et al. Fluorescent in situ sequencing (FISSEQ) of RNA for gene expression profiling in intact cells and tissues. Nat Protoc. 2015;10:442‐458. [DOI] [PMC free article] [PubMed] [Google Scholar]
- 20. Gyllborg D, Langseth CM, Qian X, et al. Hybridization‐based in situ sequencing (HybISS) for spatially resolved transcriptomics in human and mouse brain tissue. Nucleic Acids Res. 2020;48:e112. [DOI] [PMC free article] [PubMed] [Google Scholar]
- 21. Salas SM, Czarnewski P, Kuemmerle LB, et al. Optimizing Xenium in situ data utility by quality assessment and best practice analysis workflows. bioRxiv. 2023.
- 22. Janesick A, Shelansky R, Gottscho AD, et al. High resolution mapping of the tumor microenvironment using integrated single‐cell, spatial and in situ analysis. Nat Commun. 2023;14:8353. [DOI] [PMC free article] [PubMed] [Google Scholar]
- 23. Haga Y, Sakamoto Y, Kajiya K, et al. Whole‐genome sequencing reveals the molecular implications of the stepwise progression of lung adenocarcinoma. Nat Commun. 2023;14:8375. [DOI] [PMC free article] [PubMed] [Google Scholar]
- 24. He S, Bhatt R, Brown C, et al. High‐plex imaging of RNA and proteins at subcellular resolution in fixed tissue by spatial molecular imaging. Nat Biotechnol. 2022;40:1794‐1806. [DOI] [PubMed] [Google Scholar]
- 25. Tsubosaka A, Komura D, Kakiuchi M, et al. Stomach encyclopedia: combined single‐cell and spatial transcriptomics reveal cell diversity and homeostatic regulation of human stomach. Cell Rep. 2023;42:113236. [DOI] [PubMed] [Google Scholar]
- 26. Chen KH, Boettiger AN, Moffitt JR, Wang S, Zhuang X. RNA imaging. Spatially resolved, highly multiplexed RNA profiling in single cells. Science. 2015;348:aaa6090. [DOI] [PMC free article] [PubMed] [Google Scholar]
- 27. Yao Z, van Velthoven CTJ, Kunst M, et al. A high‐resolution transcriptomic and spatial atlas of cell types in the whole mouse brain. Nature. 2023;624:317‐332. [DOI] [PMC free article] [PubMed] [Google Scholar]
- 28. Stringer C, Wang T, Michaelos M, Pachitariu M. Cellpose: a generalist algorithm for cellular segmentation. Nat Methods. 2021;18:100‐106. [DOI] [PubMed] [Google Scholar]
- 29. Fu X, Lin Y, Lin DM, et al. BIDCell: biologically‐informed self‐supervised learning for segmentation of subcellular spatial transcriptomics data. Nat Commun. 2024;15:509. [DOI] [PMC free article] [PubMed] [Google Scholar]
- 30. Park J, Choi W, Tiesmeyer S, et al. Cell segmentation‐free inference of cell types from in situ transcriptomics data. Nat Commun. 2021;12:3545. [DOI] [PMC free article] [PubMed] [Google Scholar]
- 31. Si Y, Lee C, Hwang Y, et al. FICTURE: scalable segmentation‐free analysis of submicron resolution spatial transcriptomics. bioRxiv. 2023. [DOI] [PMC free article] [PubMed]
- 32. Nagasawa S, Kuze Y, Maeda I, et al. Genomic profiling reveals heterogeneous populations of ductal carcinoma in situ of the breast. Commun Biol. 2021;4:438. [DOI] [PMC free article] [PubMed] [Google Scholar]
- 33. Noguchi M. Stepwise progression of pulmonary adenocarcinoma‐clinical and molecular implications. Cancer Metastasis Rev. 2010;29:15‐21. [DOI] [PubMed] [Google Scholar]
- 34. Bill R, Wirapati P, Messemaker M, et al. CXCL9:SPP1 macrophage polarity identifies a network of cellular programs that control human cancers. Science. 2023;381:515‐524. [DOI] [PMC free article] [PubMed] [Google Scholar]
- 35. Matusiak M, Hickey JW, van IJzendoorn DGP, et al. Spatially segregated macrophage populations predict distinct outcomes in colon cancer. Cancer Discov. Published online March 28, 2024. 2024;OF1‐OF22. [DOI] [PMC free article] [PubMed] [Google Scholar]
- 36. Ozato Y, Kojima Y, Kobayashi Y, et al. Spatial and single‐cell transcriptomics decipher the cellular environment containing HLA‐G+ cancer cells and SPP1+ macrophages in colorectal cancer. Cell Rep. 2023;42:111929. [DOI] [PubMed] [Google Scholar]
- 37. Hashimoto M, Kojima Y, Sakamoto T, et al. Spatial and single‐cell colocalisation analysis reveals MDK‐mediated immunosuppressive environment with regulatory T cells in colorectal carcinogenesis. EBioMedicine. 2024;103:105102. [DOI] [PMC free article] [PubMed] [Google Scholar]
- 38. Riaz N, Havel JJ, Makarov V et al. Tumor and Microenvironment Evolution during Immunotherapy with Nivolumab. Cell. 2017; 171:934–949. [DOI] [PMC free article] [PubMed] [Google Scholar]
- 39. Oyoshi H, Du J, Sakai SA, et al. Comprehensive single‐cell analysis demonstrates radiotherapy‐induced infiltration of macrophages expressing immunosuppressive genes into tumor in esophageal squamous cell carcinoma. Sci Adv. 2023;9:eadh9069. [DOI] [PMC free article] [PubMed] [Google Scholar]
- 40. Magen A, Hamon P, Fiaschi N, et al. Intratumoral dendritic cell–CD4+ T helper cell niches enable CD8+ T cell differentiation following PD‐1 blockade in hepatocellular carcinoma. Nat Med. 2023;29:1389‐1399. [DOI] [PMC free article] [PubMed] [Google Scholar]
- 41. Li H, Zhou J, Li Z, et al. A comprehensive benchmarking with practical guidelines for cellular deconvolution of spatial transcriptomics. Nat Commun. 2023;14:1548. [DOI] [PMC free article] [PubMed] [Google Scholar]
- 42. Lomakin A, Svedlund J, Strell C, et al. Spatial genomics maps the structure, nature and evolution of cancer clones. Nature. 2022;611:594‐602. [DOI] [PMC free article] [PubMed] [Google Scholar]
- 43. Lu T, Ang CE, Zhuang X. Spatially resolved epigenomic profiling of single cells in complex tissues. Cell. 2022;185:4448‐4464.e17. [DOI] [PMC free article] [PubMed] [Google Scholar]
- 44. Deng Y, Bartosovic M, Ma S, et al. Spatial profiling of chromatin accessibility in mouse and human tissues. Nature. 2022;609:375‐383. [DOI] [PMC free article] [PubMed] [Google Scholar]
- 45. Deng Y, Bartosovic M, Kukanja P, et al. Spatial‐CUT&Tag: spatially resolved chromatin modification profiling at the cellular level. Science. 2022;375:681‐686. [DOI] [PMC free article] [PubMed] [Google Scholar]
- 46. Llorens‐Bobadilla E, Zamboni M, Marklund M, et al. Solid‐phase capture and profiling of open chromatin by spatial ATAC. Nat Biotechnol. 2023;41:1085‐1088. [DOI] [PMC free article] [PubMed] [Google Scholar]
- 47. Karlsson F, Kallas T, Thiagarajan D, et al. Molecular pixelation: spatial proteomics of single cells by sequencing. Nat Methods. 2024;21:1044‐1052. [DOI] [PMC free article] [PubMed] [Google Scholar]