

Abstract
Drosophila mxc mbn1 mutant exhibits severe hyperplasia in larval hematopoietic tissue called the lymph glands (LGs). However, the malignant nature of these cells remains unknown. We aimed to identify if mxc mbn1 LG cells behave as malignant tumor cells and uncover the mechanism(s) underlying the malignancy of the mutant hemocytes. When mutant LG cells were allografted into normal adult abdomens, they continued to proliferate; however, normal LG cells did not proliferate. Mutant circulating hemocytes also attached to the larval central nervous system (CNS), where the basement membrane was disrupted. The mutant hemocytes displayed higher expression of matrix metalloproteinase (MMP) 1 and MMP2 and higher activation of the c‐Jun N‐terminal kinase (JNK) pathway than normal hemocytes. Depletion of MMPs or JNK mRNAs in LGs resulted in reduced numbers of hemocytes attached to the CNS, suggesting that the invasive phenotype involved elevated expression of MMPs via hyperactivation of the JNK pathway. Moreover, hemocytes with elongated filopodia and extra lamellipodia were frequently observed in the mutant hemolymph, which also depended on JNK signaling. Thus, the MMP upregulation and overextension of actin‐based cell protrusions were also involved in hemocyte invasion in mxc mbn1 larvae. These findings contribute to the understanding of molecular mechanisms underlying mammalian leukemic invasion.
Keywords: Drosophila, filopodia, hemocyte, invasion, JNK, tumor
The lymph glands from the mxc mbn1 mutant larvae in Drosophila continued to proliferate in adult abdomens and invade the recipient tissues. The invasive phenotype involved elevated expression of matrix metalloproteinases via hyperactivation of the JNK pathway. The overextension of actin‐based cell protrusions was also involved in the malignant invasive phenotype in the mutant larvae.
1. INTRODUCTION
Tumors are generally classified as benign or malignant. Most benign tumors are unlikely to affect other tissues. However, multiple genetic alterations that cause dominant mutations generating oncogenes and recessive mutations that disrupt the function of tumor suppressor genes can transform benign tumors into malignant ones (Lee & Muller, 2010). Acquiring the ability to invade and metastasize is a critical change required for cells to become malignant (Jiang et al., 2015). The invasion and metastasis are landmark events that exacerbate a locally growing tumor into a metastatic disease (Fares et al., 2020). The initial steps of local invasion include the activation of signaling pathways that control the cytoskeletal dynamics in tumor cells. At a malignant site, extracellular matrix (ECM) turnover is associated with tumor cell migration into adjacent tissues (Winkler et al., 2020). In several human cancers, metastasis occurs when invading tumor cells engage blood and lymph vessels. Primary tumor cells decompose the basement membranes, penetrate the endothelial walls, and disseminate through the vessel lumen. Eventually, they exit blood vessels and proliferate to colonize distant organs (Armstrong et al., 2011; Voutouri et al., 2019). Leukemia differs from solid tumors as it arises from hematopoietic tissue and is characterized by the rapid production of abnormal white blood cells. Several common features of solid tumors, such as invasion and metastasis, have also been observed in leukemias. Acute myelogenous leukemia (AML) cells circulate throughout the bloodstream and invade almost all organs (Stefanidakis et al., 2009). In acute lymphoblastic leukemia (ALL), the central nervous system (CNS) is frequently invaded by leukemic cells.
The cytoskeletal dynamics of malignant tumor cells refer to the epithelial‐mesenchymal transition (EMT), which involves the acquisition of mesenchymal features sometimes seen in tumor cells at the early stages of malignant transformation. After EMT activation, tumor epithelial cells lose their cell polarity and cell–cell adhesion ability and subsequently gain the ability to migrate from their original sites (Lu & Kang, 2019). In the EMT migratory process, tumor cells extend their membrane protrusions (filopodia) generated by remodeling the dynamic actin cytoskeleton and invading other compartments using the filopodia (Lin et al., 2013). Filopodia rely on the dynamics of the actin cytoskeleton and activity of cross‐linking proteins such as Nonmuscle myosin II (Paluch et al., 2016; Vicente‐Manzanares et al., 2009). In Drosophila, myosin II activity is regulated via the phosphorylation of its regulatory light and heavy chains by Rho‐kinase in Drosophila (Benhra et al., 2018). Additionally, ECM turnover facilitates tumor growth, invasion, and metastatic progression in distant organs in mice (Winkler et al., 2020). In malignant tumors, the ECM is cleaved and degraded by target‐specific proteases, such as matrix metalloproteinases (MMPs). There are more than 20 members of the mammalian MMP family (Jabłońska‐Trypuć et al., 2016). In contrast, the Drosophila genome carries only two MMP genes: Mmp1 and Mmp2 (LaFever et al., 2017). As one of the substrates for MMP1, E‐Cadherin, a cell–cell adhesion molecule, has been identified, whereas collagen IV, a major component of the basement membrane, is a substrate for MMP2 (Jia et al., 2014). MMPs are regulated by the c‐Jun N‐terminal kinase (JNK) and play important roles in promoting tumor cell invasion by remodeling the ECM (Miles et al., 2011). The mechanisms of tumor invasion and role of the microenvironment surrounding the tumor cells remain unclear.
Drosophila hemocytes are responsible for immune responses, such as phagocytosis of infectious microorganisms (Melcarne et al., 2019). Recently, it has been reported that these cells also play a role in suppressing tumor growth via antimicrobial peptides (Araki et al., 2019; Parvy et al., 2019). Circulating hemocytes in the hemolymph arise from two distinct hematopoietic tissues at the larval stage: the embryonic head mesoderm and a specialized tissue called the lymph gland (LG) at the larval to pupal stage (Holz et al., 2003). Hematopoietic progenitor cells, called prohemocytes, in the LG differentiate into mature hemocytes after several rounds of proliferation (Banerjee et al., 2019; Evans et al., 2003). As a possible Drosophila model of a hematopoietic tumor, we used hemizygous mutant larvae for a loss‐of‐function mutation, mxc mbn1 in multi sex combs (mxc) gene. At the mature stage, mutant larvae exhibit a hyperplastic phenotype in their LG (Araki et al., 2019; Kurihara et al., 2020,b; Remillieux‐Leschelle et al., 2002; Shrestha & Gateff, 1982). When mutant LG cells are transplanted into healthy adults, they continue to proliferate (Remillieux‐Leschelle et al., 2002). Excessive circulating hemocytes, including abnormally differentiated hemocytes, have been observed in mutant hemolymph (Kurihara, Takarada, & Inoue, 2020; Remillieux‐Leschelle et al., 2002; Santamaría & Randsholt, 1995; Shrestha & Gateff, 1982). Based on this evidence, the hemocytes of mxc mbn1 mutant larvae have been regarded as transformed blood cells, similar to mammalian leukemic cells (Kurihara, Komatsu, et al., 2020; Kurihara, Takarada, & Inoue, 2020; Remillieux‐Leschelle et al., 2002). However, sufficient evidence indicating that mxc mutant hemocytes behave as malignant tumor cells that proliferate and invade other tissues at different sites has not been obtained.
In this study, we performed multifaceted analyses to obtain evidence that mxc mbn1 LG cells behave as malignant tumor cells. We also aimed to uncover the mechanism(s) underlying the malignancy of mxc mutant hemocytes. For this purpose, we examined the expression of MMPs in the hemocytes and observed the ECM of the tissues to which the hemocytes were attached in the mutant larvae. As the JNK pathway is involved in the MMP gene expression (Uhlirova & Bohmann, 2006), we examined its involvement in the ectopic gene expression and whether JNK activation was indispensable for the firm adherence of mutant cells to other tissues during invasion. To identify another factor essential for the malignant phenotypes relevant to JNK activation, we also investigated actin‐based cell protrusions that facilitate cell migration. Our current findings in Drosophila provide useful information that will help us better understand the mechanisms of invasion and metastasis in other organisms, such as human leukemic cells.
2. RESULTS
2.1. Continuous proliferation of the lymph gland cells from mxc mbn1 larvae in adult abdomens and invasion into the recipient tissues
The mxc mbn1 mutant larvae harbored hyperplasic LGs enlarged to approximately five times the mean size of control larvae (Figure S1a–c). When mutant LG cells are transplanted into the normal adult abdomen, they continue to proliferate and kill the host (Gateff, 1994). However, it is uncertain whether mutant LG cells behave like malignant tumor cells. To clarify this, we collected a pair of primary lobes of an LG hemisphere from control third instar larvae expressing GFP in hemocytes (w/Y; He > GFP). We then transplanted half of the primary LG lobe into the abdominal cavity of wild‐type female flies (Figure 1). The transplanted cell mass showed GFP fluorescence within a day after transplantation (Figure 1a′). However, 15 days after transplantation, GFP+ cells were not observed in the abdomens of the recipients (Figure 1b, b′,c,c′). Normal LG cells no longer proliferated and could not be maintained in the adult body. Next, we collected the LG cell mass expressing GFP from mxc mbn1 larvae at the mature third instar stage (mxc mbn1 /Y; He > GFP). Similarly, we transplanted mutant cell masses of the same size into the abdomens of wild‐type female flies (Figure 1d,d′). Fifteen days after transplantation, we observed that more GFP+ cells than transplanted cells were spread over the abdomen of the recipients (Figure 1e,e′). Subsequently, the recipient abdomen was filled with GFP+ cells derived from the mutant LG mass 20 days after transplantation (Figure 1f,f′). These results indicate that mxc mbn1 LG cells continue to proliferate in the adult abdominal cavity even after leaving the primary larval LG.
FIGURE 1.

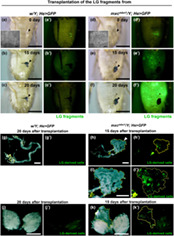
Continuous proliferation and invasion of the LG tumor cells from mxc mbn1 mutant larvae in the abdomens of wild‐type females. (a–f) Bright‐field micrographs of adult abdomens of wild‐type female flies after transplantation of the LG cell masses, labeled by GFP fluorescence, from (a–c) control larva (w/Y; He > GFP) and (d–f) mxc mbn1 larva (mxc mbn1 /Y; He > GFP) at the third instar stage. The microscopic images show the abdomens within a day (a,d), 15 days (b,e), and 20 days (c,f) after the injection. (a′–f′) Fluorescence microscopic images of the adult abdomens under the excitation light for observation of GFP fluorescence. Arrowheads indicate the transplantation point. Insets in A and B represent the small pieces of anterior LG lobes from control and the mutant larvae used for transplantation, respectively. Note that the LG fragments with similar sizes were used for the transplantation. (g–k) Stereo microscopic images of whole adult guts (g,h) and pairs of ovaries (j,k) from the recipient adults at 15 days or 20 days after the transplantation. The LG cells expressing GFP from control larva (w/Y; He > GFP) (g,j) or from mxc mbn1 larva (mxc mbn1 /Y; He > GFP) (h,i,k) were transplanted into the recipient abdomens. (i) Higher magnification image of the cell mass containing the GFP+ cells associated with the adult gut (encircled by a yellow line, arrowhead in h). Bar; 0.5 mm. Bars in insets; 30 μm.
We observed the tissues of adults transplanted with LG cells from mxc mbn1 larvae to investigate whether the mutant cells proliferated and invaded other tissues of the recipients. We transplanted mutant LG cells and observed the tissues in recipient adults 15 or 20 days after transplantation (Figure 1g–k). In the intestines of adults transplanted with mutant LG cells, cell masses containing many GFP+ cells were associated with the midgut region (arrowhead in Figure 1h,h′,i,i′), whereas GFP+ cells were not found in the intestines of adults transplanted with normal LG cells (Figure 1g,g′). Consistently, uncertain cell masses containing GFP+ cells were closely associated with a pair of ovaries in adults transplanted with mutant LG cells (Figure 1k,k′). In contrast, no GFP+ cells were observed in the ovaries of adults transplanted with normal cells (Figure 1j,j′). Overall, these observations indicate that mxc mbn1 LG cells behave as malignant tumor cells that continue to proliferate autonomously in the adult abdomen and invade other tissues separated from the primary LG tumors.
2.2. Circulating hemocytes firmly adhered to and invaded the central nervous system in mxc mbn1 larvae harboring the LG tumor
A previous histological study has observed the possible invasion of mutant hemocytes into the central nervous system (CNS) after the transplantation of mxc mbn1 hematopoietic tissues into wild‐type larvae and adult hosts (Gateff, 1994). Therefore, we expected that mutant hemocytes could invade other tissues through the hemolymph of mxc mbn1 larvae. To confirm this, we investigated whether circulating hemocytes adhered to the CNS of mxc mbn1 larvae. For this purpose, we induced the expression of GFP specifically in mature hemocytes, to label and recognize hemocytes (Figure 2a–c, see a magnified image in Figure 2b inset). We observed 0.68 GFP+ cells (median) in the CNS of control larvae (w/Y; Hml > GFP) (n = 35) (Figure 2c). In contrast, 3.85 GFP‐labeled cells (median) were observed in the CNS of mxc mbn1 larvae (mxc mbn1 /Y; Hml > GFP) (n = 27) (Figure 2b,c). Six times more hemocytes were firmly attached to the CNS in mutant larvae than in normal larvae (p < .0001 in Welch's t‐test) (Figure 2c). Considering that the mutant larvae contained three times more circulating hemocytes (1053.4 ± 338.0 [n = 20]) than normal larvae (321.4 ± 29.8 per larva on average [n = 19]), these observations suggest that more hemocytes adhered to the CNS in mxc mbn1 larvae after washing.
FIGURE 2.
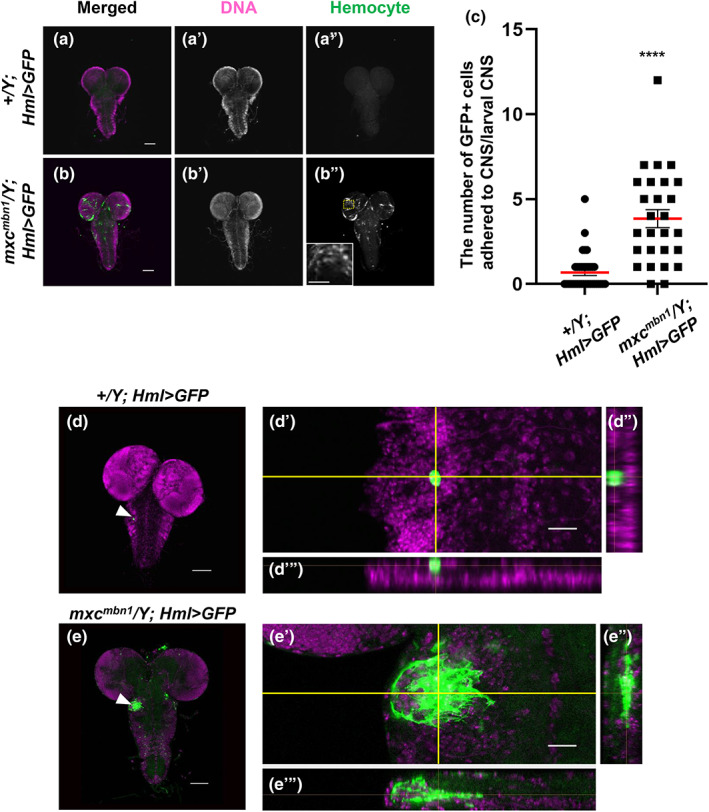
Increase in number of hemocytes associated with the CNS and their penetration into the ventral nerve cord in mxc mbn1 larvae. (a,b) Fluorescence micrographs of the DAPI‐stained CNS prepared from third instar larvae of control (w/Y; Hml > GFP) (a) and mxc mbn1 (mxc mbn1 /Y; Hml > GFP) (b) males. GFP fluorescence: green, DNA: magenta. Inset in b″ indicates a magnified view of the mutant hemocytes adhering to the larval brain region encircled by a yellow‐dotted rectangle. No hemocytes were localized on the normal CNS (a″). Bar: 100 μm. Bar in inset: 50 μm. (c) Quantification of the GFP‐expressing hemocytes closely associated with the larval CNSs (w/Y; Hml > GFP (n=35) and mxc mbn1 /Y; Hml > GFP [n = 27]). Statistically significant differences are indicated by ****; p < .0001. Welch's t‐test. Bars colored by red indicate average number of the hemocytes in control and the mutant larvae, respectively. Error bars are SEM. (d,e) Three‐dimensional observation of LG‐derived hemocytes attached to the ventral nerve cords in normal and mxc mbn1 larvae by a confocal microscope. (d) Normal control CNS and the attached hemocytes labeled by GFP on the focal plane at 2.6 μm below the surface (w/Y; Hml > GFP). (e) mxc mbn1 mutant hemocytes attached to the ventral nerve cord imaged on the focal plane at 14.9 μm below the surface (mxc mbn1 /Y; Hml > GFP). GFP fluorescence as a hemocyte marker: green, DNA: magenta. Bar; 100 μm. (d,d″, e′,e″) Higher magnification images showing that hemocytes on the CNS were the sagittal (d″,e″) and coronal (d″, e″) sections of the yellow lines, respectively. Bar; 10 μm.
To examine whether the mutant cells invaded other tissues, we investigated whether circulating hemocytes penetrated the CNS of mxc mbn1 larvae. Using a confocal microscope, we carefully observed the larval CNS from the surface to the inside. We acquired serial section images of GFP‐positive cells on the CNS surface while changing the Z‐axis. We constructed a Z‐stack image from the serial images and presented it with slices in the X–Z‐ and Y–Z‐axis directions (Figure 2d,d″ for control and Figure 2e,e″ for the mutant). In the control group, we observed hemocytes expressing GFP on the CNS surface (Figure 2d). No GFP+ hemocytes were observed inside the tissues of the normal control larvae (Figure 2d′,d″). In contrast, we observed that cell masses consisted of GFP+ hemocytes in the CNS of mxc mbn1 larvae (Figure 2e). Furthermore, as the sagittal (Figure 2e″) and coronal optical (Figure 2e″) sections of the CNS images show, multiple mutant hemocytes were present inside the ventral nerve cord. However, whether a single or a few cells initially invaded and, thereafter, proliferated inside the CNS or whether these cell masses invaded the CNS surface is uncertain. Based on these observations, we concluded that hemocytes of mxc mbn1 larvae harboring LG tumors adhered to the surface and invaded the interior of the CNS.
2.3. A loss of a basement membrane component, collagen IV, in the CNS on which the mutant hemocytes adhered in mxc mbn1 larvae
Other Drosophila tumor cells show typical invasion associated with basement membrane (BM) degradation (Pagliarini & Xu, 2003). Therefore, we examined whether the integrity of the BM was perturbed by malignant hemocytes in the mutant CNS. Collagen IV, encoded by the vkg gene, is a major component of BM in Drosophila (Yasothornsrikul et al., 1997). To visualize the BM around the apical surface of the CNS in mxc mbn1 larvae, we induced the expression of GFP‐tagged Vkg and observed CNS samples (Figure 3a,b). GFP fluorescence was distributed without interruption on the apical surface of the normal CNS (w/Y; vkg‐GFP) (Figure 3a). In contrast, in mxc mbn1 larvae (mxc mbn1 /Y; vkg‐GFP), the BM signal was faint on the CNS surface where a cell mass consisting of multiple hemocytes was localized (arrowhead in Figure 3b). These observations suggest that the mutant hemocytes disassemble the BM of the CNS, which facilitates their invasion into other tissues in mxc mbn1 larvae.
FIGURE 3.
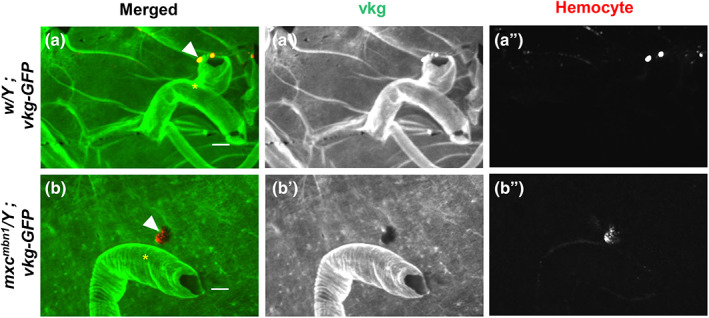
Disassembly of the basement membrane consisting of collagen IV on the surface of the larval CNS to which the hemocytes were attached in mxc mbn1 larva. (a,b) Confocal microscope images of the hemocytes labeled by Alexa 555 fluorescence (arrowheads) on the surface of CNSs from control larva (a) (w/Y; vkg‐GFP) and mxc mbn1 larva (b) (mxc mbn1 /Y; vkg‐GFP) at the third instar stage. GFP fluorescence as a marker of collagen IV (Vkg): green, anti‐P1 immunostaining to visualize plasmatocytes: red. * indicates segmentally organized nerve bundles. Bar: 10 μm.
2.4. Upregulation of MMP genes in circulating hemocytes of mxc mbn1 larvae
A recent report from our group showed that MMP1 and MMP2 are ectopically expressed in LG tumors, where the enzymes decompose the BM (Kinoshita et al., 2022). Thus, we immunostained circulating hemocytes in the hemolymph using anti‐MMP1 antibody and quantified the fluorescence intensity. We observed an intense immunostaining signal in the cytoplasm of several mutant cells (see Figure S2B and S2B″ for a multicellular view, and Figure 4b,b″ for a magnified view of a hemocyte), whereas only a few control cells showed a subtle signal beyond the detection level (Figures S2A, S2A″, Figure 4a,a″,c). The anti‐MMP1 immunostaining signal in the circulating hemocytes of the mutant (mxc mbn1 /Y; He > GFP) was more than twofold higher than that of the control (w/Y; He > GFP) (Figure 4c, n ≥ 106, p < .0001 in Welch's t‐test). Next, we examined the expression of Mmp2 in mutant circulating hemocytes by monitoring GFP fluorescence in Mmp2 > GFP hemocytes. We observed robust GFP fluorescence in the cytoplasm of several mutant cells (see Figure S2d,d″ for a multicellular view, and Figure 4e,e″ for a magnified view of a hemocyte), whereas only a few control cells showed a weak GFP signal beyond the detection level (Figures S2c,c″, 4d,d″). The relative fluorescence intensity of the average GFP signal in the mutant cells (mxc mbn1 /Y; Mmp2 > GFP) was threefold higher than that in the control cells (w/Y; Mmp2 > GFP) (Figure 4f, n ≥ 104, p < .0001 in Welch's t‐test). These results indicate that MMPs are induced in circulating hemocytes in mutant larvae. In summary, the hyperexpression of MMPs, which facilitates the degradation of extracellular matrices such as the BM, occurred in both LGs and circulating hemocytes of mxc mbn1 larvae.
FIGURE 4.
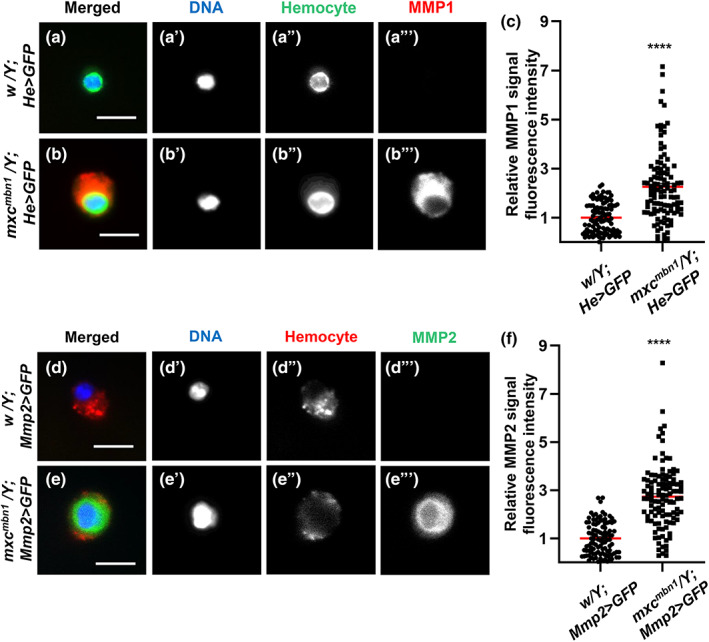
Hyperexpression of two MMPs in circulating hemocytes of mxc mbn1 larvae. (a,b) Anti‐MMP1 immunostaining of circulating hemocytes from third instar larvae; (a) normal control hemocyte (w/Y; He > GFP) and (b) mxc mbn1 hemocyte (mxc mbn1 /Y; He > GFP). GFP fluorescence: green, anti‐MMPI immunostaining: red, DNA: blue. Bar: 10 μm. (c) Relative fluorescence intensity of anti‐MMP1 immunostaining signal in the circulating hemocytes from third instar larvae (w/Y; He > GFP [n = 106 hemocytes] and mxc mbn1 /Y; He > GFP [n = 109 hemocytes]). For statistical analysis of the differences in the fluorescence intensity, Welch's t‐test was performed (****p < .0001). (d,e) A visualization of the circulating hemocytes showing the GFP expression induced under the Mmp2 enhancer in normal control larva (w/Y; Mmp2 > GFP) (d), mxc mbn1 larva (mxc mbn1 /Y; Mmp2 > GFP) (e). GFP fluorescence: green, anti‐P1 immunostaining to recognize the plasmatocytes: red, DNA: blue. Bar: 10 μm. (f) Relative GFP fluorescence intensity indicating the expression level of Mmp2 in the circulating hemocytes from third instar larvae (w/Y; Mmp2 > GFP [n = 104 hemocytes], mxc mbn1 /Y; Mmp2 > GFP [n = 111 hemocytes]). For statistical analysis of the differences in the fluorescence intensity, Welch's t‐test was performed (****p < .0001). Red bars indicate average intensity of the hemocytes and error bars are SEM.
2.5. Hyperactivation of the JNK signaling pathway in the LGs and circulating hemocytes of mxc mbn1 larvae
Previous studies have reported that MMP expression is regulated by the JNK signaling pathway (Uhlirova & Bohmann, 2006). Therefore, we investigated whether levels of the activated form of JNK (pJNK) were increased in mxc mbn1 tumor cells. First, we performed immunostaining of the LG with an anti‐phospho‐SAPK/JNK antibody. A lower pJNK signal was recorded in all LGs of the control larvae (w 1118 /Y) (Figure 5a). In contrast, we observed a more intense anti‐pJNK immunostaining signal in the mutant LGs (mxc mbn1 /Y) (Figure 5b). The relative fluorescence intensity of pJNK in the LGs of the mxc mutant was two‐fold higher than that of those in the control (Figure 5c, n ≥ 22). The difference between the control and mutant LGs was significant (p < .0001, Student's t‐test). Second, we examined whether the JNK pathway was activated in circulating hemocytes of mxc mbn1 larvae. We selected GFP+ cells from the hemolymph and quantified their fluorescence intensity after immunostaining. We observed a considerable number of dotted foci showing more intense immunofluorescence in the cytoplasm of the mutant cells (mxc mbn1 /Y; He > GFP) (Figure 6b,b″), whereas the control cells possessed only a few pJNK foci (w/Y; He > GFP) (Figure 6a,a″). The relative pJNK immunostaining signal intensity was significantly higher (2.4‐fold) in mxc mbn1 hemocytes (n = 218) (p < .0001 in Welch's t‐test) than in control cells (n = 236) (Figure 6c). As the intensity of the immunostaining signal varied even among control hemocytes, we classified hemocytes into five classes; none (background level) (class I), weak (class II), middle (class III), strong (class IV), and intense (class V) according to the level of immunofluorescence (Figure 6d,e). Among the hemocytes in the hemolymph of the control larvae, 13.1% were in class I, 64.8% in class II, 17.0% in class III, 3.0% in class IV, and 2.1% in class V. In contrast, there were no class I cells, 28.0% in class II, 28.4% in class III, 19.7% in class IV, and 23.9% in class V in circulating hemocytes of mxc mbn1 larvae. These data indicate that the JNK signaling pathway is activated in LGs and circulating hemocytes in mutant larvae. Overall, we concluded that the JNK signaling pathway was strongly activated in hemocytes with the upregulation of MMPs and invasive potential in mxc mbn1 larvae.
FIGURE 5.
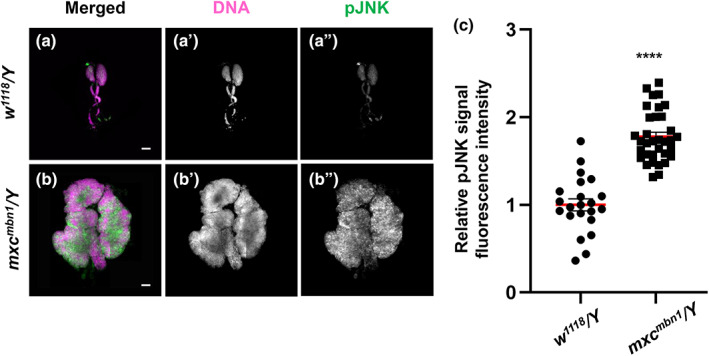
LG tumors in mxc mbn1 larvae harboring the LG‐specific activation of the JNK signaling pathway. (a,b) Immunostaining of LGs from control (w 1118 /Y) (a) and mxc mbn1 (mxc mbn1 /Y) (b) larvae at the third instar stage with anti‐phospho‐SAPK/JNK antibody. Anti‐phospho‐SAPK/JNK immunostaining to recognize the activated form of JNK (pJNK): green, DNA: magenta. Bar: 100 μm. (c) Quantification of pJNK signals in the LGs from third instar larvae (w 1118 /Y [n = 22 LGs] and mxc mbn1 /Y [n = 34 LGs]). From the total amount of fluorescence in whole lobe regions of LGs, the fluorescence amount per single LG unit (mm2) was calculated and normalized to that of the control, set to 1.0. The relative values were plotted along the y‐axis. (****p < .001, Student's t‐test; red bars indicate average intensity of the hemocytes and error bars represent SEM).
FIGURE 6.
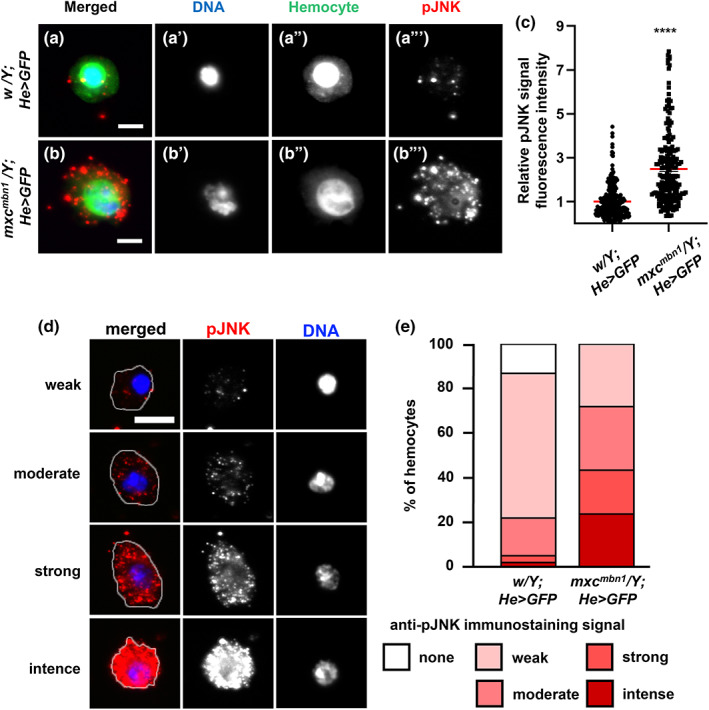
Activation of JNK in circulating hemocytes in normal and mxc mbn1 larvae. (a,b) Immunostaining of LGs from control (w/Y) (a) and mxc mbn1 (mxc mbn1 /Y) (b) larvae at the third instar stage with anti‐pJNK antibody. Anti‐pJNK immunostaining: green, DNA: magenta. Bar: 100 μm. (c) Quantification of pJNK signals in the LGs from third instar larvae (w/Y [n = 22 LGs] and mxc mbn1 /Y [n = 34 LGs]). The fluorescence intensity of pJNK signals in each LG was calculated and normalized to that of the control, set to 1.0 (****p < .001, Student's t‐test). Red bars indicate average intensity of the hemocytes and error bars represent SEM. (d) Typical images of the cells classified into five classes according to the fluorescence intensity of anti‐pJNK immunostaining (none, weak, moderate, strong, and intense classes). The cell margin is encircled by a white line. Bar: 5 μm. (e) Percentage of each class of the circulating hemocytes from control and mxc mbn1 larvae, immunostained with anti‐pJNK antibody.
2.6. Ectopic induction of MMPs by activation of JNK pathway was required for invasive ability of the hemocytes of mxc mbn1 larvae
Considering the results that the upregulation of MMP genes and hyperactivation of the JNK pathway was detected in the hemocytes of mxc mbn1 larvae, we speculated that the ectopic expression of MMPs was associated with the activation of the JNK signaling pathway and that this was involved in the invasive behavior of the mutant larvae. To verify this, we inhibited JNK signaling in mutant hemocytes by downregulating the bsk gene, which encodes Drosophila JNK, using RNAi. We counted only 0.18 GFP+ cells (median) in the CNS of the control larvae (w/Y; He > GFP, LacZ) and observed significantly more hemocytes (2.95 GFP+ cells [median]) in the CNS of mxc mbn1 larvae (mxc mbn1 /Y; He > GFP, LacZ) (Figures S3A, S3B, and 7). Next, we induced the ectopic expression of dsRNAs for bsk in the LG of mxc mbn1 larvae. We performed RNAi experiments using two different UAS‐bskRNAi stocks, which efficiently depleted the relevant endogenous mRNAs and obtained consistent results. We only recorded 0.50 and 0.54 GFP‐labeled cells (median) in the CNS of mxc mbn1 larvae harboring bsk depletion (mxc mbn1 /Y; He > GFP, bskRNAi 1 , mxc mbn1 /Y; He > GFP, bskRNAi 2 , respectively) (Figures S3C, S3D, and 7). On average, six times fewer cells were attached to the CNS in mutant larvae with bsk depletion (n ≥ 20, p < .0001 in Welch's t‐test) (Figure 7). To confirm whether the ectopic expression of MMPs associated with the activation of the JNK pathway was responsible for the invasive behavior of the mutant hemocytes, we induced dsRNAs against each Mmp mRNA, which efficiently depleted the relevant endogenous mRNAs in mxc mbn1 hemocytes. We counted 1.08 GFP+ hemocytes (median) in the CNS of mutant larvae harboring Mmp1 depletion in LGs (mxc mbn1 /Y; Hml > GFP, Mmp1RNAi) (Figures S3E and 7). Additionally, 1.47 GFP‐labeled hemocytes (median) were observed in the CNS of mxc mbn1 larvae expressing dsRNA for Mmp2 in the LG (mxc mbn1 /Y; Hml > GFP, Mmp2RNAi) (Figures S3F and 7). Therefore, the ectopic expression of dsRNAs against Mmp mRNAs in LGs significantly decreased the number of hemocytes on the CNS compared with that in mxc mbn1 larvae (n > 20, p < .01 in Student's t‐test or p < .001 in Welch's t‐test) (Figure 7). These results are consistent with the hypothesis that the ectopic expression of MMPs due to the activation of the JNK pathway is required for hemocytes to invade the CNS of mxc mbn1 larvae.
FIGURE 7.
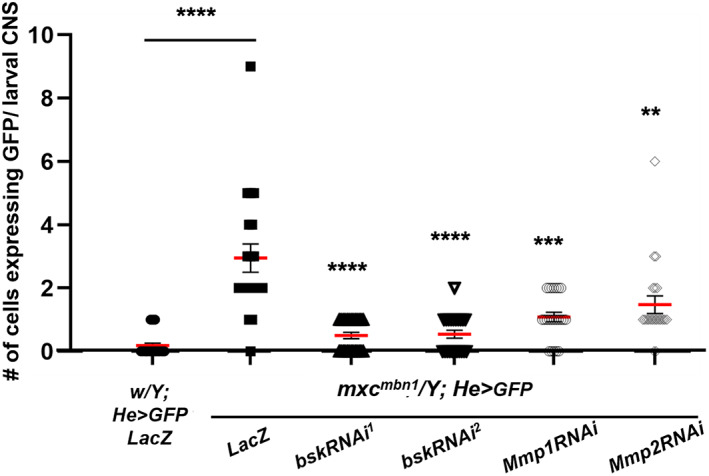
Decrease in hemocyte levels associated with the CNS in mxc mbn1 larvae harboring hemocyte‐specific depletion of JNK or MMPs. Quantification of the number of GFP+ hemocytes associated with larval CNSs (w/Y; He > LacZ [n = 27], mxc mbn1 /Y; He > LacZ [n = 20], mxc mbn1 /Y; He > Mmp1RNAi [n = 23], mxc mbn1 /Y; He > Mmp2RNAi [n = 21] mxc mbn1 /Y; He > bskRNAi 1 [n = 26], mxc mbn1 /Y; He > bskRNAi 2 [n = 22]). Statistically significant differences are indicated by **p < .01, ***p < .001, and ****p < .0001. Student's t‐test or Welch's t‐test was used as described in the Materials and Methods section. Red bars indicate the average number of hemocytes, and error bars indicate SEM.
2.7. A higher proportion of circulating hemocytes harboring extra and extended actin‐based protrusion in the mxc mbn1 larvae
During cell migration, including tumor invasion, actin‐based membrane protrusions termed filopodia are widely used (Petrie & Yamada, 2012). Therefore, we hypothesized that extended filopodia facilitate the invasion of mutant hemocytes of mxc mbn1 larvae. To clarify this, we investigated whether actin‐based protrusions are more frequently observed in mutant hemocytes. Alexa 488‐conjugated‐phalloidin revealed an actin‐rich network designated as filopodia and lamellipodia in the hemocytes. The circulating hemocytes in the normal control larvae (w/Y) possessed 0.69 ± 0.26 filopodia‐like protrusions with an average length of 0.91 ± 0.09 μm (n = 32 cells) (Figure 8a,e,f). Mutant hemocytes harbored seven times more filopodia on average (7.6 ± 0.88 per cell) in mxc mbn1 larvae (mxc mbn1 /Y) than normal cells (Figure 8b,b″,c,c″,f). The mutant filopodia extended two times longer on average (2.4 ± 0.07 μm [n = 31 cells]) (Figure 8e). A higher proportion of circulating hemocytes with an increased number and length of filopodia was observed in the mxc mbn1 hemolymph. Moreover, the mutant hemocytes harbored abnormally thicker cortical actin layers (right side of the cell cortex in Figure 8b) than the actin layers corresponding to normal layers of the lamellipodia in control hemocytes (w/Y) (Figure 8a). 60% of the mutant hemocytes harbored abnormal lamellipodia (27 out of 45 cells), whereas no such hemocytes were found out of >100 cells in the control larvae. Some mutant cells exhibited a wavy cortical actin layer in the confocal plane closer to the upper cell surface (Figure 8d).
FIGURE 8.
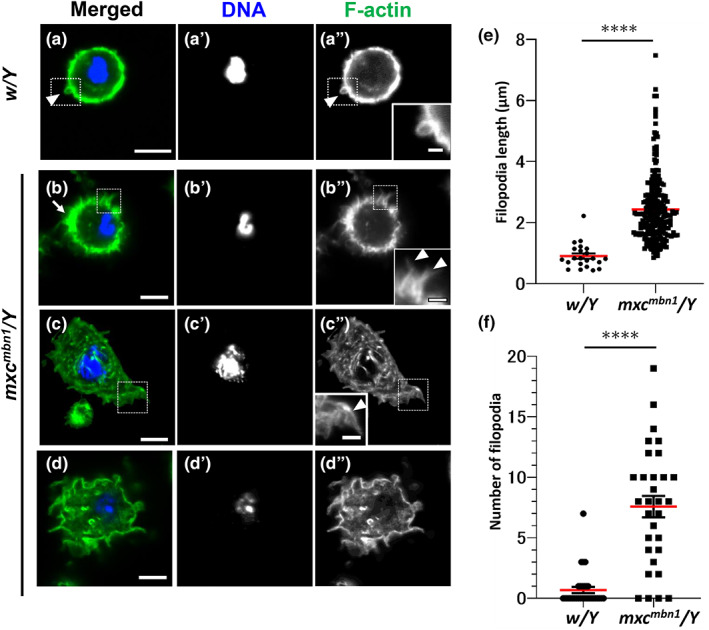
Abnormal circulating hemocytes with extended filopodia and extra F‐actin layers in the mxc mbn1 larvae. (a–d) Confocal micrographs of the F‐actin based cell protrusions in the phalloidin‐stained circulating hemocytes from normal control (w/Y) (a) and mxc mbn1 (mxc mbn1 /Y) (b–d) larvae. Hemocytes stained with Alexa488‐phalloidin were observed at confocal planes where filopodia and cortical F‐actin layers (a,b) or around the cell surface (c,d) could be easily observed. Areas encircled by the dotted squares in (a) to (c) are magnified in insets in (a′) to (c′). Arrowhead in (a) (a″) indicates normal filopodia‐like protrusion. Arrowheads in b″ and c″ indicate abnormally extended filopodia. (b) Mutant hemocyte possesses a thicker F‐actin layer at the cell cortex (arrow). (c,d) Micrographs of the phalloidin‐stained hemocytes at confocal planes closer to the cell surface. Note that thicker and wavy shaped F‐actin‐based protrusions in the mutant hemocyte (d). Phalloidin staining colored in green. DNA: dark blue. Bars in a–d: 5 μm, Bars in insets: 1 μm. (e,f) Quantification of the length (e) and numbers (f) of filopodia observed in hemolymph of larvae at third instar stage (w/Y [n = 32 hemocytes for e and f), mxc mbn1 /Y [n = 31 hemocytes for e and f]. (****p < .001, Welch t‐test; red bars indicate average length (e) or average numbers (f) of the hemocytes. Error bars represent SEM).
2.8. The JNK pathway was required for the production of the circulating hemocytes with excess filopodia in mxc mbn1 larvae
JNK signaling regulates filopodia formation via the phosphorylation of myosin and other actin‐binding proteins (Benhra et al., 2018). Thus, we examined whether the hyperactivation of JNK signaling in mxc mbn1 hemocytes was required to form filopodia in mutant cells. The mxc mbn1 hemocytes (mxc mbn1 /Y; He > GFPRNAi) possessed 5.65 ± 0.92 filopodia on average (n = 17 cells) (Figure 9b,e). The mean length of the filopodia was 2.19 ± 0.01 μm (n = 17 cells) (Figure 9b,f). Next, we observed filopodia in the hemocytes in which the bsk mRNA encoding a Drosophila JNK was depleted using a known UAS‐RNAi line (mxc mbn1 /Y; He > bskRNAi). Compared to the mean value of the filopodia number of mxc mbn1 /Y; He > GFPRNAi (control), those of mxc mbn1 /Y; He > bskRNAi (3.29 ± 0.95, n = 21 cells) tended to be decreased although the differences were not statistically significant (p = .179, one‐way analysis of variance [ANOVA]) (Figure 9e). The mean length of filopodia in mutant cells with the depletion (0.89 ± 0.05 μm, n = 21 cells) was significantly shorter than that in mutant cells without the depletion (p < .0001, one‐way ANOVA) (Figure 9c, arrowhead in inset of 9c″, Figure 8f). Consistently, the mean length (1.02 ± 0.07 μm, n = 20 cells) shortened in the mutant hemocytes harboring hemocyte‐specific hep depletion (p < .01, one‐way ANOVA) (Figure 9f). The mean number of filopodia (2.10 ± 0.77, n = 27 cells) decreased significantly after depletion (p < .05, one‐way ANOVA) (Figure 9e). The hep depletion suppressed the increased number and excess production and over‐extension of filopodia of mutant cells (Figure 9d, arrowhead in inset of 9d″,e,f). These observations indicate that the depletion of genes involved in the JNK pathway suppresses the over‐extended filopodia in mxc mbn1 mutant hemocytes. Additionally, in the mxc mbn1 /Y; He > bskRNAi and mxc mbn1 /Y; He > hepRNAi hemocytes, we failed to observe mutant hemocytes harboring abnormal filamentous actin shapes beneath the plasma membrane, as observed in the mutant hemocytes without the depletion (Figure 8c,d). Collectively, these results indicate that the JNK signaling pathway is required for the excess formation of the actin network in mutant hemocytes. These results were consistent with the conclusion that the JNK signaling pathway is required for the attachment of mutant hemocytes to the CNS, namely, the invasive behavior of mxc mbn1 hemocytes.
FIGURE 9.
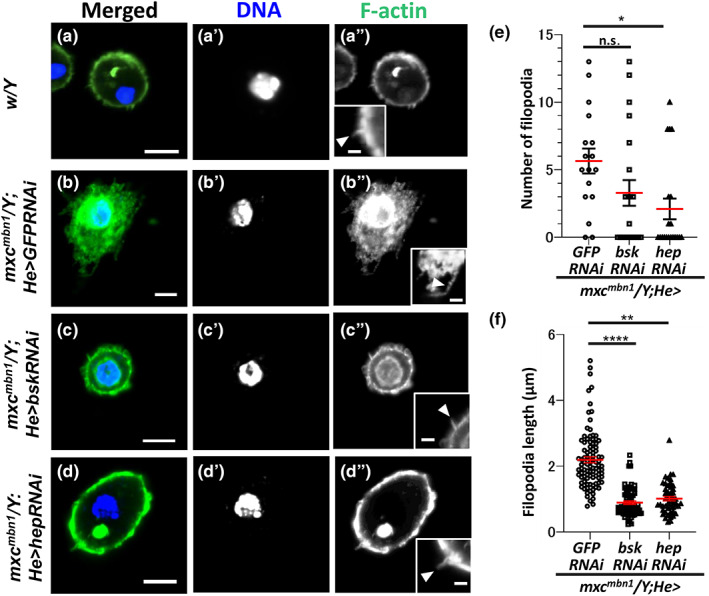
Suppression of the extended filopodia phenotype by hemocyte‐specific depletion of the JNK components in the mxc mbn1 hemocytes. (a–d) Confocal micrographs of the F‐actin based cell protrusions in the phalloidin‐stained circulating hemocytes from normal larva (w/Y) (a) and mxc mbn1 larvae harboring hemocyte‐specific depletion of dsRNA against GFP mRNA (mxc mbn1 /Y; He > GFPRNAi) (b), depletion of bsk mRNA (mxc mbn1 /Y; He > bskRNAi) (c), and depletion of hep mRNA (mxc mbn1 /Y; He > hepRNAi) (d). Hemocytes stained with Alexa488‐phalloidin were observed at confocal planes where filopodia and cortical F‐actin layers. Insets in a″–d″ indicate magnified images of filopodia in the mutant hemocytes. Arrows in (a) indicate normal filopodia‐like protrusions. Arrows in b″ indicate abnormally extended filopodia. Arrows in c″ and d″ indicate typical filopodia seen in the mutant cells harboring depletion of JNK components. The images were acquired at the confocal planes suitable for the observation of filopodia. Phalloidin staining: green, DNA: dark blue. Bars in (a)–(d): 5 μm. Bars in insets: 1 μm. (e,f) Quantitation of the length (e) and number (f) of filopodia of the hemolymph in larvae at third instar stage (mxc mbn1 /Y; He > GFPRNAi [n = 17 hemocytes for e and f), mxc mbn1 /Y; He > bskRNAi [n = 21], mxc mbn1 /Y; He > hepRNAi [n = 27]). (*, **, ****p < .05, .01, .0001, respectively. n.s.: not significant, one‐way ANOVA). Red bars indicate the average length (e) or average numbers (f) of the hemocytes. Error bars represent SEM.
3. DISCUSSION
3.1. mxc mbn1 hemocytes behave as malignant tumor cells that continue to proliferate and invade other tissues
Drosophila mxc mbn1 mutant larvae exhibit hyperplasia of the LGs and extra circulating hemocytes, in addition to abnormally differentiated hemocytes in the hemolymph (Gateff, 1994; Remillieux‐Leschelle et al., 2002; Shrestha & Gateff, 1982). When a small mass of mutant LG was introduced into the adult abdomen, the cells proliferated to some extent by the fifth day after transplantation (Remillieux‐Leschelle et al., 2002). Considering the observation, the authors argued that mxc mbn1 LG cells exhibit a malignant phenotype. However, evidence from the observation made more than two decades ago did not allow us to regard mutant LG cells as blood tumor cells. Histological examination of larval tissue sections four decades ago neither provided sufficient evidence to indicate that mutant hemocytes invaded the surrounding tissues (Gateff, 1994; Shrestha & Gateff, 1982). In contrast, recent studies have demonstrated that the reduced expression of mxc in mature hemocytes is responsible for the over‐proliferation of immature prohemocytes in the hyperplasic LGs of mutants (Araki et al., 2019; Kurihara, Komatsu, et al., 2020; Kurihara, Takarada, & Inoue, 2020). The current study demonstrated that transplanted mutant LG cells continued to proliferate in the adult abdomen and invaded the gut and ovaries. Our 3D observation of the larval CNS to which the hemocytes adhered showed that the hemocytes appeared to penetrate the CNS. Considering these current results and previous histological data (Gateff, 1994), we concluded that the mxc mutation transformed LG cells into tumor cells that proliferated vigorously like immature prohemocytes in adult abdomens and exhibited invasive phenotypes in the hosts. We believe that the Drosophila mxc mutant is a useful model for understanding the invasion and metastasis of malignant cells in blood cancers since acute myeloid and lymphocytic leukemia cells also frequently invade most of organs and tissues (Whiteley et al., 2021).
In general, normal cells require anchorage supported by the ECM for survival and proliferation, whereas common cancer cells survive and proliferate without attachment to the ECM (Mori et al., 2009). In contrast, normal blood cells, especially lymphoid cells, can proliferate in suspension (Longjohn et al., 2022). Although normal hemocytes from the LGs did not survive and/or proliferate in the adult cavity, the transplanted mutant LG cells were present in the hemolymph of the abdominal cavity. Thus, we speculate that mxc mutant hemocytes may have acquired the ability to proliferate in the hemolymph, even away from the LG. Alternatively, mutant cells may not require growth factors secreted locally from the LG for proliferation. Normal prohemocytes require growth factors, such as PDGF‐ and VEGF‐related factors (Pvf), mainly from the posterior signaling center of the LG (Parsons & Foley, 2013). To clarify the proliferative potential of mutant hemocytes, it would be interesting to investigate whether hemocytes can proliferate autonomously in cell culture systems.
3.2. Hyperactivation of the JNK is involved in the invasion of the mxc mbn1 hemocytes via ectopic induction of MMPs that decompose ECM
The JNK pathway is a critical regulator of multiple cellular responses, such as wound repair, cell proliferation, and apoptosis (Javelaud et al., 2003). In Drosophila, JNK signaling also regulates BM degradation in the case that imaginal disc eversion progresses by controlling the expression of MMP genes (Srivastava et al., 2007). MMPs are required for the destruction of cell–cell junctions, cell‐BM junctions, and BM components. A previous study demonstrated that MMP1 cleaves E‐cadherin to disrupt cadherin‐mediated cell–cell adhesion (Jia et al., 2014). In contrast, MMP2 preferentially degrades BM components (Jia et al., 2014). Thus, the transcriptional regulation of MMPs by the JNK pathway plays an important role in tissue remodeling during Drosophila development. MMP upregulation has been observed in many types of human cancers. Furthermore, the upregulation and ectopic expression of these peptidases are involved in cancer progression (Gobin et al., 2019; Niland et al., 2021). Consistently, a recent study showed the activation of JNK and, thus, the resultant ectopic expression of MMPs occurred in LG tumors of mxc mutants (Kinoshita et al., 2022). A previous study reported that the ectopic induction of MMP1 in hemocytes enhances the LG tumor growth and excess numbers of circulating hemocytes in mutant larvae (Kurihara, Takarada, & Inoue, 2020). Based on these results, we hypothesized that the hyperactivation of JNK induces the expression of MMPs in mxc mbn1 LG, which promotes ECM degradation and facilitates tumor growth. Higher levels of MMP2 have been observed in several cases of aggressive breast and lung cancers (Han & Lee, 2022; Mendes et al., 2007). Similarly, in Drosophila mxc mbn1 LGs, we expected that cell motility would increase if ECM decomposition was enhanced by the upregulation of MMPs. We demonstrated that JNK was activated; therefore, MMPs were highly expressed in the LGs and circulating hemocytes in mxc mbn1 larvae (Kinoshita et al., 2022; this study). Consequently, the BM around the hemocytes that adhered to the CNS was disassembled. Moreover, the ectopic depletion of mRNAs for JNK components or Mmps in mutant hemocytes resulted in the suppression of their adherence to other tissues. Considering these results, it is possible to speculate that the mutant hemocytes acquired a growth advantage and invasion ability due to the over‐ and ectopic expression of MMPs via the hyperactivation of the JNK pathway.
3.3. Invasive potential of mxc mutant hemocytes involved in filopodia extension activated by the JNK
Normal epithelial cells maintain strong contact with adjacent cells via the ECM and cell adhesion apparatus. During migration, highly dynamic filopodia and lamellipodia are formed in mammalian tumor cells, which promote the proteolytic degradation of the ECM. These alterations facilitate tumor invasion (Amack, 2021; Karamanou et al., 2020). Consistent with this, we showed that circulating hemocytes with extended filopodia were frequently present in mxc mutant larvae. JNK activation was required to elongate filopodia in hemocytes. Several mammalian studies have also reported the hyperactivation of JNK in prostate cancer cells, which plays an essential role in stimulating cell migration and invasion (Chen et al., 2017; Si‐Tu et al., 2019). The Drosophila JNK pathway regulates the Rho‐kinase‐dependent activation of myosin II during the invasion of epithelial tumor cells (Benhra et al., 2018). These findings are consistent with our hypothesis that the hyperactivation of JNK in mxc mbn1 hemocytes stimulates the formation of actin‐based protrusions and promotes invasion by increasing hemocyte mobility. To clarify this hypothesis, examining whether Rho‐kinase and myosin II are involved in the invasion of hemocytes by mxc mbn1 larvae is important.
4. CONCLUSIONS
In this study, we present evidence that mxc mbn1 LG cells exhibit malignant tumor phenotypes. We propose that the mutant be regarded as a Drosophila model for studying blood tumor cells. We also discuss the mechanisms underlying the invasion of mutant LG tumor cells. Ectopic expression of MMPs and filopodia extension via JNK pathway is involved in the invasion of the LG tumor cells in mxc mbn1 larvae. Our findings also provide insights that will help us better understand the invasion mechanism of human leukemia cells.
5. EXPERIMENTAL PROCEDURES
5.1. Drosophila stocks
w 1118 (w) was used as normal control stocks. Canton S was used as a recipient wild‐type stock for transplantation of LG cells. The recessive lethal allele of mxc, mxc mbn1 (#6360), showing the LG tumor phenotype, was obtained from Bloomington Drosophila Stock Center (BDSC, Indiana University, Bloomington, IN, USA) (Araki et al., 2019; Kurihara, Komatsu, et al., 2020; Remillieux‐Leschelle et al., 2002). and P{w +mC =UAS‐LacZ.NZ}J312 (UAS‐LacZ) (#107532 Drosophila Genetic Resource Center; DGRC, Kyoto, Japan). The following Gal4 driver stocks were used for ectopic expression in specific larval tissues or cells as described; P{Hml‐GAL4Δ}(Hml‐Gal4) (#BL30139; BDSC) (Kurihara, Komatsu, et al., 2020) for induction of gene expression in the CZ of LG and circulating hemocytes, P{He‐GAL4.Z}85 (He‐Gal4) (#8700) from BDSC for moderate induction of gene expression in whole LGs region and circulating hemocytes (Kurihara, Komatsu, et al., 2020). To label target cells by GFP, we used P{w +mC =UAS‐GFP.nls}8 (#4776) and P{w +mC =UAS‐2xEGFP}AH3 (UAS‐EGFP) (#6658) from BDSC. To monitor gene expression of the Mmp2, P{w +mW.hs =GawB}Mmp2 NP0509 (Mmp2‐GAL4) (#103625) from DGRC (Kanda et al., 2019; Kinoshita et al., 2022) were used. To visualize basement membrane component, collagen IV, PBac{fTRG00595.sfGFP‐TVPTBF}VK00033 (Vkg‐GFP) (#318167, Vienna Drosophila Resource Center (VDRC, Vienna, Austria) was used. For dsRNA‐dependent gene silencing, the following UAS‐RNAi stocks were used; P{TRiP.JF01275}attP2 (UAS‐bskRNAi 1 ) (#31323) (Zhu et al., 2019), P{TRiP.HMC03539}attP2 (UAS‐bskRNAi HMC03539 ) (UAS‐bskRNAi 2 ) (#53310) (Yang et al., 2019), P{TRiP.GL00089}attP2 (UAS‐hepRNAi GL00089 ) (UAS‐hepRNAi) (#28710) (Sopko et al., 2014) from BDRC, P{KK108894}VIE‐260B (UAS‐Mmp1RNAi) (#101505, VDRC), P{TRiP.HMJ23143}attP40 (UAS‐Mmp2RNAi) (#11605, National Institute of Genetics (Mishima, Japan) (Kinoshita et al., 2022). It was reported that those UAS‐RNAi stocks were able to provide the efficient depletion of the relevant mRNAs by combination with Gal4 drivers. P{w +mC =UAS‐GFP.dsRNA.R}142 (BDSC, BL#9330) or P{w +mC =UAS‐LacZ.NZ}J312 (UAS‐LacZ) (#107532 Drosophila Genetic Resource Center [DGRC, Kyoto, Japan]) was used as a control for the RNAi experiments.
All Drosophila stocks were maintained on standard cornmeal food, as previously described (Oka et al., 2015). Induction of Gal4‐dependent gene expression was performed at 28°C. Other experiments and stock maintenance were conducted at 25°C.
5.2. Transplantation of LG cells
As reported previously (Jung et al., 2005; Remillieux‐Leschelle et al., 2002), half of the primary lobe of the normal LG (containing approximately 1000 cells) and the same size of the mutant LG lobe from mature third instar larvae were collected and transplanted using glass needles into the abdomens of recipient 0–1 days‐old wild‐type adult females. We selected the mxc mutant larvae among larvae in the stock carrying FM7a‐mCherry balancer using the absence of RFP fluorescence. The needles were prepared from G1.2 (Narishige Co., Tokyo, Japan) using a puller, PN‐31, and used a after sharpening of the tip. Donor LG fragments were injected within 5 min of dissection of the recipient larvae to avoid melanization and clogging. The injected adults were fed standard food for 20 days at 25°C before observation.
5.3. Preparation of larval LGs
The parent flies were transferred to a new culture vial and left to lay eggs for 24 h. Careful attention was paid to avoid overcrowding of the larvae. To minimize the possibility that the larva that stayed longer at the larval stage might grow larger, a comparative analysis of hemizygous mutant and control larvae was performed on the same day (5 days AEL at 28°C), when the wandering third instar larvae were observed. Alternatively, tissues were collected from hemizygous mutant larvae 1 day after tissue collection from the control larvae. A pair of anterior lobes of the LG were collected from matured third stage larvae in PBS and fixed in 3.7% paraformaldehyde for 15 min. After washing with PBS containing 0.1% Triton X‐100 (PBST), the fixed each LG pair was mildly flattened under constant pressure such that the tissue spread out into cell layers of constant thickness, as previously described (Araki et al., 2019).
5.4. LG immunostaining
For immunostaining, whole LG lobes were collected from matured third instar larvae and fixed in 3.7% paraformaldehyde for 15 min at room temperature. After washing with PBST, the fixed samples were blocked with PBS containing 0.1% Triton X‐100 and 10% normal goat serum (NGS) and subsequently incubated with a primary antibody at 4°C for overnight. Anti‐phospho‐SAPK/JNK (pThr183, pTyr185) antibody (#559309, Calbiochem, La Jolla, CA, USA) was used to detect the activated JNK at 1:200. After washing with PBST, the LG samples were incubated with Alexa 488, 555 or 594‐conjugated secondary antibody (1:400; Molecular Probes, Eugene, OR, USA). The LG specimens were observed using a fluorescence microscope (Olympus, Tokyo, Japan, model: IX81), outfitted with excitation, emission filter wheels (Olympus). The specimens were illuminated with UV‐filtered and shuttered light through a GFP filter cube using appropriate filter‐wheel combinations using the appropriate filter wheel combinations through a GFP filter cube. The fluorescent images were captured using a CCD camera (Hamamatsu Photonics, Shizuoka, Japan), processed using Metamorph version 7.6 (Molecular Devices, Sunnyvale, CA, USA), and processed using Adobe Photoshop CS6 (Adobe Systems, San Jose, CA, USA). The fluorescence intensity of the LGs in the fluorescence microscope images was measured using ImageJ (1.53t, NIH, Bethesda, MD, USA).
5.5. CNS immunostaining
CNSs were isolated from matured third instar larvae and rinsed well with PBST to remove the remaining hemolymph on the surface. The CNSs were fixed in 3.7% paraformaldehyde for 30 min at a room temperature. After washing with PBST, the fixed CNS samples were blocked with NGS for 30 min and were incubated with a primary antibody at 4°C for overnight. Anti‐P1 antibody against Nimrod C1 (a gift from I. Ando; Hungarian Academy of Sciences, Budapest, Hungary) was used to recognize the plasmatocytes at 1:200 (Kurucz et al., 2007). After washing, specimens were incubated with Alexa 555 secondary antibody (1:400; Molecular Probes). The surfaces and interiors of the CNS were observed using A1+ (Nikon, Tokyo, Japan) by altering the focal planes along the Z‐axis. Subsequently, the confocal images obtained were processed using NIS‐Elements (Nikon) and Adobe Photoshop CS6. Multiple images were assembled into a single image using Photoshop CS6.
5.6. Preparation of circulating hemocytes in larval hemolymph
Single mature larvae at the third instar stage were dissected in Drosophila Ringer solution (DR) (10 mM, Tris–HCl pH 7.2, 3 mM CaCl2・2H2O, 182 mM KCL, 46 mM NaCl) and placed on glass slides. The larval epidermis was cut using a pair of fine forceps to allow circulating hemocytes to be released into the DR outside the larvae. Whole aliquots of the cell suspension were placed on glass slides, allowed to evaporate, and fixed in 4% paraformaldehyde for 10 min. After washing with PBST, DAPI‐stained hemocytes were prepared as described (Kurihara, Takarada, & Inoue, 2020).
5.7. Immunostaining of circulating hemocytes in larval hemolymph
Hemocytes in larval hemolymph were collected in DR on the slide glasses from matured third instar larvae and fixed in 4% paraformaldehyde for 10 min. After washing with PBST, the fixed cells were blocked with 10% NGS for 30 min and incubated with primary antibodies at 4°C for overnight. The following antibodies were used as primary antibodies; anti‐phospho‐SAPK/JNK antibody (#559309, Sigma‐Aldrich, St. Louis, MO, USA) at 1:200, anti‐Mmp1 antibodies (#3A6B4, #3B8D12, and #5H7B11, DSHB, Iowa, USA) at 1:300 for each, and anti‐P1 antibody at 1:200 (Kurucz et al., 2007). To visualize F‐actin, Alexa Flour 488‐conjugated‐phalloidin (#A12379, Thermo Fisher, Carlsbad, CA, USA) diluted at 1:100 was added with the primary antibodies. After washing with PBST, the fixed cells were incubated with Alexa 488‐, Alexa 555‐ or Alexa 594‐conjugated secondary antibody (1:400; Molecular Probes). The fluorescence intensity of the anti‐phospho‐SAPK/JNK immunostaining in hemocytes was quantified using Image J. The cells were classified into five categories based on the intensity levels: cells showing less than 10 intensity values in ImageJ were classified as category (I), those with 10 to 40 intensity values were classified as category (II), those with intensity values of 40 to 70 as the moderate category (III), those with 70 to 100 intensity values as the intense category (IV), and those with intensity values higher than 100 as the most intense category (V).
5.8. Statistical analysis
Scatter plots were created using GraphPad Prism 9 (GraphPad Software, San Diego, CA, USA) or Microsoft Office Excel 2016 (Microsoft, Redmond, WA, USA) to determine the number of hemocytes on the CNS, fluorescence intensity of LGs or circulating hemocytes, and proportion of abnormal cells with extended filopodia. Each dataset was assessed using Welch's t test or Student's t test as previously described (Araki et al., 2019; Kurihara, Komatsu, et al., 2020; Kurihara, Takarada, & Inoue, 2020). An F‐test was performed to determine the equal or unequal variances. Welch's t‐test was performed when the p‐value was less than .05 (unequal variance). Student's t‐test was performed when the value was greater than 0.05 (with equal variance). One‐way ANOVA was used for analyzing differences in more than two groups. Statistical significance is shown in each figure: *; p < .05, **; p < .01, ***; p < .001, and ****; p < .0001.
AUTHOR CONTRIBUTIONS
Kazuki Takarada carried out all of observations of the mutant phenotypes, immunostaining, and qRT‐PCR experiments confocal microscopic observation of the LGs. Juri Kinoshita performed phalloidin staining of hemocytes in the larval hemolymph. Yoshihiro H. Inoue planned, organized the project, and led the interpretation of the data. Kazuki Takarada and Yoshihiro H. Inoue wrote the manuscript. All the authors have read and approved the final version of the manuscript.
FUNDING INFORMATION
This study was partially supported by Grant‐in‐Aid for Scientific Research C (17K07500) to YHI.
CONFLICT OF INTEREST STATEMENT
The authors declare no conflicts of interest.
Supporting information
Data S1: Supporting information.
ACKNOWLEDGMENTS
We thank D. Hultmark (Umea Univ.) for providing fly stock, I. Ando (Hungarian Academy of Sciences) for giving anti‐P1 antibody. We also thank Bloomington Drosophila Stock Center, National Institute of Genetics, Drosophila Genetic Resource Center, Vienne Drosophila RNAi Center for providing fly stocks.
Takarada, K. , Kinoshita, J. , & Inoue, Y. H. (2023). Ectopic expression of matrix metalloproteinases and filopodia extension via JNK activation are involved in the invasion of blood tumor cells in Drosophila mxc mutant. Genes to Cells, 28(10), 709–726. 10.1111/gtc.13060
Communicated by: Tadashi UEMURA
REFERENCES
- Amack, J. D. (2021). Cellular dynamics of EMT: Lessons from live in vivo imaging of embryonic development. Cell Communication and Signaling: CCS, 19, 79. 10.1186/s12964-021-00761-8 [DOI] [PMC free article] [PubMed] [Google Scholar]
- Araki, M. , Kurihara, M. , Kinoshita, S. , Awane, R. , Sato, T. , Ohkawa, Y. , & Inoue, Y. H. (2019). Anti‐tumour effects of antimicrobial peptides, components of the innate immune system, against haematopoietic tumours in Drosophila mxc mutants. Disease Models & Mechanisms, 12, dmm037721. 10.1242/dmm.037721 [DOI] [PMC free article] [PubMed] [Google Scholar]
- Armstrong, A. J. , Marengo, M. S. , Oltean, S. , Kemeny, G. , Bitting, R. L. , Turnbull, J. D. , Herold, C. I. , Marcom, P. K. , George, D. J. , & Garcia‐Blanco, M. A. (2011). Circulating tumor cells from patients with advanced prostate and breast cancer display both epithelial and mesenchymal markers. Molecular Cancer Research, 9, 997–1007. 10.1158/1541-7786 [DOI] [PMC free article] [PubMed] [Google Scholar]
- Banerjee, U. , Girard, J. R. , Goins, L. M. , & Spratford, C. M. (2019). Drosophila as a genetic model for hematopoiesis. Genetics, 211, 367–417. 10.1534/genetics.118.300223 [DOI] [PMC free article] [PubMed] [Google Scholar]
- Benhra, N. , Barrio, L. , Muzzopappa, M. , & Milán, M. (2018). Chromosomal instability induces cellular invasion in epithelial tissues. Developmental Cell, 47, 161–174.e4. 10.1016/j.devcel.2018.08.021 [DOI] [PubMed] [Google Scholar]
- Chen, P. C. , Tang, C. H. , Lin, L. W. , Tsai, C. H. , Chu, C. Y. , Lin, T. H. , & Huang, Y. L. (2017). Thrombospondin‐2 promotes prostate cancer bone metastasis by the up‐regulation of matrix metalloproteinase‐2 through down‐regulating miR‐376c expression. Journal of Hematology & Oncology, 10, 33. 10.1186/s13045-017-0390-6 [DOI] [PMC free article] [PubMed] [Google Scholar]
- Evans, C. J. , Hartenstein, V. , & Banerjee, U. (2003). Thicker than blood: Conserved mechanisms in Drosophila and vertebrate hematopoiesis. Developmental Cell, 5, 673–690. 10.1016/s1534-5807(03)00335-6 [DOI] [PubMed] [Google Scholar]
- Fares, J. , Fares, M. Y. , Khachfe, H. H. , Salhab, H. A. , & Fares, Y. (2020). Molecular principles of metastasis: A hallmark of cancer revisited. Signal Transduction and Targeted Therapy, 5, 28. 10.1038/s41392-020-0134-x [DOI] [PMC free article] [PubMed] [Google Scholar]
- Gateff, E. (1994). Tumor‐suppressor genes, hematopoietic malignancies and other hematopoietic disorders of Drosophila melanogaster . Annals of the New York Academy of Sciences, 712, 260–279. 10.1111/j.1749-6632 [DOI] [PubMed] [Google Scholar]
- Gobin, E. , Bagwell, K. , Wagner, J. , Mysona, D. , Sandirasegarane, S. , Smith, N. , Bai, S. , Sharma, A. , Schleifer, R. , & She, J. X. (2019). A pan‐cancer perspective of matrix metalloproteases (MMP) gene expression profile and their diagnostic/prognostic potential. BMC Cancer, 19, 581. 10.1186/s12885-019-5768-0 [DOI] [PMC free article] [PubMed] [Google Scholar]
- Han, D. S. , & Lee, E. O. (2022). Sp1 plays a key role in vasculogenic mimicry of human prostate cancer cells. International Journal of Molecular Sciences, 23, 1321. 10.3390/ijms23031321 [DOI] [PMC free article] [PubMed] [Google Scholar]
- Holz, A. , Bossinger, B. , Strasser, T. , Janning, W. , & Klapper, R. (2003). The two origins of hemocytes in Drosophila . Development, 130, 4955–4962. 10.1242/dev.00702 [DOI] [PubMed] [Google Scholar]
- Jabłońska‐Trypuć, A. , Matejczyk, M. , & Rosochacki, S. (2016). Matrix metalloproteinases (MMPs), the main extracellular matrix (ECM) enzymes in collagen degradation, as a target for anticancer drugs. Journal of Enzyme Inhibition and Medicinal Chemistry, 31, 177–183. 10.3109/14756366.2016 [DOI] [PubMed] [Google Scholar]
- Javelaud, D. , Laboureau, J. , Gabison, E. , Verrecchia, F. , & Mauviel, A. (2003). Disruption of basal JNK activity differentially affects key fibroblast functions important for wound healing. The Journal of Biological Chemistry, 278, 24624–24628. 10.1074/jbc.M301942200 [DOI] [PubMed] [Google Scholar]
- Jia, Q. , Liu, Y. , Liu, H. , & Li, S. (2014). Mmp1 and Mmp2 cooperatively induce Drosophila fat body cell dissociation with distinct roles. Scientific Reports, 4, 7535. 10.1038/srep07535 [DOI] [PMC free article] [PubMed] [Google Scholar]
- Jiang, W. G. , Sanders, A. J. , Katoh, M. , Ungefroren, H. , Gieseler, F. , Prince, M. , Thompson, S. K. , Zollo, M. , Spano, D. , Dhawan, P. , Sliva, D. , Subbarayan, P. R. , Sarkar, M. , Honoki, K. , Fujii, H. , Georgakilas, A. G. , Amedei, A. , Niccolai, E. , Amin, A. , … Santini, D. (2015). Tissue invasion and metastasis: Molecular, biological and clinical perspectives. Seminars in Cancer Biology, 35, S244–S275. 10.1016/j.semcancer.2015.03.008 [DOI] [PubMed] [Google Scholar]
- Jung, S. H. , Evans, C. J. , Uemura, C. , & Banerjee, U. (2005). The Drosophila lymph gland as a developmental model of hematopoiesis. Development, 132, 2521–2533. 10.1242/dev.01837 [DOI] [PubMed] [Google Scholar]
- Kanda, H., Shimamura, R., Koizumi‐Kitajima, M., & Okano, H. (2019). Degradation of extracellular matrix by matrix metalloproteinase 2 is essential for the establishment of the blood‐brain barrier in Drosophila . iScience, 16, 218–229. 10.1016/j.isci.2019.05.027 [DOI] [PMC free article] [PubMed] [Google Scholar]
- Karamanou, K. , Franchi, M. , Onisto, M. , Passi, A. , Vynios, D. H. , & Brézillon, S. (2020). Evaluation of lumican effects on morphology of invading breast cancer cells, expression of integrins and downstream signaling. The FEBS Journal, 287, 4862–4880. 10.1111/febs.15289 [DOI] [PubMed] [Google Scholar]
- Kinoshita, S. , Takarada, K. , Kinoshita, Y. , & Inoue, Y. H. (2022). Drosophila hemocytes recognize lymph gland tumors of mxc mutants and activate the innate immune pathway in a reactive oxygen species‐dependent manner. Biology Open, 11, bio059523. 10.1242/bio.059523 [DOI] [PMC free article] [PubMed] [Google Scholar]
- Kurihara, M. , Komatsu, K. , Awane, R. , & Inoue, Y. H. (2020). Loss of histone locus bodies in the mature hemocytes of larval lymph gland result in hyperplasia of the tissue in mxc mutants of Drosophila . International Journal of Molecular Sciences, 21, 1586. 10.3390/ijms21051586 [DOI] [PMC free article] [PubMed] [Google Scholar]
- Kurihara, M. , Takarada, K. , & Inoue, Y. H. (2020). Enhancement of leukemia‐like phenotypes in Drosophila mxc mutant larvae due to activation of the RAS‐MAP kinase cascade possibly via down‐regulation of DE‐cadherin. Genes to Cells, 25, 757–769. 10.1111/gtc.12811 [DOI] [PubMed] [Google Scholar]
- Kurucz, E. , Márkus, R. , Zsámboki, J. , Folkl‐Medzihradszky, K. , Darula, Z. , Vilmos, P. , Udvardy, A. , Krausz, I. , Lukacsovich, T. , Gateff, E. , Zettervall, C. J. , Hultmark, D. , & Andó, I. (2007). Nimrod, a putative phagocytosis receptor with EGF repeats in Drosophila plasmatocytes. Curr Biol, 17, 649–654. 10.1016/j.cub.2007.02.041 [DOI] [PubMed] [Google Scholar]
- LaFever, K. S. , Wang, X. , Page‐McCaw, P. , Bhave, G. , & Page‐McCaw, A. (2017). Both Drosophila matrix metalloproteinases have released and membrane‐tethered forms but have different substrates. Scientific Reports, 7, 44560. 10.1038/srep44560 [DOI] [PMC free article] [PubMed] [Google Scholar]
- Lee, E. Y. H. P. , & Muller, W. J. (2010). Oncogenes and tumor suppressor genes. Cold Spring Harbor Perspectives in Biology, 2, a003236. 10.1101/cshperspect.a003236 [DOI] [PMC free article] [PubMed] [Google Scholar]
- Lin, Y. C. , Tsai, P. H. , Lin, C. Y. , Cheng, C. H. , Lin, T. H. , Lee, K. P. H. , Huang, K. Y. , Chen, S. H. , Hwang, J. J. , Kandaswami, C. C. , & Lee, M. T. (2013). Impact 6of flavonoids on matrix metalloproteinase secretion and invadopodia formation in highly invasive A431‐III cancer cells. PLoS One, 8, e71903. 10.1371/journal.pone.0071903 [DOI] [PMC free article] [PubMed] [Google Scholar]
- Longjohn, M. N. , Phan, H. D. , & Christian, S. L. (2022). Culturing suspension cancer cell lines. Methods in Molecular Biology, 2508, 9–17. 10.1007/978-1-0716-2376-3_2 [DOI] [PubMed] [Google Scholar]
- Lu, W. , & Kang, Y. (2019). Epithelial‐mesenchymal plasticity in cancer progression and metastasis. Developmental Cell, 49, 361–374. 10.1016/j.devcel.2019.04.010 [DOI] [PMC free article] [PubMed] [Google Scholar]
- Melcarne, C. , Lemaitre, B. , & Kurant, E. (2019). Phagocytosis in Drosophila: From molecules and cellular machinery to physiology. Insect Biochemistry and Molecular Biology, 109, 1–12. 10.1016/j.ibmb.2019.04.002 [DOI] [PubMed] [Google Scholar]
- Mendes, O. , Kim, H. T. , Lungu, G. , & Stoica, G. (2007). MMP2 role in breast cancer brain metastasis development and its regulation by TIMP2 and ERK1/2. Clinical & Experimental Metastasis, 24, 341–351. 10.1007/s10585-007-9071-0 [DOI] [PubMed] [Google Scholar]
- Miles, W. O. , Dyson, N. J. , & Walker, J. A. (2011). Modeling tumor invasion and metastasis in Drosophila . Disease Models & Mechanisms, 4, 753–761. 10.1242/dmm.006908 [DOI] [PMC free article] [PubMed] [Google Scholar]
- Mori, S. , Chang, J. T. , Andrechek, E. R. , Matsumura, N. , Baba, T. , Yao, G. , Kim, J. W. , Gatza, M. , Murphy, S. , & Nevins, J. R. (2009). Anchorage‐independent cell growth signature identifies tumors with metastatic potential. Oncogene, 28, 2796–2805. 10.1038/onc.2009.139 [DOI] [PMC free article] [PubMed] [Google Scholar]
- Niland, S. , Riscanevo, A. X. , & Eble, J. A. (2021). Matrix metalloproteinases shape the tumor microenvironment in cancer progression. International Journal of Molecular Sciences, 23, 146. 10.3390/ijms23010146 [DOI] [PMC free article] [PubMed] [Google Scholar]
- Oka, S. , Hirai, J. , Yasukawa, T. , Nakahara, Y. , & Inoue, Y. H. (2015). A correlation of reactive oxygen species accumulation by depletion of superoxide dismutases with age‐dependent impairment in the nervous system and muscles of Drosophila adults. Biogerontology, 16, 485–501. 10.1007/s10522-015-9570-3 [DOI] [PubMed] [Google Scholar]
- Pagliarini, R. A. , & Xu, T. (2003). A genetic screen in Drosophila for metastatic behavior. Science, 302, 1227–1231. 10.1126/science.1088474 [DOI] [PubMed] [Google Scholar]
- Paluch, E. K. , Aspalter, I. M. , & Sixt, M. (2016). Focal adhesion‐independent cell migration. Annual Review of Cell and Developmental Biology, 32, 469–490. 10.1146/annurev-cellbio-111315-125341 [DOI] [PubMed] [Google Scholar]
- Parsons, B. , & Foley, E. (2013). The Drosophila platelet‐derived growth factor and vascular endothelial growth factor‐receptor related (Pvr) protein ligands Pvf2 and Pvf3 control hemocyte viability and invasive migration. The Journal of Biological Chemistry, 288, 20173–20183. 10.1074/jbc.M113.483818 [DOI] [PMC free article] [PubMed] [Google Scholar]
- Parvy, J. P. , Yu, Y. , Dostalova, A. , Kondo, S. , Kurjan, A. , Bulet, P. , Lemaître, B. , Vidal, M. , & Cordero, J. B. (2019). The antimicrobial peptide defensin cooperates with tumour necrosis factor to drive tumour cell death in Drosophila . eLife, 8, e45061. 10.7554/eLife.45061 [DOI] [PMC free article] [PubMed] [Google Scholar]
- Petrie, R. J. , & Yamada, K. M. (2012). At the leading edge of three‐dimensional cell migration. Journal of Cell Science, 125, 5917–5926. 10.1242/jcs.093732 [DOI] [PMC free article] [PubMed] [Google Scholar]
- Remillieux‐Leschelle, N. , Santamaria, P. , & Randsholt, N. B. (2002). Regulation of larval hematopoiesis in Drosophila melanogaster: A role for the multi sex combs gene. Genetics, 162, 1259–1274. 10.1093/genetics/162.3.1259 [DOI] [PMC free article] [PubMed] [Google Scholar]
- Santamaría, P. , & Randsholt, N. B. (1995). Characterization of a region of the X chromosome of Drosophila including multi sex combs (mxc), a Polycomb group gene which also functions as a tumour suppressor. Molecular & General Genetics, 246, 282–290. 10.1007/BF00288600 [DOI] [PubMed] [Google Scholar]
- Shrestha, R. , & Gateff, E. (1982). Ultrastructure and cytochemistry of the cell types in the larval hematopoietic organs and hemolymph of Drosophila melanogaster. Development, Growth & Differentiation, 24, 65–82. 10.1111/j.1440-169X.1982.00065.x [DOI] [PubMed] [Google Scholar]
- Si‐Tu, J. , Cai, Y. , Feng, T. , Yang, D. , Yuan, S. , Yang, X. , He, S. , Li, Z. , Wang, Y. , Tang, Y. , Ye, C. , & Li, Z. (2019). Upregulated circular RNA circ‐102004 that promotes cell proliferation in prostate cancer. International Journal of Biological Macromolecules, 122, 1235–1243. 10.1016/j.ijbiomac.2018.09.076 [DOI] [PubMed] [Google Scholar]
- Sopko, R. , Foos, M. , Vinayagam, A. , Zhai, B. , Binari, R. , Hu, Y. , Randklev, S. , Perkins, L. A. , Gygi, S. P. , & Perrimon, N. (2014). Combining genetic perturbations and proteomics to examine kinase‐phosphatase networks in Drosophila embryos. Developmental Cell, 31(1), 114–127. [DOI] [PMC free article] [PubMed] [Google Scholar]
- Srivastava, A., Pastor‐Pareja, J. C., Igaki, T., Pagliarini, R., & Xu, T. (2007). Basement membrane remodeling is essential for Drosophila disc eversion and tumor invasion. Proceedings of the National Academy of Sciences of the United States of America, 104, 2721–2726. 10.1073/pnas.0611666104 [DOI] [PMC free article] [PubMed] [Google Scholar]
- Stefanidakis, M. , Karjalainen, K. , Jaalouk, D. E. , Gahmberg, C. G. , O'Brien, S. , Pasqualini, R. , Arap, W. , & Koivunen, E. (2009). Role of leukemia cell invadosome in extramedullary infiltration. Blood, 114, 3008–3017. 10.1182/blood-2008-04-148643 [DOI] [PMC free article] [PubMed] [Google Scholar]
- Uhlirova, M. , & Bohmann, D. (2006). JNK‐ and Fos‐regulated Mmp1 expression cooperates with Ras to induce invasive tumors in Drosophila . The EMBO Journal, 25, 5294–5304. 10.1038/sj.emboj.7601401 [DOI] [PMC free article] [PubMed] [Google Scholar]
- Vicente‐Manzanares, M. , Ma, X. , Adelstein, R. S. , & Horwitz, A. R. (2009). Non‐muscle myosin II takes centre stage in cell adhesion and migration. Nature Reviews. Molecular Cell Biology, 10, 778–790. 10.1038/nrm2786 [DOI] [PMC free article] [PubMed] [Google Scholar]
- Voutouri, C. , Kirkpatrick, N. D. , Chung, E. , Mpekris, F. , Baish, J. W. , Munn, L. L. , Fukumura, D. , Stylianopoulos, T. , & Jain, R. K. (2019). Experimental and computational analyses reveal dynamics of tumor vessel cooption and optimal treatment strategies. Proceedings of the National Academy of Sciences of the United States of America, 116, 2662–2671. 10.1073/pnas.1818322116 [DOI] [PMC free article] [PubMed] [Google Scholar]
- Whiteley, A. E. , Price, T. T. , Cantelli, G. , & Sipkins, D. A. (2021). Leukaemia: a model metastatic disease. Nature Reviews. Cancer, 21, 461–475. 10.1038/s41568-021-00355-z [DOI] [PMC free article] [PubMed] [Google Scholar]
- Winkler, J. , Abisoye‐Ogunniyan, A. , Metcalf, K. J. , & Werb, Z. (2020). Concepts of extracellular matrix remodelling in tumour progression and metastasis. Nature Communications, 11, 5120. 10.1038/s41467-020-18794-x [DOI] [PMC free article] [PubMed] [Google Scholar]
- Yang, S. A. , Portilla, J. M. , Mihailovic, S. , Huang, Y. C. , & Deng, W. M. (2019). Oncogenic notch triggers neoplastic tumorigenesis in a transition‐zone‐like tissue microenvironment. Developmental Cell, 49, 461–472. 10.1016/j.devcel.2019.03.015 [DOI] [PMC free article] [PubMed] [Google Scholar]
- Yasothornsrikul, S., Davis, W. J., Cramer, G., Kimbrell, D. A., & Dearolf, C. R. (1997). Viking: Identification and characterization of a second type IV collagen in Drosophila . Gene, 198, 17–25. 10.1016/s0378-1119(97)00274-6 [DOI] [PubMed] [Google Scholar]
- Zhu, S. , Chen, R. , Soba, P. , & Jan, Y. N. (2019). JNK signaling coordinates with ecdysone signaling to promote pruning of Drosophila sensory neuron dendrites. Development, 146, dev163592. 10.1242/dev.163592 [DOI] [PMC free article] [PubMed] [Google Scholar]
Associated Data
This section collects any data citations, data availability statements, or supplementary materials included in this article.
Supplementary Materials
Data S1: Supporting information.