

Abstract
DNA nanotechnology is a rapidly growing field that provides exciting tools for biomedical applications. Targeting lysosomal functions with nanomaterials, such as DNA nanostructures (DNs), represents a rational and systematic way to control cell functionality. Here we present a versatile DNA nanostructure-based platform that can modulate a number of cellular functions depending on the concentration and surface decoration of the nanostructure. Utilizing different peptides for surface functionalization of DNs, we were able to rationally modulate lysosomal activity, which in turn translated into the control of cellular function, ranging from changes in cell morphology to modulation of immune signaling and cell death. Low concentrations of decalysine peptide-coated DNs induced lysosomal acidification, altering the metabolic activity of susceptible cells. In contrast, DNs coated with an aurein-bearing peptide promoted lysosomal alkalization, triggering STING activation. High concentrations of decalysine peptide-coated DNs caused lysosomal swelling, loss of cell-cell contacts, and morphological changes without inducing cell death. Conversely, high concentrations of aurein-coated DNs led to lysosomal rupture and mitochondrial damage, resulting in significant cytotoxicity. Our study holds promise for the rational design of a new generation of versatile DNA-based nanoplatforms that can be used in various biomedical applications, like the development of combinatorial anti-cancer platforms, efficient systems for endolysosomal escape, and nanoplatforms modulating lysosomal pH.
Keywords: DNA nanotechnology, Nanotechnology, lysosome interference, bio/nano interactions, Interferon, Lysosomal rupture
1. Introduction
Despite decades of intensive research, the targeted delivery of functional nanomaterials to specific subcellular compartments remains a critical challenge in the field of nano-biomedicine[1-3]. To facilitate cellular targeting and uptake, surface functionalization with specific receptor-binding moieties is usually employed, leading to enhanced formation of endocytic vesicles [4]. These vesicles follow a sequence of fusion events, first with early and then with late endosomes, culminating in fusion with lysosomal compartments [5]. Of note, the majority of the primary targets of nanocarriers often reside outside the endolysosomal system [1-3, 6], so for efficient therapeutic effect it is critical for the carriers to escape these compartments in order to avoid lysosomal degradation [1-3, 6]. Consequently, strategies promoting lysosomal escape of functionalized nanocarriers have become a major research direction for enhancing therapeutic efficacy [7-9]. However, emerging evidence suggests that despite these efforts, most nanoparticles and their cargo predominantly accumulate in the lysosomes, and do not reach their intended targets [10].
It is worth noting that alterations in lysosomal activity and/or dysfunction are tightly linked with the progression of many human diseases, such as lysosomal storage disorders, cancer, autoimmune disorders, neurodegenerative diseases, and cardiovascular diseases [11, 12]. Consequently, emerging evidence on the relation between lysosomal function/dysfunction and disease has provided a solid foundation for the development of therapeutic strategies that specifically target regulation of lysosome function via several approaches [11-14]. It is possible to target lysosomes with pharmacological agents that directly affect the lysosomal environment, such as lysosomal acidification inhibitors (e.g. chloroquine), or v-ATPase inhibitors (e.g. bafilomycin A1) [15-18]. It is also possible to restore lysosomal functions by either delivering active lysosomal components or through genetic manipulation [11-14]. Additionally, an emerging strategy proposes utilizing selectively biodegradable materials that target lysosomal degradation pathways [14].
Of note, the ability of nanoparticles to accumulate in lysosomes has inspired promising approaches for the selective regulation of lysosomal function to improve therapeutic outcomes [19-21]. Particular advances were achieved in the design of protein-loaded nanosystems, which can be used in enzyme replacement therapies for several lysosomal storage disorders [22-24]. However, because lysosomes are actively involved in cell death regulation, such a targeting strategy might generate adverse effects and even systemic toxicity [13, 25]. Alternatively, different dynamic pH-dependent nanocarrier systems were proposed to overcome systemic toxicity and improve the modulation of lysosomal functions, such as proton-driven nano-transformers, mixed-charge nanoparticles, and DNA nano-frameworks [19, 26-30]. However, all these platforms targeted the modulation of only one cellular physiological outcome, providing either immunomodulatory or cytotoxic effects. Recently an elegant nanoformulation based on proton-driven dynamic DNA nano-frameworks was proposed to rationally control several functions of lysosomes, a phenomenon termed lysosome interference [31]. Lysosomal interference is characterized by the modulation of lysosomal acidity, which is accompanied by alterations in hydrolase activity. These changes ultimately influence a range of cellular responses, from cell motility to the regulation of cell death pathways [31, 32].
Here we propose to modulate lysosomal interference with biodegradable DNA nanostructures (DNs). Due to their excellent self-assembly properties, biocompatibility, and programmability, DNs have been recognized as versatile way to tailor nanomaterials for various biomedical applications [33-37]. Although DNs have been shown to successfully target lysosomes and modulate their function [38-40], there are no studies on using a single DN platform to modulate multiple lysosomal functions via lysosome interference. Furthermore, there are no examples of synergistically combining the effects of the DNA itself with bioactive peptides. We used a 6-helix bundle (6HB) nanostructure as a platform for decoration with electrostatic peptide coatings [41], and functionalization with an endosome escape peptide sequence [42]. An oligolysine peptide was found to be effective for coating and stabilization of DNs, and we previously explored its ability to modulate lysosomal effects [41, 43]. Thus, we selected decalysine peptide (K10) as one of the functional decorations of DNs. Additionally, we coated DNs with a peptide that flanks a central K10 block with two copies of an aurein 1.2 peptide, which was found to impart endosomal escape properties when fused to proteins [42]. We hypothesized that such a peptide would enhance lysosomal interference by increasing lysosomal permeabilization. Of note, generally peptides fused with cationic sequences are being active investigated to promote electrostatic interactions with the anionic cell membrane and serve as potential pharmaceutical agents. However, most of such peptides lack potency, produce transient effects, and suffer from limited cytosolic bioavailability. Coating or entrapping peptides in various nanocarriers is a potent strategy to overcome those limitations [44-46]. In this study we show that after accumulation in lysosomes, DNs were degraded by lysosomal enzymes, and the products of degradation were released into the cytosol. Modulation of lysosomal function was observed due to lysosome interference, which originated via distinct protonation effects that were dependent on both the surface coating and the concentration of the DNs. As a result, using the same biodegradable DNs platform with different coatings, we were able to selectively stimulate distinct cellular responses, ranging from metabolic activity inhibition and immunomodulatory effects to cell death. While various nanocarrier systems have been developed to modulate lysosomal function, these platforms typically target only a single cellular outcome, offering either immunomodulatory or cytotoxic effects [19, 26-30]. In contrast, our study introduces a versatile DNA nanostructure-based platform capable of modulating multiple cellular functions through concentration-dependent effects and surface decoration with bioactive peptides. This dual functionality marks a significant advancement in the field. To our knowledge, this work is the first to decorate DNA nanostructures with a specific endosome escape moiety for effectively modulating lysosomal activity and impacting cellular functions. Additionally, the potential immunomodulatory effects of DNA nanostructures in epithelial non-immune cells have not been explored, so our work provides valuable insight into this area as well.
2. Experiments
2.1. Materials
The information on chemicals, fluorescent probes, assays, and antibodies, including manufacturers, catalogue numbers, and dilutions, can be found in Tables S1, S2, S3 and S4 of Supplemental Materials. Sequences of DNA staples and peptides used in the study are summarized in Tables S8 and S9 of Supplemental Materials.
2.2. Cell culture
The human hepatocellular cell lines Alexander (PLC/PRF/5) (American Type Culture Colection, ATCC) and Huh7 (Japanese Collection of Research Bioresources, JCRB) and human hepatoblastoma cell line HepG2 (American Type Culture Colection, ATCC) were cultured in EMEM medium without L-Glutamine (BioConcept Ltd., Switzerland, cat. no. 1-31S01-I) supplemented with 10% fetal bovine serum (FBS, qualified, heat inactivated, Brazil, GibcoTM, cat. no. 10500-064), 1% Penicilin-Streptomycin-Glutamine Solution 100x (Serana Europe GmbH, Germany, cat. no. RAL-001-100ML) in a humidified 5% CO2 atmosphere at 37 °C. Cells were regularly checked for common culture contamination, such as Mycoplasma using MycoAlert Detection Assay (Lonza, Switzerland). All cell lines were authenticated by short tandem repeat (STR) DNA profiling (ATCC, Manassas, VA, USA). HEK293T cells (American Type Culture Colection, ATCC) were cultured in DMEM medium supplemented with 10% fetal bovine serum and 1% Penicilin-Streptomycin-Glutamine Solution 100x (Serana Europe GmbH, Germany, cat. no. RAL-001-100ML) in a humidified 5% CO2 atmosphere at 37 °C.
The human glioblastoma cell line U87MG was kindly provided by Dr. Olga Šebestová Janoušková, Ph.D., Jan Evangelista Purkyně University in Ústí nad Labem, Czech Republic. The U87MG cells were cultured in DMEM/F12 medium (Gibco™, United Kingdom, cat. no. 2331-020) supplemented with 1% L-Glutamine 200mM (100X) (Gibco™, United Kingdom, cat. no. 25030-081), 10% fetal bovine serum (Fetal Bovine Serum, value (formerly USDA-approved in North America or qualified, Brazil in other regions), Gibco™, United Kingdom, cat. no. A5256701), and 1% Penicillin-Streptomycin (100X) (Gibco™, USA, cat. no. 15070-063) in a humidified 5% CO2 atmosphere at 37 °C.
2.3. Fabrication and characterization of DNs
DNs were synthesized and characterized as described previously [43]. Briefly, all oligonucleotides were obtained from Integrated DNA Technologies (Coralville, Iowa) and purified using 8% urea-based denaturing polyacrylamide gel electrophoresis (PAGE). One strand was labeled with AlexaFluor-488 for imaging in the agarose gels and in microscopy experiments. Each strand was added to a mixture at 5 μM in 1x tris-acetic acid-EDTA (TAE) buffer with 12.5 mM MgCl2 and annealed from 95 to 4 °C over 2 hours. The successful formation of the 6-helix bundle was confirmed using agarose gel electrophoresis. DN size and zeta potential were characterized utilizing a Zetasizer Nano (Malvern Instruments). DNs were dispersed in PBS, pH 7.4.
Atomic force microscopy (AFM) images were captured using a Bruker Multimode 8 system with a Nanoscope V controller in ScanAsyst in Fluid mode, utilizing ScanAsyst-Fluid+ AFM probes (Bruker, k ~0.7 N/m, tip radius <10 nm). A 2 μL sample was deposited on freshly cleaved mica, followed by the addition of 48 μL of 1x TAE with 12.5 mM Mg2+ for 2 minutes. To enhance the adsorption of DNA nanostructures on the mica surface, the surface was pretreated using a 1 mM NiCl2 buffer.
2.4. Peptide synthesis and characterization
To obtain the molecules for coating the DNs, peptides were synthesized using Fmoc-based solid phase peptide synthesis (CEM Liberty Blue) and characterized via MALDI-TOF mass spectrometry (Bruker Microflex) as described previously [43].
2.5. DN coating and characterization
The DNs (1 μM) were mixed with the desired K10-containing peptide at a 1:1 N:P ratio in PBS (pH 7.4) and incubated at room temperature for a minimum of 2 hours. In order to determine the optimal N:P ratio for complete coating of the DNs, the structures were electrophoresed using 1.5% agarose gels at 65V for 60 minutes and imaged using a 1:10 mol ratio of fluorescein-labeled K10 to K10.
2.6. Total cellular metabolic activity assay
We utilized the alamarBlue reagent (Thermo Fisher Scientific, Waltham, MA, USA) to analyze metabolic activity of cells treated with DNs. AlamarBlue was successfully implemented in the assessment of metabolic activity of human cell lines in vitro [47]. Briefly, the method is based on the enzymatic cleavage of resazurin to resorufin by metabolically active cells. This cleavage results in elevated alamarBlue color intensity. Subsequently, the percentage of metabolically active cells in the culture is calculated based on the absorbance. We performed metabolic activity assessment of cells via the alamarBlue assay according to guidelines of the manufacturer. Cell lines (Alexander, HepG2 or Huh7) were grown in 96-well plates at the density of 5000 cells per well and incubated with different concentrations of DNs for 24, 48 or 72 h. Afterwards, the alamarBlue reagent was supplemented to each well, and plates were incubated for 2 h at 37 °C. The absorbance of the alamarBlue was measured by TECAN microplate reader SpectraFluor Plus (TECAN, Mannedorf, Switzerland) at 570 nm. Readings were done in triplicate, with three independent experiments performed for each measurement. Previously we checked that synthesized DNs do not interfere with the alamarBlue assay readout, providing reliable results [43].
2.7. Cell viability analysis
Cell viability was assessed by monitoring loss of plasma membrane integrity microscopically [48]. Cells were treated with different DNs (10, 100 and 500 nM) for 24, 48 and 72 h. After the treatment, cells were stained with propidium iodide (PI) and the nuclei were counterstained with Hoechst 33342. As a membrane-impermeable dye, PI is typically excluded from viable cells. Conversely, cells with ruptured plasma membrane accumulate PI, where it stains nuclear DNA, amplifying its fluorescence by 20 to 30 times [49]. Assessment of the plasma membrane integrity loss by PI staining is recognized as a universal indicator of cell death [49]. Labeled cells were then imaged by confocal microscopy at 20x magnification, and the numbers of dead (PI-positive) cells and the total number (Hoechst-stained) of cells were counted using the ImageJ software (NIH, Bethesda, MD, USA). The viability was expressed as the ratio of PI-negative cells to total cells. Cell viability was calculated as a percentage of viable cells as follows: cell viability (%) = [number of Hoechst-stained cells – number of PI-positive cells]/[number of Hoechst-stained cells] x 100%. In total, we assessed n = 10-20 randomly selected fields per condition out of three independent experiments to achieve reliable statistical sampling. As a positive control, cells were treated with 20% ethanol for 60 min.
2.8. Analysis of DN degradation by cells using FRET imaging
An Olympus confocal imaging system (Olympus, Tokyo, Japan), described previously [43], was used for FRET measurements. Cells were grown in 6-channel μ-Slides (Ibidi, Martinsried) and incubated with 6HB containing FRET reporter dyes [6-carboxyfluorescein (FAM) donor and TAMRA acceptor] at a 50-nM concentration for distinct periods of time (24, 48 and 72 h). Briefly, the FAM probe in cells underwent excitation with a 488 nm laser, and fluorescence was gathered through a BA510-550 filter (Olympus, Tokyo, Japan). Simultaneously, the FRET signal was detected using a BA575IF filter (Olympus, Tokyo, Japan). In the case of TAMRA probe imaging, a 561 nm excitation laser was employed, and emission was captured through a BA575IF filter (Olympus, Tokyo, Japan). Confocal FRET analyses were conducted following previously described methodology “FRET and colocalization analyzer – Users guide” [50]. Confocal images were analyzed for FRET efficacy using the “FRET and colocalization analyzer” ImageJ plug-in [50]. “Colocalized FRET index” images, that present the calculated amount of FRET for each pixel in the FRET channel, were generated. Mean gray values of resultant “colocalized FRET index” images were measured using the ImageJ software (NIH, Bethesda, MD, USA). 6HBs containing either 6-carboxyfluorescein (FAM) donor or TAMRA acceptor only were used as negative controls.
2.9. Lysosomal pH measurements
Semiquantitative confocal microscopy imaging was utilized for lysosomal acidity measurements. Cells (Alexander, HepG2 or Huh7) were treated with different types of DNs (at 50 nM concentration) for either 24 or 48 h. After incubation, cells were labeled with lysosomal pH marker LysoSensor™ Blue DND-167 (Thermo Fisher Scientific, Waltham, MA, USA). The LysoSensor™ dyes function as acidotropic probes, seemingly concentrating in acidic organelles due to protonation. This protonation process yields an increase in fluorescence intensity. Consequently, the LysoSensor™ reagents demonstrate a pH-dependent elevation in fluorescence intensity when subjected to acidification [51]. After staining, living cells were washed with PBS for three times, and then immediately imaged using spinning disk confocal microscopy IXplore SpinSR (Olympus, Tokyo, Japan). The fluorescence intensity of LysoSensor was quantified using the ImageJ software (NIH, Bethesda, MD, USA). Data were collected from n = 50 cells out of three independent experiments.
2.10. Cell transfection
To specifically label the lysosomes, we used CellLight™ Lysosomes-RFP, BacMam 2.0 (Thermo Fisher Scientific, Waltham, MA, USA), a fusion construct of LAMP1, which enables accurate and specific targeting to cellular lysosomes with red fluorescent protein (RFP) [52]. Transfection was performed according to guidelines of the manufacturer. Typically, a multiplicity of infection (MOI) of 30 was employed for transfection at 37 °C for 24 h. The expression level of RFP protein was next confirmed by using fluorescence imaging prior to further experiments. Nuclei were counterstained with Hoechst 33342. Labeled cells were then imaged by confocal microscopy. Lysosomal size and circularity were measured using the ImageJ software (NIH, Bethesda, MD, USA).
2.11. RNA isolation and real-time PCR
Alexander, HepG2 and Huh7 cells were treated with different DNs at 10 and 50 nM concentrations for 48 h. After the treatment, the total RNA from cells was isolated using RNeasy Mini Kit (Qiagen, Hilden, Germany), followed by DNA removal using RNase-Free DNase Set (Qiagen, Hilden, Germany). A Nanodrop One microvolume UV-Vis spectrophotometer (Thermo Fisher Scientific, Waltham, MA, USA) was used to cross-check the integrity and quantity of the isolated RNA. Subsequently, cDNA was synthesized using Maxima H Minus First Strand cDNA Synthesis Kit (Thermo Fisher Scientific, Waltham, MA, USA). We utilized 2 μg of RNA to synthesize cDNA according to previously published protocols [53, 54].
Next, we performed quantitative real-time PCR on a QuantStudio™ 6 Flex Real-Time PCR System (Thermo Fisher Scientific, Waltham, MA, USA) utilizing the Fast Advanced TaqMan Gene expression Master mix (Thermo Fisher Scientific, Waltham, MA, USA) and specific TaqMan Gene Expression Assays (Table S4). Data were assessed using MS Excel and the MaxStat Pro 3.6 software (MaxStat, Cleverns, Germany). The expression of target genes was normalized to GAPDH expression utilizing the 2−ΔΔCt methodology previously published in [55].
2.12. Cell extracts and immunoblot analysis
We conducted an analysis of protein expression in samples of DN-treated cells (Alexander, HepG2 and Huh7) employing the semiquantitative method of immunoblot analysis. To achieve rapid and efficient cell lysis and protein solubilization, we used a radioimmunoprecipitation (RIPA) buffer from Millipore, Burlington, VT, USA, following both the manufacturer's instructions and our validated protocol [56, 57]. To ensure the equal loading of proteins, we determined the total protein concentration in cell lysates using the Micro BCA Protein assay Kit (Thermo Fisher Scientific, Waltham, MA, USA) following the manufacturer's instructions. Subsequently, we prepared samples of whole-cell lysates with an equivalent protein concentration of 1 mg/mL. The protein samples were separated through SDS-PAGE and then transferred onto polyvinylidene difluoride (PVDF) membranes. Blocking of membranes was performed by incubating them with 5% (w/v) nonfat dried milk or alternatively with 5% (w/v) BSA for 1 hour. Following blocking, PVDF membranes were incubated overnight at 4 °C with various specific primary antibodies, as summarized in Table S3. Afterward, the membranes were washed in tris-buffered saline with 0.1% Tween® 20 detergent (TBST) buffer and incubated with the corresponding HRP-conjugated secondary antibody (Table S3) for 1 hour. the chemiluminescence signal was detected by the imaging system G:BOX CHEMI XRQ (Syngene, Synoptics Group, Cambridge, UK), using the acquisition software GeneTools (Syngene, Synoptics Group, Cambridge, UK). Densitometric quantification of the intensity of the bands was carried out using the GeneTools quantification software (Syngene, Synoptics Group, Cambridge, UK).
2.13. Lysosomal integrity assay
Cells were plated onto 96-well clear bottom plates at a density of 5000 cells per well. Following a 48-hour treatment of cells (Alexander, HepG2, or Huh7) with various concentrations (50 and 500 nM) of different types of DNs, lysosomal stability was assessed using an acridine orange (AO) assay. The AO assay adhered to a previously validated protocol [58], wherein cells with incorporated nanoparticles were labeled with 5 μg/mL AO in culture medium for 15 minutes at 37 °C. Following nanoparticle treatment, the intensity of orange fluorescence was measured using a microplate reader SpectraFluor Plus (TECAN, Mannedorf, Switzerland). Readings were done in triplicate. Three independent experiments were performed for each measurement. Normalized fluorescence data are presented as means ± SEM.
Furthermore, lysosomal integrity was assessed microscopically through lysosomal labeling with LysoTracker Red (Thermo Fisher Scientific, Waltham, MA, USA). LysoTracker Red, known for its high selectivity for acidic organelles such as lysosomes, exhibits fluorescence intensity corresponding to its accumulation in these structures [59]. Any ongoing lysosomal membrane permeabilization results in the loss of accumulated LysoTracker Red fluorescence signal. The reduction in fluorescence intensity was analyzed using a confocal imaging system (Olympus, Tokyo, Japan).
2.14. Mitochondrial damage assessment
Mitochondrial damage was assessed by detection of elevated mitochondrial reactive oxygen species (ROS). Mitochondrial ROS were measured using a previously described flow cytometry method [60]. Cells (Alexander, HepG2 or Huh7), were treated with different types of DNs (at 50 and 500 nM concentrations) for 48 h, stained with 5 μM MitoSOX Red (Thermo Fisher Scientific, Waltham, MA, USA) for 10 min and analyzed by flow cytometry. Flow cytometry measurements were conducted utilizing a CytoFLEX flow cytometer B53013 (Beckman Coulter, Brea, CA, USA). The acquired data were analyzed using CytExpert software (Beckman Coulter, Brea, CA, USA). MitoSOX Red was excited by a 488 nm laser, and data were collected at forward and side scatter, specifically in the fluorescence channel 582/42 nm (FL2). The fluorescence of MitoSOX Red was measured the FL2 channel. Cell debris, identifiable by a distinctive low forward scatter, were excluded from the analyses through gating procedures.
2.15. High-resolution spinning disk confocal microscopy
In order to be able to reveal clear subcellular details of DNs localization, we utilized a novel IXplore SpinSR Olympus high-resolution imaging system (Olympus, Tokyo, Japan), described previously [43, 58]. We utilized 6-channel μ-Slides (Ibidi, Martinsried) for cell seeding. Afterwards, cells were treated with different concentrations of fluorescently-labelled DNs. Next, cells were stained for specific cellular structures using fluorescent probes, as summarized in Table S2. The imaging system consists of the following units: an inverted microscope (IX83; Olympus, Tokyo, Japan) and a spinning disc confocal unit (CSUW1-T2S SD; Yokogawa, Musashino, Japan). Fluorescence data for image reconstruction were collected via either a 100 x silicone immersion objective (UPLSAPO100XS NA 1.35 WD 0.2 silicone lens, Olympus, Tokyo, Japan) or a 20 x objective (LUCPLFLN20XPH NA 0.45 air lens, Olympus, Tokyo, Japan). The following lasers were used to excite fluorophores: 405 nm laser diode (50 mW), 488 nm laser diode (100 mW), and 561 nm laser diode (100 mW). Confocal images were acquired at a 2,048 × 2,048-pixel resolution. The fluorescent images were collected by appropriate emission filters (BA420-460; BA575IF; BA510-550; Olympus, Tokyo, Japan) and captured concurrently by two digital CMOS cameras ORCA-Flash4.0 V3 (Hamamatsu, Hamamatsu City, Japan). Fluorescence confocal images were acquired using software cellSens (Olympus, Tokyo, Japan). Quantitative image analysis was performed by selecting randomly ~ 5-10 visual fields per each sample, using the same setting parameters (i.e. spinning disk speed, laser power and offset gain).
2.16. Spinning disk superresolution microscopy
To analyze visualize lysosomes in living cells with high resolution and contrast, we utilized the IXplore SpinSR Olympus super-resolution imaging system (Olympus, Tokyo, Japan). Cells (Alexander, HepG2 or Huh7) were seeded in 6-channel μ-Slides (Ibidi, Gräfelfing, Germany). Next, cells were treated with different types of DNs (at 50 nM concentration) for either 24 or 48 h. To visualize lysosomes, cells were transduced with CellLight® LAMP1-RFP. Fluorescence images were acquired using the cellSens acquisition software (Olympus, Tokyo, Japan). ImageJ software (NIH, Bethesda, MD, USA) was used for image processing and analysis.
2.17. Image quantification
To measure lysosomal size and circularity, cells were stained with LysoTracker Red and CellLight® LAMP1-RFP (both probes from Thermo Fisher Scientific, Waltham, MA, USA). Nuclei were counterstained with Hoechst 33342 (Thermo Fisher Scientific, Waltham, MA, USA). The stained cells were imaged using spinning disk confocal microscopy IXplore SpinSR (Olympus, Tokyo, Japan). The average lysosomal size per cell was measured using ImageJ software (NIH, Bethesda, MD, USA), and lysosomal circularity was assessed using the particle analyzer plugin in ImageJ software.
To investigate the release of DNs from lysosomal compartments, colocalization analysis was conducted. Following the incubation, cells were labeled with the lysosomal marker LysoTracker® Blue DND-22 (Thermo Fisher Scientific). The stained cells were subsequently analyzed using the abovementioned confocal system. Fluorescence images were captured using the cellSens software (Olympus, Tokyo, Japan). For a quantitative assessment of colocalization, the Pearson correlation coefficient was calculated. This coefficient provides a robust estimate of the overall association between probes, measuring pixel-by-pixel correlation and normalized mean values ranging from −1 (anticorrelation) to 1 (correlation) [61, 62]. The calculation of the Pearson correlation coefficient was performed using the Coloc 2 tool available in ImageJ [12].
2.18. Generation of 3D multicellular aggregates of cancer cells
3D multicellular aggregates were created utilizing previously published hanging drop technique [63]. In summary, Huh7, HepG2, Alexander, and glioblastoma cells were separately suspended in complete culture medium (DMEM/F12 with 10% FBS). Then, the suspensions (20000 cells/well) were seeded to BIOFLOAT™ 96-well Cell Culture Plate with Ultra-low attachment surface (faCellitate, Mannheim, Germany, F202003). To achieve the aggregation of cells, cells were cultured for 3 days with media change after 2 days in culture. At day 4, the generated multicellular aggregates were treated with different types of DNs (at 500 nM concentration) for 48 h. After the treatment, multicellular aggregates were stained with propidium iodide (PI) and nuclei were counterstained with Hoechst 33342. Labeled cells were then imaged by confocal microscopy.
2.19. Statistical analysis
Cellular viability and metabolic activity were analyzed and represented as mean ± SEM. The ANOVA analysis with subsequent Newman-Keuls test was utilized to assess the statistical significance of differences between the groups. MaxStat Pro 3.6 software (MaxStat Software, Germany) was used to perform all statistical analyses. Differences were considered statistically significant at (*) P < 0.05.
Quantitative assessment of fluorescence microscopy analysis, specifically evaluating lysosomal acidity, size, circularity, and DNA nanostructure-lysosome colocalization, adhered to well-defined guidelines [64]. Guidelines for quantitative confocal microscopy, as outlined in previous publications [65, 66], were employed for this analysis. The quantitative microscopy analysis utilized images from three independent experiments, with each experiment encompassing 10 randomly selected fields from each sample. The determination of the sample size followed a statistical methodology outlined in a prior publication [67]. Accordingly, the sample size for 95 % confidence level and 0.9 statistical power is calculated as n=30. Therefore, a minimum of 30 randomly selected cells were analyzed for statistically relevant fluorescence microscopy image quantification.
In summary, the determination of the sample size was based on a statistical methodology previously published in [67], assuming a 95% confidence level and 0.9 statistical power.
3. Results and discussion
3.1. Synthesis and characterization of peptide-coated DNA nanostructures
To test the hypothesis that DNA nanostructures can interact and selectively modulate lysosomal functions in living cells, we used a 6-helix bundle (6HB) platform (Fig. 1a) [68]. This bundle is a rigid and monomeric DNA nanostructure, roughly 7 x 6 nm in size (Fig. 1a and S1). Overall, DNA nanotechnology enables the design and synthesis of versatile tools for various biomedical applications [34-37], but one advantage of the 6HB structure is that it is small (consisting of just six strands), which enables relatively high concentrations of particles to be used, and it is easy to form in a simple annealing step. The 6HB nanoplatform has also been found to selectively interact with several cell types [68, 69]. We previously showed that such structures effectively target lysosomes in living cells [43], but we did not explore whether they possess long-lasting effects on lysosomes, and whether we can use 6HB as a versatile platform for modulating the lysosomal functions. It is worth noting that DNA nanoplatforms were shown to control only a single specific lysosomal function [19, 26-30]. Intriguingly, proton-driven self-assembly of DNA nano-frameworks recently were found to modulate several functions of lysosomes [31]. In the cited study, the DNA nanoplatform was self-assembled inside lysosomes, leading to a reduction in acidity and an inhibition of hydrolase activity [31]. We hypothesized that utilizing a self-assembled, biodegradable DNA nanostructure system would enable control over lysosomal functions upon its enzymatic degradation (Fig. 1b). Given the fact that the 6HB nanostructure can be easily functionalized with bioactive peptides via cationic oligolysine peptide interactions [41, 43], we used this platform in the current study to affect lysosomal activity (Fig. 1).
Fig. 1.

Design of functionalized DNA nanostructures for control over lysosomal activity in cells. (a) Scheme of DN synthesis and peptide coating. (b) Schematic representation of DN-driven impact on lysosomal function. Created with BioRender.com.
We have already shown that the 6HB can be easily coated with a decalysine peptide (K10), or with a peptide that flanks a central K10 block with two copies of an aurein 1.2 peptide (a known endosomal escape sequence [42]); we term this K10-[aurein 1.2]2 peptide “EE” (Fig. 1a) [43]. It is important to highlight that coating DNs with oligolysine has been shown to significantly enhance their stability against denaturation under physiological conditions, without causing any noticeable distortion or aggregation of the structures [41, 43]. The use of oligolysine offers several advantages, primarily due to the simplicity and efficiency of the synthesis process. This method leverages electrostatic interactions, making it straightforward to implement. The coating is easily achieved by mixing stock solutions of DNs and oligolysine at appropriate stoichiometric ratios, followed by a brief incubation at room temperature [41, 43]. Building on this approach, we extended the strategy to coat DNs with a functional endosome escape peptide, specifically aurein 1.2. This was accomplished by flanking a central K10 block with two copies of the aurein 1.2 peptide, which allowed us to improve the synthesis yield and accelerate the peptide coating process [43]. Thus, we utilized three types of DNs: bare 6HB nanostructures, K10-coated 6HBs, and EE-coated 6HBs. The K10-coated 6HBs served as control DNs to demonstrate that the observed cellular effects were specifically due to the K10-[aurein 1.2]2 coating, rather than the decalysine peptide alone.
We previously characterized the physicochemical properties of these three DNs [43], and a summary of these parameters is presented in Figure S1. Briefly, 6HB is a platform for decoration with peptides. It can be synthesized with a high production yield through a straightforward annealing process (Fig. 2a). The resulting bundle structure, approximately 7 x 6 nm in size, is a rigid monomeric assembly (Fig. 2a, c, d). 6HB can be easily coated with designed peptides via electrostatic interactions (Fig. 2b,c,d). Apart from differences in zeta potential resulting from the different coatings, the DNs also showed slightly different mean hydrodynamic diameters: 13.5 nm, 20 nm, and 28.5 nm for the 6HB, K10, and EE nanostructures (Fig. 2c, S1 and S2) respectively. The greater diameter for the latter two structures is in line with their expected sizes given the respective peptide coatings. An assessment of DNs using AFM and dynamic light scattering (DLS) revealed that all three types of DNs structures in buffer solution are predominantly monodisperse, with minimal aggregation (Fig. 2c,d). This indicates that the peptide coating did not induce particle aggregation. Furthermore, size distribution analysis of all three types of DNs by DLS after one month of storage showed similar size profiles (Fig. S3-5), demonstrating the stability of the DNs following peptide coating and during prolonged storage.
Fig. 2.

Characterization of functionalized DNA nanostructures. (a) Agarose gel electrophoresis (1.5% agarose) used to determine the synthesis efficacy of the 6 helix bundle (6HB). (b) Agarose gel electrophoresis (1.5% agarose) used to determine the coating of 6HB with K10 and EE peptides. (c) Characterization of the particles dissolved in PBS measured with a Zetasizer Nano (Malvern Instruments). Full data on size distribution is presented in Fig. S2 of Supplemental Materials. (d) AFM characterization of the DNs. Scale bar is 200 nm.
While coating DNs with oligolysine peptides was successfully demonstrated in previous studies [41, 70-72], our work marks a significant advancement by being the first to incorporate the endosome escape signal aurein 1.2 into the design. Additionally, our approach utilizes a simple, bundle nanostructure composed of only six strands. This streamlined design offers several advantages over traditional DNA origami nanostructures, which typically consist of around 200 strands. Our method is not only more cost-effective and scalable but also holds greater potential for in vivo applications. Unlike DNA origami, which requires complex addressability and precise control over size, shape, curvature, and aspect ratio, our six-strand bundle provides a more straightforward and efficient alternative when such intricate features are not necessary. This in turn makes our design a more practical option for a wider range of research and therapeutic applications.
3.2. Biocompatibility of peptide-coated DNA nanostructures
It is well known that the sequestration of nanomaterials by the liver upon systemic administration represents a challenge for their successful clinical translation [73, 74]. On the other hand, the liver stands out as a crucial target organ for diverse nanoparticle-mediated therapies [75, 76]. These treatments have been employed in addressing a range of liver-related conditions, including hyperlipidemia and viral infections [75, 76]. Thus, it is important to study DN interactions with distinct liver cell types, but studies on DN-hepatic cell interactions are rather limited in the current literature. We previously showed that all three types of DNs (6HB, K10 and EE) are not toxic for hepatic cell lines (Alexander, HepG2, and Huh7), at concentrations up to 500 nM for a short period of time (24 h of treatment) [43]. However, we did not assess long-lasting effects of DNs on metabolic activity of cells, and the potential long-term cytotoxicity. In this study we firstly analyzed the impact of these three types of DNs on the metabolic activity of hepatic cell lines (HepG2, Huh7, and Alexander cells) after prolonged treatment. To assess the metabolic activity, we used an alamarBlue assay, based on enzymatic cleavage of resazurin to resorufin by metabolically active cells [47]. Short-term incubation (i.e., 24 h) with all three types of DNs (with concentrations as high as 500 nM) did not affect cellular metabolism in these three cell lines (Fig. 3). By contrast, 48 h of treatment with aurein-coated DNs (EE) at a 500 nM concentration triggered dramatic inhibition in the metabolic activities of all three cell lines (Fig. 3). Interestingly, the K10-coated DNs had a considerably lower effect on metabolic activity inhibition compared with the EE-coated nanostructures (Fig. 3). Treatment with K10 DNs at a concentration of 500 nM for 48 hours reduced metabolic activity by up to 40% in all three cell lines, whereas EE DNs achieved more than 80% inhibition (Fig. 3). These findings suggest that coating the 6HB with different peptides results in varying cellular outcomes. We hypothesized that EE DNs would have a greater effect on lysosomal activity compared to K10 DNs, due to the more significant disruption of lysosomal function caused by the aurein peptide.
Fig. 3.

Functionalized DNA nanostructures affect the total metabolic activity of cells. The total metabolic activity of Alexander (a), HepG2 (b) and Huh7 (c) cells was checked with an alamarBlue assay. Cells were treated with different DNs (10, 100 and 500 nM) for 24, 48 and 72 h. The data were normalized to control values (no DN particle exposure), which were set as 100% of the total metabolic activity of cells. Control cells were untreated. As a positive control, cells were treated with 20% ethanol for 30 min. Data are expressed as means ± SEM (n = 3). (*) P < 0.05, (**) P < 0.01 and (***) P < 0.001 denote statistically significant differences.
The Huh7 cell line was found to be the most susceptible to EE DN treatment, showing an inhibitory effect on metabolic activity at a concentration of only 100 nM after 48 h (Fig. 3c). Additionally, K10 at 100 nM after 72 h of incubation slightly inhibited the metabolism of Huh7 cells (Fig. 3). These data imply that the genetic background of even closely related cell lines is important to consider when comparing effects of DNs. Although HepG2, Huh7, and Alexander cells resemble the epithelial morphology of hepatic cells, they show differences in gene and protein expression [78-80]. It is important to note that cell assays based on metabolic readouts do not provide reliable information about the extent of cell death [81]. For instance, early-phase apoptosis events (e.g. mitochondrial damage, elevated ATP levels) can proceed without cell death execution [82]. Therefore, to verify the cytotoxic potential of DNs, we further assessed an end-point cell death marker, the loss of plasma membrane integrity [48].
To this end, we performed a propidium iodide (PI) exclusion assay[49]. Assessment of the plasma membrane integrity loss by PI staining is recognized as a universal indicator of cell death [49]. In line with the metabolic activity findings (Fig. 3), PI staining revealed that short-term incubation (i.e. 24 h) with all three types of DNs (with concentrations up to 100 nM) did not elicit cytotoxicity in HepG2, Huh7, and Alexander cells (Fig. 4). Treatment with EE DNs at a concentration of 500 nM induced a time-dependent cytotoxic response starting after 24 h of incubation in all three cell lines (Fig. 4). Slight toxicity was observed in Huh7 cells treated with 500 nM of K10 DNs after 72 h of incubation (Fig. 4c). However, this toxicity was mild in comparison with the drastic effect that the K10 DNs samples exerted on metabolic activity in Huh7 cells (Fig. 4c).
Fig. 4.

Functionalized DNA nanostructures affect the viability of cells. The viability of Alexander (a), HepG2 (b) and Huh7 (c) cells was checked using propidium iodide. Cells were treated with different DNs (10, 100 and 500 nM) for 24, 48 and 72 h. After the treatment, cells were stained with propidium iodide (PI) and nuclei were counterstained with Hoechst 33342. Labeled cells were then imaged by confocal microscopy, and the numbers of dead (PI-positive) cells and total number (Hoechst-stained) of cells were counted using the ImageJ software (NIH). The viability was expressed as the ratio of PI-negative cells to total cells. As a positive control, cells were treated with 20% ethanol for 60 min. Data are expressed as means ± SEM (n = 3). (***) P < 0.001 denotes statistically significant differences.
We conclude that both K10 and EE nanostructures showed significant time-dependent inhibitory effect on metabolic activity of all three cell lines at high concentrations and prolonged incubation times (Fig. 3). However, only the EE DNs elicited profound time-dependent cytotoxicity at high concentrations of 500 nM (Fig. 4).
3.3. Intracellular enzymatic degradability of DNA nanostructures
Like most nanoparticles upon uptake by cells, DNs will end up in lysosomes [10, 31, 37, 39]. Lysosomes, organelles containing over 60 distinct hydrolases, are known to play a crucial role in facilitating the breakdown of extracellular particles and intracellular components [83-85]. In fact, the considerable resilience of diverse DNA nanostructures has been demonstrated by numerous research, indicating that they persist unchanged in various physiological environments, and even inside cells, for a minimum of 24 hours [69, 86-90]. We previously showed that the three types of DNs explored herein (i.e. 6HB, K10 and EE) colocalize with lysosomes after cellular uptake and stay structurally intact for up to 24 h of treatment time [43]. However, DN structural stability can be affected by temperature, exposure time, and nanostructure design [91]. Thus, we next assessed whether DNs can be degraded by cells after prolonged incubations. To analyze the intracellular stability of DNs, we utilized a Förster resonance energy transfer (FRET)-based technique [69, 92] that we previously successfully adopted for assessment of 6HB stability (Fig. 5a) [43]. DNs are labeled with pair of the FRET reporter dyes [69, 92]; structurally intact DNs keep the dyes in close proximity, resulting in a high FRET efficiency, whereas upon degradation and disassembly of the DN structure the distance between donor and acceptor dyes increases, subsequently leading to a decrease in FRET efficiency (Fig. 5a) [69, 92].
Fig. 5.

Lysosomal degradation of DNA nanostructures. (a) Schematic presentation of principle of FRET microscopy analysis of DNA nanostructures degradation. Intact nanostructures labeled with FRET reporter dyes (6-carboxyfluorescein donor and TAMRA acceptor) show a high FRET index, whereas degradation of nanostructures leads to the increase in distance between donor and acceptor dyes, lowering the FRET index. (b) Quantification of FRET index images in mean gray values. Confocal images were taken and analyzed for FRET using the “FRET and colocalization analyzer” ImageJ plug-in [50]. “Colocalized FRET index” images present the calculated amount of FRET for each pixel in the FRET channel. Mean gray values of resultant “colocalized FRET index” images were measured using the ImageJ software (NIH). Representative images are shown in Supplementary Figures S6, S7, and S8. (c) Pearson coefficient statistics for analyzing the colocalization of DNs with lysosomes. Cells (Alexander, HepG2 or Huh7) were treated with different types of DNs (at 50 nM concentration) for either 24 or 48 h. After incubation, cells were labeled with lysosomal marker LysoTracker Blue DND-22 (Thermo Fisher Scientific). Stained cells were imaged using spinning disk confocal microscopy IXplore SpinSR (Olympus, Tokyo, Japan). The Pearson correlation coefficient for fluorophore pairs DNA–Lysosomes was calculated using the Coloc 2 tool available in ImageJ software (NIH) and is presented as means of n = 30-70 cells. (***) P < 0.001 denotes significant differences. Representative images are shown in supplementary Figures S10, S11, and S12. Violin plots were created using open-source software (http://www.bioinformatics.com.cn/login_en/). (d) Colocalization analysis of different DNs after 48 h of treatment. Cells were treated and processed as described in (c).
For the FRET analysis, we used previously characterized 6HB structures labelled with FRET reporter dyes (6-carboxyfluorescein (donor) and TAMRA (acceptor)) [43]. This FRET pair is characterized by a Förster distance of ~5 nm, which enables sensitive detection of DN structural changes by monitoring FRET efficiency [43, 92]. In fact, prolonged treatment of cells with a 50 nM concentration of DNs for 48 and 72 h resulted in a dramatic decrease in FRET efficiency (Fig. 5b, S6, S7, S8). In order to validate that single FRET reporter dyes do not interfere with resultant FRET efficiency, we utilized DNs labeled with either donor-only or acceptor-only fluorophores, which served as negative controls (Fig. S9). These data imply that after 48 h of treatment, cells enzymatically degrade DNs, leading to dramatic structural changes after 72 h of incubation (Fig. 5b, S6, S7, S8). In our previous study we found that DNs are stable within living cells for the shorter incubation period of 24 h [43].
3.4. Modulation of lysosomal activity by DNA nanostructures
It is worth noting that the biodegradability of various nanomaterials is being utilized in therapeutic strategies to either deliver active drugs or modulate/restore lysosomal functions via the products of nanoparticle degradation [3, 20, 96-98]. Additionally, biodegradability quite often is associated with biocompatibility and/or low toxicity of the material [99]. Thus, we hypothesized that biodegradable DNs (Fig. 5b), which do not elicit cytotoxic response at concentrations up to 100 nM (Fig. 4), may be used as a platform to modulate lysosomal activity.
Additionally, EE DNs contain approximately 42 copies of the aurein 1.2 peptide (sequence: GLFDIIKKIAESF), which was shown to effectively deliver cargos to the cytosol by inducing endolysosomal escape [42, 100] via membrane disruption [42, 100, 101]. Of note, this membrane permeation was not associated with triggering a cytotoxic response [42, 100, 101]. We previously showed that protein corona formation hinders the capability of aurein to induce endolysosomal escape [43]. However, in that study we checked the effect of protein corona only after a short (24 h) period of treatment. Generally, with different nanomaterials it has been shown that prolonged treatment results in the degradation of the protein corona in lysosomes, which may lead to the reappearance of nanoparticle activity, including cytotoxicity [102-104]. In fact, one recent study showed that nanoparticles and their protein corona are separated and sorted into distinct vesicles intracellularly [105]. Having found that DNs are degraded by cells after prolonged incubation, we hypothesized that the particles might elicit distinct effects on lysosomal function via the peptide coating that is co-delivered along with the nanostructure.
Thus, we checked whether prolonged incubation with DNs may have an effect on their retention in lysosomes, and whether the aurein coating would impact endolysosomal escape. Additionally, we determined that 48 h as the appropriate time point where DN degradation shows a significant effect (Fig. 5b). One reliable and robust method to study endolysosomal escape is microscopic colocalization imaging analysis [106-108]. We used DNs with green fluorescence-labelled DNA and a lysosomal fluorescent probe (LysoTracker® Blue DND-220) to observe nanostructures and endo/lysosomes, respectively, through confocal microscopy. Indeed, colocalization of three types of DNs with lysosomes showed marked decrease in all three cell lines after 48 h, compared with 24 h of incubation (Fig. 5c). This finding suggests that the products of DN lysosomal degradation are being released from lysosomes after prolonged incubation. Furthermore, the aurein coating significantly enhanced DN release from lysosomes in comparison with the K10 and 6HB samples (Fig. 5d, S10, S11, S12). Taken together, these results indicate that prolonged incubation with DNs leads to the lysosomal degradation of the particles, with some of the degradation products being released from the lysosomes. Additionally, the aurein coating enhances endolysosomal escape following extended incubation.
In the next step, we explored the effect of DNs on lysosomal functionality, including lysosomal acidity and integrity of the lysosomal membrane. LysoSensor Blue DND-167, a pH-dependent probe, was utilized to semiquantitatively assess the pH in lysosomes. This molecule has been shown to reliably assess lysosomal pH in living cells, markedly enhancing the fluorescence intensity upon increase in lysosomal acidity [109, 110]. Semiquantitative confocal microscopy analysis showed that 24 h treatment with all three DNs types strongly increases the fluorescence intensity of the LysoSensor probe, indicating enhanced lysosomal acidity (Fig. 6a and S13). Current evidence suggests that maturation of endosomes into lysosomes during nutrition and/or nanoparticle uptake is associated with increased acidification of vesiculas, creating acidified compartments for effective degradation and recycling of cellular components and/or engulfed material [25, 83, 111, 112]. Furthermore, nutrient turnover is known to enhance lysosomal activity by increasing acidification and delivery of hydrolases, which is needed to facilitate lysosomal degradation [83, 112], so it is not surprising that DN short-term uptake is associated with an increase in lysosomal acidity (Fig. 6a and S13). Longer incubation with 6HB revealed that lysosomal acidity restores back to the control levels after 48 h of treatment (Fig. 6a and S13). Given that we observe significant degradation of DNs by this time point (Fig. 5b), this result suggests stabilization of pH after facilitation of lysosomal degradation [83, 112].
Fig. 6.

Lysosome interference caused by DNA nanostructures. (a) Quantification of fluorescence intensity of LysoSensor from images in Supplementary Figure S9. Cells (Alexander, HepG2 or Huh7) were treated with different types of DNs (at 50 nM concentration) for either 24 or 48 h. After incubation, cells were labeled with lysosomal pH marker LysoSensor™ Blue DND-167 (Thermo Fisher Scientific). Stained cells were imaged using spinning disk confocal microscopy IXplore SpinSR (Olympus, Tokyo, Japan). The fluorescence intensity of LysoSensor was quantified using the ImageJ software (NIH). Data collected from n = 50 cells out of three independent experiments. (*) P < 0.05, (**) P < 0.01 and (***) P < 0.001 denote statistically significant differences. (b) Lysosomal integrity as measured by acridine orange (AO) red fluorescence decrease. Cells (Alexander, HepG2 or Huh7) were treated with different types of DNs (at 50 nM concentration) for either 24 or 48 h, stained with 5 μg/ml acridine orange (AO). After staining the fluorescence intensity was measured using a fluorescent microplate reader. Data are expressed as means ± SEM (n = 4). (**) P < 0.01 and (***) P < 0.001 denote statistically significant differences.
Interestingly, K10 DN treatment for 48 h led to sustained lysosomal acidification (Fig. 6a and S13). By contrast, prolonged incubation of EE DNs with cells resulted in moderate alkalization of lysosomal pH (Fig. 6a and S13). It is worth noting that these lysosomal pH changes were not associated with the induction of lysosomal membrane permeabilization upon treatment with all three types of DNs (Fig. 6b). In other words, K10 DNs induced acidification and EE DNs induced alkalization of lysosomal pH, without lysosomal damage, which could potentially trigger cell death. When the pH within lysosomes approaches the nearly neutral pH found in the cytosol, there is a potential for the lysosomal membrane to undergo lysis [3, 46]. Emerging evidence suggests that various cationic nanoparticles may induce buffering of the lysosomal pH, mitigating endolysosomal escape [3, 46, 113], a hypothesis termed the “proton sponge” effect [3, 46, 113]. Buffering of the lysosomal pH has been found for distinct nanomaterials, like poly-(ethylenimine), ethylenediamine, DNA nanoframeworks, cationic gold nanorods, and silver nanocrystallites [31, 114-118]. In our case, the alkalization of lysosomal pH is presumably due to functionalization with the aurein peptide. Bare 6HB DNs do not induce a disturbance in lysosomal pH after 48 h (Fig. 6a), and short-term treatment with 6HB induces acidification of lysosomes due to the endocytic process (Fig. 6a). Only the aurein coating results in alkalization of the lysosomal pH without lysosomal damage (Fig. 6). It is worth noting that aurein 1.2 has been shown to have endolysosomolytic properties [42, 43, 100, 101]. In fact endolysosomolytic agents are known to induce loss of acidity and membrane leakage of endo/lysosomes [119]. The precise mechanism of aurein action on membranes is not fully understood. One hypothesis, termed the “carpet mechanism,” postulates that aurein interacts with the membrane surface in a way that facilitates the interaction of hydrophobic residues with lipid tails, while hydrophilic residues engage with polar lipid head groups [120]. Another hypothesis proposes pore formation by aurein [121, 122]. Of note, membrane leakage induced by aurein was found to enhance endolysosomal escape without massive membrane disruption, and without leading to cytotoxic effects [42, 100, 101]. Thus, summarizing our data and the current literature about the action of aurein, we can conclude that the peptide, which is presumably released from the DN, modulates the alkalization of lysosomal pH.
Furthermore, K10-coated DNs, in addition to modulating lysosomal pH, induce acidification (Fig. 6a) without concomitant disruption of the lysosomal membrane (Fig. 6b). Interestingly, specific amino acid supplementation, including lysine, has been found to induce vacuolar-type H+-ATPase (a proton-pumping membrane protein) activation, resulting in lysosomal acidification [126]. Thus, it is reasonable to posit that K10 release during DN degradation stimulates acidification of lysosomes.
To further validate the effects of DNs on lysosomal pH and activity, we performed morphodynamic assessment of lysosomes. Under normal physiological conditions, alterations in nutrients lead to a temporary increase in lysosomal size, followed by a reduction [83]. This phenomenon is attributed to membrane fusion and subsequent fission events [83]. Upon the completion of lysosomal degradation, lysosomes revert to their typical small sizes through a process known as lysosomal reformation [83]. Alternatively, elevations in both vesicular content and osmolarity can lead to the enlargement of the lysosomal compartments [83, 127]. Uncontrolled progressive accumulation of undigested materials and osmotic imbalance may eventually result in lysosomal rupture [13, 25, 83, 84, 112, 128]. In order to more accurately analyze lysosomal dynamics, we used ready-to-use construct CellLight Lysosomes-RFP BacMam 2.0, which enables robust and efficient labeling of lysosomes via expression of a fusion construct of LAMP1 (lysosomal associated membrane protein 1) with red fluorescent protein (RFP) in live cells [129, 130]. Analysis of lysosomal size upon DN uptake revealed that, after 24 h of treatment with 50 nM of all three types of DNs, lysosomal size increased (Fig. 7a,b and S14, S15). Longer incubation (48 h treatment) with 6HB and K10 DNs showed signs of lysosomal reformation, i.e. lysosomal size reverted back to the original size (Fig. 7a,b and S14, S15). It is worth noting that the observed lysosomal reformation may suggest that 6HB and K10 DNA nanostructures are integrated into the lysosomal nucleic acid catabolism pathway. This is further supported by the cytosolic release of DN degradation products (Fig. 5c), indicating that these structures are likely processed and broken down within the lysosome before being released into the cytosol. Conversely, EE treatment resulted in sustained lysosome enlargement after 48 h of treatment (Fig. 7a,b and S14, S15). Interestingly, neither type of DN changed lysosomal circularity (Fig. 7b). Analysis of lysosomal size supports lysosomal pH assessment, indicating that the peptide decoration of the DNs, and not DNA vehicle itself, affects lysosomal functionality.
Fig. 7.

Effects of functionalized DNA nanostructures on lysosomal size. (a) Representative super-resolution images of lysosomes in living Alexander, HepG2 and Huh7 cells. Cells (Alexander, HepG2 or Huh7) were treated with different types of DNs (at 50 nM concentration) for either 24 or 48 h. To visualize lysosomes, cells transduced with CellLight® LAMP1-RFP. The original overview images are shown in Supplementary Figure S14. (b) Quantification of lysosomal size and circularity. Cells (Alexander, HepG2 or Huh7) were treated with different types of DNs (at 50 nM concentration) for either 24 or 48 h. To visualize lysosomes, cells were transduced with CellLight® LAMP1-RFP. Nuclei were counterstained with Hoechst 33342. Labeled cells were then imaged by confocal microscopy. Representative images are shown in Supplementary Figure S15. Lysosomal size and circularity were measured using the ImageJ software (NIH), n = 50 cells. (**) P < 0.01 and (***) P < 0.001 denote statistically significant differences.
3.5. Low concentrations of DNA nanostructures modulate immune signaling in hepatic cells
Accumulating evidence suggests that alteration of lysosomal function can be a contributing factor to inflammation. For instance, the release of undegraded substrates, such as DNA or lysosome hydrolases, from compromised lysosomes has been demonstrated to trigger inflammatory responses [11, 131, 132]. Indeed, enlarged lysosomes have been shown to induce cell stress and/or inflammation [133]. Additionally, free DNA is a well-known trigger for the type-I interferon inflammatory response [134-136]. Thus, we hypothesized that it should be plausible to utilize DNs for immune signaling modulation.
We analyzed whether treatment with DNs leads to upregulated expression of main interferon-stimulated genes (ISGs) using qPCR. We found that only EE treatment at 50 nM for 48 h resulted in significant upregulation of IFI6 gene (Fig. 8a). However, other ISGs (e.g. RSAD2, ISG15, IFITM1, IFI27 and MX1) were not affected by EE treatment (Tables S5, S6, S7). Cell treatment with either 6HB DNs or K10 DNs did not affect ISG expression (Fig. 8a and Tables S5, S6, S7). Next, we assessed the JAK-STAT signaling pathway (a well-known regulator of the interferon-mediated inflammatory response [137]). Immunoblot analysis revealed that all three types of DNs induced upregulation of the STAT1 protein (Fig. 8b). However, we did not observe any consistent pattern in triggering of the phosphorylated, active form of STAT1, pSTAT1 by DNs (Fig. 8b,c). In Huh7 cells, only EE DNs induced STAT1 activation (Fig. 8b,c). Stimulation of HepG2 cells with both K10 and EE DNs resulted in STAT1 activation (Fig. 8b,c). By contrast, in Alexander cells pSTAT1 expression was insensitive to DN stimulation (Fig. 8b,c). These data imply that while DNs induce endogenous STAT1 upregulation, it is not clear why EE DNs treatment stimulated IFI6 gene expression (Fig. 8a).
Fig. 8.

Immunostimulatory effects of functionalized DNA nanostructures. (a) Relative expression of IFI6 determined in Alexander, HepG2 and Huh7 cells 48 h after treatment with different DNs at 10 and 50 nM concentrations. GAPDH was used as internal control. Results are presented as mean ± SEM (n = 3). Differences were considered significant at (**) P < 0.01 and (***) P < 0.001. Transfection with IFNL4 was used as positive control. (b) The activation of JAK-STAT signaling was determined by immunoblot analysis of Alexander, HepG2 and Huh7 cells 48 h after treatment with different DNs at 50 nM concentration; β-actin served as the loading control. (c) The graphs show the densitometric quantification of p-STAT1/STAT1 ratio of immunoblots. Results are presented as mean ± SEM (n = 3). Differences were considered significant at (*) P < 0.05, (**) P < 0.01 and (***) P < 0.001.
Stimulator of interferon response cGAMP interactor (STING) is a crucial regulator of the interferon-mediated inflammatory response to free DNA [138, 139]. In fact, EE treatment resulted in minor but significant STING upregulation (Fig. 9a,b). Of note, EE enhanced the release of products of DN degradation from lysosomes (Fig. 5d). Further, as previously noted, EE treatment induced both an increase in lysosomal pH (Fig. 6a) and lysosomal size (Fig. 7). All these results taken together imply that the aurein coating of DNs stimulates antiviral signaling modulation in hepatic cells (Fig. 9c). In order to verify the specificity of aurein action, we functionalized DNs with the “scrambled” aurein 1.2 sequence, which we previously showed abrogates the endosome escape ability of the nanoparticles [43]. Indeed, DNs coated with this scrambled peptide showed no effect on STING activation (Fig. S16).
Fig. 9.

Functionalized DNA nanostructures upregulate STING expression in hepatic cells. (a) The expression of STING was determined by immunoblot analysis of Alexander, HepG2 and Huh7 cells 48 h after treatment with different DNs at 50 nM concentration; β-actin served as the loading control. (b) The graphs show the densitometric quantification of STING immunoblots. Results are presented as mean ± SEM (n = 3). Differences were considered significant at (*) P < 0.05. (c) Schematics of the immunostimulatory effects of functionalized DNA nanostructures. Created with BioRender.com.
Next, we verified whether aurein-coated DN treatment leads to active release of IFN-β, the main interferon released upon viral stimulus [140]. ELISA analysis revealed that all three types of DNs were incapable of inducing the release of IFN-β (Fig. S17). Although the precise physiological relevance is not known, it has been shown that some ISGs can be elevated by viral stimulus without concomitant interferon release [141, 142].
Summarizing all these data we can conclude that the EE nanostructures modulate the inflammatory response by upregulating the STING protein level and expression of the IFI6 gene without the active release of IFN-β (Fig. 9c).
3.6. High concentrations of DNA nanostructures effectively kill tumor cells
It is worth noting here that modulation of lysosomal activity by material accumulation is a progressive and dynamic process that may eventually lead to lysosomal membrane permeabilization (LMP) and cell death [13, 25, 83, 84, 112, 128]. Emerging evidence suggests that distinct nanoparticles can activate LMP and subsequent cell death in a progressive manner [57, 143, 144], so it possible that DNs show progressive alteration of lysosomal function. We next explored treatment with a high concentration of DNs (500 nM), which induced dramatic changes in both the metabolic activity (Fig. 3) and viability (Fig. 4) of cells. We performed imaging of PI-stained cells treated with all three types of DNs at a concentration of 500 nM for 48 h. EE DNs treatment at this concentration showed a marked toxicity in all three cell lines (Fig. 10a, S18, S19, S20). Furthermore, cell death triggered by EE DNs was confirmed by membrane blebbing and vesicular shedding (Fig. 10b). Neither 6HB nor K10 DNs affected cell viability at a 500 nM concentration (Fig. 10a, S18, S19, S20). Interestingly, K10 at 500 nM affected HepG2 clustering, resulting in marked cell-cell dissociation (Fig. 10a). In fact, different growth factors (e.g. hepatocyte growth factor, TGF-β) have been shown to disrupt cell-cell adhesion of epithelial cells, such as HepG2, a phenomenon known as “cell scattering” [145-147]. High-resolution confocal imaging revealed loss of cell-cell contacts and morphological changes not only in HepG2 cells upon K10 treatment, but in Alexander and Huh7 cells as well (Fig. 10b and S21). Importantly, it has been found that lysosomal activity mediates loss of cell-cell contacts and cell scattering [148].
Fig. 10.

Functionalized DNA nanostructures induce cell death in liver cancer cells. (a) Cells (Alexander, HepG2 or Huh7) were treated with different types of DNs (at 500 nM concentration) for 48 h. After treatment, cells were stained with propidium iodide (PI) and nuclei were counterstained with Hoechst 33342. Labeled cells were then imaged by confocal microscopy. The blue dashed rectangle highlights cell scattering, and the red dashed rectangle indicates cellular toxicity. The original overview images are shown in Supplementary Figures S18, S19 and S20. (b) Cells (Alexander, HepG2 or Huh7) were treated with different types of DNs (at 500 nM concentration) for 48 h. After the treatment, cells were stained with CellMask™ Orange (red) and the nuclei were counterstained with Hoechst 33342 (blue). Labeled cells were then imaged by confocal microscopy. The white dashed rectangle shows zoomed region, the blue dashed rectangle highlights cells losing cell-cell contacts, and the red dashed rectangle indicates cells with compromised membrane integrity. The original overview images are shown in Supplementary Figure S21.
We hypothesize that aurein-coated DNs at high concentration may lead to lysosomal membrane destabilization and eventually to lysosomal rupture, which in turn activates cells death (Fig. 11a). In fact, a lysosomal leakage assay revealed that treatment with EE DNs leads to massive lysosomal damage nearly equal to acute toxic doses of ethanol (Fig. 11b). To verify the specificity of aurein-mediated induction of lysosomal destabilization, we utilized DNs coated with the scrambled aurein, which did not induce any lysosomal destabilization (Fig. S23). Furthermore, to confirm lysosomal damage we performed LysoTracker Red staining. Confocal imaging revealed that treatment with EE DNs at a 500 nM concentration led to lysosomal swelling and loss of LysoTracker Red fluorescent intensity, indicating lysosomal rupture (Fig. 11c and S22). Conversely, treatment with 6HB or K10 DNs resulted in lysosomal size increase (Fig. 11c and S22) but without noticeable lysosomal damage (Fig. 11b).
Fig. 11.

Functionalized DNA nanostructures affect the integrity of the lysosomal membrane in liver cancer cells. (a) Schematic of the lysosomal damage induced by aurein-coated DNA nanostructures. Created with BioRender.com. (b) Lysosomal integrity as measured by acridine orange (AO) red fluorescence decrease. Cells (Alexander, HepG2 or Huh7) were treated with different types of DNs (at 500 nM concentration) for 48 h, stained with 5 μg/ml acridine orange (AO). After staining, the fluorescence intensity was measured using a fluorescent microplate reader. As a positive control, cells were treated with 20% ethanol for 60 min. Data are expressed as means ± SEM (n = 3). (***) P < 0.001 denotes statistically significant differences. (c) Lysosomal integrity as measured by assessment of morphodynamical changes in LysoTracker Red. Cells (Alexander, HepG2 or Huh7) were treated with different types of DNs (at 500 nM concentration) for 48 h, stained with LysoTracker Red and nuclei were counterstained with Hoechst 33342 (blue). Labeled cells were then imaged by confocal microscopy. As a positive control, cells were treated with 20% ethanol for 60 min.
To further assess the impact of the peptides on the metabolic activity and viability of liver cancer cells, we conducted a series of analyses using pure peptides in the absence of DNs. Given that EE DNs incorporate approximately 42 copies of the aurein 1.2 peptide [42, 100], we used a 15 μM concentration of pure peptides to match the amount of peptide on the 500 nM concentration of EE DNs. As expected, a 500 nM concentration of either the K10 or EE peptide did not significantly affect the metabolic activity (Fig. 12a) or viability (Fig. S24) of liver cancer cell lines, even after 72 hours of treatment. The K10 peptide showed no impact on either metabolic activity or cell viability at concentrations up to 15 μM. In contrast, the EE peptide at 15 μM (equivalent to 500 nM of EE DNs) significantly inhibited metabolic activity (Fig. 12a) and induced notable cytotoxicity as early as 24 hours post-incubation (Fig. S24). However, the inhibition kinetics of the pure EE peptide differed from those of the EE DNs, with the former showing a slight recovery in metabolic activity after 72 hours of treatment (Fig. 12a), which was not observed with EE DN treatment. The cytotoxicity induced by the pure EE peptide was associated with lysosomal rupture (Fig. S25); nonetheless, EE DNs demonstrated greater potency in inducing cell death compared to the pure EE peptide (Fig. 12b). Furthermore, EE DNs were more effective in triggering lysosomal rupture than the pure EE peptide (Fig. 12c). These findings clearly indicate that, although the pure EE peptide elicits similar cellular effects as EE DNs, the DNs are more potent in inducing lysosomal rupture (Fig. 12c) and subsequently triggering cytotoxicity (Fig. 12b). This enhanced efficacy of EE DNs likely results from their ability to overcome the limited cytosolic bioavailability associated with pure peptides [44-46].
Fig. 12.

Effects of peptides on functionality of liver cancer cells. (a) The total metabolic activity of Alexander, HepG2 and Huh7 cells was checked with an alamarBlue assay. Cells were treated with either K10 or EE peptides (500 nM and 15 μM) for 24, 48 and 72 h. The data were normalized to control values (no peptide exposure), which were set as 100% of the total metabolic activity of cells. Control cells were untreated. As a positive control, cells were treated with 20% ethanol for 30 min. Data are expressed as means ± SEM (n = 3). (***) P < 0.001 denote statistically significant differences. (b) Comparison of cytotoxic effect elicited by EE DNs and EE peptide. The viability of Alexander, HepG2 and Huh7 cells was checked using propidium iodide. Cells were treated with either EE DNs (500 nM) or EE peptide (500 nM and 15 μM) for 48 h. After the treatment, cells were stained with propidium iodide (PI) and nuclei were counterstained with Hoechst 33342. Labeled cells were then imaged by confocal microscopy, and the numbers of dead (Pi-positive) cells and total number (Hoechst-stained) of cells were counted using the ImageJ software (NIH). The viability was expressed as the ratio of Pi-negative cells to total cells. As a positive control, cells were treated with 20% ethanol for 60 min. Data are expressed as means ± SEM (n = 3). (***) P < 0.001 denotes statistically significant differences. (c) Lysosomal integrity as measured by acridine orange (AO) red fluorescence decrease. Cells (Alexander, HepG2 or Huh7) were treated with either EE DNs (500 nM) or EE peptide (500 nM and 15 μM) for 48 h, stained with 5 μg/ml acridine orange (AO). After staining, the fluorescence intensity was measured using a fluorescent microplate reader. As a positive control, cells were treated with 20% ethanol for 60 min. Data are expressed as means ± SEM (n = 3). Differences were considered significant at (*) P < 0.05, (**) P < 0.01 and (***) P < 0.001.
It is well-known that lysosomal permeabilization results in the release of lysosomal enzymes into the cytosol, leading to mitochondrial damage and cell death, accompanied by mitochondrial ROS production [128, 144, 149]. Further, the leakage of lysosomal enzymes directly stimulates mitochondrial ROS production and stimulation [150]. Indeed, only treatment with EE DNs at 500 nM concentration resulted in dramatic mitochondrial ROS production (Fig. 13).
Fig. 13.

Functionalized DNA nanostructures affect mitochondria in liver cancer cells. Cells, Alexander (a), HepG2 (b) or Huh7 (c), were treated with different types of DNs (at 50 and 500 nM concentrations) for 48 h, stained with 5 μM MitoSOX for 10 min and analyzed by flow cytometry. Positive control 1 mM H2O2 for 60 min was used. The red dashed rectangle indicates cells with elevated mitochondrial ROS.
Of note, lysosome hypertrophy is observed in cancer cells, making those lysosomes more fragile and susceptible to LMP [151, 152]. Consequently, directing interventions towards lysosomes to induce lysosomal leakage represents a promising cancer therapy, especially for enhancing therapeutic effectiveness and circumventing typical resistance mechanisms [12, 13, 153]. Indeed, different types of nanomaterials have been employed to induce tumor cell death by rupturing their lysosomes [19, 154-156]. To determine whether DNs exhibit specificity towards cancerous cells, we evaluated their cytotoxic effects on the non-cancerous HEK293T cell line. As anticipated, treatment with K10 DNs at concentrations up to 500 nM did not result in any significant inhibition of metabolic activity (Fig. S26a), cytotoxicity (Fig. S26b), or lysosomal rupture (Fig. S26c). By contrast, treating HEK293T cells with 500 nM of EE DNs led to a notable inhibition of metabolic activity (Fig. S26a), induction of cytotoxicity (Fig. S26b), and lysosomal destabilization (Fig. S26c). However, it is important to highlight that EE DNs at the same concentration (500 nM) exhibited significantly higher cytotoxicity in the cancerous Huh7 cell line compared to the non-cancerous HEK293T cells (Fig. S26d). This increased cytotoxicity in Huh7 cells was accompanied by more severe lysosomal damage than in HEK293T cells (Fig. S26e). Despite this, the cytotoxicity observed in non-cancerous HEK293T cells was still notably high (Fig. S26b). At this stage of our study, it is important to note that we did not intentionally target DNs towards cancer cells through additional surface modifications with cancer-specific ligands. Our current focus is on presenting a DN-based platform capable of modulating various cellular functions, rather than on optimizing cancer cell specificity.
Next, we proceeded with exploring DNs as potential platform to induce cell death of different tumor cells. Our data indicate that at least in Huh7, Alexander, and HepG2 cells, the aurein-coated DNs at 500 nM induce cell death (Fig. 10) via marked lysosomal leakage (Fig. 11). To further expand the scope of our platform, we utilized a three-dimensional (3D) culture of multicellular aggregates. Recent research suggests that conventional 2D culturing comes with certain limitations, hindering the translation of in vitro findings to in vivo models [157, 158]. In contrast, 3D models offer conditions better mimicking in vivo systems and providing more realistic outcomes [157, 158]. Furthermore, to validate the anti-tumor potential of aurein-coated DNs, we employed an additional cell line, namely glioblastoma. Glioblastomas are known to be a highly aggressive form of cancer with significant resistance to radiation and chemotherapy [159]. First, we checked whether DNs penetrate into 3D multicellular aggregates. Confocal imaging revealed that all three types of DNs successfully penetrated into 3D aggregates, including glioblastoma (Fig. S27). Next, we performed imaging of PI staining of 3D multicellular aggregates treated with all three types of DNs at a 500 nM concentration for 48 h. EE treatment at 500 nM showed marked toxicity in all cell lines including glioblastoma (Fig. 14). We can summarize that high concentrations of EE induce lysosomal rupture, leading to mitochondrial damage, a feature that can be used to induce cell death. K10 treatment at high concentration does not lead to cell death, but it biases lysosomal activity, leading to loss of cell-cell contacts and morphological alterations of cells.
Fig. 14.
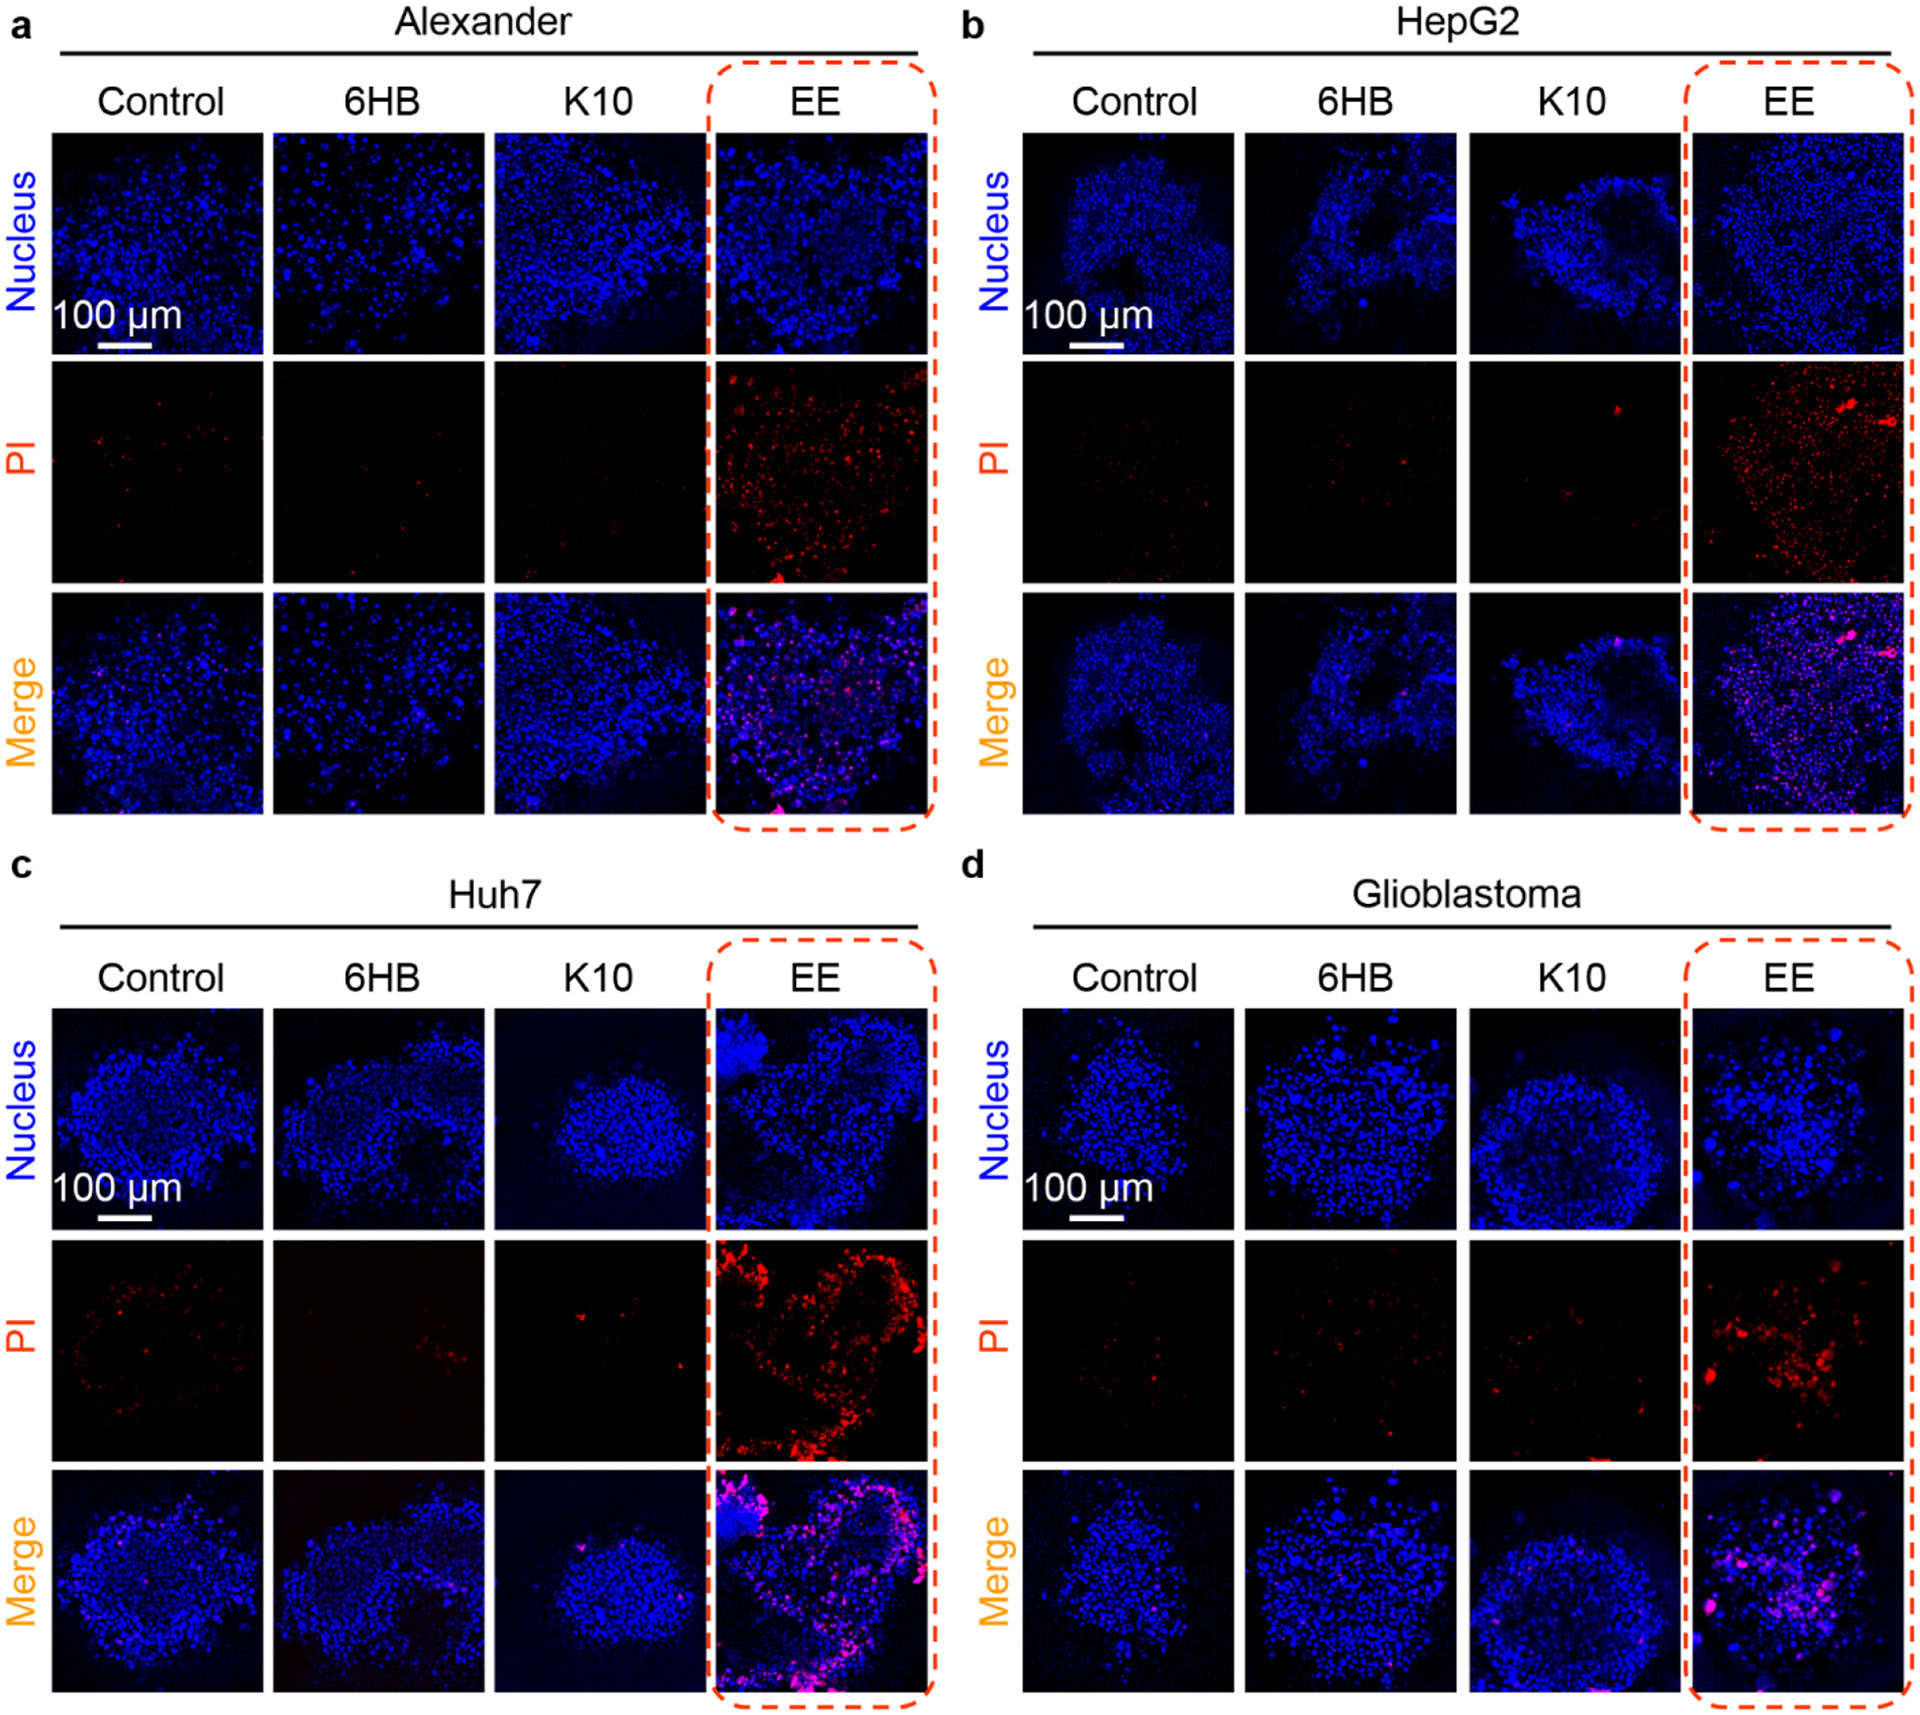
Aurein-coated DNA nanostructures induce profound cell death in different cancer multicellular aggregates. Multicellular aggregates of Alexander (a), HepG2 (b), Huh7 (c) and glioblastoma (d) cell lines were treated with different types of DNs (at 500 nM concentration) for 48 h. After the treatment multicellular aggregates were stained with propidium iodide (PI) and nuclei were counterstained with Hoechst 33342. Labeled cells were then imaged by confocal microscopy. Representative images out of four independent replicates.
4. Conclusions
In summary, in this study we describe a versatile DNA nanostructure-based platform that can modulate a number of cellular functions depending on: (1) the nanoparticle concentration, and (2) the surface decoration with specific peptide sequences (Fig. 15). Utilizing the 6HB nanostructure as an initial DN platform, we decorated it with either K10 or aurein 1.2 peptides. Taking advantage of lysosomal function modulation via lysosome interference [31], differently-coated DNs induced distinct cellular responses affecting lysosomal activity (Fig. 15). K10 DNs at low concentration induced acidification of lysosomes (Fig. 6a), which translated into modulation of metabolic activity of susceptible cells, such as Huh7 (Fig. 3). By contrast, treatment with EE DNs resulted in alkalization of the lysosomal lumen (Fig. 6a), leading to STING activation (Fig. 9a,b) and modulation of antiviral signaling (Fig. 9c). Treatment with a high concentration of K10 DNs led to lysosomal swelling, loss of cell-cell contacts, and changes in cellular morphology but without concomitant cell death. EE DNs treatment at a high concentration led to lysosomal rupture and mitochondrial damage, resulting in marked cytotoxicity, an effect that was profound even in 3D multicellular aggregates and highly resistant glioblastoma cancer cells. While we recognize the limitations of in vitro analysis, its advantages in controlled environments, cost efficiency, and ethical considerations make it an ideal approach for studying emerging phenomena like lysosomal interference.
Fig. 15.
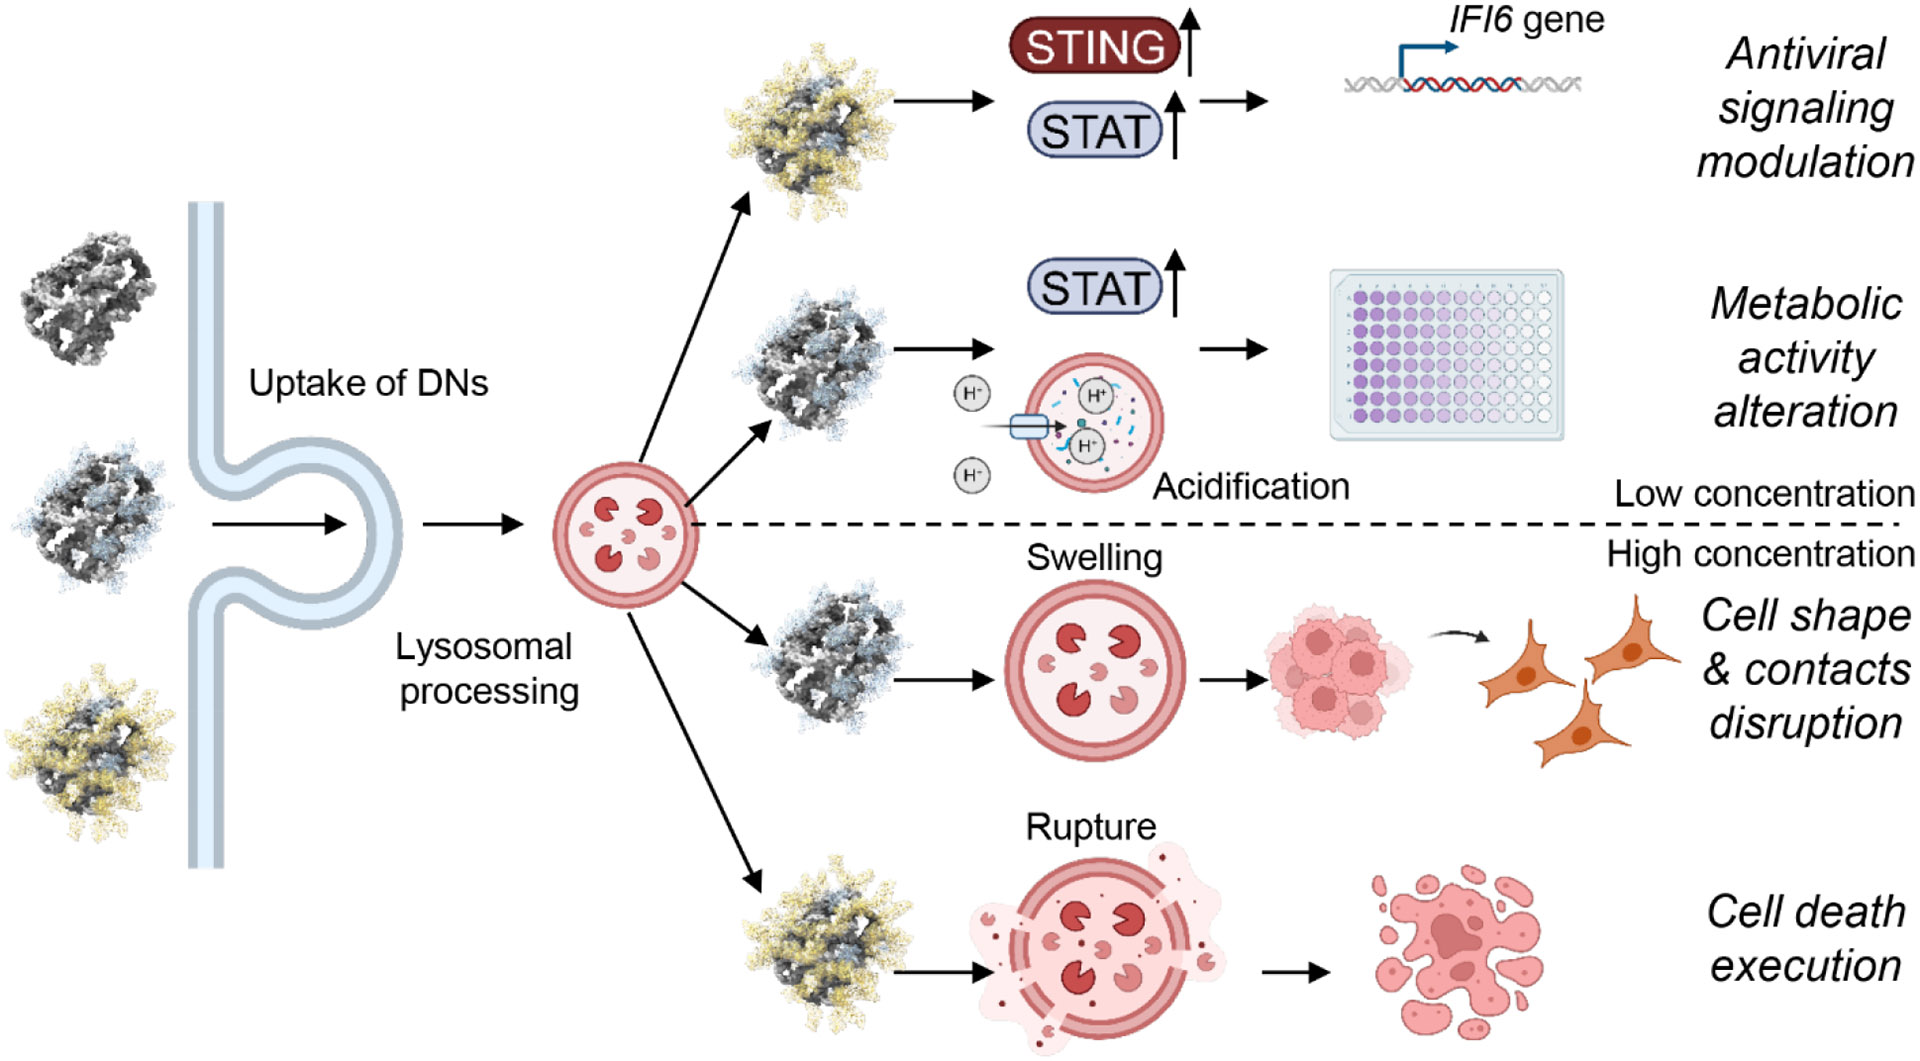
Scheme of the controlled modulation of lysosomal functions by functionalized DNA nanostructures. Created with BioRender.com.
Our work offers insight for a DN-based platform to rationally modulate lysosomal functions utilizing surface decoration with distinct peptides. This study provides an understanding of the mechanism underlying the impact of peptide-coated DNs on lysosomal functionality via lysosomal pH modulation and how these effects translate on subcellular functions and cellular behaviors. Our study holds promise for the rational design of a new generation of DNA-based nanomaterials. The DNs in general provide numerous benefits over conventional nanoparticles, including lower cytotoxicity, well-defined 3D architectures of arbitrary shape and size at the nanoscale, easy functionalization using various peptides or other biomolecules, and superior adaptability [37]. The methodology that we propose here can in principle be generalized to target diverse pathophysiological conditions that are associated with changes in lysosomal activity and functions, such as lysosomal storage disorders, cancer, autoimmune disorders, neurodegenerative diseases, and cardiovascular diseases. The approach we propose, of using DNs as a delivery vehicle for peptides into lysosomes, represents a foundation for future anti-cancer therapeutic strategies. Peptide-functionalized DNs may offer a combination therapy for viral cancers by lysosomal disruption and activation of STING.
Supplementary Material
Table 1.
List of abbreviations.
| Abbreviations | |
|---|---|
| DNs | DNA nanostructures |
| 6HB | 6-helix bundle |
| K10 pep. | Decalysine peptide |
| EE pep. | K10-[aurein 1.2]2 peptide |
| K10 DNs | 6-helix bundle coated with decalysine peptide |
| EE DNs | 6-helix bundle coated with K10-[aurein 1.2]2 peptide |
| AFM | Atomic force microscopy |
| PI | Propidium iodide |
| FRET | Förster resonance energy transfer |
| AO | Acridine orange |
DNA nanostructures represent a rational and systematic way to control cell functionality.
A versatile DNA nanostructure platform modulates variety of cellular functions.
Surface functionalization of DNA nanostructures rationally controls lysosomal activity.
DNA nanostructure-based platform enables control of cellular functionality.
Acknowledgments
This research was funded by the Czech Ministry of Education, Youth and Sports (Project No. LUAUS24038). Research reported in this publication was supported by The National Institute of General Medical Sciences of the National Institutes of Health under grant number DP2GM132931. The content is solely the responsibility of the authors and does not necessarily represent the official views of the National Institutes of Health. J.H. and Y.P. would like to acknowledge the Czech Science Foundation grant No. 22-12483S. The authors acknowledge the MH CZ - DRO Institute for Clinical and Experimental Medicine – IKEM, IN 00023001. Graphical abstract, Figures 1, 9C, 11A and 15 were created using Biorender.com.
Abbreviations
- DNs
DNA nanostructures
- 6HB
6-helix bundle
- K10 pep.
Decalysine peptide
- EE pep.
K10-[aurein 1.2]2 peptide
- K10 DNs
6-helix bundle coated with decalysine peptide
- EE DNs
6-helix bundle coated with K10-[aurein 1.2]2 peptide
- AFM
Atomic force microscopy
- PI
Propidium iodide
- FRET
Förster resonance energy transfer
- AO
Acridine orange
Footnotes
Publisher's Disclaimer: This is a PDF file of an unedited manuscript that has been accepted for publication. As a service to our customers we are providing this early version of the manuscript. The manuscript will undergo copyediting, typesetting, and review of the resulting proof before it is published in its final form. Please note that during the production process errors may be discovered which could affect the content, and all legal disclaimers that apply to the journal pertain.
Supporting information
The following files are available free of charge.
List of chemical probes used in the study (Table S1). List of fluorescent probes used in the study (Table S2). List of antibodies used in the study (Table S3). List of TaqMan probes used for qPCR (Table S4). Quantitative PCR results for selected inflammation related genes expression in Alexander cells (Table S5). Quantitative PCR results for selected inflammation related genes expression in HepG2 cells (Table S6). Quantitative PCR results for selected inflammation related genes expression in Huh7 cells (Table S7). List of DNA staples used in the study (Table S8). Sequences of peptides used in the study (Table S9). Summary of physicochemical characterization of DNA nanostructures (Figure S1). Hydrodynamic diameters of nanoparticles (6HB, K10 and EE) as measured by laser light scattering (Figure S2). Hydrodynamic diameters of freshly prepared 6HB and those stored for 1 month were measured by laser light scattering (Figure S3). Hydrodynamic diameters of freshly prepared K10 and those stored for 1 month were measured by laser light scattering (Figure S4). Hydrodynamic diameters of freshly prepared EE and those stored for 1 month were measured by laser light scattering. (Figures S5). FRET microscopy images of Alexander cells treated with 6HB labeled with FRET reporter dyes (6-carboxyfluorescein donor and TAMRA acceptor) (Figure S6). FRET microscopy images of HepG2 cells treated with 6HB labeled with FRET reporter dyes (6-carboxyfluorescein donor and TAMRA acceptor) (Figure S7). FRET microscopy images of Huh7 cells treated with 6HB labeled with FRET reporter dyes (6-carboxyfluorescein donor and TAMRA acceptor) (Figure S8). Control FRET assessment of Alexander, HepG2 and Huh7 cells treated with 6HB labeled with FRET reporter dyes (Figure S9). Representative images of colocalization of DNs with lysosomes in Alexander cells (Figure S10). Representative images of colocalization of DNs with lysosomes in HepG2 cells (Figure S11). Representative images of colocalization of DNs with lysosomes in Huh7 cells (Figure S12). Assessment of lysosomal pH changes using LysoSensor™ Blue DND-167. Cells (Alexander, HepG2 or Huh7) were treated with different types of DNs (at 50 nM concentration) for either 24 or 48 h (Figure S13). Representative super-resolution images of lysosomes in living Alexander, HepG2 and Huh7 cells (Figure S14). Lysosomal size assessment by confocal microscopy (Figure S15). The expression of STING was determined by immunoblot analysis of Alexander, HepG2 and Huh7 cells 48 h after treatment with DNs coated with scrambled aurien peptide (Figure S16). IFN-β secretion detection by ELISA (Figure S17). Representative images of Alexander cells propidium iodide assay (Figure S18). Representative images of HepG2 cells propidium iodide assay (Figure S19). Representative images of Huh7 cells propidium iodide assay (Figure S20). Representative images of cell shape changes upon DN-treatment (Figure S21). Lysosomal integrity as measured by assessment of morphodynamical changes in LysoTracker Red (Figure S22). Lysosomal integrity as measured by acridine orange (AO) red fluorescence decrease (Figure S23). Effects of peptides on viability of liver cancer cells (Figure S24). Effects of peptides on lysosomal integrity of liver cancer cells (Figure S25). Effects of DNs on functionality of non-cancerous HEK293T cells (Figure S26). Penetration of DNs into multicellular aggregates of different cancer cell lines (Figure S27).
CRediT authorship contribution statement
Oleg Lunov and Nicholas Stephanopoulos conceived the idea and designed the study. Oleg Lunov performed conceptualization, methodology, data curation, funding acquisition, supervision, and writing-original draft. Petra Elblová carried out most of the experiments and analyzed the data. Petra Elblová and Alicia Calé performed analysis in non-cancerous cells lines and assesses cellular effects of pure peptides. Mariia Lunova and Milan Jirsa contributed to methodology, data analysis, provided scientific suggestions. Xinyi Tu and Skylar J.W. Henry conducted the synthesis of nanomaterials and corresponding characterizations. Xinyi Tu performed AFM analysis. Jarmila Havelková and Yuriy Petrenko worked on production and characterization of 3D multicellular aggregates. Mariia Lunova, Milan Jirsa, Yuriy Petrenko, Nicholas Stephanopoulos and Alexandr Dejneka discussed and revised the manuscript. The manuscript was written through contributions of all authors. All authors have given approval to the final version of the manuscript.
Declaration of competing interest
The authors declare that they have no known competing financial interests or personal relationships that could have appeared to influence the work reported in this paper.
Appendix A. Supporting information
Supplementary data associated with this article can be found in the online version at
Data availability
Data will be made available on request.
References
- [1].Youden B, Jiang RQ, Carrier AJ, Servos MR, Zhang X, A nanomedicine structure-activity framework for research, development, and regulation of future cancer therapies, ACS Nano 16 (11) (2022) 17497–17551, 10.1021/acsnano.2c06337. [DOI] [PubMed] [Google Scholar]
- [2].Bhatia SN, Chen XY, Dobrovolskaia MA, Lammers T, Cancer nanomedicine, Nat. Rev. Cancer 22 (10) (2022) 550–556, 10.1038/s41568-022-00496-9. [DOI] [PMC free article] [PubMed] [Google Scholar]
- [3].Mitchell MJ, Billingsley MM, Haley RM, Wechsler ME, Peppas NA, Langer R, Engineering precision nanoparticles for drug delivery, Nat. Rev. Drug Discov 20 (2) (2021) 101–124, 10.1038/s41573-020-0090-8. [DOI] [PMC free article] [PubMed] [Google Scholar]
- [4].Sigismund S, Lanzetti L, Scita G, Di Fiore PP, Endocytosis in the context-dependent regulation of individual and collective cell properties, Nat. Rev. Mol. Cell Biol 22 (9) (2021) 625–643, 10.1038/s41580-021-00375-5. [DOI] [PubMed] [Google Scholar]
- [5].Saftig P, Klumperman J, Lysosome biogenesis and lysosomal membrane proteins: trafficking meets function, Nat. Rev. Mol. Cell Biol 10 (9) (2009) 623–635, 10.1038/nrm2745. [DOI] [PubMed] [Google Scholar]
- [6].Ding CD, Chen CB, Zeng XW, Chen HZ, Zhao YL, Emerging strategies in stimuli-responsive prodrug nanosystems for cancer therapy, ACS Nano 16 (9) (2022) 13513–13553, 10.1021/acsnano.2c05379. [DOI] [PubMed] [Google Scholar]
- [7].Xue XL, Qian CG, Fang HB, Liu HK, Yuan H, Guo ZJ, Bai Y, He WJ, Photoactivated lysosomal escape of a monofunctional Pt(II) complex Pt-BDPA for nucleus access, Angew. Chem.-Int. Edit 58 (36) (2019) 12661–12666, 10.1002/anie.201906203. [DOI] [PubMed] [Google Scholar]
- [8].Huo D, Xia YA, Quantifying the sub-cellular distributions of gold nanospheres taken up by cells through stepwise, site-selective etching, Chem.-Eur. J 24 (34) (2018) 8513–8518, 10.1002/chem.201800525. [DOI] [PubMed] [Google Scholar]
- [9].Wang RN, Yin CF, Liu CR, Sun Y, Xiao PP, Li J, Yang S, Wu W, Jiang XQ, Phenylboronic acid modification augments the lysosome escape and antitumor efficacy of a cylindrical polymer brush-based prodrug, J. Am. Chem. Soc 143 (49) (2021) 20927–20938, 10.1021/jacs.1c09741. [DOI] [PubMed] [Google Scholar]
- [10].Rennick JJ, Johnston APR, Parton RG, Key principles and methods for studying the endocytosis of biological and nanoparticle therapeutics, Nat. Nanotechnol 16 (3) (2021) 266–276, 10.1038/s41565-021-00858-8. [DOI] [PubMed] [Google Scholar]
- [11].Cao MD, Luo XY, Wu KM, He XX, Targeting lysosomes in human disease: from basic research to clinical applications, Signal Transduct. Target. Ther 6 (1) (2021) 379, 10.1038/s41392-021-00778-y. [DOI] [PMC free article] [PubMed] [Google Scholar]
- [12].Platt FM, Emptying the stores: lysosomal diseases and therapeutic strategies, Nat. Rev. Drug Discov 17 (2) (2018) 133–150, 10.1038/nrd.2017.214. [DOI] [PubMed] [Google Scholar]
- [13].Bonam SR, Wang FJ, Muller S, Lysosomes as a therapeutic target, Nat. Rev. Drug Discov 18 (12) (2019) 923–948, 10.1038/s41573-019-0036-1. [DOI] [PMC free article] [PubMed] [Google Scholar]
- [14].Pei JP, Wang G, Feng L, Zhang JF, Jiang TT, Sun Q, Ouyang L, Targeting lysosomal degradation pathways: New strategies and techniques for drug discovery, J. Med. Chem 64 (7) (2021) 3493–3507, 10.1021/acs.jmedchem.0c01689. [DOI] [PubMed] [Google Scholar]
- [15].Nowosad A, Jeannot P, Callot C, Creff J, Perchey RT, Joffre C, Codogno P, Manenti S, Besson A, p27 controls Ragulator and mTOR activity in amino acid-deprived cells to regulate the autophagy-lysosomal pathway and coordinate cell cycle and cell growth, Nat. Cell Biol 22 (9) (2020) 1076–1090, 10.1038/s41556-020-0554-4. [DOI] [PubMed] [Google Scholar]
- [16].Mauthe M, Orhon I, Rocchi C, Zhou XD, Luhr M, Hijlkema KJ, Coppes RP, Engedal N, Mari M, Reggiori F, Chloroquine inhibits autophagic flux by decreasing autophagosome-lysosome fusion, Autophagy 14 (8) (2018) 1435–1455, 10.1080/15548627.2018.1474314. [DOI] [PMC free article] [PubMed] [Google Scholar]
- [17].Mauvezin C, Neufeld TP, Bafilomycin A1 disrupts autophagic flux by inhibiting both V-ATPase-dependent acidification and Ca-P60A/SERCA-dependent autophagosome-lysosome fusion, Autophagy 11 (8) (2015) 1437–1438, 10.1080/15548627.2015.1066957. [DOI] [PMC free article] [PubMed] [Google Scholar]
- [18].Mauvezin C, Nagy P, Juhász G, Neufeld TP, Autophagosome-lysosome fusion is independent of V-ATPase-mediated acidification, Nat. Commun 6 (2015) 7007, 10.1038/ncomms8007. [DOI] [PMC free article] [PubMed] [Google Scholar]
- [19].Borkowska M, Siek M, Kolygina DV, Sobolev YI, Lach S, Kumar S, Cho YK, Kandere-Grzybowska K, Grzybowski BA, Targeted crystallization of mixed-charge nanoparticles in lysosomes induces selective death of cancer cells, Nat. Nanotechnol 15 (4) (2020) 331–341, 10.1038/s41565-020-0643-3. [DOI] [PubMed] [Google Scholar]
- [20].Tang MM, Chen BL, Xia HM, Pan MJ, Zhao RY, Zhou JY, Yin QQ, Wan FJ, Yan Y, Fu CX, Zhong LJ, Zhang Q, Wang YG, pH-gated nanoparticles selectively regulate lysosomal function of tumour-associated macrophages for cancer immunotherapy, Nat. Commun 14 (1) (2023) 5888, 10.1038/s41467-023-41592-0. [DOI] [PMC free article] [PubMed] [Google Scholar]
- [21].Zhao Y, Ye Z, Song D, Wich D, Gao S, Khirallah J, Xu Q, Nanomechanical action opens endo-lysosomal compartments, Nat. Commun 14 (1) (2023) 6645, 10.1038/s41467-023-42280-9. [DOI] [PMC free article] [PubMed] [Google Scholar]
- [22].Abasolo I, Seras-Franzoso J, Molto-Abad M, Diaz-Riascos V, Corchero JL, Pintos-Morell G, Schwartz S, Nanotechnology-based approaches for treating lysosomal storage disorders, a focus on Fabry disease, Wiley Interdiscip. Rev.-Nanomed. Nanobiotechnol 13 (3) (2021) e1684, 10.1002/wnan.1684. [DOI] [PubMed] [Google Scholar]
- [23].Solomon M, Muro S, Lysosomal enzyme replacement therapies: Historical development, clinical outcomes, and future perspectives, Adv. Drug Deliv. Rev 118 (2017) 109–134, 10.1016/j.addr.2017.05.004. [DOI] [PMC free article] [PubMed] [Google Scholar]
- [24].Placci M, Giannotti MI, Muro S, Polymer-based drug delivery systems under investigation for enzyme replacement and other therapies of lysosomal storage disorders, Adv. Drug Deliv. Rev 197 (2023) 114683, 10.1016/j.addr.2022.114683. [DOI] [PMC free article] [PubMed] [Google Scholar]
- [25].Uzhytchak M, Smolková B, Lunova M, Frtús A, Jirsa M, Dejneka A, Lunov O, Lysosomal nanotoxicity: Impact of nanomedicines on lysosomal function, Adv. Drug Deliv. Rev 197 (2023) 114828, 10.1016/j.addr.2023.114828. [DOI] [PubMed] [Google Scholar]
- [26].Zhan J, Zhong J, Ma SD, Ma W, Wang YL, Yu ZQ, Cai YB, Huang WH, Dual-responsive self-assembly in lysosomes enables cell cycle arrest for locking glioma cell growth, Chem. Commun 56 (51) (2020) 6957–6960, 10.1039/c9cc09983b. [DOI] [PubMed] [Google Scholar]
- [27].Keum C, Hong JY, Kim D, Lee SY, Kim H, Lysosome-instructed self-assembly of amino-acid-functionalized perylene diimide for multidrug-resistant cancer cells, ACS Appl. Mater. Interfaces 13 (13) (2021) 14866–14874, 10.1021/acsami.0c20050. [DOI] [PubMed] [Google Scholar]
- [28].Ren KW, Liu Y, Wu J, Zhang Y, Zhu J, Yang M, Ju HX, A DNA dual lock-and-key strategy for cell-subtype-specific siRNA delivery, Nat. Commun 7 (2016) 13580, 10.1038/ncomms13580. [DOI] [PMC free article] [PubMed] [Google Scholar]
- [29].Gong NQ, Zhang YX, Teng XC, Wang YC, Huo SD, Qing GC, Ni QK, Li XL, Wang JJ, Ye XX, Zhang TB, Chen SZ, Wang YJ, Yu J, Wang PC, Gan YL, Zhang JC, Mitchell MJ, Li JH, Liang XJ, Proton-driven transformable nanovaccine for cancer immunotherapy, Nat. Nanotechnol 15 (12) (2020) 1053–1064, 10.1038/s41565-020-00782-3. [DOI] [PMC free article] [PubMed] [Google Scholar]
- [30].Guo XC, Li F, Liu CX, Zhu Y, Xiao NN, Gu Z, Luo D, Jiang JH, Yang DY, Construction of organelle-like architecture by dynamic DNA assembly in living cells, Angew. Chem.-Int. Edit 59 (46) (2020) 20651–20658, 10.1002/anie.202009387. [DOI] [PubMed] [Google Scholar]
- [31].Dong YH, Li F, Lv ZY, Li S, Yuan MH, Song NC, Liu JQ, Yang DY, Lysosome interference enabled by proton-driven dynamic assembly of DNA nanoframeworks inside cells, Angew. Chem.-Int. Edit 61 (36) (2022) e202207770, 10.1002/anie.202207770. [DOI] [PubMed] [Google Scholar]
- [32].Yang S, Cheng Y, Liu MX, Tang JP, Li SQ, Huang Y, Kou XH, Yao C, Yang DY, Sequential assembly of DNA nanoparticles inside cells enables lysosome interference and cell behavior regulation, Nano Today 56 (2024) 102224, 10.1016/j.nantod.2024.102224. [DOI] [Google Scholar]
- [33].Seeman NC, Gang O, Three-dimensional molecular and nanoparticle crystallization by DNA nanotechnology, MRS Bull. 42 (12) (2017) 904–912, 10.1557/mrs.2017.280. [DOI] [Google Scholar]
- [34].Chandrasekaran AR, Nuclease resistance of DNA nanostructures, Nat. Rev. Chem 5 (4) (2021) 225–239, 10.1038/s41570-021-00251-y. [DOI] [PMC free article] [PubMed] [Google Scholar]
- [35].Stephanopoulos N, Hybrid nanostructures from the self-assembly of proteins and DNA, Chem 6 (2) (2020) 364–405, 10.1016/j.chempr.2020.01.012. [DOI] [Google Scholar]
- [36].Knappe GA, Wamhoff EC, Bathe M, Functionalizing DNA origami to investigate and interact with biological systems, Nat. Rev. Mater 8 (2) (2023) 123–138, 10.1038/s41578-022-00517-x. [DOI] [PMC free article] [PubMed] [Google Scholar]
- [37].Frtus A, Smolkova B, Uzhytchak M, Lunova M, Jirsa M, Henry SJW, Dejneka A, Stephanopoulos N, Lunov O, The interactions between DNA nanostructures and cells: A critical overview from a cell biology perspective, Acta Biomater. 146 (2022) 10–22, 10.1016/j.actbio.2022.04.046. [DOI] [PMC free article] [PubMed] [Google Scholar]
- [38].Leung K, Chakraborty K, Saminathan A, Krishnan Y, A DNA nanomachine chemically resolves lysosomes in live cells, Nat. Nanotechnol 14 (2) (2019) 176–183, 10.1038/s41565-018-0318-5. [DOI] [PMC free article] [PubMed] [Google Scholar]
- [39].Cui C, Chakraborty K, Tang XA, Schoenfelt KQ, Hoffman A, Blank A, McBeth B, Pulliam N, Reardon CA, Kulkarni SA, Vaisar T, Ballabio A, Krishnan Y, Becker L, A lysosome-targeted DNA nanodevice selectively targets macrophages to attenuate tumours, Nat. Nanotechnol 16 (12) (2021) 1394–1402, 10.1038/s41565-021-00988-z. [DOI] [PubMed] [Google Scholar]
- [40].Chakraborty K, Anees P, Surana S, Martin S, Aburas J, Moutel S, Perez F, Koushika SP, Kratsios P, Krishnan Y, Tissue-specific targeting of DNA nanodevices in a multicellular living organism, eLife 10 (2021) e67830, 10.7554/eLife.67830. [DOI] [PMC free article] [PubMed] [Google Scholar]
- [41].Ponnuswamy N, Bastings MMC, Nathwani B, Ryu JH, Chou LYT, Vinther M, Li WA, Anastassacos FM, Mooney DJ, Shih WM, Oligolysine-based coating protects DNA nanostructures from low-salt denaturation and nuclease degradation, Nat. Commun 8 (2017) 15654, 10.1038/ncomms15654. [DOI] [PMC free article] [PubMed] [Google Scholar]
- [42].Li M, Tao Y, Shu YL, LaRochelle JR, Steinauer A, Thompson D, Schepartz A, Chen ZY, Liu DR, Discovery and characterization of a peptide that enhances endosomal escape of delivered proteins in vitro and in vivo, J. Am. Chem. Soc 137 (44) (2015) 14084–14093, 10.1021/jacs.5b05694. [DOI] [PubMed] [Google Scholar]
- [43].Smolková B, MacCulloch T, Rockwood TF, Liu MH, Henry SJW, Frtús A, Uzhytchak M, Lunova M, Hof M, Jurkiewicz P, Dejneka A, Stephanopoulos N, Lunov O, Protein corona inhibits endosomal escape of functionalized DNA nanostructures in living cells, ACS Appl. Mater. Interfaces 13 (39) (2021) 46375–46390, 10.1021/acsami.1c14401. [DOI] [PMC free article] [PubMed] [Google Scholar]
- [44].Evans BC, Fletcher RB, Kilchrist KV, Dailing EA, Mukalel AJ, Colazo JM, Oliver M, Cheung-Flynn J, Brophy CM, Tierney JW, Isenberg JS, Hankenson KD, Ghimire K, Lander C, Gersbach CA, Duvall CL, An anionic, endosome-escaping polymer to potentiate intracellular delivery of cationic peptides, biomacromolecules, and nanoparticles, Nat. Commun 10 (2019) 5012, 10.1038/s41467-019-12906-y. [DOI] [PMC free article] [PubMed] [Google Scholar]
- [45].Chatterjee S, Kon E, Sharma P, Peer D, Endosomal escape: A bottleneck for LNP-mediated therapeutics, Proc. Natl. Acad. Sci. U. S. A 121 (11) (2024) e2307800120, 10.1073/pnas.2307800120. [DOI] [PMC free article] [PubMed] [Google Scholar]
- [46].Qiu C, Xia F, Zhang JZ, Shi QL, Meng YQ, Wang C, Pang HH, Gu LW, Xu CC, Guo QY, Wang JG, Advanced strategies for overcoming endosomal/lysosomal barrier in nanodrug delivery, Research 6 (2023) 0148, 10.34133/research.0148. [DOI] [PMC free article] [PubMed] [Google Scholar]
- [47].Eilenberger C, Kratz SRA, Rothbauer M, Ehmoser E-K, Ertl P, Küpcü S, Optimized alamarBlue assay protocol for drug dose-response determination of 3D tumor spheroids, MethodsX 5 (2018) 781–787, 10.1016/j.mex.2018.07.011. [DOI] [PMC free article] [PubMed] [Google Scholar]
- [48].Kroemer G, Galluzzi L, Vandenabeele P, Abrams J, Alnemri ES, Baehrecke EH, Blagosklonny MV, El-Deiry WS, Golstein P, Green DR, Hengartner M, Knight RA, Kumar S, Lipton SA, Malorni W, Nuñez G, Peter ME, Tschopp J, Yuan J, Piacentini M, Zhivotovsky B, Melino G, Classification of cell death: recommendations of the Nomenclature Committee on Cell Death 2009, Cell Death Differ. 16 (1) (2009) 3–11, 10.1038/cdd.2008.150. [DOI] [PMC free article] [PubMed] [Google Scholar]
- [49].Crowley LC, Scott AP, Marfell BJ, Boughaba JA, Chojnowski G, Waterhouse NJ, Measuring cell death by propidium iodide uptake and flow cytometry, Cold Spring Harb. Protoc 2016 (7) (2016) 647–651, 10.1101/pdb.prot087163. [DOI] [PubMed] [Google Scholar]
- [50].Hachet-Haas M, Converset N, Marchal O, Matthes H, Gioria S, Galzi JL, Lecat S, FRET and colocalization analyzer - A method to validate measurements of sensitized emission FRET acquired by confocal microscopy and available as an ImageJ plug-in, Microsc. Res. Tech 69 (12) (2006) 941–956, 10.1002/jemt.20376. [DOI] [PubMed] [Google Scholar]
- [51].Albrecht LV, Tejeda-Muñoz N, De Robertis EM, Protocol for probing regulated lysosomal activity and function in living cells, STAR Protoc. 1 (3) (2020) 100132, 10.1016/j.xpro.2020.100132. [DOI] [PMC free article] [PubMed] [Google Scholar]
- [52].Dolman NJ, Kilgore JA, A review of reagents for fluorescence microscopy of cellular compartments and structures, Part I: BacMam labeling and reagents for vesicular structures, Curr. Protoc 3 (6) (2023) e751, 10.1002/cpz1.751. [DOI] [PubMed] [Google Scholar]
- [53].Lunova M, Kubovciak J, Smolkova B, Uzhytchak M, Michalova K, Dejneka A, Strnad P, Lunov O, Jirsa M, Expression of interferons lambda 3 and 4 induces identical response in human liver cell lines depending exclusively on canonical signaling, Int. J. Mol. Sci 22 (5) (2021) 2560, 10.3390/ijms22052560. [DOI] [PMC free article] [PubMed] [Google Scholar]
- [54].Frtus A, Smolkov B, Uzhytchak M, Lunova M, Jirsa M, Petrenko Y, Dejneka A, Lunov O, Mechanical regulation of mitochondrial dynamics and function in a 3D-engineered liver tumor microenvironment, ACS Biomater. Sci. Eng 9 (5) (2023) 2408–2425, 10.1021/acsbiomaterials.2c01518. [DOI] [PMC free article] [PubMed] [Google Scholar]
- [55].Schmittgen TD, Livak KJ, Analyzing real-time PCR data by the comparative C-T method, Nat. Protoc 3 (6) (2008) 1101–1108, 10.1038/nprot.2008.73. [DOI] [PubMed] [Google Scholar]
- [56].Lunov O, Zablotskii V, Churpita O, Lunova M, Jirsa M, Dejneka A, Kubinová S, Chemically different non-thermal plasmas target distinct cell death pathways, Sci. Rep 7 (2017) 600, 10.1038/s41598-017-00689-5. [DOI] [PMC free article] [PubMed] [Google Scholar]
- [57].Levada K, Pshenichnikov S, Omelyanchik A, Rodionova V, Nikitin A, Savchenko A, Schetinin I, Zhukov D, Abakumov M, Majouga A, Lunova M, Jirsa M, Smolková B, Uzhytchak M, Dejneka A, Lunov O, Progressive lysosomal membrane permeabilization induced by iron oxide nanoparticles drives hepatic cell autophagy and apoptosis, Nano Converg. 7 (1) (2020) 17, 10.1186/s40580-020-00228-5. [DOI] [PMC free article] [PubMed] [Google Scholar]
- [58].Lunova M, Smolkova B, Uzhytchak M, Janouskova KZ, Jirsa M, Egorova D, Kulikov A, Kubinova S, Dejneka A, Lunov O, Light-induced modulation of the mitochondrial respiratory chain activity: possibilities and limitations, Cell. Mol. Life Sci 77 (14) (2020) 2815–2838, 10.1007/s00018-019-03321-z. [DOI] [PMC free article] [PubMed] [Google Scholar]
- [59].Wubbolts R, FernandezBorja M, Oomen L, Verwoerd D, Janssen H, Calafat J, Tulp A, Dusseljee S, Neefjes J, Direct vesicular transport of MHC class II molecules from lysosomal structures to the cell surface, J. Cell Biol 135 (3) (1996) 611–622, 10.1083/jcb.135.3.611. [DOI] [PMC free article] [PubMed] [Google Scholar]
- [60].Mukhopadhyay P, Rajesh M, Haskó G, Hawkins BJ, Madesh M, Pacher P, Simultaneous detection of apoptosis and mitochondrial superoxide production in live cells by flow cytometry and confocal microscopy, Nat. Protoc 2 (9) (2007) 2295–2301, 10.1038/nprot.2007.327. [DOI] [PMC free article] [PubMed] [Google Scholar]
- [61].Manders EM, Stap J, Brakenhoff GJ, van Driel R, Aten JA, Dynamics of three-dimensional replication patterns during the S-phase, analysed by double labelling of DNA and confocal microscopy, J. Cell Sci 103 (Pt 3) (1992) 857–862, [DOI] [PubMed] [Google Scholar]
- [62].Arena ET, Rueden CT, Hiner MC, Wang S, Yuan M, Eliceiri KW, Quantitating the cell: turning images into numbers with ImageJ, Wiley Interdiscip. Rev.-Dev. Biol 6 (2) (2017) e260, 10.1002/wdev.260. [DOI] [PubMed] [Google Scholar]
- [63].Petrenko Y, Syková E, Kubinová S, The therapeutic potential of three-dimensional multipotent mesenchymal stromal cell spheroids, Stem Cell Res. Ther 8 (2017) 94, 10.1186/s13287-017-0558-6. [DOI] [PMC free article] [PubMed] [Google Scholar]
- [64].Hamilton N, Quantification and its applications in fluorescent microscopy imaging, Traffic 10 (8) (2009) 951–961, 10.1111/j.1600-0854.2009.00938.x. [DOI] [PubMed] [Google Scholar]
- [65].Jonkman J, Brown CM, Wright GD, Anderson KI, North AJ, Tutorial: guidance for quantitative confocal microscopy, Nat. Protoc 15 (2020) 1585–1611, 10.1038/s41596-020-0313-9. [DOI] [PubMed] [Google Scholar]
- [66].Lee JY, Kitaoka M, A beginner's guide to rigor and reproducibility in fluorescence imaging experiments, Mol. Biol. Cell 29 (13) (2018) 1519–1525, 10.1091/mbc.E17-05-0276. [DOI] [PMC free article] [PubMed] [Google Scholar]
- [67].Dell RB, Holleran S, Ramakrishnan R, Sample size determination, ILAR J. 43 (4) (2002) 207–213, 10.1093/ilar.43.4.207. [DOI] [PMC free article] [PubMed] [Google Scholar]
- [68].Burns JR, Seifert A, Fertig N, Howorka S, A biomimetic DNA-based channel for the ligand-controlled transport of charged molecular cargo across a biological membrane, Nat. Nanotechnol 11 (2) (2016) 152–156, 10.1038/Nnano.2015.279. [DOI] [PubMed] [Google Scholar]
- [69].Arulkumaran N, Lanphere C, Gaupp C, Burns JR, Singer M, Howorka S, DNA nanodevices with selective immune cell interaction and function, ACS Nano 15 (3) (2021) 4394–4404, 10.1021/acsnano.0c07915. [DOI] [PubMed] [Google Scholar]
- [70].Anastassacos FM, Zhao Z, Zeng Y, Shih WM, Glutaraldehyde cross-linking of oligolysines coating DNA origami greatly reduces susceptibility to nuclease degradation, J. Am. Chem. Soc 142 (7) (2020) 3311–3315, 10.1021/jacs.9b11698. [DOI] [PubMed] [Google Scholar]
- [71].Bertosin E, Stoemmer P, Feigl E, Wenig M, Honemann MN, Dietz H, Cryo-electron microscopy and mass analysis of oligolysine-coated DNA nanostructures, ACS Nano 15 (6) (2021) 9391–9403, 10.1021/acsnano.0c10137. [DOI] [PMC free article] [PubMed] [Google Scholar]
- [72].Wu H, Chen TT, Wang XN, Ke YG, Jiang JH, RNA imaging in living mice enabled by an in vivo hybridization chain reaction circuit with a tripartite DNA probe, Chem. Sci 11 (1) (2020) 62–69, 10.1039/c9sc03469b. [DOI] [PMC free article] [PubMed] [Google Scholar]
- [73].Zhang YN, Poon W, Tavares AJ, McGilvray ID, Chan WCW, Nanoparticle-liver interactions: Cellular uptake and hepatobiliary elimination, J. Control. Release 240 (1) (2016) 332–348, 10.1016/j.jconrel.2016.01.020. [DOI] [PubMed] [Google Scholar]
- [74].Frtus A, Smolkova B, Uzhytchak M, Lunova M, Jirsa M, Kubinova S, Dejneka A, Lunov O, Analyzing the mechanisms of iron oxide nanoparticles interactions with cells: A road from failure to success in clinical applications, J. Control. Release 328 (2020) 59–77, 10.1016/j.jconrel.2020.08.036. [DOI] [PubMed] [Google Scholar]
- [75].Mendes BB, Conniot J, Avital A, Yao DB, Jiang XY, Zhou X, Sharf-Pauker N, Xiao YL, Adir O, Liang HJ, Shi JJ, Schroeder A, Conde J, Nanodelivery of nucleic acids, Nat. Rev. Method Prime 2 (1) (2022) 24, 10.1038/s43586-022-00104-y. [DOI] [PMC free article] [PubMed] [Google Scholar]
- [76].Dilliard SA, Siegwart DJ, Passive, active and endogenous organ-targeted lipid and polymer nanoparticles for delivery of genetic drugs, Nat. Rev. Mater 8 (4) (2023) 282–300, 10.1038/s41578-022-00529-7. [DOI] [PMC free article] [PubMed] [Google Scholar]
- [77].Burke RS, Pun SH, Synthesis and characterization of biodegradable HPMA-oligolysine copolymers for improved gene delivery, Bioconjugate Chem. 21 (1) (2010) 140–150, 10.1021/bc9003662. [DOI] [PMC free article] [PubMed] [Google Scholar]
- [78].Fukuyama K, Asagiri M, Sugimoto M, Tsushima H, Seo S, Taura K, Uemoto S, Iwaisako K, Gene expression profiles of liver cancer cell lines reveal two hepatocyte-like and fibroblast-like clusters, PLoS One 16 (2) (2021) e0245939, 10.1371/journal.pone.0245939. [DOI] [PMC free article] [PubMed] [Google Scholar]
- [79].Ao L, Guo Y, Song X, Guan Q, Zheng W, Zhang J, Huang H, Zou Y, Guo Z, Wang X, Evaluating hepatocellular carcinoma cell lines for tumour samples using within-sample relative expression orderings of genes, Liver Int. 37 (11) (2017) 1688–1696, 10.1111/liv.13467. [DOI] [PubMed] [Google Scholar]
- [80].Cagatay T, Ozturk M, p53 mutation as a source of aberrant β-catenin accumulation in cancer cells, Oncogene 21 (52) (2002) 7971–7980, 10.1038/sj.onc.1205919. [DOI] [PubMed] [Google Scholar]
- [81].Dixon SJ, Lee MJ, Quick tips for interpreting cell death experiments, Nat. Cell Biol 25 (2023) 1720–1723, 10.1038/s41556-023-01288-5. [DOI] [PubMed] [Google Scholar]
- [82].Chan GKY, Kleinheinz TL, Peterson D, Moffat JG, A simple high-content cell cycle assay reveals frequent discrepancies between cell number and ATP and MTS proliferation assays, PLoS One 8 (5) (2013) e63583, 10.1371/journal.pone.0063583. [DOI] [PMC free article] [PubMed] [Google Scholar]
- [83].Xu HX, Ren DJ, Lysosomal physiology, Annu. Rev. Physiol 77 (2015) 57–80, 10.1146/annurev-physiol-021014-071649. [DOI] [PMC free article] [PubMed] [Google Scholar]
- [84].Ballabio A, Bonifacino JS, Lysosomes as dynamic regulators of cell and organismal homeostasis, Nat. Rev. Mol. Cell Biol 21 (2) (2020) 101–118, 10.1038/s41580-019-0185-4. [DOI] [PubMed] [Google Scholar]
- [85].Lim CY, Zoncu R, The lysosome as a command-and-control center for cellular metabolism, J. Cell Biol 214 (6) (2016) 653–664, 10.1083/jcb.201607005. [DOI] [PMC free article] [PubMed] [Google Scholar]
- [86].Mei QA, Wei XX, Su FY, Liu Y, Youngbull C, Johnson R, Lindsay S, Yan H, Meldrum D, Stability of DNA origami nanoarrays in cell lysate, Nano Lett. 11 (4) (2011) 1477–1482, 10.1021/nl1040836. [DOI] [PMC free article] [PubMed] [Google Scholar]
- [87].Keum JW, Bermudez H, Enhanced resistance of DNA nanostructures to enzymatic digestion, Chem. Commun (45) (2009) 7036–7038, 10.1039/b917661f. [DOI] [PubMed] [Google Scholar]
- [88].Massich MD, Giljohann DA, Schmucker AL, Patel PC, Mirkin CA, Cellular response of polyvalent oligonucleotide-gold nanoparticle conjugates, ACS Nano 4 (10) (2010) 5641–5646, 10.1021/nn102228s. [DOI] [PMC free article] [PubMed] [Google Scholar]
- [89].Shen XB, Jiang Q, Wang JY, Dai LR, Zou GZ, Wang ZG, Chen WQ, Jiang W, Ding BQ, Visualization of the intracellular location and stability of DNA origami with a label-free fluorescent probe, Chem. Commun 48 (92) (2012) 11301–11303, 10.1039/c2cc36185j. [DOI] [PubMed] [Google Scholar]
- [90].Walsh AS, Yin HF, Erben CM, Wood MJA, Turberfield AJ, DNA cage delivery to mammalian cells, ACS Nano 5 (7) (2011) 5427–5432, 10.1021/nn2005574. [DOI] [PubMed] [Google Scholar]
- [91].Hahn J, Wickham SFJ, Shih WM, Perrault SD, Addressing the instability of DNA nanostructures in tissue culture, ACS Nano 8 (9) (2014) 8765–8775, 10.1021/nn503513p. [DOI] [PMC free article] [PubMed] [Google Scholar]
- [92].Wei XX, Nangreave J, Jiang SX, Yan H, Liu Y, Mapping the thermal behavior of DNA origami nanostructures, J. Am. Chem. Soc 135 (16) (2013) 6165–6176, 10.1021/ja4000728. [DOI] [PubMed] [Google Scholar]
- [93].Heidari R, Khosravian P, Mirzaei SA, Elahian F, siRNA delivery using intelligent chitosan-capped mesoporous silica nanoparticles for overcoming multidrug resistance in malignant carcinoma cells, Sci. Rep 11 (1) (2021) 20531, 10.1038/s41598-021-00085-0. [DOI] [PMC free article] [PubMed] [Google Scholar]
- [94].Balfourier A, Luciani N, Wang G, Lelong G, Ersen O, Khelfa A, Alloyeau D, Gazeau F, Carn F, Unexpected intracellular biodegradation and recrystallization of gold nanoparticles, Proc. Natl. Acad. Sci. U. S. A 117 (1) (2020) 103–113, 10.1073/pnas.1911734116. [DOI] [PMC free article] [PubMed] [Google Scholar]
- [95].Lian XZ, Erazo-Oliveras A, Pellois JP, Zhou HC, High efficiency and long-term intracellular activity of an enzymatic nanofactory based on metal-organic frameworks, Nat. Commun 8 (2017) 2075, 10.1038/s41467-017-02103-0. [DOI] [PMC free article] [PubMed] [Google Scholar]
- [96].Del Grosso A, Parlanti G, Mezzena R, Cecchini M, Current treatment options and novel nanotechnology-driven enzyme replacement strategies for lysosomal storage disorders, Adv. Drug Deliv. Rev 188 (2022) 114464, 10.1016/j.addr.2022.114464. [DOI] [PubMed] [Google Scholar]
- [97].Zeng JL, Shirihai OS, Grinstaff MW, Degradable nanoparticles restore lysosomal pH and autophagic flux in lipotoxic pancreatic beta cells, Adv. Healthc. Mater 8 (12) (2019) 1801511, 10.1002/adhm.201801511. [DOI] [PubMed] [Google Scholar]
- [98].Zeng JL, Martin A, Han X, Shirihai OS, Grinstaff MW, Biodegradable PLGA nanoparticles restore lysosomal acidity and protect neural PC-12 cells against mitochondrial toxicity, Ind. Eng. Chem. Res 58 (31) (2019) 13910–13917, 10.1021/acs.iecr.9b02003. [DOI] [PMC free article] [PubMed] [Google Scholar]
- [99].Samir A, Ashour FH, Hakim AAA, Bassyouni M, Recent advances in biodegradable polymers for sustainable applications, NPJ Mater. Degrad 6 (1) (2022) 68, 10.1038/s41529-022-00277-7. [DOI] [Google Scholar]
- [100].Zhang K, Cheng X, Zhao L, Huang M, Tao Y, Zhang H, Rosenholm JM, Zhuang M, Chen Z-Y, Chen B, Shu Y, Direct functional protein delivery with a peptide into neonatal and adult mammalian inner ear in vivo, Mol.Ther.-Methods Clin. Dev 18 (2020) 511–519, 10.1016/j.omtm.2020.06.023. [DOI] [PMC free article] [PubMed] [Google Scholar]
- [101].Bruce VJ, McNaughton BR, Inside job: Methods for delivering proteins to the interior of mammalian cells, Cell Chem. Biol 24 (8) (2017) 924–934, 10.1016/j.chembiol.2017.06.014. [DOI] [PubMed] [Google Scholar]
- [102].Tan Y, Zhu XY, Wu D, Song EQ, Song Y, Compromised autophagic effect of polystyrene nanoplastics mediated by protein corona was recovered after lysosomal degradation of corona, Environ. Sci. Technol 54 (18) (2020) 11485–11493, 10.1021/acs.est.0c04097. [DOI] [PubMed] [Google Scholar]
- [103].Wang FJ, Yu L, Monopoli MP, Sandin P, Mahon E, Salvati A, Dawson KA, The biomolecular corona is retained during nanoparticle uptake and protects the cells from the damage induced by cationic nanoparticles until degraded in the lysosomes, Nanomed.-Nanotechnol. Biol. Med 9 (8) (2013) 1159–1168, 10.1016/j.nano.2013.04.010. [DOI] [PubMed] [Google Scholar]
- [104].Bertoli F, Garry D, Monopoli MP, Salvati A, Dawson KA, The intracellular destiny of the protein corona: A study on its cellular internalization and evolution, ACS Nano 10 (11) (2016) 10471–10479, 10.1021/acsnano.6b06411. [DOI] [PubMed] [Google Scholar]
- [105].Han S, Marques RD, Simon J, Kaltbeitzel A, Koynov K, Landfester K, Mailänder V, Lieberwirth I, Endosomal sorting results in a selective separation of the protein corona from nanoparticles, Nat. Commun 14 (1) (2023) 295, 10.1038/s41467-023-35902-9. [DOI] [PMC free article] [PubMed] [Google Scholar]
- [106].Wensley HJ, Johnston DA, Smith WS, Holmes SE, Flavell SU, Flavell DJ, A flow cytometric method to quantify the endosomal escape of a protein toxin to the cytosol of target cells, Pharm. Res 37 (1) (2019) 16, 10.1007/s11095-019-2725-1. [DOI] [PMC free article] [PubMed] [Google Scholar]
- [107].Pei D, Buyanova M, Overcoming endosomal entrapment in drug delivery, Bioconjugate Chem. 30 (2) (2019) 273–283, 10.1021/acs.bioconjchem.8b00778. [DOI] [PMC free article] [PubMed] [Google Scholar]
- [108].Martens TF, Remaut K, Demeester J, De Smedt SC, Braeckmans K, Intracellular delivery of nanomaterials: How to catch endosomal escape in the act, Nano Today 9 (3) (2014) 344–364, 10.1016/j.nantod.2014.04.011. [DOI] [Google Scholar]
- [109].Altan N, Chen Y, Schindler M, Simon SM, Defective acidification in human breast tumor cells and implications for chemotherapy, J. Exp. Med 187 (10) (1998) 1583–1598, 10.1084/jem.187.10.1583. [DOI] [PMC free article] [PubMed] [Google Scholar]
- [110].Fang MX, Adhikari R, Bi JH, Mazi W, Dorh N, Wang JB, Conner N, Ainsley J, Karabencheva-Christova TG, Luo FT, Tiwari A, Liu HY, Fluorescent probes for sensitive and selective detection of pH changes in live cells in visible and near-infrared channels, J. Mat. Chem. B 5 (48) (2017) 9579–9590, 10.1039/c7tb02583a. [DOI] [PMC free article] [PubMed] [Google Scholar]
- [111].Hu YB, Dammer EB, Ren RJ, Wang G, The endosomal-lysosomal system: from acidification and cargo sorting to neurodegeneration, Transl. Neurodegener 4 (2015) 18, 10.1186/s40035-015-0041-1. [DOI] [PMC free article] [PubMed] [Google Scholar]
- [112].Mindell JA, Lysosomal acidification mechanisms, Annual Review of Physiology 74 (2012) 69–86, 10.1146/annurev-physiol-012110-142317. [DOI] [PubMed] [Google Scholar]
- [113].Tracey SR, Smyth P, Barelle CJ, Scott CJ, Development of next generation nanomedicine-based approaches for the treatment of cancer: we've barely scratched the surface, Biochem. Soc. Trans 49 (5) (2021) 2253–2269, 10.1042/Bst20210343. [DOI] [PMC free article] [PubMed] [Google Scholar]
- [114].Vermeulen LMP, Brans T, Samal SK, Dubruel P, Demeester J, De Smedt SC, Remaut K, Braeckmans K, Endosomal size and membrane leakiness influence proton sponge-based rupture of endosomal vesicles, ACS Nano 12 (3) (2018) 2332–2345, 10.1021/acsnano.7b07583. [DOI] [PubMed] [Google Scholar]
- [115].Roy S, Zhu DC, Parak WJ, Feliu N, Lysosomal proton buffering of poly(ethylenimine) measured by fluorescent pH-sensor microcapsules, ACS Nano 14 (7) (2020) 8012–8023, 10.1021/acsnano.9b10219. [DOI] [PubMed] [Google Scholar]
- [116].Wojnilowicz M, Glab A, Bertucci A, Caruso F, Cavalieri F, Super-resolution imaging of proton sponge-triggered rupture of endosomes and cytosolic release of small interfering RNA, ACS Nano 13 (1) (2019) 187–202, 10.1021/acsnano.8b05151. [DOI] [PubMed] [Google Scholar]
- [117].Lee DU, Park JY, Kwon S, Park JY, Kim YH, Khang D, Hong JH, Apoptotic lysosomal proton sponge effect in tumor tissue by cationic gold nanorods, Nanoscale 11 (42) (2019) 19980–19993, 10.1039/c9nr04323c. [DOI] [PubMed] [Google Scholar]
- [118].Faizullin B, Gubaidullin A, Gerasimova T, Kashnik I, Brylev K, Kholin K, Nizameev I, Voloshina A, Sibgatullina G, Samigullin D, Petrov K, Musina E, Karasik A, Mustafina A, Proton sponge effect and apoptotic cell death mechanism of Agx-Re6 nanocrystallites derived from the assembly of [{Re6S8}(OH)6-n(H2O)n]n-4 with Ag+ ions, Colloid Surf. A-Physicochem. Eng. Asp 648 (2022) 129312, 10.1016/j.colsurfa.2022.129312. [DOI] [Google Scholar]
- [119].Wolff JA, Rozema DB, Breaking the bonds: Non-viral vectors become chemically dynamic, Mol. Ther 16 (1) (2008) 8–15, 10.1038/sj.mt.6300326. [DOI] [PubMed] [Google Scholar]
- [120].Fernandez DI, Le Brun AP, Whitwell TC, Sani MA, James M, Separovic F, The antimicrobial peptide aurein 1.2 disrupts model membranes the carpet mechanism, Phys. Chem. Chem. Phys 14 (45) (2012) 15739–15751, 10.1039/c2cp43099a. [DOI] [PubMed] [Google Scholar]
- [121].Cheraghi N, Hosseini M, Mohammadinejad S, Pore formation and the key factors in antibacterial activity of aurein 1.2 and LLAA inside lipid bilayers, a molecular dynamics study, Biochim. Biophys. Acta-Biomembr 1860 (2) (2018) 347–356, 10.1016/j.bbamem.2017.10.009. [DOI] [PubMed] [Google Scholar]
- [122].Balatti GE, Domene C, Martini MF, Pickholz M, Differential stability of aurein 1.2 pores in model membranes of two probiotic strains, J. Chem. Inf. Model 60 (10) (2020) 5142–5152, 10.1021/acs.jcim.0c00855. [DOI] [PubMed] [Google Scholar]
- [123].Bourdenx M, Daniel J, Genin E, Soria FN, Blanchard-Desce M, Bezard E, Dehay B, Nanoparticles restore lysosomal acidification defects: Implications for Parkinson and other lysosomal-related diseases, Autophagy 12 (3) (2016) 472–483, 10.1080/15548627.2015.1136769. [DOI] [PMC free article] [PubMed] [Google Scholar]
- [124].Trudeau KM, Colby AH, Zeng JL, Las G, Feng JZH, Grinstaff MW, Shirihai OS, Lysosome acidification by photoactivated nanoparticles restores autophagy under lipotoxicity, J. Cell Biol 214 (1) (2016) 25–34, 10.1083/jcb.201511042. [DOI] [PMC free article] [PubMed] [Google Scholar]
- [125].Zeng JL, Acin-Perez R, Assali EA, Martin A, Brownstein AJ, Petcherski A, Fernández-del-Rio L, Xiao RQ, Lo CH, Shum M, Liesa M, Han X, Shirihai OS, Grinstaff MW, Restoration of lysosomal acidification rescues autophagy and metabolic dysfunction in non-alcoholic fatty liver disease, Nat. Commun 14 (1) (2023) 2573, 10.1038/s41467-023-38165-6. [DOI] [PMC free article] [PubMed] [Google Scholar]
- [126].Wang SJ, Schianchi F, Neumann D, Wong LY, Sun AM, van Nieuwenhoven FA, Zeegers MP, Strzelecka A, Col U, Glatz JFC, Nabben M, Luiken JJFP, Specific amino acid supplementation rescues the heart from lipid overload-induced insulin resistance and contractile dysfunction by targeting the endosomal mTOR-v-ATPase axis, Mol. Metab 53 (2021) 101293, 10.1016/j.molmet.2021.101293. [DOI] [PMC free article] [PubMed] [Google Scholar]
- [127].Bandyopadhyay D, Cyphersmith A, Zapata JA, Kim YJ, Payne CK, Lysosome transport as a function of lysosome diameter, PLoS One 9 (1) (2014) e86847, 10.1371/journal.pone.0086847. [DOI] [PMC free article] [PubMed] [Google Scholar]
- [128].Boya P, Kroemer G, Lysosomal membrane permeabilization in cell death, Oncogene 27 (50) (2008) 6434–6451, 10.1038/onc.2008.310. [DOI] [PubMed] [Google Scholar]
- [129].Kost TA, Condreay JP, Jarvis DL, Baculovirus as versatile vectors for protein expression in insect and mammalian cells, Nat. Biotechnol 23 (5) (2005) 567–575, 10.1038/nbt1095. [DOI] [PMC free article] [PubMed] [Google Scholar]
- [130].Okabe K, Inada N, Gota C, Harada Y, Funatsu T, Uchiyama S, Intracellular temperature mapping with a fluorescent polymeric thermometer and fluorescence lifetime imaging microscopy, Nat. Commun 3 (2012) 705, 10.1038/ncomms1714. [DOI] [PMC free article] [PubMed] [Google Scholar]
- [131].Ge W, Li DX, Gao YP, Cao XT, The roles of lysosomes in inflammation and autoimmune diseases, Int. Rev. Immunol 34 (5) (2015) 415–431, 10.3109/08830185.2014.936587. [DOI] [PubMed] [Google Scholar]
- [132].Lan YY, Londoño D, Bouley R, Rooney MS, Hacohen N, Dnase2a deficiency uncovers lysosomal clearance of damaged nuclear DNA via autophagy, Cell Rep 9 (1) (2014) 180–192, 10.1016/j.celrep.2014.08.074. [DOI] [PMC free article] [PubMed] [Google Scholar]
- [133].Walkley SU, Vanier MT, Secondary lipid accumulation in lysosomal disease, Biochim. Biophys. Acta-Mol. Cell Res 1793 (4) (2009) 726–736, 10.1016/j.bbamcr.2008.11.014. [DOI] [PMC free article] [PubMed] [Google Scholar]
- [134].Shang GJ, Zhang CG, Chen ZJJ, Bai XC, Zhang XW, Cryo-EM structures of STING reveal its mechanism of activation by cyclic GMP-AMP, Nature 567 (7748) (2019) 389–393, 10.1038/s41586-019-0998-5. [DOI] [PMC free article] [PubMed] [Google Scholar]
- [135].Hopfner KP, Hornung V, Molecular mechanisms and cellular functions of cGAS-STING signalling, Nat. Rev. Mol. Cell Biol 21 (9) (2020) 501–521, 10.1038/s41580-020-0244-x. [DOI] [PubMed] [Google Scholar]
- [136].Decout A, Katz JD, Venkatraman S, Ablasser A, The cGAS-STING pathway as a therapeutic target in inflammatory diseases, Nat. Rev. Immunol 21 (9) (2021) 548–569, 10.1038/s41577-021-00524-z. [DOI] [PMC free article] [PubMed] [Google Scholar]
- [137].Hu XY, Li J, Fu MR, Zhao X, Wang W, The JAK/STAT signaling pathway: from bench to clinic, Signal Transduct. Target. Ther 6 (1) (2021) 402, 10.1038/s41392-021-00791-1. [DOI] [PMC free article] [PubMed] [Google Scholar]
- [138].Ma F, Li B, Yu YX, Iyer SS, Sun MY, Cheng GH, Positive feedback regulation of type I interferon by the interferon-stimulated gene STING, Embo Rep. 16 (2) (2015) 202–212, 10.15252/embr.201439366. [DOI] [PMC free article] [PubMed] [Google Scholar]
- [139].Motwani M, Pesiridis S, Fitzgerald KA, DNA sensing by the cGAS-STING pathway in health and disease, Nat. Rev. Genet 20 (11) (2019) 657–674, 10.1038/s41576-019-0151-1. [DOI] [PubMed] [Google Scholar]
- [140].Katze MG, He YP, Gale M, Viruses and interferon: A fight for supremacy, Nat. Rev. Immunol 2 (9) (2002) 675–687, 10.1038/nri888. [DOI] [PubMed] [Google Scholar]
- [141].Wong MT, Chen SSL, Emerging roles of interferon-stimulated genes in the innate immune response to hepatitis C virus infection, Cell. Mol. Immunol 13 (1) (2016) 11–35, 10.1038/cmi.2014.127. [DOI] [PMC free article] [PubMed] [Google Scholar]
- [142].Schoggins JW, Interferon-stimulated genes: What do they all do?, Annu. Rev. Virol 6 (2019) 567–584, 10.1146/annurev-virology-092818-015756. [DOI] [PubMed] [Google Scholar]
- [143].Wang FJ, Salvati A, Boya P, Lysosome-dependent cell death and deregulated autophagy induced by amine-modified polystyrene nanoparticles, Open Biol. 8 (4) (2018) 170271, 10.1098/rsob.170271. [DOI] [PMC free article] [PubMed] [Google Scholar]
- [144].Wang FJ, Gómez-Sintes R, Boya P, Lysosomal membrane permeabilization and cell death, Traffic 19 (12) (2018) 918–931, 10.1111/tra.12613. [DOI] [PubMed] [Google Scholar]
- [145].Liu XN, Wang S, Yang Q, Wang YJ, Chen DX, Zhu XX, ESC reverses epithelial mesenchymal transition induced by transforming growth factor-β via inhibition of Smad signal pathway in HepG2 liver cancer cells, Cancer Cell Int. 15 (2015) 114, 10.1186/s12935-015-0265-2. [DOI] [PMC free article] [PubMed] [Google Scholar]
- [146].Grotegut S, von Schweinitz D, Christofori G, Lehembre F, Hepatocyte growth factor induces cell scattering through MAPK/Egr-1-mediated upregulation of Snail, Embo J. 25 (15) (2006) 3534–3545, 10.1038/sj.emboj.7601213. [DOI] [PMC free article] [PubMed] [Google Scholar]
- [147].Pan F-Y, Zhang S-Z, Xu N, Meng F-L, Zhang H-X, Xue B, Han X, Li C-J, β-catenin signaling involves HGF-enhanced HepG2 scattering through activating MMP-7 transcription, Histochem. Cell Biol 134 (3) (2010) 285–295, 10.1007/s00418-010-0729-3. [DOI] [PubMed] [Google Scholar]
- [148].Palacios F, Tushir JS, Fujita Y, D'Souza-Schorey C, Lysosomal targeting of E-cadherin: a unique mechanism for the down-regulation of cell-cell adhesion during epithelial to mesenchymal transitions, Mol. Biol. Cell 25 (1) (2005) 389–402, 10.1128/Mcb.25.1.389-402.2005. [DOI] [PMC free article] [PubMed] [Google Scholar]
- [149].Repnik U, Cesen MH, Turk B, Lysosomal membrane permeabilization in cell death: Concepts and challenges, Mitochondrion 19 (2014) 49–57, 10.1016/j.mito.2014.06.006. [DOI] [PubMed] [Google Scholar]
- [150].Zhao M, Antunes F, Eaton JW, Brunk UT, Lysosomal enzymes promote mitochondrial oxidant production, cytochrome release and apoptosis, Eur. J. Biochem 270 (18) (2003) 3778–3786, 10.1046/j.1432-1033.2003.03765.x. [DOI] [PubMed] [Google Scholar]
- [151].Gulbins E, Kolesnick RN, It takes a CAD to kill a tumor cell with a LMP, Cancer Cell 24 (3) (2013) 279–281, 10.1016/j.ccr.2013.08.025. [DOI] [PubMed] [Google Scholar]
- [152].Saftig P, Sandhoff K, CANCER Killing from the inside, Nature 502 (7471) (2013) 312–313, 10.1038/nature12692. [DOI] [PubMed] [Google Scholar]
- [153].Kallunki T, Olsen OD, Jäättelä M, Cancer-associated lysosomal changes: friends or foes?, Oncogene 32 (16) (2013) 1995–2004, 10.1038/onc.2012.292. [DOI] [PubMed] [Google Scholar]
- [154].Qiu JC, Xia YN, Killing cancer cells by rupturing their lysosomes, Nat. Nanotechnol 15 (4) (2020) 252–253, 10.1038/s41565-020-0639-z. [DOI] [PubMed] [Google Scholar]
- [155].Xiang YT, Li NS, Liu M, Chen QH, Long XY, Yang YQ, Xiao ZX, Huang J, Wang XY, Yang YR, Zhang JP, Liu C, Huang Q, Nanodrugs detonate lysosome bombs, Front. Pharmacol 13 (2022) 909504, 10.3389/fphar.2022.909504. [DOI] [PMC free article] [PubMed] [Google Scholar]
- [156].Liu CG, Han YH, Kankala RK, Wang SB, Chen AZ, Subcellular performance of nanoparticles in cancer therapy, Int. J. Nanomed 15 (2020) 675–704, 10.2147/Ijn.S226186. [DOI] [PMC free article] [PubMed] [Google Scholar]
- [157].Langhans SA, Three-dimensional cell culture models in drug discovery and drug repositioning, Front. Pharmacol 9 (2018) 6, 10.3389/fphar.2018.00006. [DOI] [PMC free article] [PubMed] [Google Scholar]
- [158].Xu X, Farach-Carson MC, Jia XQ, Three-dimensional tumor models for cancer research and drug evaluation, Biotechnol. Adv 32 (7) (2014) 1256–1268, 10.1016/j.biotechadv.2014.07.009. [DOI] [PMC free article] [PubMed] [Google Scholar]
- [159].van Solinge TS, Nieland L, Chiocca EA, Broekman MLD, Advances in local therapy for glioblastoma - taking the fight to the tumour, Nat. Rev. Neurol 18 (4) (2022) 221–236, 10.1038/s41582-022-00621-0. [DOI] [PMC free article] [PubMed] [Google Scholar]
Associated Data
This section collects any data citations, data availability statements, or supplementary materials included in this article.
Supplementary Materials
Data Availability Statement
Data will be made available on request.