

Abstract
Magnetic Resonance Imaging (MRI) scanners are widely used for 3D gel dosimeters readout. However, limited access to MRI scanners is a challenge in MRI-based gel dosimetry. Recent clinical implementation of MRI-guided radiation therapy machines provides potential opportunities for onboard gel dosimetry using its MRI subsystem. The objective of this study was to investigate the feasibility of gel dosimetry using ViewRay’s onboard 0.35 T MRI scanner. A BANG® polymer gel dosimeter was irradiated by three beams of 3 × 3 cm2 field size. The T2 relaxation rate (R2) of the irradiated gel was measured using a Philips 1.5 T Ingenia MRI and a ViewRay 0.35 T onboard MRI and spin-echo pulse sequences. The number of signal averages (NSA) was set to 16 for the ViewRay acquisitions and one for the Philips 1.5 T MRI to achieve similar signal-to-noise ratios. The in-plane spatial resolution was 1.5 × 1.5 mm2 and the slice thickness was 5 mm. The relative dose uncertainty was obtained using R2 versus dose curves to compare the performance of dosimetry using the two different MRIs and field strengths. The dose uncertainty decreased from 12% at 2 Gy to 3.5% at 7.5 Gy at 1.5 T. The dose uncertainty decreased from 13% at 2 Gy to 4% at 7.5 Gy with NSA=16 and 3 × 3 mm2 pixel size, and from 10.5% at 2 Gy to 3.2% at 7.5 Gy with NSA=16 and denoised R2 maps (1.5 × 1.5 mm2 pixel size) at 0.35 T. Therefore, comparable dose uncertainty was achievable using the ViewRay’s onboard 0.35 T and Philips 1.5 T MRI scanners. 3D gel dosimetry using onboard low-field MRI scanner provides ViewRay users a 3D high resolution dosimetry option besides film and ionization chamber.
1. Introduction
Recent clinical implementation of magnetic resonance imaging (MRI) guided radiation therapy (MRIgRT) systems provides several unique advantages to cancer patients receiving radiation therapy. Compared to x ray imaging, MRI has superior soft tissue contrast, which offers a better visualization of the target and organs at risk. The onboard MRI can also provide real-time imaging during the treatment, which can be used for target tracking and gated delivery (Green et al., 2018). Furthermore, onboard MRI-guidance allows for online re-planning according to physical or functional changes to the target volume and organs-at-risk (Lagendijk et al., 2014; Acharya et al., 2016; Mazur et al., 2016).
Radiation dosimetry of MRIgRT remains challenging. In the presence of magnetic fields, the paths of secondary electrons released via photon interactions are altered due to Lorentz forces (Raaijmakers et al., 2008; Wang et al., 2016). Subsequently, the dose distribution is altered depending on field strength and orientation. There are several well-established dosimetry tools that are available for experimental dosimetry such as ionization chamber, two-dimensional (2D) radiographic/radiochromic film, and quasi-three-dimensional (3D) diode array (Li et al., 2015; Low et al., 2011). However, films and 2D or 3D array detectors provide only partial sampling of the whole dose distribution. Alternatively, 3D MRI compatible dosimeters such as radiochromic plastic (Rankine et al., 2017) and polymer gel dosimeters (Baldock et al., 2010; Lee et al., 2017) present the full 3D dose distribution in a radiologically water-equivalent medium.
MRI is commonly used to measure (or readout) the dose distribution from the gel dosimeters. However, access to MRI has been a limiting factor for the wide clinical acceptance of gel dosimeters. This issue may be less of a concern for clinics equipped with MRIgRT systems, since their onboard MRI is available to physicist for dosimetry measurements, for example, after-hours. The physicist can deliver the treatment plan using its radiation treatment device to the gel dosimeter and perform the readout in situ using its onboard MRI. The measured dose distribution can then be compared with the predicted dose distribution calculated by the treatment planning system.
The objective of this study was to investigate the feasibility of gel dosimetry at 0.35 T and compare the accuracy of measurements between 0.35 T and 1.5 T. A polymer gel was irradiated and scanned using both a ViewRay 0.35 T and a Philips Ingenia 1.5 T MRI. The number of signal averages (NSA) was increased to 16 at 0.35 T to increase the SNR (signal to noise ratio) to be similar to 1.5 T MRI. The dosimetry performance using both scanners was evaluated by comparing the relative dose uncertainty.
2. Methods and materials
A spherical BANG® (MGS Research, Inc., Madison, CT, USA) polymer gel dosimeter with a 16.6 cm diameter was used in this study. The manufacturer’s instructions on storage, irradiation, and imaging of the gel dosimeter were followed. The gel was placed in the irradiation room one day before irradiation to achieve thermal equilibrium with the room temperature. We waited another 24 hours after irradiation to achieve polymerization equilibrium. The treatment and scanning rooms were all kept at 20±0.5°C. The gel was imaged using a Philips Brilliance 64-slice computed tomography scanner (Philips Medical Systems, Cleveland, OH, USA) before the irradiation. The gel was irradiated by three 6 MV beams of 3 × 3 cm2 field size with 720 MU on the center of the sphere and 432 MU on the left and right sides of the center field with 4 cm spacing (center to center). The dose distribution under this irradiation geometry was calculated using the treatment planning system.
The MRIs of the irradiated gel were acquired using a Philips 1.5 T Ingenia MRI (V5.3) and ViewRay’s onboard 0.35 T MRI (VB19). The 70 cm diameter horizontal bore ViewRay MR-IGRT system uses a Helmholtz coil configuration of two superconducting magnets to produce a homogeneous field of 0.35 T. The magnets come equipped with superconducting and passive shims. The magnet includes an actively shielded gradient coil (max. amplitude 18 mT/s and 200 T/m-s slew rate) with a 20 cm gap to accommodate the beam. A birdcage RF body coil is used for transmission. A pair of rectangular torso phased array coils is used for reception. The MRI subsystem is based on Siemens Avanto electronics and uses Siemens IDEA/ICE software Version VB19.
Pulse sequence parameters used to measure R2 are summarized in Table I. Two separate conventional spin echo (SE) images were acquired with different echo times (TEs of 20 and 100 ms) recommended by the gel dosimeter manufacturer (Oldham et al., 2001). The gel was also imaged using a Carr–Purcell–Meiboom–Gill (CPMG) multi-spin echo sequence with 32 echoes and an echo time spacing of 20 ms (Gustavsson et al., 2003; Ramm et al., 2000; Silveira et al., 2017).
Table I:
Pulse sequence parameters for R2 Map. TE: Echo time, TR: Repetition time, rBW: Receiver bandwidth, FOV: Field of view, NSA: Number of signal averages, TA, Time of acquisition.
| Pulse sequence | 0.35 T | 1.5 T |
|---|---|---|
| Spin Echo | TEs: 20 and 100 ms TR: 8000 ms rBW: 150 Hz/pixel FOV: 190 Matrix: 128x128 Resolution: 1.5x1.5x5 mm NSAs: 1, 16 TA: 17.2 min, 4.6 hours |
TEs: 20 and 100 ms TR: 8000 ms rBW: 150 Hz/pixel FOV: 180 Matrix: 120x120 Resolution: 1.5x1.5x5 mm NSAs: 1 TA: 16.1 min |
| CPMG | TEs: n·19.3 ms, n = 1-32 TR: 8700 ms rBW: 238 Hz/pixel FOV: 190 Matrix: 128x128 Resolution: 1.5x1.5x5 mm NSAs: 1, 16 TA: 37 min, 9.94 hours |
TEs: n·20 ms, n = 1-32 TR: 8000 ms rBW: 109 Hz/pixel FOV: 180 Matrix: 120x120 Resolution: 1.5x1.5x5 mm NSAs: 1 TA: 48.4 min |
In all of the scans, the inplane spatial resolution was set at 1.5 × 1.5 mm2 and the slice thickness at 5 mm, and an interleaved slice acquisition method was used to minimize the crosstalk between nearby imaging slices. The R2 maps for the two echo pulse sequences were calculated using:
| (1), |
where S is the voxel signal for echo time (TEi) at location .
For the CPMG pulse sequences, the R2 maps were calculated using a three-parameter fit and a nonlinear fit algorithm:
| (2). |
The signal intensities were weighted with a weighting factor inversely proportional to TEi (De Deene and Baldock, 2002). The first echo was excluded in calculating the R2 values due to non-equilibrium signal and deviations from the mono-exponential decay (Bankamp and Schad, 2003).
Two approaches were taken to reduce the noise in the R2 maps obtained at 0.35 T in addition to increasing the NSA to 16: (a) downsampling the pixel size of 1.5 × 1.5 mm2 to 3 × 3 mm2 and (b) applying denoising. Several denoising methods have been developed in the past decades to remove noise while preserving the image details. The denoising algorithm used in this study was the state-of-the-art block-match and 3D filtering (BM3D) technique (Dabov et al., 2007). The BM3D algorithm demonstrated superior performance to other denoising methods (Eksioglu, 2016).
The dose versus R2 curve was plotted after the calculated R2 maps were registered to the dose maps. The R2 values were binned with a bin size of 0.1 Gy and the mean and standard deviation in each bin was obtained. We confirmed that the R2 distributions in the bins were normally distributed.
The dose-R2 curve was fit according to the linear equation (Oldham et al., 1998b):
| (3). |
The relative dose uncertainty was derived by using:
| (4), |
where R2 and are the mean and standard deviation of R2 values in the bins. The and are the uncertainties in two fit parameters of slope (α) and intercept (R0) (Oldham et al., 1998b). The dose resolution was also calculated using , where kp is a coverage factor (Baldock et al., 2001). The dose resolution for a 95% confidence level becomes .
3. Results and discussion
Figure 1, 2, 3 and 4 show the R2 maps, lateral profiles through the center of R2 maps, dose uncertainty, and dose resolution obtained using the Philips 1.5 T MRI and ViewRay’s onboard 0.35 T MRI.
Figure 1.

The R2 maps obtained using SE (left column) and CPMG (right column) pulse sequences with NSA= 1 at 1.5 T (a and b), NSA= 1 at 0.35 T (c and d), NSA=16 at 0.35 T (e and f), NSA=16 and 3 × 3 mm2 pixel size at 0.35 T (g and h), and NSA=16 and denoised at 0.35 T (i and j).
Figure 2.

Lateral profiles through the center of R2 maps using SE (left column) and CPMG (right column) pulse sequences with NSA= 1 at 1.5 T (a and b), NSA= 1 at 0.35 T (c and d), NSA=16 at 0.35 T (e and f), NSA=16 and 3 × 3 mm2 pixel size at 0.35 T (g and h), and NSA=16 and denoised at 0.35 T (i and j).
Figure 3.
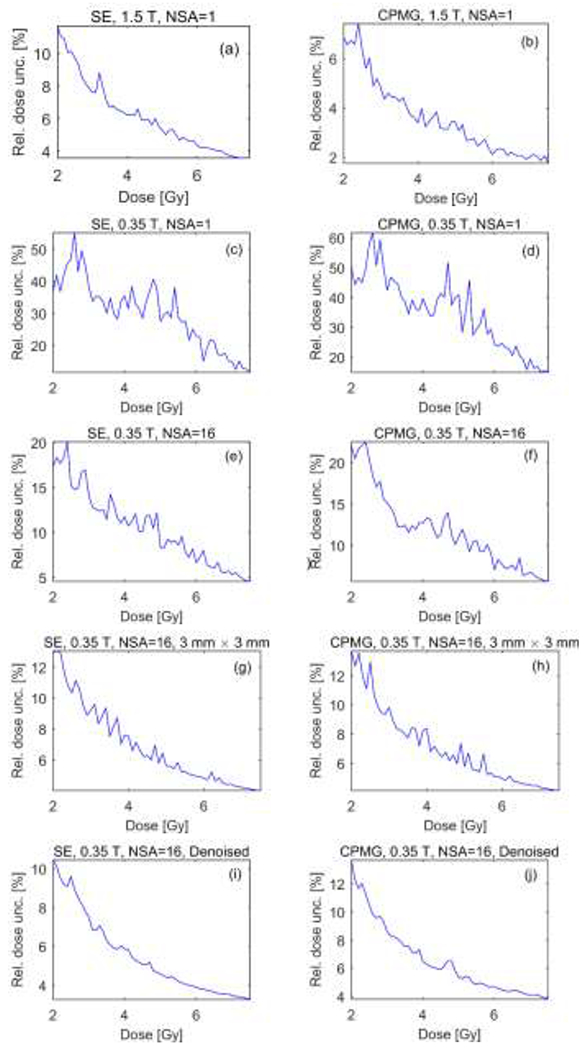
Relative dose uncertainty using SE (left column) and CPMG (right column) pulse sequences with NSA= 1 at 1.5 T (a and b), NSA= 1 at 0.35 T (c and d), NSA=16 at 0.35 T (e and f), NSA=16 and 3 × 3 mm2 pixel size at 0.35 T (g and h), and NSA=16 and denoised at 0.35 T (i and j).
Figure 4.

Dose resolution using SE (left column) and CPMG (right column) pulse sequences with NSA= 1 at 1.5 T (a and b), NSA= 1 at 0.35 T (c and d), NSA=16 at 0.35 T (e and f), NSA=16 and 3 × 3 mm2 pixel size at 0.35 T (g and h), and NSA=16 and denoised at 0.35 T (i and j).
As the dose was increased from 2 Gy to 7.5 Gy, the relative dose uncertainty decreased from 12% to 3.5% using the SE and from 7.4% to 1.7% using the CPMG pulse sequences on the 1.5 T scanner with NSA=1 and 1.5 × 1.5 mm2 pixel size. The mean of relative dose uncertainty was 6.2% and 3.6%, and the mean of dose resolution was 0.71 and 0.4 Gy using the SE and CPMG techniques, respectively. We attribute the decreased uncertainties using the CPMG versus SE sequence to the lower receiver bandwidth and the larger number of echoes for improved R2 fitting of the former. The measured R2 values were higher for the spin echo vs. CPMG sequences, consistent with previous studies (Maier et al., 2003). Measured T2 values depend on the type of pulse sequence (single-echo vs. multi-echo) and its parameters (e.g., ΔTE, RF pulse shapes, and crusher gradients) (Bankamp and Schad, 2003; Maier et al., 2003; Poon and Henkelman, 1992). The measured T2 values were consistent with the values expected by the vendor that range from 125 ms to 300 ms. Note that there are multiple parameters that can change the dose-R2 response such as concentration of chemical components, temperature during fabrication and oxygen concentration in the gel.
Figures 1–4 (c and d) show that reliable dosimetry is not feasible without signal averaging at low field. The dose uncertainty goes up to 55% and 60% with the mean values of 30% and 35% in the range of 2 to 7.5 Gy for the SE and CPMG sequences, respectively. The mean of dose resolution within the same dose range was 3.5 and 4.1 Gy for the SE and CPMG sequences, respectively. For one NSA at 0.35 T, we attribute the increased uncertainties using the CPMG versus SE sequence to the higher receiver bandwidth and the effects of high background noise on the longer echoes.
Increasing the NSA to 16 reduced the dose uncertainty and the dose resolution by a factor of ~3. The maximum uncertainty has dropped to 20% and 22%, the mean uncertainty has been reduced to 10% and 11%, and the mean dose resolution has been improved to 1.2 Gy and 1.4 Gy using the SE and CPMG techniques, respectively, at 0.35 T.
The combination of increasing the NSA to 16 with pixel averaging or denoising the R2 maps significantly reduced the noise in R2 maps obtained at 0.35 T. In the dose range of 2 Gy to 7.5 Gy the dose uncertainty decreased from 13% to 4% with NSA=16 and 3 × 3 mm2 pixel size and from 10.5% to 3.2% with NSA=16 and denoising with 1.5 × 1.5 mm2 pixel size using the SE pulse sequence. In the same dose range, by using the CPMG pulse sequence the dose uncertainty decreased from 13.7% to 4.1% with NSA=16 and 3 × 3 mm2 pixel size and from 13.7% to 3.8% with NSA=16 and denoising the R2 map with 1.5 × 1.5 mm2 pixel size. The mean of relative dose uncertainty was 6.8% and 5.5%, and the mean of dose resolution was 0.8 Gy and 0.64 Gy by downsampling and denoising the R2 map, respectively, using the SE sequence. The mean dose uncertainty was 7% and 6.5%, and the mean dose resolution was 0.83 and 0.75 Gy by downsampling and denoising the R2 map, respectively, using the CPMG sequence. The results suggest that the BM3D denoising algorithm is capable of removing the noise while preserving the image details. Denoising allowed improved dose resolution while preserving the high spatial resolution of 1.5 mm × 1.5 mm pixel size.
In principle, the signal to noise ratio can be represented by the equation:
where f represents the magnetization available from the pulse sequence, ρ is the proton density, T1 and T2 are the respective spin-lattice and spin-spin relaxation times, c represents the electronic losses (e.g., coil sensitivities, preamp losses, and cable attenuation), B0 is the magnetic field strength, V is the voxel volume, Nx and Ny are the numbers of frequency and phase encoding steps, respectively, NSA is the number of signal averages, and σ is the noise standard deviation. However, the noise contributions from the RF coils increase with lower field strengths (Wachowicz et al., 2016). In addition, the vendors use different post-processing and pulse sequence designs that may affect measured SNR, and by extension, dose uncertainties.
Taken together, comparable dose uncertainty and resolution were obtained using the ViewRay’s onboard 0.35 T and Philips 1.5 T MRI scanners when using SE and CPMG pulse sequences with NSA=16 and a pixel size of 3 × 3 mm2 or denoising the R2 maps at 1.5 × 1.5 mm2 pixel size. The results are consistent with those reported by Baldock et al. (Baldock et al., 1999) (Figure 1 in their paper). As pointed out in Baldock’s work, acceptable levels of uncertainty for gel dosimeters are currently unknown; however, dosimetry systems should measure the radiation dose with an uncertainty of 2% or better. It would seem that this would be difficult to achieve based on state-of-the-art gel formulations and MRI readout techniques. Despite relatively large uncertainty, gel dosimetry has been demonstrated useful in preforming dosimetry in 3D (Baldock et al., 2010; Low et al., 2011; Oldham et al., 1998a). In particular, the relatively low uncertainty at high doses (greater than 7 Gy) render it appropriate for experimental verification of ablative MRIgRT treatments. It should be noted that a true 3D dosimeter with even a voxel size of 3 × 3 × 5 mm3 provides a better spatial resolution or detector density compared to 2D or quasi- 3D chamber arrays such as MatriXX (IBA Dosimetry, Schwarzenbruck, Germany) and ArcCHECK (Sun Nuclear, Melbourne, FL, USA). Moreover, as opposed to BANG® gel dosimeter that must be produced and handled under oxygen-free conditions, MAGIC-gel dosimeter can be manufactured under normal atmosphere and can therefore be produced in a wet lab located in a radiation oncology clinic. Several groups demonstrate that setting up a 3D dosimetry program in a clinical department using in-house or inexpensive MAGIC-gel dosimeters is feasible (Gustavsson et al., 2003; Crescenti et al., 2007). Gustavsson et al. reported excellent agreements between the calculated and measured mean relative doses in both the planning target volume and the organ-at-risk. Remarkably, they reported that the gamma criterion (3 mm spatial/3% dose deviation) was fulfilled for 94% of the pixels in the target region. On the other hand, the main disadvantage of performing MRI dosimetry at low field is clearly the very long acquisition times associated with signal averaging. Therefore, gel dosimetry using ViewRay’s on board 0.35 T MRI system may serve as a useful 3D dosimetry tool for end-to-end testing during system acceptance, commissioning, software/hardware upgrades and subsequent periodic QAs, but may encounter logistic issues for patient specific QA. The ViewRay MRIdian uses a horizontal static magnetic field orientation. Given the same field strength, SNR may improve on a system with a vertical field orientation using cylindrical (e.g., solenoidal) receive coils (Su et al., 2002). Future work remains in regard to gel materials and scanning techniques improvements.
4. Conclusion
We demonstrate that MRI-based gel dosimetry can be performed at low field using signal averaging with either denoising or downsampling. Comparable dose uncertainty and resolution were obtained on BANG® polymer gel dosimeter using ViewRay’s onboard 0.35 T MRI system with signal averaging and either denoising or downsampling compared to 1.5 T without signal averaging. The findings of this study show that the low-field onboard MRI scanner could potentially be an alternative to high field MRI scanners and can be used with no additional logistics/setup uncertainty/cost, since it is integrated with the dose delivery radiation sources. This may render the availability issue of MRI scanners for the readout of gel dosimeters much less of a concern. Moreover, the proposed ongoing research may open up a new research avenue in terms of in situ 3D MRI gel dosimetry.
References
- Acharya S, Fischer-Valuck BW, Kashani R, Parikh P, Yang D, Zhao T, Green O, Wooten O, Li H, Hu Y, Rodriguez V, Olsen L, Robinson C, Michalski J, Mutic S and Olsen J 2016. Online Magnetic Resonance Image Guided Adaptive Radiation Therapy: First Clinical Applications Int J Radiat Oncol Biol Phys 94 394–403 [DOI] [PubMed] [Google Scholar]
- Baldock C, De Deene Y, Doran S, Ibbott G, Jirasek A, Lepage M, McAuley KB, Oldham M and Schreiner LJ 2010. Polymer gel dosimetry Phys Med Biol 55 R1–63 [DOI] [PMC free article] [PubMed] [Google Scholar]
- Baldock C, Lepage M, Back SA, Murry PJ, Jayasekera PM, Porter D and Kron T 2001. Dose resolution in radiotherapy polymer gel dosimetry: effect of echo spacing in MRI pulse sequence Phys Med Biol 46 449–60 [DOI] [PubMed] [Google Scholar]
- Baldock C, Murry P and Kron T 1999. Uncertainty analysis in polymer gel dosimetry Phys Med Biol 44 N243–6 [DOI] [PubMed] [Google Scholar]
- Bankamp A and Schad LR 2003. Comparison of TSE, TGSE, and CPMG measurement techniques for MR polymer gel dosimetry Magn. Reson. Imaging 21 929–39 [DOI] [PubMed] [Google Scholar]
- Crescenti RA, Scheib SG, Schneider U and Gianolini S 2007. Introducing gel dosimetry in a clinical environment: customization of polymer gel composition and magnetic resonance imaging parameters used for 3D dose verifications in radiosurgery and intensity modulated radiotherapy Med Phys 34 1286–97 [DOI] [PubMed] [Google Scholar]
- Dabov K, Foi A, Katkovnik V and Egiazarian K 2007. Image denoising by sparse 3-D transform-domain collaborative filtering IEEE Trans Image Process 16 2080–95 [DOI] [PubMed] [Google Scholar]
- De Deene Y and Baldock C 2002. Optimization of multiple spin-echo sequences for 3D polymer gel dosimetry Phys Med Biol 47 3117–41 [DOI] [PubMed] [Google Scholar]
- Eksioglu EM 2016. Decoupled Algorithm for MRI Reconstruction Using Nonlocal Block Matching Model: BM3D-MRI J Math Imaging Vis 56 430–40 [Google Scholar]
- Green OL, Rankine LJ, Cai B, Curcuru A, Kashani R, Rodriguez V, Li HH, Parikh PJ, Robinson CG, Olsen JR, Mutic S, Goddu SM and Santanam L 2018. First clinical implementation of real-time, real anatomy tracking and radiation beam control Med Phys [DOI] [PubMed] [Google Scholar]
- Gustavsson H, Karlsson A, Back SA, Olsson LE, Haraldsson P, Engstrom P and Nystrom H 2003. MAGIC-type polymer gel for three-dimensional dosimetry: intensity-modulated radiation therapy verification Med Phys 30 1264–71 [DOI] [PubMed] [Google Scholar]
- Lagendijk JJ, Raaymakers BW, Van den Berg CA, Moerland MA, Philippens ME and van Vulpen M 2014. MR guidance in radiotherapy Phys. Med. Biol 59 R349–69 [DOI] [PubMed] [Google Scholar]
- Lee HJ, Roed Y, Venkataraman S, Carroll M and Ibbott GS 2017. Investigation of magnetic field effects on the dose-response of 3D dosimeters for magnetic resonance - image guided radiation therapy applications Radiother Oncol 125 426–32 [DOI] [PubMed] [Google Scholar]
- Li H, Rodriguez VL, Green OL, Hu Y, Kashani R, Wooten HO, Yang D and Mutic S 2015. Patient-Specific Quality Assurance for the Delivery of Co Intensity Modulated Radiation Therapy Subject to a 0.35-T Lateral Magnetic Field Int J Radiat Oncol Biol Phys 1 65–72 [DOI] [PMC free article] [PubMed] [Google Scholar]
- Low DA, Moran JM, Dempsey JF, Dong L and Oldham M 2011. Dosimetry tools and techniques for IMRT Med Phys 38 1313–38 [DOI] [PubMed] [Google Scholar]
- Maier CF, Tan SG, Hariharan H and Potter HG 2003. T2 quantitation of articular cartilage at 1.5 T J. Magn. Reson. Imaging 17 358–64 [DOI] [PubMed] [Google Scholar]
- Mazur TR, Fischer-Valuck BW, Wang Y, Yang D, Mutic S and Li HH 2016. SIFT-based dense pixel tracking on 0.35 T cine-MR images acquired during image-guided radiation therapy with application to gating optimization Med Phys 43 279–93 [DOI] [PubMed] [Google Scholar]
- Oldham M, Baustert I, Lord C, Smith TA, McJury M, Warrington AP, Leach MO and Webb S 1998a. An investigation into the dosimetry of a nine-field tomotherapy irradiation using BANG-gel dosimetry Phys Med Biol 43 1113–32 [DOI] [PubMed] [Google Scholar]
- Oldham M, McJury M, Baustert IB, Webb S and Leach MO 1998b. Improving calibration accuracy in gel dosimetry Phys Med Biol 43 2709–20 [DOI] [PubMed] [Google Scholar]
- Oldham M, Siewerdsen JH, Shetty A and Jaffray DA 2001. High resolution gel-dosimetry by optical-CT and MR scanning Med Phys 28 1436–45 [DOI] [PubMed] [Google Scholar]
- Poon CS and Henkelman RM 1992. Practical T2 quantitation for clinical applications J. Magn. Reson. Imaging 2 541–53 [DOI] [PubMed] [Google Scholar]
- Raaijmakers AJ, Raaymakers BW and Lagendijk JJ 2008. Magnetic-field-induced dose effects in MR-guided radiotherapy systems: dependence on the magnetic field strength Phys. Med. Biol 53 909–23 [DOI] [PubMed] [Google Scholar]
- Ramm U, Weber U, Bock M, Kramer M, Bankamp A, Damrau M, Thilmann C, Bottcher HD, Schad LR and Kraft G 2000. Three-dimensional BANG gel dosimetry in conformal carbon ion radiotherapy Phys Med Biol 45 N95–102 [DOI] [PubMed] [Google Scholar]
- Rankine LJ, Mein S, Cai B, Curcuru A, Juang T, Miles D, Mutic S, Wang Y, Oldham M and Li H 2017. Three-dimensional dosimetric validation of a magnetic resonance-guided intensity modulated radiation therapy System Int J Radiat Oncol Biol Phys 97 1095–104 [DOI] [PubMed] [Google Scholar]
- Silveira MA, Pavoni JF and Baffa O 2017. Three-dimensional quality assurance of IMRT prostate plans using gel dosimetry Physica medica : PM : an international journal devoted to the applications of physics to medicine and biology : official journal of the Italian Association of Biomedical Physics 34 1–6 [DOI] [PubMed] [Google Scholar]
- Su S, Zou MX and Murphy-Boesch J 2002. Solenoidal array coils Magn. Reson. Med 47 794–9 [DOI] [PubMed] [Google Scholar]
- Wachowicz K, De Zanche N, Yip E, Volotovskyy V and Fallone BG 2016. CNR considerations for rapid real-time MRI tumor tracking in radiotherapy hybrid devices: Effects of B0 field strength Med. Phys 43 4903. [DOI] [PubMed] [Google Scholar]
- Wang Y, Mazur TR, Green O, Hu Y, Li H, Rodriguez V, Wooten HO, Yang D, Zhao T, Mutic S and Li H 2016. A GPU-accelerated Monte Carlo dose calculation platform and its application toward validating an MRI-guided radiation therapy beam model Med Phys 43 4040–52 [DOI] [PMC free article] [PubMed] [Google Scholar]