

Abstract
Systematic prostate biopsy has limitations, such as overdiagnosis of clinically insignificant prostate cancer and underdiagnosis of clinically significant prostate cancer. Magnetic resonance imaging (MRI)-guided biopsy, a promising alternative, might improve diagnostic accuracy. To compare the cancer detection rates of systematic biopsy and combined biopsy (systematic biopsy plus MRI-targeted biopsy) in Asian men, we conducted a retrospective cohort study of men who underwent either systematic biopsy or combined biopsy at two medical centers (Queen Mary Hospital and Tung Wah Hospital, Hong Kong, China) from July 2015 to December 2022. Descriptive statistics were calculated, and univariate and multivariate logistic regression analyses were performed. The primary and secondary outcomes were prostate cancer and clinically significant prostate cancer. A total of 1391 participants were enrolled. The overall prostate cancer detection rates did not significantly differ between the two groups (36.3% vs 36.6%, odds ratio [OR] = 1.01, 95% confidence interval [CI]: 0.81–1.26, P = 0.92). However, combined biopsy showed a significant advantage in detecting clinically significant prostate cancer (Gleason score ≥ 3+4) in patients with a total serum prostate-specific antigen (tPSA) concentration of 2–10 ng ml−1 (systematic vs combined: 11.9% vs 17.5%, OR = 1.58, 95% CI: 1.08–2.31, P = 0.02). Specifically, in the transperineal biopsy subgroup, combined biopsy significantly outperformed systematic biopsy in the detection of clinically significant prostate cancer (systematic vs combined: 12.6% vs 24.0%, OR = 2.19, 95% CI: 1.21–3.97, P = 0.01). These findings suggest that in patients with a tPSA concentration of 2–10 ng ml−1, MRI-targeted biopsy may be of greater predictive value than systematic biopsy in the detection of clinically significant prostate cancer.
Keywords: clinically significant prostate cancer, combined biopsy, prostate cancer, systematic biopsy, transperineal biopsy
INTRODUCTION
Prostate cancer (PCa) is the most common cancer in men in the USA, and its diagnosis is highly dependent on prostate biopsies.1 Since the early 1990s, transrectal ultrasound (TRUS)-guided biopsies have been the standard procedure for obtaining tissue samples from the prostate.2 However, this method has limitations, including inadequate visualization of the target, underdiagnosis of clinically significant prostate cancer (csPCa), overdiagnosis of clinically insignificant prostate cancer, and a risk of infection.3,4,5,6
To overcome these challenges, magnetic resonance imaging (MRI)-guided prostate biopsy has emerged as a promising alternative for the accurate diagnosis and treatment of PCa.7 MRI-guided prostate biopsy combines the high-resolution imaging capabilities of MRI with real-time needle guidance, allowing more precise targeting of suspicious areas within the prostate.8 Several studies have demonstrated the clinical utility of MRI-guided prostate biopsy for improving clinically significant cancer detection rates and treatment decision-making.3,4,9 Siddiqui et al.4 showed that targeted biopsy via MRI identified more csPCa cases than standard TRUS-guided biopsy. Similarly, Kasivisvanathan et al.3 reported that MRI-targeted biopsies had higher cancer detection rates and reduced detection of low-grade tumors. However, some studies have reported conflicting findings.10,11 Radtke et al.10 demonstrated that MRI-targeted biopsy had no superior ability to detect csPCa compared to systematic transperineal biopsy. Rouvière et al.11 reported no difference between systematic biopsy and targeted biopsy in detecting csPCa. Despite the potential benefits of MRI-guided prostate biopsy, challenges remain, such as standardizing protocols, improving accessibility, and training radiologists in image interpretation and biopsy techniques.12
Given that the clinical utility of MRI-targeted biopsy for the detection of PCa still remains controversial, we conducted the present study to compare systematic biopsy with combined biopsy (systematic biopsy plus MRI-targeted biopsy) in a cohort of Asian men.
PARTICIPANTS AND METHODS
Study population
In this retrospective, observational study, men who attended the urology department of Queen Mary Hospital or Tung Wah Hospital (Hong Kong, China) from July 2015 to December 2022 were recruited for the present study. The indications for biopsy were as follows: (1) elevated serum prostate-specific antigen (PSA, ≥3 ng ml−1); (2) abnormal digital rectal examination; (3) abnormalities on prostate imaging (ultrasound or MRI); and (4) monitoring of prostate cancer (patients opt for active surveillance). Patients who underwent at least one biopsy method (either systematic biopsy or MRI-targeted biopsy) were included in the study. The exclusion criteria included the following: (1) previous treatment for prostate cancer; (2) lack of pathological biopsy results (biopsy cores and consequential Gleason score); or (3) conflicting pathological biopsy results. The primary and secondary outcomes were the detection of prostate cancer and csPCa (defined as the presence of a single biopsy core indicating disease with a Gleason score ≥ 3 + 4). The study was approved by the Institutional Review Board of each hospital (Institutional Review Board of the University of Hong Kong/Hospital Authority Hong Kong West Cluster, Hong Kong, China, Approval No. UW20-462), and written informed consent was obtained from each participant.
Biopsy method
Most systematic biopsies were performed via the transrectal (TR) route, retrieving 12 cores. Based on the prostate size, 3 to 4 cores were collected from each Ginsburg region. Subsequently, for patients with a Prostate Imaging Reporting and Data System (PI-RADS) score of 3 or higher, fusion biopsies were performed using the Artemis 3D Semi-Robotic Prostate Fusion Biopsy System (Eigen, Grass Valley, CA, USA). For each target lesion identified, 3 to 5 cores were extracted.
Statistical analyses
Descriptive statistics are presented as medians and interquartile ranges for continuous variables or as numbers and percentages for binary variables. The Chi-square test and univariate and multivariate logistic regression analyses were used to compare combined biopsy and systematic biopsy. A two-sided P < 0.05 was considered to indicate statistical significance. All the data analyses were performed using the Statistical Package for the Social Sciences (SPSS version 26; IBM Corporation, Armonk, NY, USA).
RESULTS
Study population
From July 2015 to December 2022, 1377 participants were ultimately included in our study. We categorized the patients into two groups based on the biopsy method used: standard systematic biopsy (n = 765) and combined biopsy (612 men who underwent both standard systematic biopsy and MRI-targeted biopsy), as shown in Figure 1. The clinicopathologic data of this cohort are shown in Table 1. The median age and total PSA concentration of the PCa patients were 70 years and 9.5 ng ml−1, while those of the non-PCa patients were 67 years and 7.1 ng ml−1.
Figure 1.
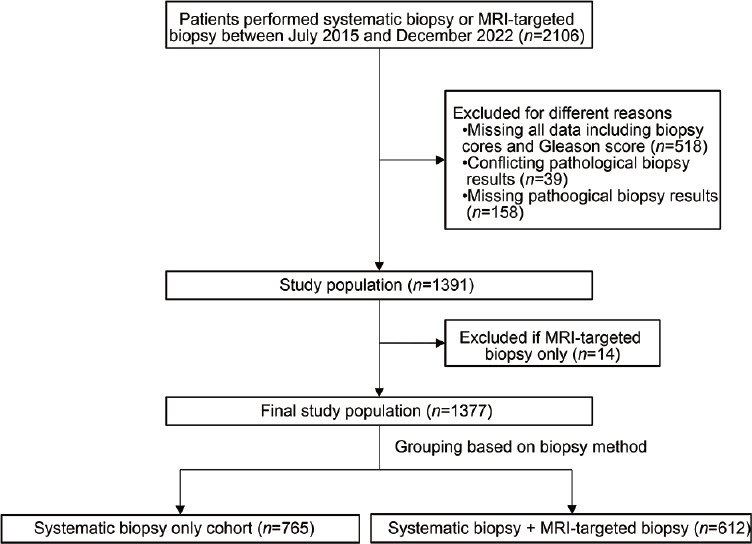
Flowchart showing the inclusion and exclusion of the study cohort. MRI: magnetic resonance imaging.
Table 1.
Clinicopathological characteristics in the study cohort
| Characteristic | Entire cohort | PCa | Non-PCa |
|---|---|---|---|
| Patients, n (%) | 1377 (100.0) | 502 (36.5) | 875 (63.5) |
| Age (year), median (IQR) | 68 (63–72) | 70 (66–74) | 67 (62–71) |
| Initial biopsy, n (%) | 1061 (77.1) | 420 (83.7) | 641 (73.3) |
| Biopsy route, n (%) | |||
| TP | 499 (36.2) | 219 (43.6) | 280 (32.0) |
| TR | 877 (63.7) | 282 (56.2) | 595 (68.0) |
| Missinga | 1 (0.1) | 1 (0.2) | 0 |
| Method, n (%) | |||
| Systematic biopsy only | 765 (55.6) | 278 (55.4) | 487 (55.7) |
| Combined biopsyb | 612 (44.4) | 224 (44.6) | 388 (44.3) |
| Prostate volume (ml), median (IQR) | |||
| By TRUS | 47.91 (34.60–66.00) | 39.40 (29.00–56.13) | 52.30 (39.00–70.00) |
| By MRI | 57.45 (39.90–77.82) | 45.28 (32.85–67.35) | 62.20 (43.80–81.80) |
| Total PSA (ng ml−1), median (IQR) | 7.80 (5.40–12.03) | 9.50 (6.20–16.20) | 7.10 (5.20–11.00) |
| PHI, median (IQR) | 32.40 (24.20–42.70) | 43.05 (32.35–59.40) | 28.80 (22.60–36.50) |
| Total cores (n), median (IQR) | 12 (12–23) | 12 (12–24) | 12 (12–21) |
| Positive cores (n), median (IQR) | 0 (0–2) | 4 (1–8) | 0 (0–0) |
aMissing: raw data missing. bCombined biopsy: systematic biopsy + MRI-targeted biopsy. PCa: prostate cancer; TRUS: transrectal ultrasound; MRI: magnetic resonance imaging; PSA: prostate-specific antigen; PHI: prostate health index; TP: transperineum biopsy; TR: transrectum biopsy; IQR: interquartile range
Biopsy outcomes
In the overall cohort, 278 of the 765 participants (36.3%) in the systematic biopsy group were diagnosed with PCa, whereas 224 of the 612 participants (36.6%) in the combined biopsy group were diagnosed with PCa (odds ratio [OR] = 1.01; 95% confidence interval [CI]: 0.81–1.26; P = 0.92; Figure 2a). csPCa was detected in 164 of the 765 participants (21.4%) in the systematic biopsy group compared with 144 of the 612 participants (23.5%) in the combined biopsy group (P = 0.35; Supplementary Figure 1a (431KB, tif) ). Further analyses revealed a significant difference in the transperineal biopsy (TP) subgroup in terms of the detection rate between systematic biopsy and combined biopsy (20.0% vs 27.6%; OR = 1.53; 95% CI: 1.01–2.31; P = 0.05), while no significant difference was found in the transrectal biopsy (TR) subgroup (22.0% vs 20.9%; OR = 0.94; 95% CI: 0.68–1.30; P = 0.69; Supplementary Figure 1a (431KB, tif) ).
Figure 2.
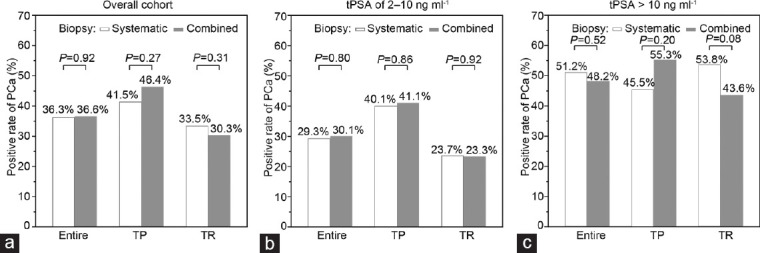
Positive rates of prostate cancer in different subgroups. (a) Positive rates of prostate cancer in the overall cohort, TP subgroup, and TR subgroup. (b) Positive rates of prostate cancer in men with tPSA of 2–10 ng ml−1, TP subgroup, and TR subgroup. (c) Positive rates of prostate cancer in men with tPSA >10 ng ml−1, TP subgroup, and TR subgroup. PCa: prostate cancer; TP: transperineum biopsy; TR: transrectum biopsy. tPSA: total prostate-specific antigen.
Subgroup analyses (baseline characteristics are shown in Supplementary Table 1) revealed that in men with a tPSA level of 2–10 ng ml−1, 143 of 488 participants (29.3%) were diagnosed with PCa in the systematic biopsy group, whereas 115 of 382 participants (30.1%) were diagnosed with PCa in the combined biopsy group (OR = 1.04, 95% CI: 0.78–1.39; P = 0.80; Figure 2b). In men with a tPSA level exceeding 10 ng ml−1, 133 of 260 participants (51.2%) were diagnosed with PCa in the systematic biopsy group, whereas 105 of 218 participants (48.2%) were diagnosed with PCa in the combined biopsy group (OR = 0.89, 95% CI: 0.62–1.27; P = 0.52; Figure 2c and Supplementary Table 2). Multivariate logistic regression analyses of the two groups revealed similar detection rates after adjusting for age, PSA concentration, and total number of biopsy cores (OR = 0.93, 95% CI: 0.68–1.27; P = 0.64; Table 2). CsPCa was detected in 58 of the 488 participants (11.9%) in the systematic biopsy group. The detection rate in the combined biopsy group was significantly greater (67 of 382 participants, 17.5%, OR = 1.58, 95% CI: 1.08–2.31, P = 0.02; Supplementary Figure 1b (431KB, tif) ). However, this difference became nonsignificant after multivariate adjustment (OR = 1.38, 95% CI: 0.92–2.07, P = 0.12). There is no significant difference in positive rates of csPCa among patients withe tPSA > 10 ng ml-1 (Supplementary Figure 1c (431KB, tif) ).
Supplementary Table 1.
Clinicopathological characteristics in the study cohort in patients with total prostate-specific antigen 2–10 ng ml−1
| Characteristics | Entire cohort | PCa | Non-PCa |
|---|---|---|---|
| Number of patients (%) | 870 | 258 | 612 |
| Age (years), median (IQR) | 67 (62–71) | 69 (65–73) | 66 (62–70) |
| Prostate volume (ml), median (IQR) | |||
| By TRUS | 46.70 (35.51–62.20) | 39.10 (29.00–53.75) | 49.43 (38.00–64.45) |
| By MRI | 55.41 (39.00–72.02) | 45.60 (32.70–64.10) | 58.56 (42.55–73.25) |
| Total PSA (ng/ml) | 6.20 (4.90–7.70) | 6.34 (5.00–8.00) | 6.10 (4.90–7.60) |
| PHI | 31.50 (24.00–40.28) | 40.50 (29.60–54.38) | 28.30 (22.30–35.78) |
| Number of initial biopsy (%) | 697 (80.1) | 217 (84.1) | 480 (78.4) |
| Total cores, median (IQR) | 12 (12–22) | 16 (12–24) | 12 (12–21) |
| Positive cores, median (IQR) | 0 (0–1) | 3 (1–6) | 0 (0–0) |
| Biopsy route, n (%) | |||
| TP/1 | 313 (36.0) | 127 (49.2) | 186 (30.4) |
| TR/0 | 557 (64.0) | 131 (50.8) | 426 (69.6) |
| Method, n (%) | |||
| Systematic biopsy only | 488 (56.1) | 143 (55.4) | 345 (56.4) |
| Systematic + MRI-targeted biopsy | 382 (43.9) | 115 (44.6) | 267 (43.6) |
PCa: prostate cancer; TRUS: endorectal ultrasound; MRI: magnetic resonance imaging; PSA: prostate-specific antigen; PHI: Prostate Health Index; TP: transperineum biopsy; TR: transrectum biopsy; IQR: interquartile ranges
Supplementary Table 2.
Univariable and multivariable logistic regression analyses for prediction of prostate cancer/clinically significant prostate cancer in patients with total prostate-specific antigen >10 ng ml−1
| Predictor | Univariable analysis | Multivariable analysis | |||
|---|---|---|---|---|---|
|
|
|
||||
| OR (95% CI) | P | aOR (95% CI) | P | ||
| PCa vs non-PCa | Age | 1.06 (1.03–1.09) | 2.28×10⁻⁴ | 1.05 (1.02–1.08) | 2.82×10⁻³ |
| PSA | 1.04 (1.02–1.06) | 8.30×10⁻⁵ | 1.03 (1.01–1.05) | 1.11×10⁻³ | |
| Total cores | 1.01 (0.99–1.03) | 0.55 | 1.02 (0.99–1.04) | 0.14 | |
| Biopsy method | |||||
| System only | 1.00 (reference) | 1.00 (reference) | |||
| System + target | 0.89 (0.62–1.27) | 0.52 | 1.07 (0.72–1.58) | 0.74 | |
| Significant PCa vs others | Age | 1.06 (1.03–1.09) | 3.76×10⁻⁴ | 1.05 (1.02–1.08) | 2.89×10⁻³ |
| PSA | 1.03 (1.01–1.04) | 1.12×10⁻³ | 1.02 (1.01–1.04) | 0.01 | |
| Total cores | 0.99 (0.97–1.01) | 0.24 | 1.00 (0.98–1.02) | 0.91 | |
| Biopsy method | |||||
| System only | 1.00 (reference) | 1.00 (reference) | |||
| System + target | 0.77 (0.53–1.13) | 0.18 | 0.91 (0.60–1.36) | 0.63 | |
| GG≥3 PCa vs others | Age | 1.06 (1.02–1.09) | 8.63×10⁻⁴ | 1.04 (1.01–1.08) | 0.02 |
| PSA | 1.04 (1.02–1.05) | 2.10×10⁻⁵ | 1.03 (1.01–1.05) | 1.01×10⁻³ | |
| Total cores | 0.98 (0.96–1.01) | 0.13 | 1.00 (0.97–1.02) | 0.75 | |
| Biopsy method | |||||
| System only | 1.00 (reference) | 1.00 (reference) | |||
| System + target | 0.57 (0.38–0.86) | 0.01 | 0.65 (0.41–1.02) | 0.06 | |
PCa: prostate cancer; PSA: prostate-specific antigen; GG: Gleason grade group; OR: odds ratio; aOR: adjusted OR; CI: confidence interval
Table 2.
Univariable and multivariable logistic regression analyses for prediction of prostate cancer/clinically significant prostate cancer in patients with total prostate-specific antigen of 2–10 ng ml−1
| Outcome | Predictor | Univariable analysis | Multivariable analysis | ||
|---|---|---|---|---|---|
|
|
|
||||
| OR (95% CI) | P | aOR (95% CI) | P | ||
| PCa vs non-PCa | Age | 1.08 (1.05–1.11) | <0.001 | 1.08 (1.05–1.11) | <0.001 |
| PSA | 1.06 (0.98–1.15) | 0.13 | 1.06 (0.97–1.15) | 0.21 | |
| Total cores | 1.03 (1.02–1.05) | <0.001 | 1.05 (1.03–1.07) | <0.001 | |
| Biopsy method | |||||
| Systematic biopsy | 1.00 (reference) | 1.00 (reference) | |||
| Combined biopsya | 1.04 (0.78–1.39) | 0.80 | 0.93 (0.68–1.27) | 0.64 | |
| CsPCa vs others | Age | 1.08 (1.04–1.11) | <0.001 | 1.08 (1.04–1.11) | <0.001 |
| PSA | 1.09 (0.98–1.20) | 0.12 | 1.05 (0.95–1.17) | 0.34 | |
| Total cores | 1.02 (1.00–1.04) | 0.07 | 1.04 (1.02–1.06) | 0.00108 | |
| Biopsy method | |||||
| Systematic biopsy | 1.00 (reference) | 1.00 (reference) | |||
| Combined biopsya | 1.58 (1.08–2.31) | 0.02 | 1.38 (0.92–2.07) | 0.12 | |
| GG ≥3 PCa vs others | Age | 1.08 (1.04–1.13) | <0.001 | 1.08 (1.03–1.13) | <0.001 |
| PSA | 1.16 (1.01–1.33) | 0.03 | 1.14 (0.99–1.31) | 0.07 | |
| Total cores | 1.03 (1.00–1.06) | 0.06 | 1.04 (1.01–1.07) | 0.01 | |
| Biopsy method | |||||
| Systematic biopsy | 1.00 (reference) | 1.00 (reference) | |||
| Combined biopsya | 1.08 (0.66–1.77) | 0.77 | 0.95 (0.56–1.60) | 0.84 | |
aCombined biopsy: systematic biopsy + MRI-targeted biopsy. PCa: prostate cancer; csPCa: clinically significant prostate cancer; GG: Gleason grade group; OR: odds ratio; aOR: adjusted OR; CI: confidence interval; MRI: magnetic resonance imaging; PSA: prostate-specific antigen
We further focused on the subgroup of patients with a tPSA concentration of 2–10 ng ml−1 who underwent systematic or combined TP biopsy (Table 3). Univariate analyses revealed that combined biopsy outperformed systematic biopsy in this subgroup for csPCa detection (OR = 2.19, 95% CI: 1.21–3.97, P = 0.01; Table 3 and Supplementary Figure 1b (431KB, tif) ). Multivariate regression analyses revealed similar significant results (OR = 2.50, 95% CI: 1.34–4.67, P = 0.004; Table 3). However, no significant results were found in patients receiving transrectal biopsy (Supplementary Table 3). The positive rates of GG≥3 prostate cancer in different subgroups are shown in Supplementary Figure 2 (411KB, tif) .
Table 3.
Univariable and multivariable logistic regression analyses for prediction of prostate cancer/clinically significant prostate cancer in patients with total prostate-specific antigen of 2–10 ng ml−1 receiving transperineum biopsy
| Outcome | Predictor | Univariable analysis | Multivariable analysis | ||
|---|---|---|---|---|---|
|
|
|
||||
| OR (95% CI) | P | aOR (95% CI) | P | ||
| PCa vs non-PCa | Age | 1.07 (1.02–1.11) | 0.003 | 1.07 (1.02–1.11) | 0.003 |
| PSA | 1.04 (0.92–1.18) | 0.49 | 1.05 (0.92–1.19) | 0.48 | |
| Total cores | 0.98 (0.95–1.02) | 0.38 | 0.99 (0.95–1.03) | 0.66 | |
| Biopsy method | |||||
| Systematic biopsy | 1.00 (reference) | 1.0 0 (reference) | |||
| Combined biopsya | 1.04 (0.66–1.64) | 0.86 | 1.02 (0.63–1.65) | 0.95 | |
| CsPCa vs others | Age | 1.07 (1.02–1.13) | 0.01 | 1.07 (1.02–1.13) | 0.01 |
| PSA | 1.11 (0.95–1.30) | 0.17 | 1.11 (0.94–1.31) | 0.21 | |
| Total cores | 0.98 (0.94–1.03) | 0.43 | 0.96 (0.91–1.00) | 0.07 | |
| Biopsy method | |||||
| Systematic biopsy | 1.00 (reference) | 1.00 (reference) | |||
| Combined biopsya | 2.19 (1.21–3.97) | 0.01 | 2.50 (1.34–4.67) | 0.004 | |
| GG ≥3 PCa vs others | Age | 1.12 (1.04–1.21) | 0.003 | 1.12 (1.04–1.21) | 0.003 |
| PSA | 1.13 (0.92–1.40) | 0.24 | 1.14 (0.92–1.41) | 0.23 | |
| Total cores | 0.99 (0.93–1.05) | 0.73 | 0.98 (0.92–1.04) | 0.42 | |
| Biopsy method | |||||
| Systematic biopsy | 1.00 (reference) | 1.00 (reference) | |||
| Combined biopsya | 1.36 (0.62–2.95) | 0.44 | 1.40 (0.62–3.14) | 0.42 | |
aCombined biopsy: systematic biopsy + MRI-targeted biopsy. PCa: prostate cancer; csPCa: clinically significant prostate cancer; GG: Gleason grade group; OR: odds ratio; aOR: adjusted OR; CI: confidence interval; MRI: magnetic resonance imaging; PSA: prostate-specific antigen
Supplementary Table 3.
Univariable and multivariable logistic regression analyses for prediction of prostate cancer/clinically significant prostate cancer in patients with total prostate-specific antigen 2–10 ng ml−1 receiving transrectal biopsy
| Predictor | Univariable analysis | Multivariable analysis | |||
|---|---|---|---|---|---|
|
|
|
||||
| OR (95% CI) | P | aOR (95% CI) | P | ||
| PCa vs non-PCa | Age | 1.10 (1.06–1.14) | 3.88×10⁻⁷ | 1.09 (1.05–1.13) | 1×10⁻⁶ |
| PSA | 1.10 (0.99–1.23) | 0.07 | 1.08 (0.97–1.21) | 0.17 | |
| Total cores | 1.01 (0.97–1.05) | 0.60 | 1.04 (0.99–1.08) | 0.14 | |
| Biopsy method | |||||
| System only | 1.00 (reference) | 1.00 (reference) | |||
| System + target | 0.98 (0.66–1.46) | 0.92 | 0.89 (0.57–1.40) | 0.62 | |
| Significant PCa vs others | Age | 1.08 (1.03–1.13) | 7.53×10⁻⁴ | 1.07 (1.03–1.13) | 2.38×10⁻³ |
| PSA | 1.08 (0.94–1.23) | 0.30 | 1.06 (0.92–1.23) | 0.43 | |
| Total cores | 1.03 (0.98–1.09) | 0.23 | 1.11 (1.04–1.18) | 1.01×10⁻³ | |
| Biopsy method | |||||
| System only | 1.00 (reference) | 1.00 (reference) | |||
| System + target | 1.20 (0.73–2.00) | 0.47 | 1.04 (0.59–1.84) | 0.89 | |
| GG≥3 PCa vs others | Age | 1.06 (1.01–1.12) | 0.03 | 1.05 (0.99–1.11) | 0.09 |
| PSA | 1.18 (0.99–1.41) | 0.06 | 1.20 (1.00–1.44) | 0.05 | |
| Total cores | 1.11 (1.04–1.20) | 3.16×10⁻³ | 1.19 (1.09–1.30) | 1.44×10⁻⁴ | |
| Biopsy method | |||||
| System only | 1.00 (reference) | 1.00 (reference) | |||
| System + target | 0.90 (0.47–1.74) | 0.75 | 0.80 (0.38–1.71) | 0.57 | |
PCa: prostate cancer; PSA: prostate-specific antigen; GG: Gleason grade group; OR: odds ratio; aOR: adjusted OR; CI: confidence interval
DISCUSSION
The aim of our study was to evaluate the diagnostic efficacy of combined biopsy (fusion biopsy plus systematic biopsy) compared to standard systematic biopsy for the detection of prostate cancer, focusing on clinically significant cases. Our results showed that the overall prostate cancer detection rates were not significantly different between the two biopsy methods, which is consistent with the findings of some previous studies.13,14 These studies showed ORs of 1.27 (95% CI: 0.98–1.67, P = 0.08) for patients without prior cancer diagnosis and 1.43 (95% CI: 0.76–2.66, P = 0.27) for biopsy-naïve patients.13,14 However, the key finding of our study was the significant advantage of combined biopsy in detecting csPCa among men with a tPSA concentration of 2–10 ng ml−1 who underwent TP biopsy.
The greater detection rate of csPCa with combined biopsy is consistent with recent studies that have highlighted the potential benefits of incorporating MRI into biopsy procedures.3,4,8,9 This advantage is particularly evident in the TP subgroup, in which combined biopsy outperformed standard systematic biopsy. The transperineal approach is known to provide better access to the anterior prostate, making it more suitable for targeting clinically significant tumors.15,16,17,18 Emiliozzi et al.15 conducted a study revealing that out of 43 diagnosed cancers, 41 (95%) were diagnosed via the transperineal approach, while 34 (79%) were diagnosed via the transrectal approach (P = 0.012). In our study, TP demonstrated consistently greater detection rates than TR for both systematic and combined biopsy approaches.
The lack of a significant difference in overall prostate cancer detection rates between the two biopsy methods might be due to several factors, including the experience of the operators, the quality of the MRI images, and the specific protocol employed for combined biopsy.7,19 Moreover, the relatively small number of participants in the MRI-targeted biopsy group may have influenced the overall comparison.
Our study provides clinicians and researchers with valuable insights for informing decisions regarding biopsy strategies. The significant advantage of combined biopsy for detecting csPCa suggests its potential in guiding treatment decisions, reducing unnecessary biopsies, and improving patient outcomes.8,9,20,21
However, there are several limitations in our study that should be noted. First, the retrospective design may have introduced selection bias, although we attempted to minimize this bias by using the stringent inclusion and exclusion criteria. Second, the relatively small number of participants in the MRI-targeted biopsy group (fusion biopsy only) limited direct comparisons of this method with standard systematic biopsy. Further studies with larger sample sizes are warranted to provide more robust evidence. Finally, there is no standardized MRI-targeted biopsy protocol. A large-scale multicenter study is needed to validate our results, and a standardized MRI-targeted biopsy protocol is needed for the dissemination of this novel biopsy method.
In conclusion, our study showed that combined biopsy provides a significant advantage in detecting csPCa, especially in the transperineal biopsy subgroup. These findings emphasize the potential benefits of integrating MRI guidance into biopsy procedures, providing an opportunity to improve the accuracy and clinical impact of prostate cancer diagnosis. Future studies should explore standardized protocols and optimal approaches for combined biopsy, promoting its wider use in clinical practice.
AUTHOR CONTRIBUTIONS
RN had full access to all of the data in the study and takes responsibility for the integrity of the data and the accuracy of the data analysis. RN, BSHH, and DFX conceptualized the study and revised the manuscript. JLH and DH analyzed the data and drafted the manuscript. RN, JLH, DH, XHR, TTC, TCTL, CFT, KHP, and ATLN collected and interpreted the data. RN, DFX, YLZ, and CY provided administrative, technical, or material support. All authors read and approved the final manuscript.
COMPETING INTERESTS
All authors declare no competing interests.
Positive rates of clinically significant prostate cancer in different subgroups. (a) Positive rates of clinically significant prostate cancer a in the overall cohort, TP subgroup, and TR subgroup. (b) Positive rates of clinically significant prostate cancer in men with tPSA 2–10 ng/mL, TP subgroup, and TR subgroup. (c) Positive rates of clinically significant prostate cancer in men with tPSA >10 ng/mL, TP subgroup, and TR subgroup. Y-axis: positive rates of clinically significant prostate cancer, X-axis: different subgroups. csPCa: clinically significant prostate cancer; TP, transperineum biopsy; TR: transrectum biopsy; tPSA: total prostate-specific antigen.
Positive rates of GG≥3 prostate cancer in different subgroups. (a) Positive rates of GG≥3 prostate cancer in the overall cohort, TP subgroup, and TR subgroup. (b) Positive rates of GG≥3 prostate cancer in men with tPSA 2–10 ng/mL, TP subgroup, and TR subgroup. (c) Positive rates of GG≥3 prostate cancer in men with tPSA >10 ng/mL, TP subgroup, and TR subgroup. Y-axis: Positive rates of GG≥3 prostate cancer, X-axis: different subgroups. PCa: prostate cancer; TP: transperineum biopsy; TR: transrectum biopsy; tPSA: total prostate specific antigen; GG: Gleason Grade Group.
ACKNOWLEDGMENTS
This research was funded by grants from the National Natural Science Foundation of China (No. 81972645), an Innovative research team of high-level local universities in Shanghai, the Shanghai Youth Talent Support Program, an intramural grant of The University of Hong Kong to RN, and from the Shanghai Sailing Program (No. 22YF1440500) to DH.
Supplementary Information is linked to the online version of the paper on the Asian Journal of Andrology website.
REFERENCES
- 1.Siegel RL, Miller KD, Wagle NS, Jemal A. Cancer statistics, 2023. CA Cancer J Clin. 2023;73:17–48. doi: 10.3322/caac.21763. [DOI] [PubMed] [Google Scholar]
- 2.Hodge KK, McNeal JE, Stamey TA. Ultrasound guided transrectal core biopsies of the palpably abnormal prostate. J Urol. 1989;142:66–70. doi: 10.1016/s0022-5347(17)38663-9. [DOI] [PubMed] [Google Scholar]
- 3.Kasivisvanathan V, Rannikko AS, Borghi M, Panebianco V, Mynderse LA, et al. MRI-targeted or standard biopsy for prostate-cancer diagnosis. N Engl J Med. 2018;378:1767–77. doi: 10.1056/NEJMoa1801993. [DOI] [PMC free article] [PubMed] [Google Scholar]
- 4.Siddiqui MM, Rais-Bahrami S, Turkbey B, George AK, Rothwax J, et al. Comparison of MR/ultrasound fusion-guided biopsy with ultrasound-guided biopsy for the diagnosis of prostate cancer. JAMA. 2015;313:390–7. doi: 10.1001/jama.2014.17942. [DOI] [PMC free article] [PubMed] [Google Scholar]
- 5.Ahdoot M, Wilbur AR, Reese SE, Lebastchi AH, Mehralivand S, et al. MRI-targeted, systematic, and combined biopsy for prostate cancer diagnosis. N Engl J Med. 2020;382:917–28. doi: 10.1056/NEJMoa1910038. [DOI] [PMC free article] [PubMed] [Google Scholar]
- 6.Loeb S, Vellekoop A, Ahmed HU, Catto J, Emberton M, et al. Systematic review of complications of prostate biopsy. Eur Urol. 2013;64:876–92. doi: 10.1016/j.eururo.2013.05.049. [DOI] [PubMed] [Google Scholar]
- 7.Connor MJ, Gorin MA, Eldred-Evans D, Bass EJ, Desai A, et al. Landmarks in the evolution of prostate biopsy. Nat Rev Urol. 2023;20:241–58. doi: 10.1038/s41585-022-00684-0. [DOI] [PubMed] [Google Scholar]
- 8.Ahmed HU, El-Shater Bosaily A, Brown LC, Gabe R, Kaplan R, et al. Diagnostic accuracy of multi-parametric MRI and TRUS biopsy in prostate cancer (PROMIS):a paired validating confirmatory study. Lancet. 2017;389:815–22. doi: 10.1016/S0140-6736(16)32401-1. [DOI] [PubMed] [Google Scholar]
- 9.Pokorny MR, de Rooij M, Duncan E, Schröder FH, Parkinson R, et al. Prospective study of diagnostic accuracy comparing prostate cancer detection by transrectal ultrasound-guided biopsy versus magnetic resonance (MR) imaging with subsequent MR-guided biopsy in men without previous prostate biopsies. Eur Urol. 2014;66:22–9. doi: 10.1016/j.eururo.2014.03.002. [DOI] [PubMed] [Google Scholar]
- 10.Radtke JP, Kuru TH, Boxler S, Alt CD, Popeneciu IV, et al. Comparative analysis of transperineal template saturation prostate biopsy versus magnetic resonance imaging targeted biopsy with magnetic resonance imaging-ultrasound fusion guidance. J Urol. 2015;193:87–94. doi: 10.1016/j.juro.2014.07.098. [DOI] [PubMed] [Google Scholar]
- 11.Rouvière O, Puech P, Renard-Penna R, Claudon M, Roy C, et al. Use of prostate systematic and targeted biopsy on the basis of multiparametric MRI in biopsy-naive patients (MRI-FIRST):a prospective, multicentre, paired diagnostic study. Lancet Oncol. 2019;20:100–9. doi: 10.1016/S1470-2045(18)30569-2. [DOI] [PubMed] [Google Scholar]
- 12.Stabile A, Giganti F, Rosenkrantz AB, Taneja SS, Villeirs G, et al. Multiparametric MRI for prostate cancer diagnosis:current status and future directions. Nat Rev Urol. 2020;17:41–61. doi: 10.1038/s41585-019-0212-4. [DOI] [PubMed] [Google Scholar]
- 13.Lee AY, Yang XY, Lee HJ, Law YM, Huang HH, et al. Multiparametric MRI-ultrasonography software fusion prostate biopsy:initial results using a stereotactic robotic-assisted transperineal prostate biopsy platform comparing systematic versus targeted biopsy. BJU Int. 2020;126:568–76. doi: 10.1111/bju.15118. [DOI] [PubMed] [Google Scholar]
- 14.Borghesi M, Bianchi L, Barbaresi U, Vagnoni V, Corcioni B, et al. Diagnostic performance of MRI/TRUS fusion-guided biopsies versus systematic prostate biopsies in biopsy-naïve, previous negative biopsy patients and men undergoing active surveillance. Minerva Urol Nephrol. 2021;73:357–66. doi: 10.23736/S2724-6051.20.03758-3. [DOI] [PubMed] [Google Scholar]
- 15.Emiliozzi P, Corsetti A, Tassi B, Federico G, Martini M, et al. Best approach for prostate cancer detection:a prospective study on transperineal versus transrectal six-core prostate biopsy. Urology. 2003;61:961–6. doi: 10.1016/s0090-4295(02)02551-7. [DOI] [PubMed] [Google Scholar]
- 16.Emiliozzi P, Longhi S, Scarpone P, Pansadoro A, DePaula F, et al. The value of a single biopsy with 12 transperineal cores for detecting prostate cancer in patients with elevated prostate specific antigen. J Urol. 2001;166:845–50. [PubMed] [Google Scholar]
- 17.Merrick GS, Gutman S, Andreini H, Taubenslag W, Lindert DL, et al. Prostate cancer distribution in patients diagnosed by transperineal template-guided saturation biopsy. Eur Urol. 2007;52:715–23. doi: 10.1016/j.eururo.2007.02.041. [DOI] [PubMed] [Google Scholar]
- 18.Labra A, González F, Silva C, Franz G, Pinochet R, et al. MRI/TRUS fusion versus systematic biopsy:intra-patient comparison of diagnostic accuracy for prostate cancer using PI-RADS v2. Abdom Radiol (NY) 2020;45:2235–43. doi: 10.1007/s00261-020-02481-y. [DOI] [PubMed] [Google Scholar]
- 19.Calio B, Sidana A, Sugano D, Gaur S, Jain A, et al. Changes in prostate cancer detection rate of MRI-TRUS fusion versus systematic biopsy over time:evidence of a learning curve. Prostate Cancer Prostatic Dis. 2017;20:436–41. doi: 10.1038/pcan.2017.34. [DOI] [PMC free article] [PubMed] [Google Scholar]
- 20.Andras I, Cata ED, Serban A, Kadula P, Telecan T, et al. Combined systematic and MRI-US fusion prostate biopsy has the highest grading accuracy when compared to final pathology. Medicina (Kaunas) 2021;57:519. doi: 10.3390/medicina57060519. [DOI] [PMC free article] [PubMed] [Google Scholar]
- 21.Caglic I, Sushentsev N, Gnanapragasam VJ, Sala E, Shaida N, et al. MRI-derived PRECISE scores for predicting pathologically-confirmed radiological progression in prostate cancer patients on active surveillance. Eur Radiol. 2021;31:2696–705. doi: 10.1007/s00330-020-07336-0. [DOI] [PMC free article] [PubMed] [Google Scholar]
Associated Data
This section collects any data citations, data availability statements, or supplementary materials included in this article.
Supplementary Materials
Positive rates of clinically significant prostate cancer in different subgroups. (a) Positive rates of clinically significant prostate cancer a in the overall cohort, TP subgroup, and TR subgroup. (b) Positive rates of clinically significant prostate cancer in men with tPSA 2–10 ng/mL, TP subgroup, and TR subgroup. (c) Positive rates of clinically significant prostate cancer in men with tPSA >10 ng/mL, TP subgroup, and TR subgroup. Y-axis: positive rates of clinically significant prostate cancer, X-axis: different subgroups. csPCa: clinically significant prostate cancer; TP, transperineum biopsy; TR: transrectum biopsy; tPSA: total prostate-specific antigen.
Positive rates of GG≥3 prostate cancer in different subgroups. (a) Positive rates of GG≥3 prostate cancer in the overall cohort, TP subgroup, and TR subgroup. (b) Positive rates of GG≥3 prostate cancer in men with tPSA 2–10 ng/mL, TP subgroup, and TR subgroup. (c) Positive rates of GG≥3 prostate cancer in men with tPSA >10 ng/mL, TP subgroup, and TR subgroup. Y-axis: Positive rates of GG≥3 prostate cancer, X-axis: different subgroups. PCa: prostate cancer; TP: transperineum biopsy; TR: transrectum biopsy; tPSA: total prostate specific antigen; GG: Gleason Grade Group.