
Figure 6.
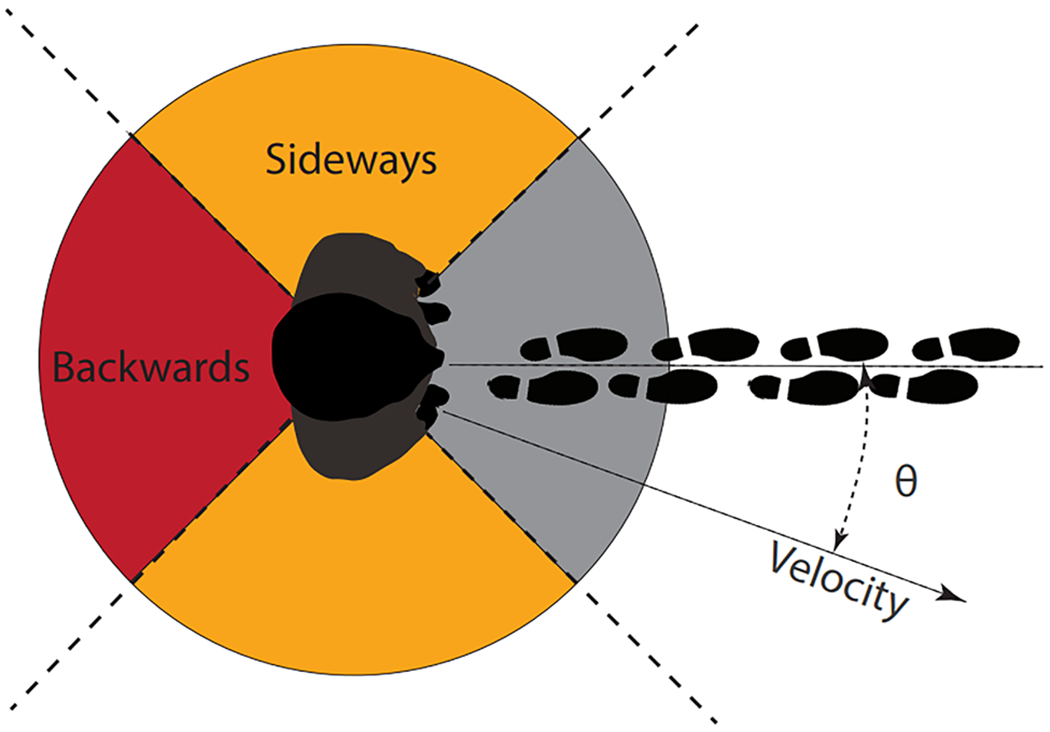
Visualization of Angles θ and Motion Areas. The plot depicts the angles θ between the instantaneous orientation and velocity of the lumbar tracker, showcasing the forward (− π/4 < θ < π/4), sideways (π/4 < |θ| < 3 π/4), and backward (3 π/4 < |θ| < π) motion areas. This graphical representation offers insights into participants’ movement patterns within the virtual environment.