

ABSTRACT
Aim
To develop and test different machine learning algorithms for predicting nocturnal hypoglycaemia in patients with type 2 diabetes mellitus.
Design
A retrospective study.
Methods
We collected data from dynamic blood glucose monitoring of patients with T2DM admitted to the Department of Endocrinology and Metabolism at a hospital in Shanghai, China, from November 2020 to January 2022. Patients undergone the continuous glucose monitoring (CGM) for ≥ 24 h were included in this study. Logistic regression, random forest and light gradient boosting machine algorithms were employed, and the models were validated and compared using AUC, accuracy, specificity, recall rate, precision, F1 score and the Kolmogorov–Smirnov test.
Results
A total of 4015 continuous glucose‐monitoring data points from 440 patients were included, and 28 variables were selected to build the risk prediction model. The 440 patients had an average age of 62.7 years. Approximately 48.2% of the patients were female and 51.8% were male. Nocturnal hypoglycaemia appeared in 573 (14.30%) of 4015 continuous glucose monitoring data. The light gradient boosting machine model demonstrated the highest predictive performances: AUC (0.869), specificity (0.802), accuracy (0.801), precision (0.409), recall rate (0.797), F1 score (0.255) and Kolmogorov (0.603). The selected predictive factors included time below the target glucose range, duration of diabetes, insulin use before bed and dynamic blood glucose monitoring parameters from the previous day.
Patient or Public Contribution
No Patient or Public Contribution.
Keywords: continuous glucose monitoring, machine learning, nocturnal hypoglycaemia, prediction model, type 2 diabetes mellitus
1. Introduction
Diabetes mellitus has an estimated 463 million cases projected to increase to 578 million by 2030 (Saeedi et al. 2019). In 2019, diabetes directly caused 1.5 million deaths, and by 2030, it is predicted to become the seventh leading cause of death worldwide (WHO 2018). Type 2 diabetes mellitus (T2DM) accounts for approximately 90% of these cases (Sun et al. 2022). Nocturnal hypoglycaemia has a high incidence in patients with T2DM and do not recognise symptoms. Undetected hypoglycaemia could lead to coma and sudden death in severe cases. Prevention of nocturnal hypoglycaemia could reduce the occurrence of adverse events above and should be regarded as the focus of patient safety management. Therefore, it is important to identify high‐risk groups of nocturnal hypoglycaemia early and provide targeted interventions as early as possible. The purpose of this study was to evaluate the occurrence of nocturnal hypoglycaemia between 0:00 AM and 6:00 AM in T2DM patients based on CGM and to analyse the risk factors of nocturnal hypoglycaemia in T2DM patients using machine learning algorithms.
2. Background
Hypoglycaemia is a frequent and serious complication affecting patients with diabetes (Cryer, Davis, and Shamoon 2003). Hypoglycaemia can contribute to significant morbidity in T2DM patients (UK Hypoglycaemia Study Group 2007). Nocturnal hypoglycaemia was reported in 16% of participants with T2DM (Khunti et al. 2016). Physiological responses to sleep in healthy people include reduced glucose production from the liver and attenuated peripheral utilisation, collectively leading to relatively constant blood glucose concentrations (Kalsbeek, La Fleur, and Fliers 2014). In T2DM patients with insulin deficiency, an impaired counter‐regulatory response to decreasing blood glucose cannot compensate for the relative increase in iatrogenic insulin (Davis et al. 2009). Furthermore, the delayed recovery of BG levels caused by the weakening of the anti‐regulatory effect aggravates the occurrence of more serious hypoglycaemic events (Galassetti et al. 2003). According to the Diabetes Control and Complications Trial (DCCT), 43% of all hypoglycaemic events occur during sleep, of which 51% of patients do not recognise symptoms (The DCCT Research Group 1991). Undetected hypoglycaemia could further impair the physiological counter‐regulatory system, resulting in multiple organ failure, confusion of consciousness and even death (Schultes et al. 2007). Therefore, evaluating the risk of nocturnal hypoglycaemia is crucial for emergency management. Various studies have predicted nocturnal hypoglycaemia before bedtime. For example, Jensen et al (Jensen et al. 2020). developed a classifier to predict nocturnal hypoglycaemia. Sakurai et al. (2018) presented a mathematical model for estimating minimum nocturnal blood glucose levels in insulin‐treated patients with T2DM. However, the predictive effects of these models were influenced by fewer factors, a narrow scope of research objects and a small clinical sample size. Few studies have estimated overnight nocturnal hypoglycaemia at bedtime, which is an important aspect of safety management.
Different algorithms that use machine learning and vary with the data types and outcome indicators have been proposed. Predictive models can be established based on variables and clinical characteristics to predict the occurrence of complications. By processing large‐scale samples and more comprehensive predictors, machine learning algorithms reveal their advantages in improving model stability and compensating for the deficiencies of traditional models. Recent articles have shown that machine learning algorithms in clinical nursing are extensively used in chronic diseases, adverse events, nursing management, and nursing education based on the advantages of analysing large datasets (O'brien and O'brien 2021). Examples include predicting mortality within 30 days for MIMIC‐III Patients with sepsis‐3 (Hou et al. 2020), early delirium risk prediction in intensive care units (Spiller et al. 2022), identifying factors related to graduation outcomes of students (Hannaford, Cheng, and Kunes‐Connell 2021), and identifying cognitive impairment early enough (Hu et al. 2021). Logistic Regression (LR) is a linear classification model widely employed in disease prediction because of its simplicity, ease of understanding and good model interpretation. Random forest (RF) and light‐gradient boosting machines (LGBM) are decision tree models that enhance training efficiency and faster processing of large‐scale data. Machine learning models are more stable in making predictions and analysis by learning the patterns, while traditional models mainly build prediction models based on statistical methods (Sheng et al. 2024). Existing studies on hypoglycaemia prediction models have demonstrated that machine learning models outperform traditional mathematical formula models in predicting hypoglycaemia trends and blood glucose levels with greater efficiency and accuracy (Xie et al. 2022; Delpino et al. 2022).
However, few studies have reported the predictive factors for nocturnal hypoglycaemia in patients with T2DM based on machine learning algorithms. Thus, this study aimed to develop a prediction model for nocturnal hypoglycaemia an event with BG ≤ 3.9 mmol/L between 0:00 AM and 6:00 AM in T2DM patients based on machine learning algorithms to identify high‐risk patients and develop targeted intervention programs for nocturnal hypoglycaemia including recommendations on diet, exercise and medication.
3. Methods
3.1. Study Design and Participants
This study was conducted in accordance with the Transparent Reporting of a Multivariable Prediction Model for Individual Prognosis or Diagnosis (TRIPOD) checklist (supplement) (Collins et al. 2015). A retrospective cohort study was conducted using the electronic database of a large comprehensive tertiary hospital in Shanghai, China. Adult patients with T2DM who were admitted to the Department of Endocrinology and Metabolism between November 2020 and January 30, 2022, were eligible. All the data were obtained from the Department of Endocrinology and Metabolism at a hospital in Shanghai, China. In summary, patients with T2DM aged ≥ 18 years were included in this study when they consented to undergo CGM for ≥ 24 h. The exclusion criteria were as follows: (1) admission for hypoglycaemia, diabetic ketoacidosis or non‐ketotic hyperosmolar coma; (2) infectious diseases, acute coronary syndromes, malignant tumours, anaemia or renal failure and (3) deletion of medical records and data duplication. This study received approval from the Ethics Committee of Zhongshan Hospital, Fudan University (B2020‐116). Pmsampsize package was used to calculate the sample size for this study. When cstatistic = 0.77, parameters = 20, prevalence = 0.177, the sample size was calculated to be 1226. Figure 1 describes the flow of the participants for development and validation in the risk model.
FIGURE 1.

The risk model flow chart.
3.2. Biochemical Analyses and Data Collection
Based on a comprehensive review of previous studies, the following features of patients with T2DM were included: age, sex, duration of diabetes, oral antidiabetic drugs, insulin, creatinine (Cr), uric acid (UA), glycated albumin (GA), aspartate aminotransferase (AST) and glutamic‐pyruvic transaminase (ALT). All patients underwent the same technology (FreeStyle Libre Pro Sensor; Abbott Diabetes Care, Alameda, CA, USA). The FreeStyle Libre H sensor can be used for CGM with 288 measurements available every 24 h.
Based on a comprehensive review of previous studies (Klonoff et al. 2022; Torimoto et al. 2018; Gómez et al. 2018; Guo 2016), this study included the following CGM parameters: mean blood glucose, glycated haemoglobin A1c (eHbA1c), the standard deviation (SD), coefficient of variation (CV), low amplitude of glycemic excursions (LAGE), blood glucose risk index (BGRI), low blood glucose index (LBGI), high blood glucose index (HBGI), minimum blood glucose (Min), maximum blood glucose (Max), Coefficient of glycaemic variation (JIndex), average daily risk range (ADRR), a weighted average glucose value (M value), percentage of time below the target glucose range (TBR; < 3.9 mmol/L), percentage of time in the target glucose range (TIR; 3.9 ~ 10.0 mmol/L), percentage of time above the target glucose range (TAR; > 10.0 mmol/L). An event with a blood glucose (BG) level of ≤ 3.9 mmol/L was defined as hypoglycaemia (Agiostratidou et al. 2017). In T2DM patients, an event with BG ≤ 3.9 mmol/L between 0:00 AM and 6:00 AM was defined as nocturnal hypoglycaemia (Khunti et al. 2016). CGM data with BG ≥ 3.9 mmol/L was included in the non‐hypoglycaemic group; otherwise, they were included in the hypoglycaemic group. The predictive CGM measurements were collected before the hypoglycaemic event.
3.3. Statistical Analysis
Data analysis was performed using SPSS 26.0 and scikit‐learn packages in Python 3.7. Shapiro–Wilk was used to test the normality of continuous variables. The CGM parameters including mean blood glucose, eHbA1c, CV, SD, LAGE, BGRI, LBGI, HBGI, Min, Max, JIndex, ADRR, M value, TBR, TIR and TAR were non‐normal distributions (p < 0.05). Non‐normally distributed data were described as median (M), first quartile (P25) and third quartile (P75). The two groups were compared using the non‐parametric Mann–Whitney U‐test. Discrete data were described as frequency, composition ratio or percentage, and the chi‐square test was employed to compare the two groups.
Because the prediction results of this study involved binary variables, three machine learning algorithms—LR, RF and LGBM, suitable for binary classification—were selected to formulate the prediction model for nocturnal hypoglycaemia. Predictors of nocturnal hypoglycaemia were explored in combination with general, clinical, laboratory and CGM data, providing a reference for early clinical detection and treatment. Nocturnal hypoglycaemia occurrence served as the dependent variable, while the other 28 variables were considered independent for data processing and model research. However, to scrutinise the most influential characteristics of the predictive model, variables in the single‐factor analysis were examined for LR, RF and LGBM.
For the LR model, the multiple imputation method is used to process missing values by the mice package in R studio. During the construction of decision trees, RF can deal with missing values by choosing the best split that ignores the missing values. In the RF model, missing values do not affect the training of other data, as the algorithm only considers complete subsets of features during each split. The LightGBM model has built‐in support for missing values. When dealing with missing data, the LightGBM model automatically learns the data distribution and assigns a default direction for missing values.
Meanwhile, in Logistic Regression, we test the collinearity diagnostic coefficient and variance inflation factor (VIF) among highly correlated predictors. Random Forest randomly selects a subset of features from all available features when constructing each tree and can reduce the impact of highly correlated features on the model. Using out‐of‐bag (OOB) samples to estimate the generalisation error of the model can provide a way to evaluate model generalisation without the need for cross‐validation. Since LightGBM uses the gradient boosting method, each new tree added is meant to correct the residuals of all previous trees, allowing it to adapt to some level of collinearity among features. Offering various regularisation methods, including L1 and L2 regularisation, can help mitigate the effects of feature correlation and prevent overfitting. Besides, LightGBM uses a histogram algorithm to speed up training, which bins the features and can reduce the impact of interactions among features on the model.
The data set, comprising CGM data and 28 variables, the training set and validation set 1 in a 7:3 ratio by random sampling. One CGM measurement was extracted by randomly sampling from every patient to form a data set with 440 data points for validation set 2. LR, RF and LGBM were trained using 70% of the data set. During the modelling process, the training set was used to cross‐validate the hyperparameters of the optimised model using a 10‐fold approach to prevent overfitting. The remaining 30% of the data constituted the validation set.
The receiver operating characteristic (ROC), specificity, accuracy, precision, recall rate, F1 score and Kolmogorov–Smirnov (KS) test were employed to verify and compare the predictive performances of the models. The area under the ROC curve (AUC) was calculated to reveal the probability that the model precisely evaluated the risk of nocturnal hypoglycaemia. AUC indicates high accuracy above 0.9, low accuracy at 0.5–0.7, and moderate accuracy at 0.7–0.9 (Saito and Rehmsmeier 2015). We used the Normal Approximation Method to calculate the 95% confidence interval for the AUC. However, AUC alone is insufficient as an index of the nocturnal hypoglycaemia prediction model. It hypothesizes that positive predictions are as important as negative ones. To ensure a comprehensive assessment of the predictive performance, we used the technical term True Positive (TP) to denote true positive predictions, False Positive (FP) for false positives, True Negative (TN) for true negatives and False Negative (FN) for false negatives. Precision was calculated using the TP/(TP + FP) ratio, and recall was calculated using the TP/(TP + FN) ratio. Specificity was calculated using the TN/(FP + TN) ratio. These metrics—specificity, accuracy, precision, and recall rate were analysed for each machine learning model.
In addition, F1 and KS were employed to assess the prediction effect of the model. The F1 score was calculated as the ratio (2 × precision × recall)/(Precision + Recall). False Positive Rate (FPR) was calculated as FP/(FP + TN). The KS score was calculated using the ratio maximum (recall‐FPR). Higher F1 and KS scores indicate higher precision (Thompson et al. 2019). The calibration of the model was assessed using the Hosmer‐Lemeshow goodness‐of‐fit test and calibration curve. Additionally, we applied a decision curve analysis (DCA) to estimate the values of the predictive models within all possible thresholds. DCA effectively combines all the critical factors of clinical decisions: the accuracy of a predictive model, the consequences of a decision and the patient's preferences to evaluate the best action program. DCA considers not only the accuracy of the model but also the cost of false positives and false negatives, which makes DCA more practical in clinical decision support systems. DCA evaluates the value of taking action on predictive models compared with other management strategies, such as ‘hypoglycaemia’ versus ‘non‐hypoglycaemia’ patients with the condition of interest (Djulbegovic and Hozo 2023). In Decision Curve Analysis (DCA), the net benefit is a measure used to evaluate the clinical usefulness of diagnostic tests, predictive models or treatment strategies. It represents the benefit of correctly classifying cases minus the risks and costs associated with incorrect classification.
4. Results
4.1. General Information of Patients in Two Groups
This study incorporated 4015 continuous glucose monitoring data points from 440 patients. The 440 patients had an average age of 62.7 years. Among the patients, 48.2% were female and 51.8% were male. Nocturnal hypoglycaemia appeared in 573 (14.30%) of 4015 continuous glucose monitoring data. Approximately 30.5% of the patients had a diabetes duration of ≥ 10 years. Among the patients, 35.5% took oral antidiabetic drugs and 30.2% took insulin therapy. Gender, duration of diabetes, insulin, Cr, UA, ALT, AST and all CGM parameters were significantly different between the two groups (Table 1). The duration of diabetes in the two groups was 30.5%, while the proportion of patients with a diabetes duration < 5 years was significantly higher in the hypoglycaemia group compared with the non‐hypoglycaemia group.
TABLE 1.
Comparisons of demographics and clinical indicators.
| Characteristic | Hypoglycaemia group (n = 573) | Non‐hypoglycaemia group (n = 3442) |
|---|---|---|
| Age (n, %) | ||
| < 40 years | 67 (11.7) | 385 (11.2) |
| 40–65 years | 239 (41.7) | 1452 (42.2) |
| ≥ 65 years | 267 (46.6) | 1605 (46.6) |
| Gender (n, %) | ||
| Male | 297 (51.8) | 2030 (59.0) |
| Female | 276 (48.2) | 1412 (41.0) |
| Duration of diabetes (n, %) | ||
| < 5 years | 359 (62.7) | 1223 (35.5) |
| 5–10 years | 39 (6.8) | 1171 (34.0) |
| ≥ 10 years | 175 (30.5) | 1048 (30.5) |
| Oral antidiabetic drugs (n, %) | ||
| Yes | 371 (64.7) | 2218 (64.4) |
| No | 202 (35.3) | 1224 (35.6) |
| Insulin therapy (n, %) | ||
| Yes | 387 (67.5) | 2415 (70.2) |
| No | 186 (32.5) | 1027 (29.8) |
| Insulin therapy before meals (n, %) | ||
| Yes | 260 (45.4) | 1781 (51.7) |
| No | 313 (54.6) | 1661 (48.3) |
| Bedtime insulin therapy (n, %) | ||
| Yes | 251 (43.8) | 1563 (45.4) |
| No | 322 (56.2) | 1879 (54.6) |
| Cr (n, %) | ||
| Normal | 399 (69.6) | 2919 (84.8) |
| Abnormal | 174 (30.4) | 523 (15.2) |
| UA (n, %) | ||
| Normal | 406 (70.9) | 2955 (85.9) |
| Abnormal | 167 (29.1) | 487 (14.1) |
| GA (n, %) | ||
| Normal | 168 (29.3) | 1049 (30.5) |
| Abnormal | 405 (70.7) | 2393 (69.5) |
| ALT (n, %) | ||
| Normal | 484 (84.5) | 3174 (92.2) |
| Abnormal | 89 (15.5) | 268 (7.8) |
| AST (n, %) | ||
| Normal | 460 (80.3) | 2986 (86.8) |
| Abnormal | 113 (19.7) | 456 (13.2) |
| Mean blood glucose (mmol/L) | 6.5 (5.4, 7.8) | 8.5 (7.1, 10.4) |
| eHbA1c (%) | 5.7 (5.0, 6.5) | 6.9 (6.1, 8.2) |
| CV (%) | 0.3 (0.2, 0.4) | 0.3 (0.2, 0.3) |
| SD (mmol/L) | 2.0 (1.4, 2.7) | 2.2 (1.6, 2.9) |
| LAGE (mmol/L) | 7.7 (5.8, 10.1) | 8.5 (6.6, 10.8) |
| BGRI | 5.2 (3.3, 8.7) | 5.8 (3.1, 11.4) |
| LBGI | 4.0 (2.1, 6.9) | 0.7 (0.0, 2.1) |
| HBGI | 3.5 (1.5, 7.2) | 6.4 (3.3, 12.0) |
| Min (mmol/L) | 3.3 (2.6, 3.9) | 4.8 (3.9, 6.2) |
| Max (mmol/L) | 11.2 (9.2, 13.6) | 13.6 (11.4, 16.5) |
| JIndex (mmol/L) | 23.4 (15.9, 35.9) | 37.4 (26.0, 56.4) |
| ADRR | 5.2 (3.3, 8.7) | 5.8 (3.1, 11.4) |
| M value | 2222.4 (1872.7, 2639.5) | 1653.1 (1311.6, 1997.8) |
| TBR | 7.3 (0.0, 19.4) | 0.0 (0.0, 0.0) |
| TIR | 75.0 (57.8, 88.5) | 70.8 (44.8, 89.6) |
| TAR | 6.3 (0.0, 22.9) | 26.0 (8.3, 53.1) |
Note: Non‐normally distributed data were described as M (P25, P75), and the two groups were compared using the non‐parametric Mann–Whitney U‐test. Discrete data were described as frequency, composition ratio or percentage, and the chi‐square test was employed to compare the two groups.
Abbreviations: ADRR, average daily risk range; ALT, alanine aminotransferase; BGRI, blood glucose risk index; ART, assisted reproductive technology; CGM, continuous glucose monitoring; Cr, creatinine; CV, coefficient of variation; CV, coefficient of glycaemic variation; eHbA1c, glycated haemoglobin A1c; GA, glycated albumin; HBGI, high blood glucose index; LAGE, low amplitude of glycaemic excursions; LBGI, low blood glucose index; Min, minimum blood glucose; Max, maximum blood glucose; M value, a weighted average glucose value; TBR, percentage of time below the target glucose range; TIR, percentage of time in the target glucose range; UA, uric acid.
4.2. Prediction Performances of LR, RF and LGBM
Subsequently, a validation set completely isolated from the training set was used to estimate the model performance. First, ROCs were evaluated to reflect the relationship between the risk profiles predicted by the models and actual nocturnal hypoglycaemia, assessing the prediction performances of the models. The AUCs (95% CI) of the models in the testing set are as follows: LR, 0.825 (0.812–0.826); RF, 0.835 (0.822–0.844) and LBGM, 0.869 (0.833–0.890) (Table 2). Figure 2 shows the ROC curve assessment of the prediction model, representing the overall performances of the model. LR, RF and LGBM demonstrate exceptional predictive performances. Notably, the AUC of the LGBM model is the highest among all models.
TABLE 2.
Comparisons of predictive performance among LR, RF and LGBM.
| Algorithm | Data set | AUC (95% CI) | Sensitivity | Specificity | Accuracy | Recall | Precision | F1 | KS |
|---|---|---|---|---|---|---|---|---|---|
| LR | Training set | 0.840 (0.803, 0.878) | 0.722 | 0.797 | 0.976 | 0.722 | 0.368 | 0.255 | 0.521 |
| Validation set 1 | 0.825 (0.799, 0.851) | 0.734 | 0.808 | 0.801 | 0.734 | 0.398 | 0.247 | 0.565 | |
| Validation set 2 | 0.822 (0.780,0.845) | 0.739 | 0.821 | 0.720 | 0.776 | 0.307 | 0.249 | 0.507 | |
| RF | Training set | 0.832 (0.806, 0.857) | 0.154 | 0.989 | 0.872 | 0.154 | 0.701 | 0.244 | 0.550 |
| Validation set 1 | 0.835 (0.797, 0.873) | 0.192 | 0.990 | 0.873 | 0.192 | 0.773 | 0.254 | 0.545 | |
| Validation set 2 | 0.837 (0.786, 0.885) | 0.201 | 0.992 | 0.875 | 0.265 | 0.673 | 0.252 | 0.553 | |
| LGBM | Training set | 0.877 (0.854, 0.899) | 0.811 | 0.794 | 0.796 | 0.811 | 0.392 | 0.242 | 0.607 |
| Validation set 1 | 0.869 (0.834, 0.904) | 0.797 | 0.802 | 0.801 | 0.797 | 0.409 | 0.255 | 0.603 | |
| Validation set 2 | 0.848 (0.810, 0.961) | 0.805 | 0.811 | 0.782 | 0.765 | 0.394 | 0.264 | 0.556 |
Note: Validation set 1: The overall data set was divided into the training set and validation set 1 in a 7:3 ratio by random sampling. Validation set 2: One CGM measurement was extracted by randomly sampling from every patient to form a data set with 440 data points for the validation set 2.
Abbreviations: AUC, The area under the ROC curve; F1, F1 score; KS, Kolmogorov–Smirnov; LGBM, light‐gradient boosting machines; LR, Logistic Regression; RF, Random Forest.
FIGURE 2.

Comparisons of AUC among LR, RF and LGBM.
The specificity, accuracy, precision, recall rate, F1 and KS scores were calculated to comprehensively measure the models' performance. The AUC of the LGBM model was 0.869 (LR: 0.825; RF: 0.834), with a specificity of 0.802 (LR: 0.808; RF: 0.990), an accuracy of 0.801 (LR: 0.801; RF: 0.873), precision of 0.409 (LR: 0.398; RF: 0.773), recall rate of 0.797 (LR: 0.734; RF: 0.192), F1 score of 0.255 (LR: 0.248; RF: 0.254), and KS of 0.603 (LR: 0.565; RF: 0.545). Their performances are listed in Table 2. Among the three algorithms, the LGBM performed the best in four of the five model metrics, except for accuracy. It achieved the highest overall recall rate of 0.797, F1 score of 0.255, and KS of 0.603, surpassing those of LR and RF. The results of the recall rate comparison indicated that LGBM predicted actual nocturnal hypoglycaemia events more easily and reduced misjudgments, performing significantly better than LR and RF. The highest KS values represented the best performance of LGBM in distinguishing those at high risk of nocturnal hypoglycaemia from those at low risk.
The decision curve of the LBGM was higher than that of the LR and RF under all threshold probabilities (Figure 3). This indicates that if the threshold probability of a patient is < 70%, using LBGM to predict nocturnal hypoglycaemia offers more benefits. LGBM has a better clinical application value than LR and RF. It is generally the optimum model with the highest AUROC, highest recall, and favourable F1 and KS. The LBGM provides a more precise and better‐calibrated model, allowing us to predict better the risk of nocturnal hypoglycaemia than LR and RF.
FIGURE 3.
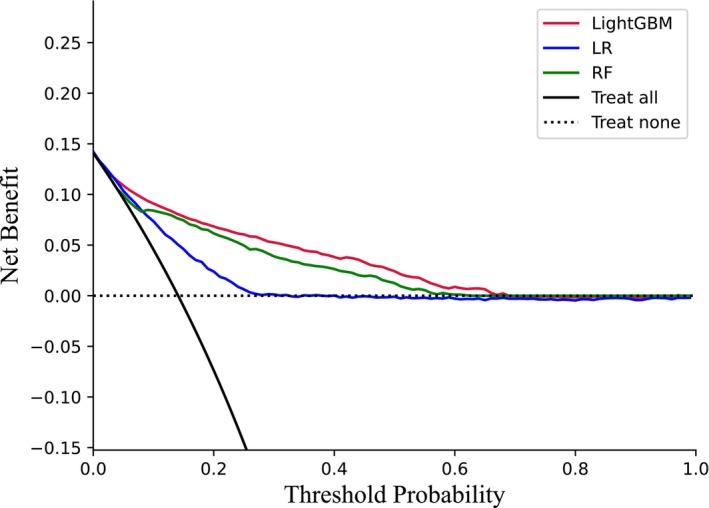
Comparisons of DCA among LR, RF and LGBM.
In the LGBM, the top 10 important predictors of nocturnal hypoglycaemia included TBR, M value, LBGI, Min, duration of diabetes, Max, CV, insulin, BGRI and SD, among which eight variables presented CGM parameters from the previous day (Figure 4). Among the eight dynamic blood glucose fluctuation parameters, the TBR from the preceding day served as the most robust predictor of nocturnal hypoglycaemia, combined with comparisons of demographics and clinical indicators between the two groups. Patients with a diabetes duration < 5 years and those undergoing bedtime insulin therapy were more likely to experience nocturnal hypoglycaemia. Based on clinical features and CGM parameters from the previous day of T2DM patients, this model can help identify high‐risk groups of nocturnal hypoglycaemia early in an inpatient ward setting.
FIGURE 4.

The top 10 importance predictors of nocturnal hypoglycaemia.
5. Discussion
In this study, 4015 continuous glucose monitoring data points from 440 patients were included, and 28 variables were selected to build the risk prediction model of nocturnal hypoglycaemia in T2DM patients. LR, RF and LGBM demonstrated favourable predictive performances, with LGBM outperforming LR and RF. In recent years, several researchers have also paid close attention to hypoglycaemia risk modelling. Thomsen, Jakobsen, and Hecht‐Pedersen (2023) indicated the transfer‐learned convolutional neural network (CNN) model had shown promising performance in predicting hypoglycaemic episodes and with slightly better results than a non‐transfer‐learned CNN model. Cichosz, Jensen, and Olesen (2024) proposed XGBoost models combined with feature engineering deployed on the CGM signals to predict excessive hypoglycaemia risk. Additionally, HRV patterns combined with CGM data could improve the accuracy of hypoglycaemia in the forthcoming week as detected by a CGM device, which needs further research to confirm (Cichosz et al. 2015; Cichosz et al. 2014). In comparison with the RF nocturnal hypoglycaemia prediction model with an AUC of 0.84 reported by Vu et al. (2020) the LGBM risk model in this study demonstrated a higher predictive performance and showed greater accuracy in predicting hypoglycaemia trends. TBR, duration of diabetes, insulin use before bed and dynamic blood glucose monitoring parameters from the previous day in this model were independent predictors of nocturnal hypoglycaemia. The predictive results from the model can help identify high‐risk groups of nocturnal hypoglycaemia early and provide the basis for targeted interventions. In the long term, this prediction model of nocturnal hypoglycaemia could improve glycaemic control levels for T2DM and decrease the incidence of nocturnal hypoglycaemia episodes.
We observed that 14.3% of patients with T2DM experienced nocturnal hypoglycaemia, surpassing the incidence among patients with T2DM undergoing insulin therapy, oral hypoglycaemic agents and lifestyle control, as reported by Yuan et al. (2021). This higher prevalence is associated with heightened insulin sensitivity at night, imperfect insulin replacement, prolonged intervals between meals, limited peripheral blood glucose monitoring and an insignificant autonomic nervous response (St‐Onge et al. 2023). The overall advanced age of the participants and the high percentage of insulin use (69.8%) may have contributed to the increased occurrence. The delayed response of elderly individuals to hypoglycaemia coupled with reduced gluconeogenesis and insulin clearance capacity, particularly in those using medium‐acting insulin, makes them more susceptible to hypoglycaemia owing to the prolonged action of insulin (Boureau et al. 2023). Collectively, these factors contributed to the elevated incidence observed in this study.
The TBR from the preceding day was the most robust predictor of this nocturnal hypoglycaemia model. This implies a significantly higher incidence of nocturnal hypoglycaemia in individuals with a history of hypoglycaemia from the previous day, and that the risk escalates with the duration of hypoglycaemia. Similar results were reported by Mathioudakis et al. (2021) and Li et al. (2019). Hence, individuals with a history of hypoglycaemia and an elevated TBR should consider addressing lifestyle behaviours, medications and diet to prevent nocturnal hypoglycaemia.
Furthermore, our results revealed that patients with a diabetes duration < 5 years were more likely to experience nocturnal hypoglycaemia. Gu et al. (2016) found that Chinese patients with T2DM and a diabetes duration of 2–6 years had a significantly higher risk of mild hypoglycaemia, which decreased slightly after 6 years. Additionally, individuals with a disease duration > 5 years exhibited higher diabetes‐related knowledge, attitudes and behaviours, contributing to enhanced blood glucose self‐management, and consequently, a reduced likelihood of nocturnal hypoglycaemic events (Nguyen et al. 2020). However, further studies are warranted to confirm the relationship between the duration and onset of hypoglycaemia.
In this study, a distinct increase in the risk of nocturnal hypoglycaemia was observed in patients undergoing bedtime insulin therapy. Akirov et al. (2018) reported a quadruple risk of in‐hospital hypoglycaemia in individuals receiving insulin treatment. Mathioudakis et al. (2021) identified the basal insulin dose as the most influential factor in predicting iatrogenic hypoglycaemia during hospitalisation. Insulin, along with sulfonamides and glinides, is a hypoglycaemic drug prone to inducing hypoglycaemia (Pilla et al. 2021). Recent studies by Jesper et al. have reported accurate prediction models in patients with type 1 diabetes could also be used in a closed‐loop system to suspend insulin therapy in order to avoid severe hypoglycaemia (Fleischer, Hansen, and Cichosz 2022). Among patients with type 2 diabetes at risk for nocturnal hypoglycaemia, it is recommended that when blood glucose fluctuates between 3.9 and 5.6 mmol/L, adjustments to basal and meal insulin doses should be made to mitigate the risk of iatrogenic hypoglycaemia (Olveira et al. 2020).
LBGI, recognised as a hypoglycaemic index (Guo 2016), exhibits a positive correlation between higher values and an increased risk of nocturnal hypoglycaemia. Numerous domestic and international studies affirm LBGI as a robust predictive indicator for T2DM hypoglycaemia, demonstrating its significance in assessing severe hypoglycaemia risk and its positive correlation with type 1 diabetes‐related nocturnal hypoglycaemia (Torimoto et al. 2018; Ling et al. 2020; Kovatchev et al. 1998).
Another CGM parameter, BGRI, also independently predicted nocturnal hypoglycaemia, encompassing the time ratio of hyperglycaemia and hypoglycaemia. It is a potential variable for assessing glycaemic risk and contributes to developing automatic insulin delivery algorithms and predicting long‐term diabetes complications (Klonoff et al. 2022). Likewise, the M value reflects the overall blood glucose stability. It is the glycaemic variation index with the most potent predictive effect (Guo 2016). Higher M values indicated a heightened nocturnal hypoglycaemia likelihood (Schlichtkrull, Munck, and Jersild 1964). Gómez et al. (2018) and Tanae et al. (1987) used the M value as an evaluation index for blood glucose fluctuations and hypoglycaemic events.
The SD, representing the standard deviation of multiple BG values, describes the trend of blood glucose dispersion and aids in predicting the occurrence of nocturnal hypoglycaemic events, consistent with the findings of Ling et al. (2020). CV evaluated the degree of dispersion of blood glucose deviation from the average level, and an increased CV correlated with a higher risk of nocturnal hypoglycaemia (Bragd et al. 2008). According to an international consensus (Danne et al. 2017), CV offers more accurate predictions of hypoglycaemia than other indicators of blood glucose variation, including SD. Handa et al. demonstrated that, in contrast to SD, CV is more predisposed to hyperglycaemic events and more closely associated with hypoglycaemic events (Handa et al. 2021).
In conclusion, combined with assessing the previous day's blood glucose variation indicators, blood glucose fluctuations should be evaluated by considering the lowest and highest blood glucose values for patients undergoing CGM. Patients exhibiting significant blood glucose fluctuations should undergo a combination of medication and dietary interventions to mitigate the occurrence of nocturnal hypoglycaemia, aligning with the findings of Nicolas et al. (2018). Mathioudakis et al. (2021) also indicated that the lowest blood glucose level at admission is a crucial predictor of hypoglycaemic events during hospitalisation, demonstrating a negative correlation with the incidence of hypoglycaemia. Hence, proactive measures should be implemented to prevent nocturnal hypoglycaemic events, especially in individuals with consistently low blood glucose levels throughout the day, particularly those experiencing extremely low blood glucose levels and hypoglycaemia. By analysing clinical data including duration of diabetes, insulin and CGM parameters, the model provides individualised risk scores for the nocturnal hypoglycaemia of each patient and assists clinicians to categorise patients into different risk groups such as low, medium and high risk. Clinicians assess the impact of different pharmacological treatments on nocturnal hypoglycaemia risk and select the most appropriate medications and dosages. Personalised lifestyle modification advice can be provided to help patients manage their blood glucose levels better. Based on identifying high‐risk patients, hospitals can allocate nursing resources more effectively, ensuring that these patients receive increased attention and timely care. On the other hand, the frequency of blood glucose monitoring and hospital visits for low‐risk patients can be reduced, minimising the waste of healthcare resources.
6. Limitation
This study has some limitations. Firstly, all patients were from the same hospital in China, resulting in limitations in representativeness of the sample. Further external validation is needed to improve the generalisation ability of the model and adapt to different contexts. Secondly, the potential behavioural, psychological and social variables were not included in the development of the model. More predictors could be incorporated to improve the model. Thirdly, this study did not use data‐driven strategies for selecting the variables to include in the models, which might lead to an incomplete view of the features due to publication bias from literature review‐based feature selection. In future research, a combination of literature review and data‐driven strategies should be taken to improve the overall performance of the risk prediction model, including initially selecting a set of features using the literature review method and further screening the remaining features by data‐driven strategies such as statistical tests or machine learning algorithms.
7. Conclusion
In summary, the LGBM‐based prediction model for nocturnal hypoglycaemia in patients with T2DM demonstrates robust predictive performance. This model serves as a valuable reference for medical personnel to identify high‐risk groups for nocturnal hypoglycaemia early, thereby facilitating the development of targeted intervention programs. Nevertheless, the single‐centre design and limited sample diversity of this study present certain limitations. Future research should aim for a prospective cohort study involving multiple centres and larger sample sizes to enhance external validation and refine the predictive model.
Author Contributions
Chen Gong: original draft. Huiqun Huang: conceptualisation. Tingting Cai: review and editing. Ying Wang: formal analysis. Xuelian Xiong: review and editing. Yunfeng Zhou: formal analysis. Tingting Zhou: methodology. Qi Sun: conceptualisation. All authors approved this manuscript and accept accountability for this work.
Consent
This study adhered to the principles of the Helsinki Declaration. All individuals were informed of the use of their data and provided the right to withdraw. Informed consent was obtained from all participants included in this study. The data were used anonymously.
Conflicts of Interest
The authors declare no conflicts of interest.
Supporting information
Data S1.
Acknowledgements
We acknowledge grant funding of the Young Funds of Zhongshan Hospital, Fudan University (No. 2021ZSQN032). We thank Haikai Chen for the technical support.
Funding: This work was supported by the Young Funds of Zhongshan Hospital, Fudan University (2021ZSQN032).
Data Availability Statement
The data sets utilised during this study are available from the first author upon reasonable request.
References
- Agiostratidou, G. , Anhalt H., Ball D., et al. 2017. “Standardizing Clinically Meaningful Outcome Measures Beyond HbA1c for Type 1 Diabetes: A Consensus Report of the American Association of Clinical Endocrinologists, the American Association of Diabetes Educators, the American Diabetes Association, the Endocrine Society, JDRF International, the Leona M. and Harry B. Helmsley Charitable Trust, the Pediatric Endocrine Society, and the T1D Exchange.” Diabetes Care 40, no. 12: 1622–1630. [DOI] [PMC free article] [PubMed] [Google Scholar]
- Akirov, A. , Amitai O., Masri‐Iraqi H., et al. 2018. “Predictors of Hypoglycemia in Hospitalized Patients With Diabetes Mellitus.” Internal and Emergency Medicine 13, no. 3: 343–350. [DOI] [PubMed] [Google Scholar]
- Boureau, A. S. , Guyomarch B., Gourdy P., et al. 2023. “Nocturnal Hypoglycemia Is Underdiagnosed in Older People With Insulin‐Treated Type 2 Diabetes: The Hypoage Observational Study.” Journal of the American Geriatrics Society 71, no. 7: 2107–2119. [DOI] [PubMed] [Google Scholar]
- Bragd, J. , Adamson U., Bäcklund L. B., Lins P. E., Moberg E., and Oskarsson P.. 2008. “Can Glycaemic Variability, as Calculated From Blood Glucose Self‐Monitoring, Predict the Development of Complications in Type 1 Diabetes Over a Decade?” Diabetes & Metabolism 34, no. 6 Pt 1: 612–616. [DOI] [PubMed] [Google Scholar]
- Cichosz, S. L. , Frystyk J., Hejlesen O. K., et al. 2014. “A Novel Algorithm for Prediction and Detection of Hypoglycemia Based on Continuous Glucose Monitoring and Heart Rate Variability in Patients With Type 1 Diabetes.” Journal of Diabetes Science and Technology 8, no. 4: 731–737. [DOI] [PMC free article] [PubMed] [Google Scholar]
- Cichosz, S. L. , Frystyk J., Tarnow L., et al. 2015. “Combining Information of Autonomic Modulation and Cgm Measurements Enables Prediction and Improves Detection of Spontaneous Hypoglycemic Events.” Journal of Diabetes Science and Technology 9, no. 1: 132–137. [DOI] [PMC free article] [PubMed] [Google Scholar]
- Cichosz, S. L. , Jensen M. H., and Olesen S. S.. 2024. “Development and Validation of a Machine Learning Model to Predict Weekly Risk of Hypoglycemia in Patients With Type 1 Diabetes Based on Continuous Glucose Monitoring.” Diabetes Technology & Therapeutics 26, no. 7: 457–466. [DOI] [PubMed] [Google Scholar]
- Collins, G. S. , Reitsma J. B., Altman D. G., et al. 2015. “Transparent Reporting of a Multivariable Prediction Model for Individual Prognosis or Diagnosis (Tripod): The Tripod Statement.” BMJ 350: g7594. [DOI] [PubMed] [Google Scholar]
- Cryer, P. E. , Davis S. N., and Shamoon H.. 2003. “Hypoglycemia in Diabetes.” Diabetes Care 26, no. 6: 1902–1912. [DOI] [PubMed] [Google Scholar]
- Danne, T. , Nimri R., Battelino T., et al. 2017. “International Consensus on Use of Continuous Glucose Monitoring.” Diabetes Care 40, no. 12: 1631–1640. [DOI] [PMC free article] [PubMed] [Google Scholar]
- Davis, S. N. , Mann S., Briscoe V. J., et al. 2009. “Effects of Intensive Therapy and Antecedent Hypoglycemia on Counterregulatory Responses to Hypoglycemia in Type 2 Diabetes.” Diabetes 58, no. 3: 701–709. [DOI] [PMC free article] [PubMed] [Google Scholar]
- Delpino, F. M. , Costa Â. K., Farias S. R., et al. 2022. “Machine Learning for Predicting Chronic Diseases: A Systematic Review.” Public Health 205: 14–25. [DOI] [PubMed] [Google Scholar]
- Djulbegovic, B. , and Hozo I.. 2023. “Using Decision Curve Analysis to Evaluate Testing and/or Predictive Modeling.” Cancer Treatment and Research 189: 77–84. [DOI] [PubMed] [Google Scholar]
- Fleischer, J. , Hansen T. K., and Cichosz S. L.. 2022. “Hypoglycemia Event Prediction From Cgm Using Ensemble Learning.” Front Clin Diabetes Healthc 3: 1066744. [DOI] [PMC free article] [PubMed] [Google Scholar]
- Galassetti, P. , Tate D., Neill R. A., et al. 2003. “Effect of Antecedent Hypoglycemia on Counterregulatory Responses to Subsequent Euglycemic Exercise in Type 1 Diabetes.” Diabetes 52, no. 7: 1761–1769. [DOI] [PubMed] [Google Scholar]
- Gómez, A. M. , Muñoz O. M., Marin A., et al. 2018. “Different Indexes of Glycemic Variability as Identifiers of Patients With Risk of Hypoglycemia in Type 2 Diabetes Mellitus.” Journal of Diabetes Science and Technology 12, no. 5: 1007–1015. [DOI] [PMC free article] [PubMed] [Google Scholar]
- Gu, W. , Ren Y., Ji L., et al. 2016. “Non‐linear Associations of Risk Factors With Mild Hypoglycemia Among Chinese Patients With Type 2 Diabetes.” Journal of Diabetes and its Complications 30, no. 3: 462–468. [DOI] [PubMed] [Google Scholar]
- Guo, R. T. 2016. “Quantitative Index and Clinical Application of Blood Glucose Variation.” Chinese Journal of Diabetes 12: 1130–1134. [Google Scholar]
- Handa, T. , Nakamura A., Miya A., et al. 2021. “The Association Between Hypoglycemia and Glycemic Variability in Elderly Patients With Type 2 Diabetes: A Prospective Observational Study.” Diabetology and Metabolic Syndrome 13, no. 1: 37. [DOI] [PMC free article] [PubMed] [Google Scholar]
- Hannaford, L. , Cheng X., and Kunes‐Connell M.. 2021. “Predicting Nursing Baccalaureate Program Graduates Using Machine Learning Models: A Quantitative Research Study.” Nurse Education Today 99: 104784. [DOI] [PubMed] [Google Scholar]
- Hou, N. , Li M., He L., et al. 2020. “Predicting 30‐Days Mortality for Mimic‐Iii Patients With Sepsis‐3: A Machine Learning Approach Using Xgboost.” Journal of Translational Medicine 18, no. 1: 462. [DOI] [PMC free article] [PubMed] [Google Scholar]
- Hu, M. , Shu X., Yu G., et al. 2021. “A Risk Prediction Model Based on Machine Learning for Cognitive Impairment Among Chinese Community‐Dwelling Elderly People With Normal Cognition: Development and Validation Study.” Journal of Medical Internet Research 23, no. 2: e20298. [DOI] [PMC free article] [PubMed] [Google Scholar]
- Jensen, M. H. , Dethlefsen C., Vestergaard P., et al. 2020. “Prediction of Nocturnal Hypoglycemia From Continuous Glucose Monitoring Data in People With Type 1 Diabetes: A Proof‐Of‐Concept Study.” Journal of Diabetes Science and Technology 14, no. 2: 250–256. [DOI] [PMC free article] [PubMed] [Google Scholar]
- Kalsbeek, A. , La Fleur S., and Fliers E.. 2014. “Circadian Control of Glucose Metabolism.” Molecular Metabolism 3, no. 4: 372–383. [DOI] [PMC free article] [PubMed] [Google Scholar]
- Khunti, K. , Alsifri S., Aronson R., et al. 2016. “Rates and Predictors of Hypoglycaemia in 27 585 People From 24 Countries With Insulin‐Treated Type 1 and Type 2 Diabetes: The Global Hat Study.” Diabetes, Obesity & Metabolism 18, no. 9: 907–915. [DOI] [PMC free article] [PubMed] [Google Scholar]
- Klonoff, D. C. , Wang J., Rodbard D., et al. 2022. “A Glycemia Risk Index (Gri) of Hypoglycemia and Hyperglycemia for Continuous Glucose Monitoring Validated by Clinician Ratings.” Journal of Diabetes Science and Technology 17, no. 5: 1226–1242. [DOI] [PMC free article] [PubMed] [Google Scholar]
- Kovatchev, B. P. , Cox D. J., Gonder‐Frederick L. A., et al. 1998. “Assessment of Risk for Severe Hypoglycemia Among Adults With Iddm: Validation of the Low Blood Glucose Index.” Diabetes Care 21, no. 11: 1870–1875. [DOI] [PubMed] [Google Scholar]
- Li, X. , Yu S., Zhang Z., et al. 2019. “Predictive Modeling of Hypoglycemia for Clinical Decision Support in Evaluating Outpatients With Diabetes Mellitus.” Current Medical Research and Opinion 35, no. 11: 1885–1891. [DOI] [PubMed] [Google Scholar]
- Ling, Q. , Lu J., Li X., et al. 2020. “Value of Capillary Glucose Profiles in Assessing Risk of Nocturnal Hypoglycemia in Type 1 Diabetes Based on Continuous Glucose Monitoring.” Diabetes Ther 11, no. 4: 915–925. [DOI] [PMC free article] [PubMed] [Google Scholar]
- Mathioudakis, N. N. , Abusamaan M. S., Shakarchi A. F., et al. 2021. “Development and Validation of a Machine Learning Model to Predict Near‐Term Risk of Iatrogenic Hypoglycemia in Hospitalized Patients.” JAMA Network Open 4, no. 1: e2030913. [DOI] [PMC free article] [PubMed] [Google Scholar]
- Nguyen, A. T. , Pham H. Q., Nguyen T. X., et al. 2020. “Knowledge, Attitude and Practice of Elderly Outpatients With Type 2 Diabetes Mellitus in National Geriatric Hospital, Vietnam.” Diabetes Metab Syndr Obes 13: 3909–3917. [DOI] [PMC free article] [PubMed] [Google Scholar]
- Nicolas, M. N. , Estelle E., Shuvodra R., et al. 2018. “Development and Validation of a Prediction Model for Insulin‐Associated Hypoglycemia in Non‐critically Ill Hospitalized Adults.” BMJ Open Diabetes Research & Care 6, no. 1: e000499. [DOI] [PMC free article] [PubMed] [Google Scholar]
- O'brien, R. L. , and O'brien M. W.. 2021. “Ce: Nursing Orientation to Data Science and Machine Learning.” American Journal of Nursing 121, no. 4: 32–39. [DOI] [PubMed] [Google Scholar]
- Olveira, G. , Abuín J., López R., et al. 2020. “Risk Factors for Hypoglycemia in Inpatients With Total Parenteral Nutrition and Type 2 Diabetes: A Post Hoc Analysis of the Insupar Study.” Endocrine Practice 26, no. 6: 604–611. [DOI] [PubMed] [Google Scholar]
- Pilla, S. J. , Kraschnewski J. L., Lehman E. B., et al. 2021. “Hospital Utilization for Hypoglycemia Among Patients With Type 2 Diabetes Using Pooled Data From Six Health Systems.” BMJ Open Diabetes Research & Care 9, no. Suppl 1: e002153. [DOI] [PMC free article] [PubMed] [Google Scholar]
- Saeedi, P. , Petersohn I., Salpea P., et al. 2019. “Global and Regional Diabetes Prevalence Estimates for 2019 and Projections for 2030 and 2045: Results From the International Diabetes Federation Diabetes Atlas, 9th Edition.” Diabetes Research and Clinical Practice 157, no. C: 107843. [DOI] [PubMed] [Google Scholar]
- Saito, T. , and Rehmsmeier M.. 2015. “The Precision‐Recall Plot Is More Informative Than the Roc Plot When Evaluating Binary Classifiers on Imbalanced Datasets.” PLoS One 10, no. 3: e0118432. [DOI] [PMC free article] [PubMed] [Google Scholar]
- Sakurai, K. , Kawai Y., Yamazaki M., et al. 2018. “Prediction of Lowest Nocturnal Blood Glucose Level Based on Self‐Monitoring of Blood Glucose in Japanese Patients With Type 2 Diabetes.” Journal of Diabetes and its Complications 32, no. 12: 1118–1123. [DOI] [PubMed] [Google Scholar]
- Schlichtkrull, J. , Munck O., and Jersild M.. 1964. “m‐Value, an Index for Blood Sugar Control in Diabetics.” Ugeskrift for Laeger 126: 815–820. [PubMed] [Google Scholar]
- Schultes, B. , Jauch‐Chara K., Gais S., et al. 2007. “Defective Awakening Response to Nocturnal Hypoglycemia in Patients With Type 1 Diabetes Mellitus.” PLoS Medicine 4, no. 2: e69. [DOI] [PMC free article] [PubMed] [Google Scholar]
- Sheng, Y. , Zhang C., Huang J., et al. 2024. “Comparison of Conventional Mathematical Model and Machine Learning Model Based on Recent Advances in Mathematical Models for Predicting Diabetic Kidney Disease.” Digit Health 10: 20552076241238093. [DOI] [PMC free article] [PubMed] [Google Scholar]
- Spiller, T. R. , Tufan E., Petry H., et al. 2022. “Delirium Screening in an Acute Care Setting With a Machine Learning Classifier Based on Routinely Collected Nursing Data: A Model Development Study.” Journal of Psychiatric Research 156: 194–199. [DOI] [PubMed] [Google Scholar]
- St‐Onge, M. P. , Cherta‐Murillo A., Darimont C., et al. 2023. “The Interrelationship Between Sleep, Diet, and Glucose Metabolism.” Sleep Medicine Reviews 69: 101788. [DOI] [PMC free article] [PubMed] [Google Scholar]
- Sun, H. , Saeedi P., Karuranga S., et al. 2022. “Idf Diabetes Atlas: Global, Regional and Country‐Level Diabetes Prevalence Estimates for 2021 and Projections for 2045.” Diabetes Research and Clinical Practice 183: 109119. [DOI] [PMC free article] [PubMed] [Google Scholar]
- Tanae, A. , Hashimoto N., Kagawa J., et al. 1987. “Intensive Insulin Therapy—Effects on m‐Value and Frequency of Hypoglycemia.” Acta Paediatrica Japonica 29, no. 3: 373–377. [PubMed] [Google Scholar]
- The DCCT Research Group . 1991. “Epidemiology of Severe Hypoglycemia in the Diabetes Control and Complications Trial.” American Journal of Medicine 90, no. 4: 450–459. [PubMed] [Google Scholar]
- Thompson, J. , Hu J., Mudaranthakam D. P., et al. 2019. “Relevant Word Order Vectorization for Improved Natural Language Processing in Electronic Health Records.” Scientific Reports 9, no. 1: 9253. [DOI] [PMC free article] [PubMed] [Google Scholar]
- Thomsen, H. B. , Jakobsen M. M., Hecht‐Pedersen N., et al. 2023. “Prediction of Hypoglycemia From Continuous Glucose Monitoring in Insulin‐Treated Patients With Type 2 Diabetes Using Transfer Learning on Type 1 Diabetes Data: A Deep Transfer Learning Approach.” Journal of Diabetes Science and Technology. Published ahead of print, November 28, 2023. [DOI] [PMC free article] [PubMed] [Google Scholar]
- Torimoto, K. , Okada Y., Hajime M., et al. 2018. “Risk Factors of Hypoglycemia in Patients With Type 2 Diabetes Mellitus: A Study Based on Continuous Glucose Monitoring.” Diabetes Technology & Therapeutics 20, no. 9: 603–612. [DOI] [PubMed] [Google Scholar]
- UK Hypoglycaemia Study Group . 2007. “Risk of Hypoglycaemia in Types 1 and 2 Diabetes: Effects of Treatment Modalities and Their Duration.” Diabetologia 50, no. 6: 1140–1147. [DOI] [PubMed] [Google Scholar]
- Vu, L. , Kefayati S., Idé T., et al. 2020. “Predicting Nocturnal Hypoglycemia From Continuous Glucose Monitoring Data With Extended Prediction Horizon.” American Medical Informatics Association Annual Symposium Proceedings 2019: 874–882. [PMC free article] [PubMed] [Google Scholar]
- WHO . 2018. “Diabetes fact sheet [Internet].” Cited May 8. http://www.who.int/mediacentre/factsheets/fs312/en/.
- Xie, Q. , Wang X., Pei J., et al. 2022. “Machine Learning‐Based Prediction Models for Delirium: A Systematic Review and Meta‐Analysis.” Journal of the American Medical Directors Association 23, no. 10: 1655–1668.e1656. [DOI] [PubMed] [Google Scholar]
- Yuan, L. , Yang X. L., Wang N., et al. 2021. “Research Progress of Hypoglycemia Prediction Model in Hospitalized Patients.” Nursing Management in China 21, no. 8: 1140–1144. [Google Scholar]
Associated Data
This section collects any data citations, data availability statements, or supplementary materials included in this article.
Supplementary Materials
Data S1.
Data Availability Statement
The data sets utilised during this study are available from the first author upon reasonable request.