

Abstract
Interactions between protein kinases and their substrates are critical for the modulation of complex signaling pathways. Currently, there is a large amount of information available about kinases and their substrates in disparate public databases. However, these data are difficult to interpret in the context of cellular systems, which can be facilitated by examining interactions among multiple proteins at once, such as the network of interactions that constitute a signaling pathway. We present KiNet, a user-friendly web portal that integrates and shares information about kinase-substrate interactions from multiple databases of post-translational modifications. KiNet enables the visual exploration of these interactions in systems contexts, such as pathways, domain families, and custom protein set inputs, in an interactive fashion. We expect KiNet to be useful as a knowledge discovery tool for kinase-substrate interactions, and the aggregated KiNet dataset to be useful for protein kinase studies and systems-level analyses. The portal is available at https://kinet.kinametrix.com/.
Subject terms: Regulatory networks, Biochemical networks, Software, Software
Introduction
Kinase proteins and their substrates are critical to cell signaling1–4. Dysregulation of kinases is involved in multiple pathologies, such as cancer, neurodegeneration, cardiovascular disease and infectious diseases, making kinases and their substrates priority targets for drug development5–7. Kinase-substrate interactions are known to be complex, where, for example, a particular kinase can phosphorylate multiple substrates, or a particular substrate can be phosphorylated by multiple kinases at one or more site(s)4,8,9. Understanding kinase function requires examining these interactions at multiple scales, from their structural aspects10–13, to their participation in specific pathways14–18, to the systems-level effects that they produce3,4,9,19.
Currently, there is a wealth of information available about kinase-substrate interactions disseminated by a number of public tools and web portals. Some focus on molecular features of kinases, such as their structural conformations (e.g., KinaMetrix10 and KinCore11) and druggability (e.g., KLIFS12). Others focus on molecular features of substrates targeted by kinases, specifically phosphorylation sites (e.g., PhosphoSitePlus20, iPTMNet21 and EPSD22) and motifs (e.g., The Kinase Library13). There are also portals that focus on phylogenetic classification of kinases (e.g., KinHub23 and Coral24) and information about understudied kinases (e.g., The Dark Kinome Knowledgebase25). Additionally, extensive information about kinase interactions is available in protein databases like UniProt26 and BioGRID27. However, only a relatively small fraction of the available data on these interactions is interpretable in a functional context. For example, the vast majority of experimentally known phosphorylation sites have no associated kinase(s)20,21. Of the known kinase-substrate interactions, only a few well-understood ones have been incorporated into curated pathway databases (e.g., KEGG28, Reactome29 and PathwayCommons30). Thus, there is an opportunity to learn more about kinase function by visualizing and analyzing kinase-substrate interactions in the context of functional groupings like subnetworks and pathways.
To address this important need, we have developed the KiNet (Kinase Network) web portal for aggregating, sharing and visualizing kinase-substrate interactions in the human genome. KiNet aggregates and shares a comprehensive dataset of kinase-substrate interactions from PhosphoSitePlus20, iPTMNet21 and EPSD22, which are three large databases of post-translational modifications with recent and regular updates, and, which also provide coverage of several other data sources. KiNet provides multiple ways to visualize these interactions in varied functional/systems contexts, such as pathways, domain families and custom sets of genes provided by the user (e.g., from gene expression studies). Collectively, the data and visualization capabilities provided by KiNet represent a unique resource for exploring kinase-substrate interactions that complement the current ecosystem of tools for analyzing kinase data.
Results
Below, we describe the kinase-substrate interaction dataset constituting KiNet, as well as the functionalities of the web portal summarized in Fig. 1. The materials and methods used to prepare this dataset, web portal and the results presented in this section are described in “Methods”.
Fig. 1. KiNet functionalities.

The KiNet web portal aggregates, shares and visualizes kinase-substrate interactions in the human genome from established databases of post-translational modifications. a Choosing sets of proteins. The tabs highlighted provide different ways to select sets of proteins for which kinase-substrate interactions will be displayed: individual proteins and their interactors, curated pathways from KEGG, protein families mapped to InterPro domains, and custom protein sets provided by the user. b Visualizing kinase-substrate interactions. Interactions within the selected set are shown as a network of directed edges from kinase nodes to substrate nodes. Kinase nodes are colored by kinase group and non-kinase nodes are colored gray. c Interacting with the visualization. The left sidebar shows the legend for node colors, an option for including proteins that are one degree away from the selected set, an option for unhiding nodes without edges, and other layout and export/download options. d Provenance of data. When the user selects an interaction (edge) in the displayed network, the right panel displays additional information about it, including UniProt links to the kinase and substrate, phosphorylation sites, the database(s) from which it was obtained, and supporting evidence type(s) and reference(s) (PMIDs). The user can follow the links in this panel to obtain further information about the selected interaction. The specific example shown in this figure is the p53 signaling pathway visualized in the Pathway tab with the CDK2 → CDKN1A interaction selected.
The KiNet dataset
The data aggregated from the most recent versions of PhosphoSite, iPTMNet and EPSD consisted of 16,360 unique kinase-substrate-site triples, representing 8365 unique kinase-substrate pairs involving 416 kinases and 2707 non-kinases. When we analyzed the original data source of each pair, we found that the three databases overlapped substantially, but also contributed several unique interactions individually (Fig. 2a). A majority of the interactions in the resulting dataset were between kinases and non-kinases, but there were also a notable number of autophosphorylations (n = 229) and interactions between non-unique pairs of kinases (n = 1016) (Fig. 2b). A small number of kinases and substrates dominated a large number of interactions (Supplementary Fig. 1). The full dataset can be downloaded directly from the portal.
Fig. 2. Kinase-substrate interaction statistics in the KiNet dataset.
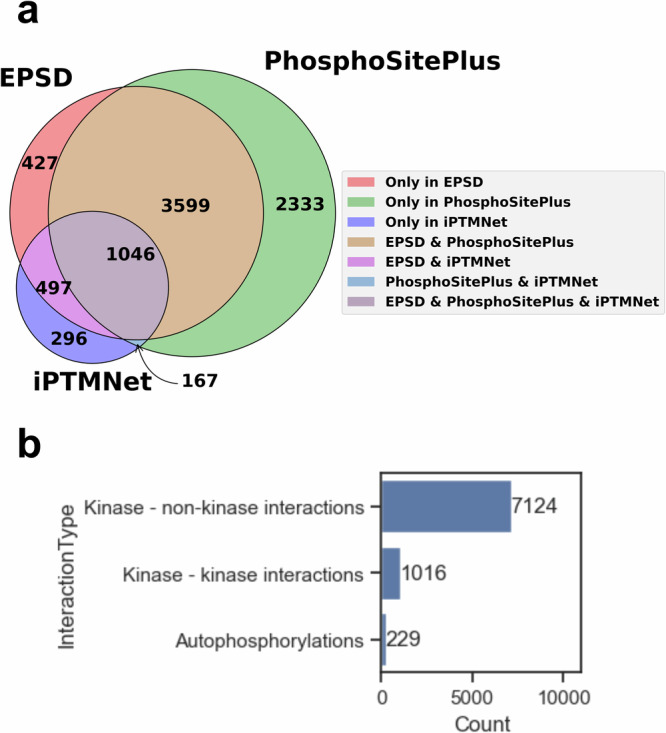
KiNet aggregated a dataset of 8365 kinase-substrate interactions from the PhosphoSitePlus, EPSD and iPTMNet databases. a Breakdown of interactions by data sources. The three sources overlapped, but also contributed unique interactions to the KiNet dataset. b Breakdown of data by interaction types. The majority of the interactions include interactions between kinases and non-kinases (n = 7124), but a substantial number of interactions either involved two different kinases (n = 1016), or were autophosphorylations (n = 229).
Exploring interactions of individual proteins with KiNet
KiNet can be used to identify kinase-substrate interactions among sets of proteins of interest to the user (Fig. 3). The Proteins tab displays the known interactions of a protein selected by the user, which may be a kinase or a non-kinase. The network produced is a system-wide summary of kinase regulation involving the protein. For example, consider the visualization centered on BRAF, a well-known oncoprotein and component of the MAPK signaling pathway31 (Fig. 3a). Outgoing edges from BRAF highlight substrates of BRAF, which not only include the canonical MAP2K1 and MAP2K2 kinases, but also non-kinases with diverse functions, such as the apoptosis promoter BAD32, the translation elongation factors EEF1A and EEF1A233, and the ion transporter SLC9A134. Incoming edges to BRAF indicate kinases that regulate BRAF, such as AKT135 and AKT336, as well as feedback from downstream proteins like MAPK1 and MAPK337. This visualization is also effective for non-kinases. For example, the network centered on SLC9A1 (Fig. 3b) displays the diverse range of kinases it interacts with in addition to BRAF, such as RPS6KA1 and ROCK kinases38, as well as AKT139 and MAPK140. Finally, the visualization permits traversing the network: double-clicking on a node recenters the visualization on the corresponding protein.
Fig. 3. Exploring kinase-substrate interactions of proteins using KiNet.

The Proteins tab displays all interactions of a selected protein. a Interactions of the kinase BRAF. Outgoing edges point to proteins phosphorylated by BRAF, such as MAP2Ks and non-kinases EEF1As and SLC9A1. Incoming edges indicate kinases that phosphorylate BRAF such as AKTs as well as downstream MAPKs. b Interactions of the non-kinase SLC9A1. Incoming edges indicate interactions with multiple kinases such as BRAF, AKT1 and ROCK1. The Custom protein sets tab lets the user specify any set of proteins within which to visualize interactions. The user can expand the network by selecting the option to include proteins adjacent to the selected set. c EGFR-INSR crosstalk. A custom set of proteins focused on overlap between EGFR and INSR pathways. d Comparing RAF kinases. The expanded network for the custom set of BRAF and RAF1 can be used to elucidate their shared versus exclusive interactions. e Comparing EEF1A proteins. The expanded network for the custom set of EEF1A1 and EEF1A2 shows the differences in the interactions they have with various kinases.
The Custom protein sets tab visualizes the kinase-substrate interactions among a set of proteins provided by the user. This allows the user to generate networks for any functional context of interest. For example, a user interested in the overlap between insulin receptor (INSR) and EGFR pathways41 can display the interactions involving the receptors EGFR and INSR and a select set of downstream proteins like the kinase MAPK1, the scaffold protein GAB1, insulin substrate IRS1 and the phosphatase PTPN1 (Fig. 3c).
To explore additional interactions relevant to the proteins of interest, the user can select the option in the sidebar to include kinases and substrates that interact with the proteins shown in a network. For example, when we enable this option for the custom set of BRAF and RAF1, the network produced includes several new proteins (Fig. 3d). Notably, it enables a systems-level comparison of BRAF and RAF1: we can delineate interactions common to BRAF and RAF1 on the diagram (e.g., MAP2K1) versus interactions unique to them (e.g., AKT3 and SRC). This approach is useful for non-kinases also. For example, we can see that the dataset includes more interactions with kinases for EEF1A1 than for EEF1A2 (Fig. 3e).
Exploring pathways with KiNet
KiNet can be used to examine kinase-substrate interactions among proteins in specific pathways of interest, as well as make inferences (Fig. 4). Specifically, the Pathways tab enables visualizing and analyzing kinase-substrate interactions in several curated pathways from the KEGG database28. For example, when examining the network produced for the p53 signaling pathway (Fig. 1), one can identify various kinases involved in checkpoint signaling42 such as checkpoint kinases (CHEK1 and CHEK2), DNA damage sensors (ATM and ATR), multiple cyclin-dependent kinases (CDKs) and others. Additionally, one can identify several important non-kinases including tumor suppressors TP53 and TP73, the oncogene MDM2, caspases (CASP8, CASP9), cyclins (CCNB1, CCNE1), among others. This view of the pathway is complementary to other visualizations28–30 used by the community, as it focuses on kinase-substrate interactions.
Fig. 4. Exploring kinase-substrate interactions in functional contexts, such as pathways and shared domains using KiNet.

The Pathways tab displays interactions from a selected pathway from KEGG database. The Domains tab displays interactions of proteins that share a selected domain. If the selected protein sets do not include kinases, expanding the network to include adjacent proteins can reveal regulatory interactions. a The folate biosynthesis pathway. This network, selected in the Pathways tab, shows a number of metabolic enzymes and no kinase-substrate interactions. b The expanded view reveals regulatory interactions such as phosphorylation of SPR by CAMK2 kinases. c Proteins with the histone deacetylase domain. This network, selected in the Domains tab contains multiple HDAC proteins and no kinases. d The expanded view reveals the wide range of kinases that phosphorylate HDACs, as well as other interactions.
The grid layout option can be effective for exploring pathways with large protein sets, such as MAPK signaling (Supplementary Fig. 2). However, for several pathways, the defined protein sets include many kinase substrates but not kinases. In these cases, the sidebar option to include adjacent proteins can be useful for discovering regulatory interactions. For example, expanding the currently disconnected KiNet network of the folate biosynthesis pathway (Fig. 4a) revealed kinases that target metabolic enzymes in the pathway (Fig. 4b), such as CAMK2 kinases targeting SPR43, an enzyme involved in several disease pathologies44.
Finally, to assess the general usefulness of the KiNet data for understanding pathways, we examined the enrichment of KEGG pathways in the kinase substrates included in the dataset using the Enrichr platform45,46. This analysis highlighted 201 significantly enriched pathways in 6 KEGG categories (Supplementary Fig. 3a), including environmental information processing (receptor- and small-molecule-activated pathways), genetic information processing (transcription, replication, DNA repair etc.), metabolism, cell-scale phenomena (cell cycle, autophagy, motility etc.), organism-level systems (endocrine, digestive, circulatory, etc.), and a range of human pathologies, such as cancer, infectious disease, cardiovascular disease and neurodegeneration. The full set of enriched pathways and the corresponding p values are reported in Supplementary Table 2.
The above examples and results demonstrate the utility of KiNet and its underlying data for systems biology, specifically pathway analyses.
Exploring domain groups with KiNet
KiNet can be also used to examine domain composition of kinases and substrates from a systems perspective. Specifically, the Domains tab enables selecting sets of kinases and substrates that share InterPro domains47, and potentially highlight shared patterns of regulation. For example, the network for the SH3 domain (Supplementary Fig. 4) highlights its close association with Src-type kinases like SRC, FYN, FGR, LCK, LYN etc48. Additionally, InterPro domains can serve as an entry point for examining kinase regulation in a functional context. For example, phosphorylation of histone deacetylases (HDACs) is essential to normal physiological function49, and in recent years, was found to be disrupted by pathogens like SARS-CoV250. Selecting the option to include adjacent proteins expands the currently disconnected KiNet network of the histone deacetylase domain (Fig. 4c) and enables a broader examination of kinases that phosphorylate HDACs (Fig. 4d).
Finally, to assess the general utility of KiNet and its data for functional studies based on domain composition, we conducted an enrichment analysis of the kinase substrates included therein against InterPro domain annotations using Enrichr45,46. The analysis produced 147 significantly enriched InterPro terms. Although there is no universally accepted functional classification of domain terms, we identified five general functional categories among the enriched terms (Supplementary Fig. 3b): nuclear functions (e.g., DNA-binding, RNA recognition and other mechanisms involved in transcription, replication, chromatin remodeling, etc.), cytoplasmic proteins with primarily protein-binding function (e.g., adapters, scaffolds, small-molecule sensors, and ligand receptors), proteins with catalytic function (e.g., kinases, phosphatases, phosphodiesterases, lipid kinases, GTPases, and peptidases), structural proteins that are part of the cytoskeleton and extracellular matrix, and membrane proteins with transport function (e.g., ion channels and permeases). The full set of enriched domain terms and the corresponding p values are reported in Supplementary Table 3.
The above examples and results highlight the usefulness of the KiNet dataset for users interested in protein function represented by domain composition.
Discussion
The KiNet web portal is a user-friendly resource for exploration and systems analysis of interactions between human protein kinases and their substrates. KiNet aggregates and shares kinase-substrate interactions from several established databases of post-translational modifications, and helps visualize this dataset as interactive networks. Specifically, the portal provides multiple ways to specify protein sets of interest for visualization, such as interactomes of individual proteins, proteins organized into pathways, proteins sharing domains, and user-defined custom protein sets. Individual interactions highlighted on these visualizations can be traced back to database sources and their corresponding literature references. The aggregated KiNet dataset is a useful resource for future kinase studies and systems-level analyses, as was demonstrated using functional enrichment analysis of these data with biological pathways and domains. The results from the dataset and the visualization features highlighted in this paper illustrate the utility of the KiNet resource for systems-level study and applications of kinases and their substrates.
Methods
Aggregating kinase-substrate interaction data
The set of known human kinase-substrate interactions is continuously evolving. As a consequence, there are a large number of kinase-substrate interaction databases that overlap with each other significantly51. They are also maintained to different extents, and are standardized, e.g., in the proteins names they use, to different extents.
To build a comprehensive dataset of kinase-substrate interactions, we selected resources capturing the largest amount of public information, and with the most recent and regular updates. Additionally, it was important that the resources we selected contain references for each interaction, typically to the original publication, for data provenance. Three resources fit our criteria:
PhosphoSitePlus20, the largest continuously maintained database of expert-curated kinase-substrate interactions;
iPTMNet21, a database that curates information from PhosphoSitePlus and PhosphoELM52, as well as information extracted by text-mining of scientific literature;
EPSD22, an annotated collection of multiple curated databases, including PhosphoELM, PSEA53, PostMOD54, and RegPhos55, as well as a subset of PhosphoSitePlus.
We aggregated kinase-substrate interactions from the most current versions of the respective databases as of October 4th, 2023 (PhosphoSitePlus v6.7.1.1, iPTMNet v5.0, EPSD v1.0). To standardize protein and gene names, we cross-referenced them with protein identifiers from the reviewed subset of the UniProt human proteome26 and gene symbols from HGNC56 current on the same date. Additionally, we incorporated kinase-specific data from KinHub23, Coral24 and the Dark Kinome Knowledgebase25, such as memberships of kinase proteins in phylogenetic groups57.
Each entry in the aggregated KiNet dataset is a triplet involving a kinase, a substrate and the site on the latter phosphorylated by the kinase. From these, we extracted unique kinase-substrate pairs, which in turn constitute the kinase-substrate interaction network used for visualizations on KiNet. The full interaction dataset, along with associated information like the source database(s), can be downloaded from the portal directly.
The KiNet portal and interface
KiNet is a web-based portal for sharing and visualizing the network of human kinase-substrate interactions (Fig. 1). The portal is available at https://kinet.kinametrix.com/, and was built as a Shiny58 web app in the R ecosystem. The different tabs and their layouts were constructed using the flexdashboard59 package. Network visualizations were constructed using the visNetwork60 package, and layouts are computed using the igraph61 package. The portal is deployed on Amazon Web services. A full list of the resources used to construct KiNet is provided in Supplementary Table 1.
One of the main features of KiNet is the ability to visualize known kinase-substrate interactions within selected sets of proteins as a network diagram. KiNet provides multiple ways to select these sets of proteins (Fig. 1a), organized into four main tabs on the portal:
select a single protein on the Proteins tab,
select one of several curated pathway from KEGG28 on the Pathways tab,
select one of several InterPro47 domains on the Domains tab, and
provide a set of proteins on the Custom protein sets tab.
The network diagram produced (Fig. 1b) displays kinase and non-kinase proteins in the selected set as colored and gray nodes respectively. Kinase nodes are colored by their phylogenetic group membership23,24,57. Interactions from kinases to their respective substrates are represented as directed edges. Autophosphorylations are shown by directed edges from and to the same node. Mutual phosphorylation events between two kinases are shown as a pair of directed edges starting and ending at each of the two kinases. The user can move nodes around, as well as zoom in or out, to find the most meaningful layout for the displayed network. The left sidebar (Fig. 1c) includes additional layout choices, as well as the option to unhide proteins with no interaction data. The user can also expand the network to include additional proteins adjacent to those in the selected set. Finally, the visualized network can be downloaded as an image (PNG), table of interactions (CSV) or in commonly used graph formats (GML62, GraphML63 and DOT64).
Notably, data can be traced back to their original source(s). When the user clicks on an edge in a network diagram, the panel on the right (Fig. 1c) displays information about the corresponding interaction, including:
the name of the kinase, and a link to its UniProt page,
the name of the substrate, and a link to its UniProt page,
a list of the known sites on the substrate phosphorylated by the kinase, along with their preceding and subsequent sequences of up to seven amino acids each,
the original database source(s) from which the interaction was obtained, along with the type of supporting evidence in the corresponding database(s), and,
links to the supporting references from the database source(s) presented as PubMed IDs.
The user can follow the various URLs in this information panel to retrieve additional information about the substrate, kinase and/or the interaction. The above information is also included in the CSV version of the visualized network that can be downloaded from KiNet.
Functional analyses of kinase substrates
To examine kinase-modulated cellular functions represented in the KiNet dataset, we performed gene set enrichment on all substrates included against InterPro domains47 and KEGG pathways28. Specifically, we used the GSEAPy65 software to run these enrichment analyses on the Enrichr45 platform against the InterPro_Domains_2019 and KEGG_2021_Human gene set libraries. We used the hypergeometric test at a significance level of 0.05 with correction for multiple hypotheses testing applied using the Benjamini-Hochberg procedure66.
Supplementary information
Acknowledgements
We thank David Stein for assisting with web portal deployment, as well as Noah Herrington for proof-reading this manuscript and providing useful comments. We also thank Yu Xue from EPSD and Hongzhan Huang and Cathy Wu from iPTMnet for their technical help. This work was supported by NIH grant U01CA271318.
Author contributions
Conceptualization, data curation, writing (original draft) by J.A.P.S.; Visualization, software development by J.A.P.S. and Y.C.L.; Writing (review & editing) by J.A.P.S., A.S., and G.P.; Resources, supervision, project administration, funding acquisition by A.S. and G.P.
Data availability
The KiNet portal is available at https://kinet.kinametrix.com/. The paper aggregates and analyzes publicly available data. The aggregated dataset and open-source code for the portal is maintained at https://github.com/GauravPandeyLab/KiNet and was also deposited at https://zenodo.org/doi/10.5281/zenodo.10212985 on November 28, 2023. A full list of data and software resources used is provided in Supplementary Table 1.
Competing interests
The authors declare no competing interests.
Footnotes
Publisher’s note Springer Nature remains neutral with regard to jurisdictional claims in published maps and institutional affiliations.
These authors contributed equally: John A. P. Sekar, Yan Chak Li.
Contributor Information
Avner Schlessinger, Email: avner.schlessinger@mssm.edu.
Gaurav Pandey, Email: gaurav.pandey@mssm.edu.
Supplementary information
The online version contains supplementary material available at 10.1038/s41540-024-00442-5.
References
- 1.Fischer, E. H. Cellular regulation by protein phosphorylation: a historical overview. BioFactors6, 367–374 (1997). [DOI] [PubMed] [Google Scholar]
- 2.Pawson, T. & Scott, J. D. Protein phosphorylation in signaling—50 years and counting. Trends Biochem. Sci.30, 286–290 (2005). [DOI] [PubMed] [Google Scholar]
- 3.Fleuren, E. D. G., Zhang, L., Wu, J. & Daly, R. J. The kinome ‘at large’ in cancer. Nat. Rev. Cancer16, 83–98 (2016). [DOI] [PubMed] [Google Scholar]
- 4.Alganem, K. et al. The active kinome: the modern view of how active protein kinase networks fit in biological research. Curr. Opin. Pharmacol.62, 117–129 (2022). [DOI] [PMC free article] [PubMed] [Google Scholar]
- 5.Wu, P., Nielsen, T. E. & Clausen, M. H. FDA-approved small-molecule kinase inhibitors. Trends Pharmacol. Sci.36, 422–439 (2015). [DOI] [PubMed] [Google Scholar]
- 6.Berndt, N., Karim, R. M. & Schönbrunn, E. Advances of small molecule targeting of kinases. Curr. Opin. Chem. Biol.39, 126–132 (2017). [DOI] [PMC free article] [PubMed] [Google Scholar]
- 7.Munoz, L. Non-kinase targets of protein kinase inhibitors. Nat. Rev. Drug Discov.16, 424–440 (2017). [DOI] [PubMed] [Google Scholar]
- 8.Huttlin, E. L. et al. Architecture of the human interactome defines protein communities and disease networks. Nature545, 505–509 (2017). [DOI] [PMC free article] [PubMed] [Google Scholar]
- 9.Buljan, M. et al. Kinase interaction network expands functional and disease roles of human kinases. Mol. Cell79, 504–520.e9 (2020). [DOI] [PMC free article] [PubMed] [Google Scholar]
- 10.Rahman, R., Ung, P. M.-U. & Schlessinger, A. KinaMetrix: a web resource to investigate kinase conformations and inhibitor space. Nucleic Acids Res.47, D361–D366 (2019). [DOI] [PMC free article] [PubMed] [Google Scholar]
- 11.Modi, V. & Dunbrack, R. L. Jr. Kincore: a web resource for structural classification of protein kinases and their inhibitors. Nucleic Acids Res.50, D654–D664 (2022). [DOI] [PMC free article] [PubMed] [Google Scholar]
- 12.Kooistra, A. J. et al. KLIFS: a structural kinase-ligand interaction database. Nucleic Acids Res.44, D365–D371 (2016). [DOI] [PMC free article] [PubMed] [Google Scholar]
- 13.Johnson, J. L. et al. An atlas of substrate specificities for the human serine/threonine kinome. Nature613, 759–766 (2023). [DOI] [PMC free article] [PubMed] [Google Scholar]
- 14.Sanchez-Vega, F. et al. Oncogenic signaling pathways in The Cancer Genome Atlas. Cell173, 321–337.e10 (2018). [DOI] [PMC free article] [PubMed] [Google Scholar]
- 15.Lemmon, M. A. & Schlessinger, J. Cell signaling by receptor-tyrosine kinases. Cell141, 1117–1134 (2010). [DOI] [PMC free article] [PubMed] [Google Scholar]
- 16.Pearce, L. R., Komander, D. & Alessi, D. R. The nuts and bolts of AGC protein kinases. Nat. Rev. Mol. Cell Biol.11, 9–22 (2010). [DOI] [PubMed] [Google Scholar]
- 17.Varjosalo, M. et al. The protein interaction landscape of the human CMGC kinase group. Cell Rep.3, 1306–1320 (2013). [DOI] [PubMed] [Google Scholar]
- 18.Ullah, R., Yin, Q., Snell, A. H. & Wan, L. RAF-MEK-ERK pathway in cancer evolution and treatment. Semin. Cancer Biol.85, 123–154 (2022). [DOI] [PubMed] [Google Scholar]
- 19.Vasta, J. D. et al. Quantitative, wide-spectrum kinase profiling in live cells for assessing the effect of cellular ATP on target engagement. Cell Chem. Biol.25, 206–214.e11 (2018). [DOI] [PMC free article] [PubMed] [Google Scholar]
- 20.Hornbeck, P. V. et al. 15 years of PhosphoSitePlus®: integrating post-translationally modified sites, disease variants and isoforms. Nucleic Acids Res.47, D433–D441 (2019). [DOI] [PMC free article] [PubMed] [Google Scholar]
- 21.Huang, H. et al. iPTMnet: an integrated resource for protein post-translational modification network discovery. Nucleic Acids Res.46, D542–D550 (2018). [DOI] [PMC free article] [PubMed] [Google Scholar]
- 22.Lin, S. et al. EPSD: a well-annotated data resource of protein phosphorylation sites in eukaryotes. Brief. Bioinform.22, 298–307 (2021). [DOI] [PubMed] [Google Scholar]
- 23.Eid, S., Turk, S., Volkamer, A., Rippmann, F. & Fulle, S. KinMap: a web-based tool for interactive navigation through human kinome data. BMC Bioinforma.18, 1–6 (2017). [DOI] [PMC free article] [PubMed] [Google Scholar]
- 24.Metz, K. S. et al. Coral: clear and customizable visualization of human kinome data. Cell Syst.7, 347–350.e1 (2018). [DOI] [PMC free article] [PubMed] [Google Scholar]
- 25.Berginski, M. E. et al. The Dark Kinase Knowledgebase: an online compendium of knowledge and experimental results of understudied kinases. Nucleic Acids Res.49, D529–D535 (2021). [DOI] [PMC free article] [PubMed] [Google Scholar]
- 26.Breuza, L. et al. The UniProtKB guide to the human proteome. Database2016, bav120 (2016). [DOI] [PMC free article] [PubMed] [Google Scholar]
- 27.Oughtred, R. et al. The BioGRID database: a comprehensive biomedical resource of curated protein, genetic, and chemical interactions. Protein Sci.30, 187–200 (2021). [DOI] [PMC free article] [PubMed] [Google Scholar]
- 28.Kanehisa, M., Sato, Y., Kawashima, M., Furumichi, M. & Tanabe, M. KEGG as a reference resource for gene and protein annotation. Nucleic Acids Res.44, D457–D462 (2016). [DOI] [PMC free article] [PubMed] [Google Scholar]
- 29.Jassal, B. et al. The reactome pathway knowledgebase. Nucleic Acids Res.48, D498–D503 (2020). [DOI] [PMC free article] [PubMed] [Google Scholar]
- 30.Rodchenkov, I. et al. Pathway Commons 2019 update: integration, analysis and exploration of pathway data. Nucleic Acids Res.48, D489–D497 (2020). [DOI] [PMC free article] [PubMed] [Google Scholar]
- 31.Morrison, D. K. MAP Kinase Pathways. Cold Spring Harb. Perspect. Biol.4, a011254 (2012). [DOI] [PMC free article] [PubMed] [Google Scholar]
- 32.Polzien, L. et al. Identification of novel in vivo phosphorylation sites of the human proapoptotic protein BAD: pore-forming activity of bad is regulated by phosphorylation. J. Biol. Chem.284, 28004–28020 (2009). [DOI] [PMC free article] [PubMed] [Google Scholar]
- 33.Sanges, C. et al. Raf kinases mediate the phosphorylation of eukaryotic translation elongation factor 1A and regulate its stability in eukaryotic cells. Cell Death Dis.3, e276–e276 (2012). [DOI] [PMC free article] [PubMed] [Google Scholar]
- 34.Li, X., Augustine, A., Sun, D., Li, L. & Fliegel, L. Activation of the Na+/H+ exchanger in isolated cardiomyocytes through β-Raf dependent pathways. Role of Thr653 of the cytosolic tail. J. Mol. Cell. Cardiol.99, 65–75 (2016). [DOI] [PubMed] [Google Scholar]
- 35.Guan, K.-L. et al. Negative regulation of the serine/threonine kinase B-Raf by Akt. J. Biol. Chem.275, 27354–27359 (2000). [DOI] [PubMed] [Google Scholar]
- 36.Cheung, M., Sharma, A., Madhunapantula, S. V. & Robertson, G. P. Akt3 and mutant V600E B-Raf cooperate to promote early melanoma development. Cancer Res.68, 3429–3439 (2008). [DOI] [PMC free article] [PubMed] [Google Scholar]
- 37.Duan, L. & Cobb, M. H. Calcineurin increases glucose activation of ERK1/2 by reversing negative feedback. Proc. Natl Acad. Sci. USA107, 22314–22319 (2010). [DOI] [PMC free article] [PubMed] [Google Scholar]
- 38.Wallert, M. A. et al. RhoA kinase (Rock) and p90 ribosomal S6 kinase (p90Rsk) phosphorylation of the sodium hydrogen exchanger (NHE1) is required for lysophosphatidic acid-induced transport, cytoskeletal organization and migration. Cell. Signal.27, 498–509 (2015). [DOI] [PMC free article] [PubMed] [Google Scholar]
- 39.Snabaitis, A. K., Cuello, F. & Avkiran, M. Protein kinase B/Akt phosphorylates and inhibits the cardiac Na+/H+ exchanger NHE1. Circ. Res.103, 881–890 (2008). [DOI] [PubMed] [Google Scholar]
- 40.Hendus-Altenburger, R. et al. A phosphorylation-motif for tuneable helix stabilisation in intrinsically disordered proteins—lessons from the sodium proton exchanger 1 (NHE1). Cell. Signal.37, 40–51 (2017). [DOI] [PubMed] [Google Scholar]
- 41.Borisov, N. et al. Systems-level interactions between insulin–EGF networks amplify mitogenic signaling. Mol. Syst. Biol.5, 256 (2009). [DOI] [PMC free article] [PubMed] [Google Scholar]
- 42.Barnum, K. J. & O’Connell, M. J. Cell cycle regulation by checkpoints. In Cell Cycle Control: Mechanisms and Protocols (eds Noguchi, E. & Gadaleta, M. C.) 29–40 (Springer, 2014). [DOI] [PMC free article] [PubMed]
- 43.Fujimoto, K., Takahashi, S. Y. & Katoh, S. Mutational analysis of sites in sepiapterin reductase phosphorylated by Ca2+/calmodulin-dependent protein kinase II. Biochim. Biophys. Acta BBA Protein Struct. Mol. Enzymol.1594, 191–198 (2002). [DOI] [PubMed] [Google Scholar]
- 44.Wu, Y. et al. Sepiapterin reductase: characteristics and role in diseases. J. Cell. Mol. Med.24, 9495–9506 (2020). [DOI] [PMC free article] [PubMed] [Google Scholar]
- 45.Xie, Z. et al. Gene set knowledge discovery with Enrichr. Curr. Protoc.1, e90 (2021). [DOI] [PMC free article] [PubMed] [Google Scholar]
- 46.Kuleshov, M. V. et al. Enrichr: a comprehensive gene set enrichment analysis web server 2016 update. Nucleic Acids Res.44, W90–W97 (2016). [DOI] [PMC free article] [PubMed] [Google Scholar]
- 47.Paysan-Lafosse, T. et al. InterPro in 2022. Nucleic Acids Res.51, D418–D427 (2023). [DOI] [PMC free article] [PubMed] [Google Scholar]
- 48.Kurochkina, N. & Guha, U. SH3 domains: modules of protein–protein interactions. Biophys. Rev.5, 29–39 (2013). [DOI] [PMC free article] [PubMed] [Google Scholar]
- 49.Bahl, S. & Seto, E. Regulation of histone deacetylase activities and functions by phosphorylation and its physiological relevance. Cell. Mol. Life Sci.78, 427–445 (2021). [DOI] [PMC free article] [PubMed] [Google Scholar]
- 50.Kee, J. et al. SARS-CoV-2 disrupts host epigenetic regulation via histone mimicry. Nature610, 381–388 (2022). [DOI] [PMC free article] [PubMed] [Google Scholar]
- 51.Savage, S. R. & Zhang, B. Using phosphoproteomics data to understand cellular signaling: a comprehensive guide to bioinformatics resources. Clin. Proteom.17, 27 (2020). [DOI] [PMC free article] [PubMed] [Google Scholar]
- 52.Dinkel, H. et al. Phospho.ELM: a database of phosphorylation sites—update 2011. Nucleic Acids Res.39, D261–D267 (2011). [DOI] [PMC free article] [PubMed] [Google Scholar]
- 53.Suo, S.-B., Qiu, J.-D., Shi, S.-P., Chen, X. & Liang, R.-P. PSEA: kinase-specific prediction and analysis of human phosphorylation substrates. Sci. Rep.4, 4524 (2014). [DOI] [PMC free article] [PubMed] [Google Scholar]
- 54.Jung, I., Matsuyama, A., Yoshida, M. & Kim, D. PostMod: sequence based prediction of kinase-specific phosphorylation sites with indirect relationship. BMC Bioinforma.11, 1–10 (2010). [DOI] [PMC free article] [PubMed] [Google Scholar]
- 55.Lee, T.-Y., Bo-Kai Hsu, J., Chang, W.-C. & Huang, H.-D. RegPhos: a system to explore the protein kinase–substrate phosphorylation network in humans. Nucleic Acids Res.39, D777–D787 (2011). [DOI] [PMC free article] [PubMed] [Google Scholar]
- 56.Seal, R. L. et al. Genenames.org: the HGNC resources in 2023. Nucleic Acids Res.51, D1003–D1009 (2023). [DOI] [PMC free article] [PubMed] [Google Scholar]
- 57.Manning, G., Whyte, D. B., Martinez, R., Hunter, T. & Sudarsanam, S. The protein kinase complement of the human genome. Science298, 1912–1934 (2002). [DOI] [PubMed] [Google Scholar]
- 58.Chang, W. et al. Shiny: Web Application Framework for R.https://cran.r-project.org/web/packages/shiny/index.html (2023).
- 59.Aden-Buie, G., Sievert, C., Iannone, R., Allaire, J. & Borges, B. Flexdashboard: R Markdown Format for Flexible Dashboards.https://cran.r-project.org/web/packages/flexdashboard/index.html (2023).
- 60.Almende, B. V. & Benoit, T. visNetwork: Network Visualization using ‘vis.js’ Library.https://datastorm-open.r-universe.dev/visNetwork (2022).
- 61.Csardi, G. & Nepusz, T. The igraph software package for complex network research. InterJournal Complex Systems 1695, 1–9 (2006).
- 62.Himsolt, M. GML: Graph Modelling Language (University of Passau, 1997).
- 63.Brandes, U., Eiglsperger, M., Lerner, J. & Pich, C. Graph Markup Language (GraphML) (University of Konstanz, 2010).
- 64.Gansner, E., Koutsofios, E. & North, S. Drawing Graphs with Dot.http://web.mit.edu/outland/share/graphviz/doc/pdf/dotguide.pdf (2006).
- 65.Fang, Z., Liu, X. & Peltz, G. GSEApy: a comprehensive package for performing gene set enrichment analysis in Python. Bioinformatics39, btac757 (2023). [DOI] [PMC free article] [PubMed] [Google Scholar]
- 66.Benjamini, Y. & Hochberg, Y. Controlling the false discovery rate: a practical and powerful approach to multiple testing. J. R. Stat. Soc. Ser. B Methodol.57, 289–300 (1995). [Google Scholar]
Associated Data
This section collects any data citations, data availability statements, or supplementary materials included in this article.
Supplementary Materials
Data Availability Statement
The KiNet portal is available at https://kinet.kinametrix.com/. The paper aggregates and analyzes publicly available data. The aggregated dataset and open-source code for the portal is maintained at https://github.com/GauravPandeyLab/KiNet and was also deposited at https://zenodo.org/doi/10.5281/zenodo.10212985 on November 28, 2023. A full list of data and software resources used is provided in Supplementary Table 1.