

Abstract
The prevalence of malnutrition in diabetic patients and its influencing factors remain poorly described. We aim to investigate the prevalence of malnutrition and the influencing factors in diabetic patients through meta‐analysis. Utilizing search terms, such as diabetes, malnutrition, and prevalence, we systematically searched eight databases, including Embase, PubMed, Web of Science, The Cochrane Library, China Knowledge Resource Integrated Database (CNKI), Wanfang Database, Chinese Biomedical Database (CBM), and VIP Database, from inception to May 4, 2023. The search aimed to identify studies related to the prevalence of malnutrition and its influencing factors in adult patients with diabetes. Cohort studies, case–control studies, and cross‐sectional studies that met the inclusion criteria were included in the analysis. Stata 16.0 software was used for meta‐analysis. Quality of the evidence was assessed using Grading of Recommendations, Assessment, Development and Evaluation (GRADE). The study protocol is registered with Prospective Register of Systematic Reviews (PROSPERO), CRD42023443649. A total of 46 studies were included, involving 18 062 patients with ages ranging from 18 to 95 years. The overall malnutrition prevalence was 33% (95% confidence interval [CI]: 0.25–0.40), compared with an at‐risk prevalence of 44% (95% CI: 0.34–0.54). Sixteen factors associated with malnutrition in diabetic patients were identified. This meta‐analysis provides insights into the prevalence of malnutrition and its risk factors in diabetic patients. Regular nutritional screening for patients with risk factors is essential for early detection and intervention.
Keywords: diabetes, influencing factors, malnutrition, meta‐analysis, prevalence
Highlights
The overall prevalence of malnutrition in diabetic patients was 33% (95% CI: 0.25–0.40), and the at‐risk prevalence of malnutrition was 44% (95% CI: 0.34–0.54).
Diabetic patients with malnutrition had significantly lower levels of body mass index, albumin, hemoglobin, triglyceride, and high‐density lipoprotein cholesterol, while showing an increase in glycosylated hemoglobin.
C‐reactive protein >10 mg/L, age, duration of diabetes, Wagner grades 3–5, with cardiovascular disease, and using insulin were identified as risk factors for malnutrition in diabetic patients.

1. INTRODUCTION
Diabetes mellitus (DM) is a prevalent and potentially devastating disease, with its prevalence on the rise in recent decades, presenting a significant public health challenge in the 21st century. 1 Chronic complications traditionally associated with diabetes include diabetic macroangiopathy, diabetic peripheral neuropathy, diabetic retinopathy, diabetic nephropathy, and diabetic foot. 2 However, nutrition‐related comorbidities in diabetes, especially malnutrition, have often been neglected, despite their significant impact on various body systems and potentially fatal consequences. 3 , 4 , 5 These patients face a higher risk of complications, prolonged hospitalization, and mortality.
Malnutrition refers to a state in which physiological and psychological functions are impaired due to inadequate nutrient intake or excessive expenditure, leading to compromised clinical outcomes of diseases. 6 Concurrent malnutrition is a crucial factor contributing to the deterioration of diabetic patients' prognosis, especially among the elderly who are more susceptible to disease‐related malnutrition. 6 , 7 Some people develop malnutrition because there is not enough food available, or because they have difficulty eating or absorbing nutrients, or because digestive or stomach diseases prevent the digestion and absorption of nutrients, or because they deliberately reduce their food intake in order to reduce their body mass index, etc. However, the causes of malnutrition in diabetic patients may be related to the pathophysiological mechanisms of diabetes, such as persistent hyperglycemia, chronic inflammation, and insulin resistance. Diabetic patients, being in a state of chronic inflammation, experience increased protein catabolism. Persistent hyperglycemia and insulin resistance can impair digestive system function, hindering nutrient digestion and absorption, 8 thereby promoting malnutrition. Additionally, diabetic patients often face dietary restrictions, especially regarding carbohydrate intake. This condition promotes oxidative stress, heightens the risk of chronic complications, and worsens nutritional status. Furthermore, the use of nutrient‐restricted diets contributes to an unbalanced energy balance. 9 As a result, malnutrition can trap diabetics in a vicious cycle, underscoring the urgent need to comprehend the nutritional status of diabetics and the factors influencing malnutrition.
However, the nutritional status of diabetics are substantial discrepancies among different studies, especially the prevalence of malnutrition in diabetics ranging from 2% 10 to 78%. 11 Underestimating the prevalence of malnutrition may reduce the importance of malnutrition in clinical practice, with adverse consequences. Based on current nutritional assessment tools, the prevalence of malnutrition and the prevalence of at‐risk for malnutrition can be used as the best evidence‐based basis for estimating nutritional status in patients with diabetes. Various studies reported the influencing factors related to malnutrition in diabetics, including body mass index (BMI), 4 , 12 , 13 , 14 , 15 , 16 , 17 , 18 albumin (ALB), 3 , 4 , 12 , 17 , 19 , 20 triglyceride (TG), 12 , 21 , 22 , 23 C‐reactive protein (CRP), 24 , 25 , 26 >10 mg/L, age, 3 , 4 , 17 , 20 , 23 duration of diabetes, 20 , 23 smoking, 18 , 25 gender, 27 , 28 , 29 lower education level, 29 , 30 and others. However, some of these reports present controversial findings and lack sufficient credibility. Therefore, the objective of this study was to conduct a systematic review and meta‐analysis to summarize the prevalence of malnutrition and the prevalence of at‐risk for malnutrition in diabetic patients. Additionally, we aim to analyze the influencing factors associated with malnutrition and provide a basis for early nutritional intervention in diabetics, so as to improve the quality of life of diabetics and reduce the burden on families and society.
2. MATERIALS AND METHODS
2.1. Protocol and registration
This meta‐analysis was performed according to the Preferred Reporting Items for Systematic Reviews and Meta‐Analyses (PRISMA) guidelines and the study protocol was registered in the International Prospective Register of Systematic Reviews (PROSPERO) [CRD42023443649].
2.2. Search strategy
In this review, a comprehensive search was conducted across eight databases, including Embase, PubMed, Web of Science, The Cochrane Library, China Knowledge Resource Integrated Database (CNKI), Wanfang Database, Chinese Biomedical Database (CBM), and VIP Database (VIP), from their inception until May 4, 2023. Additionally, manual searches of reference citations were performed to ensure the comprehensiveness of the retrieved studies. The search terms were developed using a combination of free terms and Mesh terms, and the Boolean operators OR/AND were used for their combination. Detailed search strategies employed in all databases can be found in Table S1.
2.3. Selection criteria
Inclusion criteria included the following: (1) The study design was either a cohort study, case–control study or cross‐sectional study. (2) All participants were diabetic patients aged 18 years and over, with or without chronic complications of diabetes, and their race and nationality were not limited. (3) The exposure factor was malnutrition or at‐risk for malnutrition. (4) The study reported the prevalence of malnutrition or at‐risk for malnutrition and influencing factors of malnutrition in diabetic patients.
Exclusion criteria included the following: (1) Studies that diagnosed malnutrition solely based on low BMI, as this may compromise the accuracy of malnutrition diagnosis. 31 (2) Studies with a sample size smaller than 50. (3) Studies with missing data that could not be obtained by contacting the author. (4) The study which participants were on peritoneal dialysis or were complicated with diseases such as cancer and tuberculosis that severely affected nutritional status. (5) Review articles, meta‐analyses, letters, conference abstracts, animal experimental studies, and other nonrelevant article types.
2.4. Study screening and data extraction
Two researchers (Zhang, T., and Qin J.) independently extracted data from the included literature after the screening process. The extracted data included the first author's name, publication year, study region, study type, definition of malnutrition, sample size, age, gender, and influencing factors of malnutrition. In cases of disagreements, a third investigator (Ma, Y.) was available for discussion and resolution.
2.5. Quality assessment
Two researchers (Zhang, T, and Qin J.) independently used the Joanna Briggs Institute (JBI) critical appraisal checklist for cross‐sectional studies, 32 studies that had 50% or more ‘Yes’ across the quality assessment parameters were considered low risk and the Newcastle‐Ottawa Scale (NOS) for cohort studies and case–control studies. 32 This scale is divided into three categories (selection, comparability, and exposure), with a total of eight items for study population selection (four items), comparability (one item), and exposure or outcome evaluation (three items), with a maximum score of 9. Studies with a score ≥6 were considered as the high quality. Any conflict was resolved by discussion with the third investigator (Ma, Y.).
2.6. Statistical analysis and quality of the evidence
The pooled prevalence of malnutrition or the pooled prevalence of at‐risk for malnutrition was evaluated based on the nutrition measurement tools used in the studies included in this meta‐analysis, such as the Miniature Nutrition Assessment Scale (MNA), where a score of <17.0 indicates malnutrition, a score ranging from 17.0 to 23.9 indicates at‐risk for malnutrition, and a score of ≥24.0 indicates a favorable nutritional status. To avoid duplication, estimates from distinct studies employing multiple measurement tools to assess nutritional status were amalgamated based on their respective primary diagnostic criteria.
Stata 16.0 software was utilized for conducting the meta‐analysis. Odds ratio (OR) was employed as the effect index for count data, while mean difference (MD) was used for measurement data. Each effect size was presented with a point estimate and a 95% confidence interval (CI), and statistical significance was set at p < 0.05. To assess heterogeneity among the included studies, the Q test with α = 0.1 was performed, and the magnitude of heterogeneity was quantified using I 2 . If p ≥ 0.1 and I 2 ≤ 50%, heterogeneity was considered acceptable, and the fixed‐effect model was applied. On the other hand, if I 2 > 50% and p < 0.1, indicating significant heterogeneity, the random‐effects model was used. Additionally, subgroup analysis was conducted for categorical variables (measurement tool, country, and chronic complications of diabetes), chi‐square (χ 2 ) test was used to explore potential differences in prevalence across subgroups. Sensitivity analysis was performed by removing each study individually to assess the consistency and quality of the results regarding malnutrition prevalence and the prevalence of at‐risk for malnutrition. Publication bias was assessed using Egger's test 33 for funnel plot asymmetry in addition to visual inspection of the funnel plots.
Finally, two researchers (Zhang, T, and Qin J.) used the Grading of Recommendations, Assessment, Development and Evaluation (GRADE) to assess the quality of evidence between influencing factors with malnutrition. According to the GRADE approach, we rated the quality as four levels: high, moderate, low, and very low.
3. RESULTS
3.1. Study selection
The initial search retrieved 11 474 articles, of which 3251 were duplicates. After screening titles and abstracts, there are 112 articles remaining. These articles were further read in full text and evaluated in detail. Eventually, 46 articles were included in the meta‐analysis. The literature search and screening procedures are shown in Figure 1.
FIGURE 1.
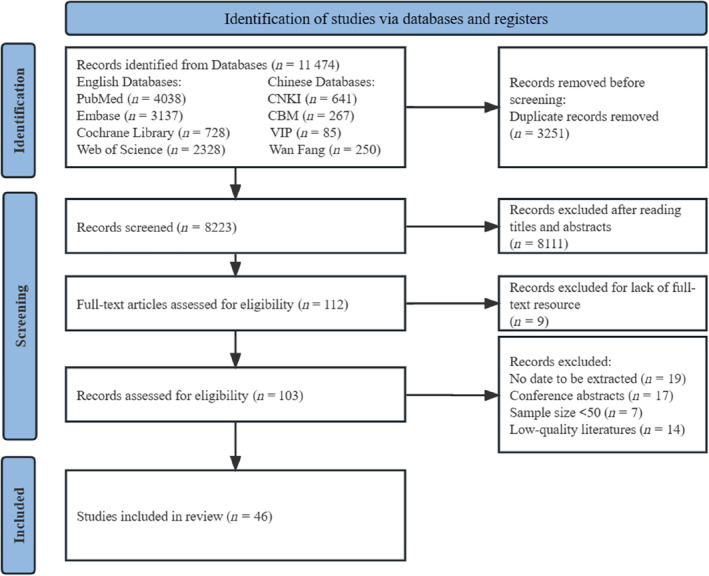
The flow chart of studies selecting process. CBM, Chinese Biomedical Database; CNKI, China Knowledge Resource Integrated Database.
3.2. Baseline characteristics of the included studies
The main characteristics of the included studies are presented in Table 1. A total of 46 studies involving 18 062 patients were included. The included studies comprised 36 cross‐sectional studies, 8 , 10 , 12 , 13 , 15 , 17 , 19 , 20 , 21 , 22 , 23 , 24 , 25 , 26 , 28 , 29 , 30 , 34 , 35 , 36 , 37 , 38 , 39 , 40 , 41 , 42 , 43 , 44 , 45 , 46 , 47 , 48 , 49 , 50 , 51 , 52 and 10 cohort studies, 3 , 4 , 11 , 14 , 18 , 27 , 53 , 54 , 55 , 56 published between 2011 and 2023, with sample sizes ranging from 60 19 to 1754. 54 These studies were conducted in various countries, including China, 3 , 8 , 10 , 12 , 13 , 18 , 19 , 21 , 22 , 23 , 24 , 25 , 26 , 28 , 34 , 35 , 36 , 37 , 38 , 39 , 40 , 41 , 42 , 44 , 49 , 50 , 51 , 52 , 53 , 56 Turkey, 29 , 46 , 47 , 48 Spain, 4 , 11 , 27 , 55 Japan, 15 , 17 , 20 , 54 Brazil, 30 Pakistan, 43 Belgium, 14 and Korea. 45 Further details regarding the measurement tools used to assess nutritional status in the included studies can be found in Table S2.
TABLE 1.
Characteristic of included studies.
| Author (year) | Study country | Study design | Sample (N) | Mean age | Participants | Measurement tools of nutrition status | Prevalence (%) | Influencing factors | |
|---|---|---|---|---|---|---|---|---|---|
| T‐M‐F | Malnutrition a | Risk b | |||||||
| fet al. (2023) | Pakistan | Cross‐sectional | 359–153‐206 | 52.61 ± 11.80 | T2DM | SGA | 58.8 | ‐ | 14 |
| Chen et al. (2023) | China | Cross‐sectional | 90‐47‐43 | ≥60 | DN | NRS‐2002 | ‐ | 62.2 | 1, 3, 4 |
| Chu et al. (2020) | China | Cross‐sectional | 426‐271‐155 | ≥65 | T2DM | MNA‐SF | 19.3 | 56.1 | 3, 4, 5 |
| Gau et al. (2016) | China | Cross‐sectional | 478‐271‐207 | 65.4 ± 13.1 | DFU | MNA | 15.2 | 85.4 | NA |
| Gao et al. (2021) | China | Cross‐sectional | 252‐126‐126 | 65–88 | T2DM | MNA‐SF | 7.1 | 56.8 | 1, 2, 3, 4, 5, 10 |
| He et al. (2020) | China | Cross‐sectional | 102‐0‐102 | ≥60 | DFU | MNA‐SF | 37.3 | ‐ | 7, 9, 15 |
| Huang et al. (2011) | China | Cross‐sectional | 106‐59‐47 | 35–86 | DM | MNA | 8.5 | 72.6 | NA |
| Huang et al. (2020) | China | Cohort | 319‐201‐118 | 56.36 ± 8.55 | DFU | NRS‐2002 | ‐ | 39.5 | 8, 9 |
| Huang et al. (2022) | China | Cross‐sectional | 447‐227‐220 |
M:60.94 ± 11.54 F:64.94 ± 10.53 |
T2DM + macrovascular disease |
NRS‐2002 | ‐ | 27.3 | 1, 3, 4, 10 |
| Ji et al. (2022) | China | Cross‐sectional | 610 | 66 (63,70) | T2DM | GNRI | ‐ | 19.5 | 1, 2, 3, 4, 6, 10 |
| Jiang et al. (2012) | China | Cross‐sectional | 60‐33‐27 | 48–80 | T2DM | SGA | 41.7 | ‐ | 2, 6 |
| Keskinler et al. (2021) | Turkey | Cross‐sectional | 222‐90‐132 | 58.1 ± 10 | T2DM | NRS‐2002 | ‐ | 14.4 | 2, 13 |
| Kimura et al. (2021) | Japan | Cohort | 1754‐1231‐523 | 75 (70,79) | T2DM | GNRI | ‐ | 49.3 | 16 |
| Kong et al. (2017) | China | Cross‐sectional | 168‐93‐75 | 67–95 | DN | NRS‐2002 | ‐ | 30.4 | NA |
| Kong et al. (2021) | China | Cross‐sectional | 291‐137‐154 | 69 (67,72) | T2DM | MNA | 2.1 | 35.1 | NA |
| Lauwers et al. (2021) | Belgium | Cohort | 110‐88‐22 | 68 ± 12 | DFU | GLIM | 23.6 | ‐ | 1 |
| Lai et al. (2022) | China | Cross‐sectional | 603‐314‐289 | 62.66 ± 11.34 | T2DM + chronic complications | NRS‐2002 | ‐ | 25.0 | 2 |
| Li et al. (2011) | China | Cross‐sectional | 775‐379‐396 |
NRI > 100: 62.1 ± 12.9 NRI ≤ 100: 61.5 ± 13.9 |
T2DM | NRI | 20.8 | ‐ | 1, 3, 4, 5 |
| Li et al. (2023) | China | Cross‐sectional | 454‐284‐170 | 27–87 | T2DM | CONUT | 15.0 | ‐ | 1, 3, 5, 6.11, 12, 15 |
| Liu et al. (2017) | China | Cohort | 302‐194‐108 | 80 (72,84) | T2DM | MNA | 18.5 | 51.7 | 2 |
| Lim et al. (2018) | Korea | cross‐sectional | 464‐0‐464 | 69.6 ± 2.96 | DM | NSI | 34.7 | ‐ | NA |
| López‐Valverde et al. (2023) | Spain | Cohort | 77‐57‐20 | 69.6 | DFU | GLIM | 71.4 | ‐ | 1, 2, 3 |
| Lu et al. (2015) | China | Cross‐sectional | 176 | 74.94 ± 8.83 | DN | MNA | 33.0 | ‐ | NA |
| Lu et al. (2019) | China | Cross‐sectional | 105‐64‐41 | 60–88 | DM | MNA | 12.4 | 71.4 | NA |
| Lv et al. (2017) | China | Cross‐sectional | 182‐102‐80 | 60–84 | DFU | MNA | 66.5 | ‐ | NA |
| Martin et al. (2018) | Spain | Cohort | 402‐179‐223 | 80.8 ± 8.5 | T2DM | MNA | 77.6 | ‐ | NA |
| Mineoka et al. (2019) | Japan | Cross‐sectional | 461‐272‐189 | 66.5 ± 12.9 | T2DM | CONUT | 38.2 | ‐ | 1, 6 |
| Pan et al. (2016) | China | Cross‐sectional | 456‐280‐176 | 18–90 | T2DM | NRS‐2002 | ‐ | 21.5 | NA |
| Ran et al. (2021) | China | Cross‐sectional | 559‐321‐238 | 60–88 | DFU | MNA | 69.2 | 87.5 | 7, 9, 15 |
| Saintrain et al. (2019) | Brazil | Cross‐sectional | 246‐108‐138 | 65–94 | DM | MNA | 3.7 | 19.5 | 13, 14 |
| Sanz‐París et al. (2016) | Spain | Cohort | 1014‐504‐510 | 77.9 ± 6.92 | T2DM | MNA‐SF | 29.6 | 60.1 | NA |
| Sanz‐París et al. (2013) | Spain | Cohort | 1098‐548‐549 | 78 ± 7.1 | DM | MNA | 21.2 | 60.4 | 8 |
| Shen et al. (2014) | China | Cross‐sectional | 132‐68‐64 | ≥80 | DM | MNA‐SF | 18.2 | 62.9 | 8 |
| Shi et al. (2019) | China | Cross‐sectional | 512‐263‐249 | 27–89 | T2DM | NRS‐2002 | ‐ | 18.0 | 4 |
| Shi et al. (2022) | China | Cross‐sectional | 357‐237‐120 | 62.35 ± 11.26 | DFU | CONUT | 72.0 | 0 | 8 |
| Shiroma et al. (2023) | Japan | Cross‐sectional | 479‐264‐215 | 71 (62, 77) | T2DM | GNRI | ‐ | 23.2 | 2, 3, 6, 16 |
| Takahash et al. (2021) | Japan | Cross‐sectional | 526‐301‐225 | 67.1 ± 10.9 | T2DM | GNRI | ‐ | 5.1 | 1, 2, 3, 4 |
| Tamer et al. (2018) | Turkey | Cross‐sectional | 580‐253‐327 | 54.6 ± 10.7 | T2DM | SGA | 11.4 | ‐ | NA |
| Tasc et al. (2019) | Turkey | Cross‐sectional | 215‐64‐151 | >65 | T2DM | MNA‐SF | 36.7 | ‐ | 8, 13, 14, 16 |
| Xie et al. (2017) | China | Cohort | 271‐162‐109 | 66.9 ± 11.1 | DFA | GNRI | ‐ | 50.9 | 1, 3, 5, 11, 12 |
| Xu et al. (2014) | China | Cross‐sectional | 178‐108‐70 |
M: 58.4 ± 12.9 F: 63.7 ± 10.4 |
DM | NRS‐2002 | ‐ | 29.8 | NA |
| Ye et al. (2020) | China | Cross‐sectional | 671 | ≥40 | T2DM | CONUT | 46.2 | ‐ | 4, 5, 6, 10, 12 |
| Yildirim et al. (2018) | Turkey | Cross‐sectional | 104‐67‐37 | 65.08 ± 12.57 | T2DM | MNA | 7.7 | 26.0 | NA |
| Zhang et al. (2013) | China | Cohort | 252‐155‐97 | 68.6 ± 11.3 | DFU | SGA | 50.0 | ‐ | NA |
| Zhang et al. (2021) | China | Cross‐sectional | 539‐307‐232 | 72.26 ± 16.39 | T2DM | MNA | 14.1 | 70.1 | 1, 4, 5, 10 |
| Zhang et al. (2018) | China | Cross‐sectional | 78‐41‐37 | ≥60 | T2DM | MNA | 65.4 | ‐ | NA |
Note: Participants: diabetic nephropathy (DN); type 2 diabetes mellitus (T2DM); diabetic foot ulcers (DFU); diabetic foot amputation (DFA); diabetes mellitus (DM); diabetes chronic diseases including diabetic macrovascular disease, diabetic peripheral neuropathy, diabetic retinopathy, diabetic nephropathy and diabetic foot. Measurement tools of nutrition status: Mini Nutritional Assessment (MNA); Short‐Form Mini Nutritional Assessment (MNA‐SF); Subjective Global Assessment (SGA); Nutritional Risk Index (NRI); Global Leadership Initiative on Malnutrition (GLIM); Controlling Nutritional Status (CONUT); Nutritional Screening Initiative (NSI); Nutritional Risk Screening 2002 (NRS‐2002); Geriatric Nutritional Risk Index (GNRI). Influencing factors: (1) body mass index (BMI); (2) age; (3) albumin (ALB); (4) glycosylated hemoglobin (HbA1c); (5) hemoglobin (Hb); (6) duration of diabetes; (7) diabetic foot infection; (8) gender; (9) Wagner grades 3–5; (10) triglyceride (TG); (11) smoking; (12) high‐density lipoprotein cholesterol (HDL‐C); (13) lower education level; (14) with cerebrovascular disease (CVD); (15) C‐reactive protein (CRP) >10 mg/L; (16) using insulin.
Abbreviations: F, sample size of females; M, sample size for males; T, total sample size; NA, not applicable.
Prevalence of malnutrition in patients with diabetes.
Prevalence of malnutrition and at‐risk for malnutrition in diabetics.
3.3. Quality assessment
All cohort and case–control studies included in this meta‐analysis underwent quality assessment using the Newcastle‐Ottawa Scale (NOS). Two articles were rated 9 points, five articles scored 8 points, two articles scored 7 points, and one article scored 6 points. These scores indicate that these studies were of high quality. The cross‐sectional studies were assessed using the JBI tool for cross‐sectional studies, with all studies achieving a quality score above 50%, and a mean score of 83%. Hence, they were considered to be of low risk in terms of methodological quality. A more detailed account of the methodological quality assessment is provided in the supplemental material (Tables S3 and S4).
3.4. Prevalence of malnutrition for patients with diabetes
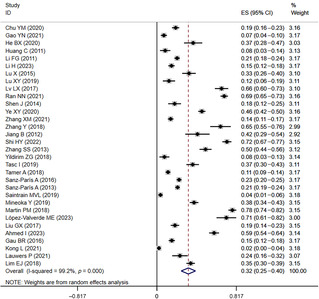
In the 32 included studies 3 , 4 , 8 , 10 , 11 , 12 , 13 , 14 , 15 , 19 , 21 , 22 , 24 , 25 , 26 , 27 , 28 , 29 , 30 , 34 , 36 , 37 , 38 , 40 , 43 , 44 , 45 , 46 , 48 , 50 , 55 , 56 that provided data on the prevalence of malnutrition in diabetics, the prevalence of malnutrition ranged from 2% to 78%. The overall malnutrition prevalence was 33% (95% CI: 0.25–0.40, I 2 = 99.2%, p < 0.01) based on a random‐effects model meta‐analysis of all data, as shown in Figure 2.
FIGURE 2.
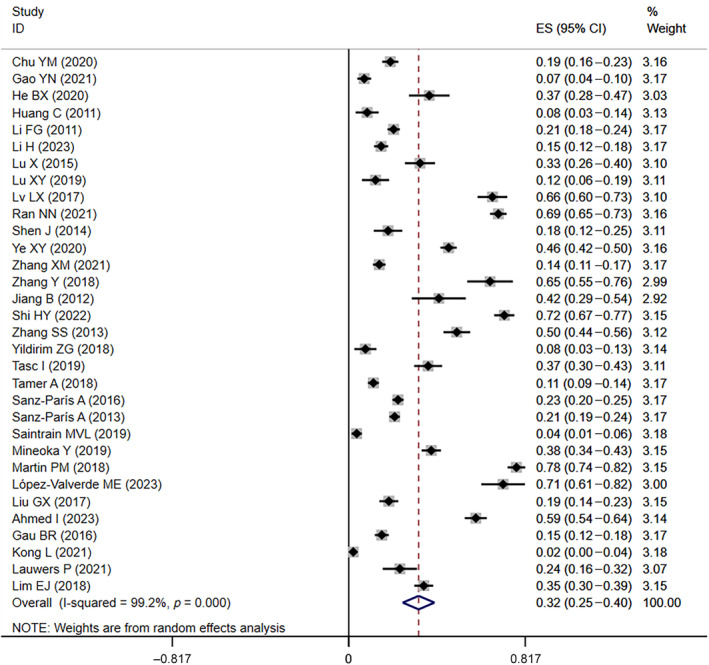
The forest plot of prevalence of malnutrition in diabetic patients. CI, confidence interval; ES, effect size.
Similarly, in the 28 included studies 3 , 10 , 12 , 17 , 18 , 20 , 22 , 23 , 26 , 27 , 30 , 34 , 35 , 37 , 39 , 40 , 41 , 42 , 44 , 47 , 48 , 49 , 50 , 51 , 52 , 53 , 54 , 55 that provided data on the prevalence of at‐risk for malnutrition in diabetics, the prevalence of at‐risk for malnutrition ranged from 5% to 87%. The overall prevalence of at‐risk for malnutrition was 44% (95% CI: 0.34–0.54, I 2 = 99.5%, p < 0.01) based on a random‐effects model meta‐analysis of all data, as shown in Figure 3.
FIGURE 3.
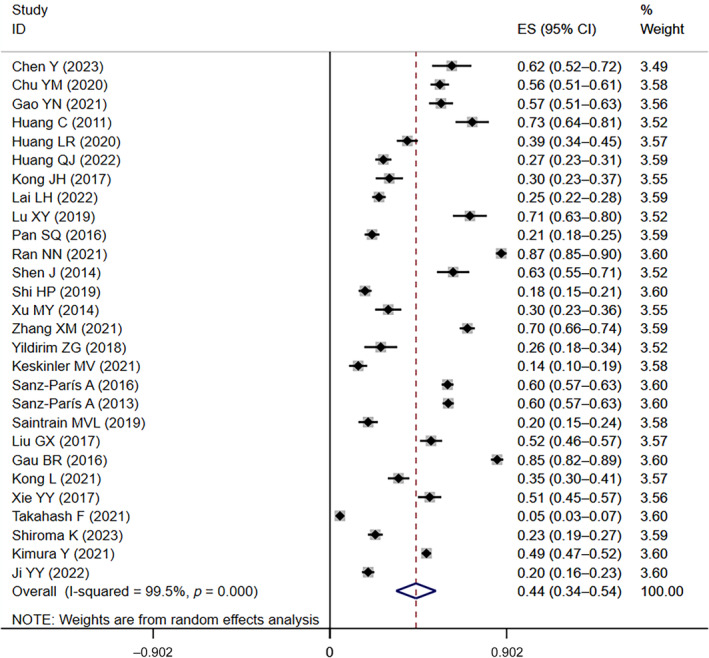
The forest plot of the prevalence of at‐risk for malnutrition in diabetic patients. CI, confidence interval; ES, effect size.
3.5. Subgroup analysis
Subgroup analyses were conducted on categorical variables, including the measurement tool, chronic complications of diabetes, and country of study, in order to explore differences in the prevalence of malnutrition across studies. The highest prevalence of malnutrition (47%, 95% CI: 0.01–0.94) was observed when using the Global Leadership Initiative on Malnutrition (GLIM) tool, followed by 43% for Controlling Nutritional Status (CONUT), 40% for Subjective Global Assessment (SGA), 30% for MNA, and 24% for Short‐Form Mini Nutritional Assessment (MNA‐SF). Patients with diabetic chronic complications had the highest prevalence of malnutrition (49%, 95% CI: 0.31–0.66), compared with 27% in patients without diabetic chronic complications. Moreover, the prevalence of malnutrition was highest in Spain (50%, 95% CI: 0.24–0.75), followed by 31% in China, and 18% in Turkey. These differences were statistically significant. Pooled estimates from subgroup analyses are provided in Table 2.
TABLE 2.
Subgroups analysis of malnutrition.
| Subgroups | N | Prevalence | Malnutrition 95% CI | I 2 (%) | p value | χ 2 | p value | |
|---|---|---|---|---|---|---|---|---|
| Measurement tool | MNA | 14 | 30% | 17%–42% | 99.4% | <0.01 | 204.57 | <0.01 |
| MNA‐SF | 6 | 24% | 15%–34% | 97.0% | <0.01 | |||
| CONUT | 5 | 43% | 20%–66% | 99.3% | <0.01 | |||
| SGA | 3 | 40% | 12%–69% | 99.1% | <0.01 | |||
| GLIM | 2 | 47% | 1%–94% | 98.1% | <0.01 | |||
| Chronic complications of diabetes | None | 23 | 27% | 20%–34% | 99.0% | <0.01 | 480.46 | <0.01 |
| Yes | 9 | 49% | 31%–66% | 98.9% | <0.01 | |||
| Country | China | 20 | 31% | 22%–41% | 99.2% | <0.01 | 81.00 | <0.01 |
| Turkey | 3 | 18% | 4%–33% | 96.5% | <0.01 | |||
| Spain | 4 | 50% | 24%–75% | 99.5% | <0.01 |
Abbreviations: CI, confidence interval; CONUT, Controlling Nutritional Status; GLIM, Global Leadership Initiative on Malnutrition; MNA, Mini Nutritional Assessment; MNA‐SF, Short‐Form Mini Nutritional Assessment; N, number of included studies; SGA, Subjective Global Assessment.
Subgroup analyses were conducted using the same categorical variables as malnutrition to explore differences in the prevalence of at‐risk for malnutrition across studies. The highest prevalence of at‐risk for malnutrition (59%, 95% CI: 0.56–0.61) was observed when using the MNA‐SF tool, followed by 58% for MNA, 30% for Geriatric Nutritional Risk Index (GNRI), and 29% for Nutritional Risk Screening 2002 (NRS‐2002). Patients with diabetes chronic complications had an 8% higher prevalence of at‐risk for malnutrition (51%, 95% CI: 0.30–0.73) compared with patients without diabetes chronic complications (44%, 95% CI: 0.34–0.54). Moreover, the prevalence of at‐risk for malnutrition was highest in Spain (60%, 95% CI: 0.58–0.62), followed by 49% in China, 26% in Japan, and 20% in Turkey. These differences were statistically significant. Pooled estimates from subgroup analyses are provided in Table 3.
TABLE 3.
Subgroups analysis of at‐risk for malnutrition.
| Subgroups | N | Prevalence | At‐risk for malnutrition (95% CI) | I 2 (%) | p value | χ 2 | p value | |
|---|---|---|---|---|---|---|---|---|
| Measurement tool | MNA | 10 | 58% | 44%–72% | 99.1% | <0.01 | 1300.00 | <0.01 |
| MNA‐SF | 4 | 59% | 56%–61% | 8.9% | 0.35 | |||
| GNRI | 5 | 30% | 10%–49% | 99.6% | <0.01 | |||
| NNRS‐2002 | 9 | 29% | 23%–35% | 93.7% | <0.01 | |||
| Chronic complications of diabetes | None | 20 | 44% | 34%–54% | 99.3% | <0.01 | 161.12 | <0.01 |
| Yes | 8 | 51% | 30%–73% | 99.5% | <0.01 | |||
| Country | China | 20 | 49% | 36%–61% | 99.3% | <0.01 | 81.00 | <0.01 |
| Turkey | 2 | 20% | 8%–31% | 80.2% | 0.02 | |||
| Spain | 2 | 60% | 58%–62% | 0.0% | 0.88 | |||
| Japan | 3 | 26% | 4%–56% | 99.8% | <0.01 | 377.65 | <0.01 |
Abbreviations: CI, confidence interval; GNRI, Geriatric Nutritional Risk Index; MNA, Mini Nutritional Assessment; MNA‐SF, Short‐Form Mini Nutritional Assessment; N, number of included studies; NRS‐2002, Nutritional Risk Screening 2002.
3.6. Influence factors associated with malnutrition for patients with diabetes
This meta‐analysis identified 16 potential influencing factors associated with malnutrition in diabetic patients, and the results are presented in Table 4. Diabetics with malnutrition had significantly lower levels of BMI, ALB, hemoglobin (Hb), TG, and high‐density lipoprotein cholesterol (HDL‐C), while showing an increase in glycosylated Hb (HbA1c). Furthermore, CRP >10 mg/L, age, duration of diabetes, Wagner grades 3–5, with cardiovascular disease (CVD), and using insulin were identified as risk factors for malnutrition in diabetic patients. There is insufficient evidence to establish an association between four other factors, namely smoking, gender, diabetic foot infection, and lower education level, with malnutrition in diabetic patients.
TABLE 4.
Analyses of the influence factors of malnutrition in diabetic patients.
| No. | Influence factors | Number of included studies | Heterogeneity | I 2 | p value | |
|---|---|---|---|---|---|---|
| OR*/MD | 95% CI | |||||
| 1 | BMI, kg/m2 | 12 | −2.89 | [−3.69 to −2.10] | 91.58% | <0.01 |
| 2 | ALB, g/L | 11 | −5.18 | [−6.26 to −4.09] | 90.78% | <0.01 |
| 3 | Hb, g/L | 7 | −11.28 | [−15.09 to −7.47] | 84.19% | <0.01 |
| 4 | TG, mmol/L | 5 | −0.42 | [−0.65 to −0.18] | 88.71% | <0.01 |
| 5 | HDL‐C, mmol/L | 3 | −0.14 | [−0.20 to −0.09] | 67.36% | <0.01 |
| 6 | HbA1c, % | 10 | 1.06 | [0.50 to 1.61] | 94.47% | <0.01 |
| 7 | CRP >10 mg/L | 3 | 2.1* | [1.33 to 3.31] | 53.2% | <0.01 |
| 8 | Age, years | 9 | 4.92 | [3.39 to 6.46] | 65.63% | <0.01 |
| 9 | Duration of diabetes, years | 6 | 2.97 | [2.11 to 3.82] | 53.88% | <0.01 |
| 10 | Wagner grades 3–5 | 3 | 8.34* | [5.02 to 13.86] | 0.0% | <0.01 |
| 11 | With CVD | 3 | 1.91* | [1.25 to 2.91] | 0.0% | <0.01 |
| 12 | Using insulin | 3 | 1.75* | [1.09 to 2.80] | 69.4% | 0.02 |
| 13 | Smoking | 2 | 1.17* | [0.26 to 5.23] | 90.5% | 0.84 |
| 14 | Female sex | 5 | 1.11* | [0.70 to 1.74] | 71.8% | 0.66 |
| 15 | With diabetic foot infection | 2 | 3.06* | [0.84 to 11.13] | 81.8% | 0.09 |
| 16 | Lower education level | 3 | 2.40* | [0.87 to 6.64] | 64.5% | 0.09 |
Abbreviations: ALB, albumin; BMI, body mass index; CI, confidence interval; CRP, C‐reactive protein; CVD, cerebrovascular disease; Hb, hemoglobin; HbA1c, glycosylated hemoglobin; HDL‐C, high‐density lipoprotein cholesterol; MD, mean difference; OR*, odds ratio; TG, triglyceride.
3.7. Sensitivity analysis and tests for publication bias
Sensitivity analysis of malnutrition prevalence and the prevalence of at‐risk for malnutrition was conducted by systematically excluding individual studies one by one, and the results showed that the comprehensive effect size did not change significantly before and after exclusion, indicating that the study results were relatively stable (Figures S1 and S2). To assess publication bias for factors that were examined in more than 10 articles (including BMI and ALB), Egger's test was performed. The results indicated the absence of publication bias. Taking BMI as an example, the funnel plot is presented in Figure 4, and the Egger's test showed a p value of 0.524, further confirming the absence of publication bias.
FIGURE 4.
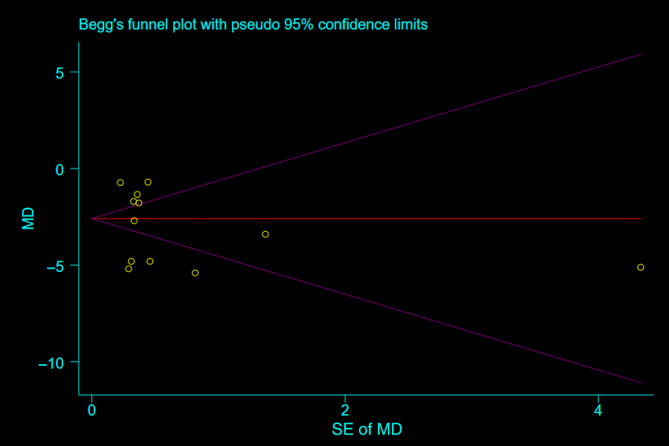
Funnel plot for assessing publication biases. MD, mean difference.
3.8. GRADE summary of findings
GRADE ratings for the relevant between influencing factors with malnutrition are provided in the supplemental material (Figure S3). GRADE quality of the evidence ranged from very low to high.
4. DISCUSSION
This meta‐analysis encompassed 46 studies comprising a total of 18 062 patients, aiming to investigate the prevalence of malnutrition and the influencing factors in diabetic patients. The overall prevalence of malnutrition in diabetic patients was found to be 33%, and the prevalence of at‐risk for malnutrition was 44%. We included and analyzed 16 influencing factors related to malnutrition in diabetic patients. Among these factors, BMI, ALB, Hb, TG, HDL‐C, HbA1c, CRP >10 mg/L, age, duration of diabetes, Wagner grades 3–5, and using insulin were significantly associated with malnutrition in diabetic patients.
Our subgroup analysis revealed variations in the prevalence of malnutrition and the prevalence of at‐risk for malnutrition across different countries. Specifically, the prevalence was found to be higher in Spain compared with China, higher in Japan compared to Turkey, and higher in developed countries compared to developing countries. These results differ from previous studies, 57 which may be attributed to potential limitations introduced by sampling bias. One possible explanation for the discrepancy is that the prevalence of malnutrition was highest in the Spanish sample, but it also had the highest mean age, with a concentration between 69.6 and 80.8 years. Furthermore, it is plausible that despite more developed economies in certain countries, the prevalence of malnutrition remains elevated among older individuals with restricted mobility at home. 58 Socioeconomic factors, access to healthcare, and cultural dietary practices could also play a role in contributing to the observed differences in malnutrition prevalence among different countries.
Diabetic patients with chronic complications had a 22% higher prevalence of malnutrition compared to those without complications. This association suggests that chronic complications of diabetes may contribute significantly to the increased prevalence of malnutrition in diabetic individuals. 56 The presence of chronic complications is often characteristic of the later stages of diabetes, and patients with such complications tend to have a longer disease duration. Consequently, their bodies experience prolonged periods of high metabolism, heightened energy expenditure, and increased protein consumption, all of which elevate the risk of developing malnutrition. 59 In the future, we should pay more attention to patients with chronic complications of diabetes.
The prevalence of malnutrition and at‐risk for malnutrition in diabetic patients is influenced by the measurement tools used. The lack of a standardized gold standard for diagnosing malnutrition leads to variations in results among different measurement tools. 60 A meta‐analysis of 83 studies and 32 screening tools found that no single screening tool is universally applicable for all patients. 61 Presently, the tools used to assess malnutrition in diabetic patients are diverse, and there is a lack of a specific screening tool tailored for malnourished diabetic individuals. Consider the adverse effects of malnutrition on the patient's prognosis, as well as the increase in treatment costs. 5 There is an urgent need to develop a more reliable malnutrition screening tool to increase the identification of malnutrition.
The meta‐analysis results indicate that the malnutrition group had significantly lower BMI, ALB, and Hb values compared with the normal nutrition group. These differences were statistically significant, consistent with previous studies. 62 BMI is widely used in existing malnutrition assessment tools and is recognized as a nutritional evaluation index. The World Health Organization (WHO) defines a BMI < 18.5 kg/m2 as malnutrition. 5 , 63 However, BMI is affected by whether the patient is overweight or obese in the past. For example, although the weight of the patient has been reduced by more than 20% within 3 months due to diseases (such as tuberculosis), the BMI value of the patient may still be normal or high due to obesity and other reasons. 64 Similarly, ALB is commonly used as an evaluation indicator in some malnutrition assessments, but it can also decrease in the presence of inflammation, regardless of the patient's nutritional status. 65 , 66 One study 67 pointed out that Hb is considered an indicator of malnutrition risk in the elderly, reflecting iron metabolism and protein status. However, a reduction in Hb levels only indicates the risk of malnutrition and may not accurately reflect the overall nutritional status of patients. Therefore, relying solely on these indicators may not provide a comprehensive and accurate assessment of the nutritional status of patients.
The malnutrition group showed significantly lower levels of TG and HDL‐C compared to the normal nutrition group. Reduced TG levels may hinder proper lipid and fat‐soluble vitamin absorption, increasing the risk of malnutrition. Additionally, low TG levels are closely related to inflammation, further elevating the risk of malnutrition. 51 HDL‐C plays a crucial role in providing energy through metabolism. In cases of malnutrition‐induced high energy consumption, HDL‐C levels may decrease, affecting muscle mass and function. 68 Patients with malnutrition also exhibited higher levels of HbA1c, which can disrupt glucose and amino acid metabolism, contributing to malnutrition in diabetic patients. 69 CRP >10 mg/L emerged as a risk factor for malnutrition in diabetic patients. High CRP levels, indicative of systemic inflammatory response, can accelerate protein breakdown, leading to malnutrition. 70
Comparing the mean age of diabetics with different nutritional status, the study results showed that the age of patients in the malnutrition group was significantly higher than that in the normal nutrition group. Aging is associated with a decline in enteric plexus nerve cells, affecting digestion and nutrient absorption, thereby increasing the risk of malnutrition. 71 Furthermore, patients with malnutrition generally had a longer duration of diabetes than those with normal nutrition. As diabetes progresses, the declining function of pancreatic islets in diabetic patients can exacerbate protein consumption, further raising the risk of malnutrition. 25
Patients with Wagner grades 3–5 are at a higher risk of malnutrition compared with those with Wagner grades 0–3, as higher Wagner grades indicate more severe infection, leading to increased protein consumption and higher susceptibility to malnutrition. 38 , 72 Patients with CVD often experience activated inflammatory responses, resulting in increased metabolic rates and higher protein breakdown and often cause digestive system issues, such as gastrointestinal bleeding and nausea, are common in CVD patients, causing reduced appetite and insufficient nutrient intake. 73 Additionally, diabetic patients treated with insulin face strict dietary restrictions, including limited carbohydrate intake, which can result in inadequate nutrient intake and potential malnutrition. 74
In contrast, our study found that smoking was not a risk factor for malnutrition in patients with diabetes. This is consistent with a previous meta‐analysis 75 that investigated risk factors for malnutrition in patients with stroke. Although some studies have suggested that smoking may contribute to malnutrition and that smokers may have healthier diet compared with nonsmokers, 76 the evidence on the impact of smoking on nutritional status in diabetic patients remains limited in this meta‐analysis. Additional research is required to generate more conclusive evidence in the future.
There is insufficient evidence to establish an association between three other factors, namely gender, diabetic foot infection, and lower education level, with malnutrition in diabetic patients. These factors might have been influenced by ethnicity, sample size, and the limited number of included studies. Further research is warranted to explore these factors comprehensively.
A study 77 has shown that only 24.1% of diabetics exhibit good dietary compliance, and dietary compliance is usually closely related to the extent of dietary education provided by healthcare professionals. Moreover, comprehensive exercise training is beneficial in controlling patients' fasting blood glucose levels, enhancing muscle strength, improving physical function, and delaying the progression of frailty. 78 Appropriate exercise training also promotes gastrointestinal activity, thereby increasing appetite and ensuring nutrient intake. Therefore, healthcare professionals should strengthen health education on dietary management for diabetics, provide effective health education, and develop reasonable dietary and exercise intervention plans to improve patients' nutritional status and prognosis.
This meta‐analysis possesses several strengths. First, it is the first systematic review and meta‐analysis to examine the prevalence of malnutrition and the prevalence of at‐risk for malnutrition, as well as the influencing factors of malnutrition in diabetic patients. Second, the included studies were of high quality, ensuring the reliability of the results. However, certain limitations should be acknowledged. First, the lack of a gold standard for malnutrition and at‐risk for malnutrition, along with the heterogeneity in measurement tools, may have affected data integration and, to some extent, the results. Furthermore, the number of studies included in the analysis of influencing factors was relatively small, limiting the strength of evidence‐based conclusions. Lastly, the search strategy was restricted to English and Chinese, which may have limited the comprehensiveness of the included studies. Given these limitations, the findings should be interpreted cautiously. Further in‐depth studies are necessary to validate and expand upon the outcomes of this study in the future.
5. CONCLUSION
Based on the results of our meta‐analysis, the prevalence of malnutrition and the prevalence of at‐risk for malnutrition in diabetics were 33% and 44%, respectively. The BMI, ALB, Hb, TG, HDL‐C, HbA1c, age, and duration of diabetes were significantly different between different nutritional status groups. Wagner grades 3–5, with CVD and using insulin may increase the risk of malnutrition in diabetic patients. Furthermore, based on our analysis, smoking is most likely not a risk factor for malnutrition in patients with diabetes. The effects of gender, with diabetic foot infection, and lower education level on malnutrition in diabetics are unclear. It is essential to conduct more studies in the future to enhance the reliability and validity of our findings. Given the negative impact of malnutrition on health outcomes, regular nutrition screening is recommended for patients with the identified risk factors. Early detection and treatment of malnutrition, and reduce the impact on individual health.
AUTHOR CONTRIBUTIONS
All authors contributed to the study conception and design. Material preparation, data collection, and analysis were performed by Tong Zhang and Jiangxia Qin. The first draft of the manuscript was written by Tong Zhang, and all authors commented on previous versions of the manuscript. All authors read and approved the final manuscript. Lin Han handles correspondence at all stages of refereeing and publication, also post‐publication.
FUNDING INFORMATION
This study was supported by National Nature Science Foundation of China (72274087, 71663002, 71704071), the fund of China Medical Board (#20‐374).
CONFLICT OF INTEREST STATEMENT
The authors declare no conflicts of interest.
Supporting information
Figure S1. Sensitivity analysis of malnutrition prevalence.
Figure S2. Sensitivity analysis of at‐risk for malnutrition prevalence.
Figure S3. GRADE ratings for the relevant between influencing factors with malnutrition.
Table S1. Search strategy.
Table S2. Measurement tools of nutritional disorder.
Table S3. Newcastle‐Ottawa Scale (NOS) assessment of the quality of cohort studies.
Table S4. Methodological quality assessment of included studies using the Joanna Briggs Institute's (JBI) critical appraisal checklist.
ACKNOWLEDGEMENTS
We are grateful to the researchers and participants in these original studies included in our study.
Zhang T, Qin J, Guo J, et al. Prevalence and influencing factors of malnutrition in diabetic patients: A systematic review and meta‐analysis. Journal of Diabetes. 2024;16(10):e13610. doi: 10.1111/1753-0407.13610
Tong Zhang and Jiangxia Qin contributed equally to this work and should be considered co‐first authors.
Contributor Information
Tong Zhang, Email: 1312951420@qq.com.
Yuxia Ma, Email: yuxiama@lzu.edu.cn.
Lin Han, Email: lzu-hanlin@hotmail.com.
REFERENCES
- 1. Zimmet P, Alberti KG, Shaw J. Global and societal implications of the diabetes epidemic. Nature. 2001;414:782‐787. doi: 10.1038/414782a [DOI] [PubMed] [Google Scholar]
- 2. Fowler MJ. Microvascular and macrovascular complications of diabetes. Clin Diabetes. 2008;26:77‐82. doi: 10.2337/diaclin.26.2.77 [DOI] [Google Scholar]
- 3. Liu GX, Chen Y, Yang YX, et al. Pilot study of the Mini Nutritional Assessment on predicting outcomes in older adults with type 2 diabetes. Geriatr Gerontol Int. 2017;17:2485‐2492. doi: 10.1111/ggi.13110 [DOI] [PubMed] [Google Scholar]
- 4. López‐Valverde ME, Aragón‐Sánchez J, Víquez‐Molina G. Handgrip strength but not malnutrition according to global leadership initiative on malnutrition criteria is a risk factor for mortality in hospitalized patients with ischemic diabetic foot ulcers. Adv Wound Care. 2023;12:127‐134. doi: 10.1089/wound.2021.0109 [DOI] [PubMed] [Google Scholar]
- 5. Schuetz P, Seres D, Lobo DN, Gomes F, Kaegi‐Braun N, Stanga Z. Management of disease‐related malnutrition for patients being treated in hospital. Lancet. 2021;398:1927‐1938. doi: 10.1016/s0140-6736(21)01451-3 [DOI] [PubMed] [Google Scholar]
- 6. Cederholm T, Barazzoni R, Austin P, et al. ESPEN guidelines on definitions and terminology of clinical nutrition. Clin Nutr. 2017;36:49‐64. doi: 10.1016/j.clnu.2016.09.004 [DOI] [PubMed] [Google Scholar]
- 7. Burgos Peláez R, García Almeida JM, Matía Martín P, et al. Malnutrition management of hospitalized patients with diabetes/hyperglycemia and concurrent pathologies. Nutr Hosp. 2022;39:1‐8. doi: 10.20960/nh.04505 [DOI] [PubMed] [Google Scholar]
- 8. Zhang Y, Wang T, Kang DM. Nutritional status and influencing factors of elderly inpatients with diabetes. Chin J Gerontol. 2018;38:2842‐2844. [Google Scholar]
- 9. Serrano Valles C, López Gómez JJ, García Calvo S, et al. Influence of nutritional status on hospital length of stay in patients with type 2 diabetes. Endocrinol Diabetes Nutr (Engl Ed). 2020;67:617‐624. doi: 10.1016/j.endinu.2020.05.004 [DOI] [PubMed] [Google Scholar]
- 10. Kong L, Zhao H, Fan J, et al. Predictors of frailty among Chinese community‐dwelling older adults with type 2 diabetes: a cross‐sectional survey. BMJ Open. 2021;11:e041578. doi: 10.1136/bmjopen-2020-041578 [DOI] [PMC free article] [PubMed] [Google Scholar]
- 11. Martin PM, Agudo FR, Medina JAL, et al. Effectiveness of an oral diabetes‐specific supplement on nutritional status, metabolic control, quality or life, and functional status in elderly patients. A multicentre study. Clin Nutr. 2019;38:1253‐1261. doi: 10.1016/j.clnu.2018.05.007 [DOI] [PubMed] [Google Scholar]
- 12. G YN, Wang Y, Su Y, Jin HY, Xia W, Xu GF. Discussion on dietary structure and intervention methods of high‐risk malnutrition in elderly diabetic patients. Chin Food Nutr. 2021;27:84‐88. doi: 10.19870/j.cnki.11-3716/ts.2021.11.003 [DOI] [Google Scholar]
- 13. Li FG, Sun ZZ, Wu ZF, Cui YL, Dong JF. Study on the correlation between malnutrition and glycated hemoglobin in type 2 diabetic patients. Shandong Med J. 2011;51:54‐55. [Google Scholar]
- 14. Lauwers P, Hendriks JMH, van Bouwel S, et al. Malnutrition according to the 2018 GLIM criteria is highly prevalent in people with a diabetic foot ulcer but does not affect outcome. Clin Nutr ESPEN. 2021;43:335‐341. doi: 10.1016/j.clnesp.2021.03.029 [DOI] [PubMed] [Google Scholar]
- 15. Mineoka Y, Ishii M, Hashimoto Y, Nakamura N, Fukui M. Malnutrition assessed by controlling nutritional status is correlated to carotid atherosclerosis in patients with type 2 diabetes. Endocr J. 2019;66:1073‐1082. doi: 10.1507/endocrj.EJ19-0107 [DOI] [PubMed] [Google Scholar]
- 16. Rajamanickam A, Munisankar S, Dolla CK, Thiruvengadam K, Babu S. Impact of malnutrition on systemic immune and metabolic profiles in type 2 diabetes. BMC Endocr Disord. 2020;20:168. doi: 10.1186/s12902-020-00649-7 [DOI] [PMC free article] [PubMed] [Google Scholar]
- 17. Takahashi F, Hashimoto Y, Kaji A, et al. Association between geriatric nutrition risk index and the presence of sarcopenia in people with type 2 diabetes mellitus: a cross‐sectional study. Nutrients. 2021;13:4, 9, 17. doi: 10.3390/nu13113729 [DOI] [PMC free article] [PubMed] [Google Scholar]
- 18. Xie Y, Zhang H, Ye T, Ge S, Zhuo R, Zhu H. The geriatric nutritional risk index independently predicts mortality in diabetic foot ulcers patients undergoing amputations. J Diabetes Res. 2017;2017:5797194. doi: 10.1155/2017/5797194 [DOI] [PMC free article] [PubMed] [Google Scholar]
- 19. Jiang B, He ZH, Li AP. Clinical investigation and study on related influencing factors of nutritional status in diabetic patients. Med Recapit. 2012;18. [Google Scholar]
- 20. Shiroma K, Tanabe H, Takiguchi Y, et al. A nutritional assessment tool, GNRI, predicts sarcopenia and its components in type 2 diabetes mellitus: a Japanese cross‐sectional study. Front Nutr. 2023;10:1087471. doi: 10.3389/fnut.2023.1087471 [DOI] [PMC free article] [PubMed] [Google Scholar]
- 21. Ye XY, Tong XW, Deng ZH, et al. Evaluation of nutritional status and influencing factors of inpatients with type 2 diabetes. Int J Lab Med. 2020;41:1310‐1313. [Google Scholar]
- 22. Zhang XM, Wei L, Lu D. Screening of nutritional status and analysis of factors related to malnutrition in patients with type 2 diabetes mellitus. Pract Prev Med. 2021;28:605‐607. [Google Scholar]
- 23. Ji Y, Geng N, Niu Y, et al. Relationship between geriatric nutritional risk index and osteoporosis in type 2 diabetes in northern China. BMC Endocr Disord. 2022;22:308. doi: 10.1186/s12902-022-01215-z [DOI] [PMC free article] [PubMed] [Google Scholar]
- 24. He BX, Gu SL, Jin YA, Zhang LZ, Jiang YF. Analysis of malnutrition occurrence and influencing factors in elderly female diabetic foot ulcer patients. Chin J Matern Child Health. 2020;35:4840‐4842. doi: 10.19829/j.zgfybj.issn.1001-4411.2020.24.063 [DOI] [Google Scholar]
- 25. Li H, Fu P, Zhang L, et al. c patients with type 2 diabetes mellitus based on controlling nutritional status score and multivariate logistic regression analysis of its risk factors. Prog Mod Biomed. 2023;23:945‐948+990. doi: 10.13241/j.cnki.pmb.2023.05.029 [DOI] [Google Scholar]
- 26. Ran NN, Shi MQ, Xue J, Ren SS, Yu R, Fu J. Nutritional status and related factors of malnutrition in elderly inpatients with diabetic foot ulcer. South China J Prev Med. 2021;47:1523‐1527. [Google Scholar]
- 27. Sanz París A, García JM, Gómez‐Candela C, Burgos R, Martín Á, Matía, P. Malnutrition prevalence in hospitalized elderly diabetic patients. Nutr Hosp. 2013;28:592‐599. doi: 10.3305/nh.2013.28.3.6472 [DOI] [PubMed] [Google Scholar]
- 28. Shi HY, Zhu P, Zhang M, Wang AH. Correlation between controlling nutritional status scores and amputation risks in patients with diabetic foot ulcers. J Sichuan Univ Med Sci Ed. 2022;53:993‐997. doi: 10.12182/20221160209 [DOI] [PMC free article] [PubMed] [Google Scholar]
- 29. Tasci I, Safer U, Naharci MI. Multiple antihyperglycemic drug use is associated with undernutrition among older adults with type 2 diabetes mellitus: a cross‐sectional study. Diabetes Ther. 2019;10:1005‐1018. doi: 10.1007/s13300-019-0602-x [DOI] [PMC free article] [PubMed] [Google Scholar]
- 30. Saintrain MVL, Sandrin R, Bezerra CB, Lima AOP, Nobre MA, Braga DRA. Nutritional assessment of older adults with diabetes mellitus. Diabetes Res Clin Pract. 2019;155:107819. doi: 10.1016/j.diabres.2019.107819 [DOI] [PubMed] [Google Scholar]
- 31. Gonzalez MC, Correia M, Heymsfield SB. A requiem for BMI in the clinical setting. Curr Opin Clin Nutr Metab Care. 2017;20:314‐321. doi: 10.1097/mco.0000000000000395 [DOI] [PubMed] [Google Scholar]
- 32. Ma LL, Wang YY, Yang ZH, Huang D, Weng H, Zeng XT. Methodological quality (risk of bias) assessment tools for primary and secondary medical studies: what are they and which is better? Mil Med Res. 2020;7:7. doi: 10.1186/s40779-020-00238-8 [DOI] [PMC free article] [PubMed] [Google Scholar]
- 33. Egger M, Davey Smith G, Schneider M, Minder C. Bias in meta‐analysis detected by a simple, graphical test. BMJ. 1997;315:629‐634. doi: 10.1136/bmj.315.7109.629 [DOI] [PMC free article] [PubMed] [Google Scholar]
- 34. Huang C, Xu Jing, Wang J, et al. Application of Mini‐Nutritional Assessment on diabetic patients. Prac Prev Med. 2011;18:624‐625. [Google Scholar]
- 35. Kong JH, Zhang J, Hua Y, Cui YJ, Fan XX. The application of nutritional risk screening in nutritional assessments of elderly patients with diabetic nephropathy. Chin J Clin Healthc. 2017;20:58‐60. [Google Scholar]
- 36. Lu X, Bai JJ, Wang Z, Chen LR. The level and influence factors of nutritional status among elderly patients with diabetic nephropathy. Chin J Nurs Educ. 2015;12:344‐347. [Google Scholar]
- 37. Lu XY, Bai JJ, Sun J, Lu X, Chen LR, Mao H. Evaluation of nutritional status of hospitalized elderly with diabetes and analysis of related factors. Geriatr Health Care. 2019;25:79‐82. [Google Scholar]
- 38. Lv LX, Huang LR, Lao ML, Wang FN, Yu ZH, Wei AS. Nutritional status and its influencing factors in elderly patients with diabetic foot ulcers. Chin J Nurs. 2017;52:332‐335. [Google Scholar]
- 39. Pan SQ, Chen X, Lu MY, Lun LH, Ye LX, Li NZ. Analysis on nutritional risk screening of 456 hospitalized patients with type 2 diabetes mellitus. Guangxi Med J. 2016;38:681‐683. [Google Scholar]
- 40. Shen J, Li T, Zhang Y, Li J. Nutritional assessment for the elderly diabetic patients aged 80 and over. Pract Geriatr. 2014;28:826‐828. [Google Scholar]
- 41. Shi HP, Liang XX. Analysis of nutritional status of inpatients with type 2 diabetes mellitus. Elect J Metab Nutr Cancer. 2019;6:342‐345. doi: 10.16689/j.cnki.cn11-9349/r.2019.03.014 [DOI] [Google Scholar]
- 42. Mei‐yan MY, Yin J, Shi M. Evaluation and analysis on nutritional status of diabetes inpatients. Food Nutr. China. 2014;20:84‐87. [Google Scholar]
- 43. Ahmed I, Kaifi HM, Tahir H, Javed A. Malnutrition among patients with type‐2 diabetes mellitus. Pak J Med Sci. 2023;39:64‐69. doi: 10.12669/pjms.39.1.5485 [DOI] [PMC free article] [PubMed] [Google Scholar]
- 44. Gau BR, Chen HY, Hung SY, et al. The impact of nutritional status on treatment outcomes of patients with limb‐threatening diabetic foot ulcers. J Diabetes Complications. 2016;30:138‐142. doi: 10.1016/j.jdiacomp.2015.09.011 [DOI] [PubMed] [Google Scholar]
- 45. Lim EJ. Factors influencing mobility relative to nutritional status among elderly women with diabetes mellitus. Iran J Public Health. 2018;47:814‐823. [PMC free article] [PubMed] [Google Scholar]
- 46. Tamer A, Demir MV, Cinemre H, Kaya T, Nalbant A. Nutritional screening of outpatient type 2 diabetes mellitus patients. Kuwait Med J. 2018;50:337‐342. [Google Scholar]
- 47. Vural Keskinler M, Feyİzoglu G, Yildiz K, Ogu, A. The frequency of malnutrition in patients with type 2 diabetes. Medeniyet Med J. 2021;36:117‐122. doi: 10.5222/mmj.2021.44270 [DOI] [PMC free article] [PubMed] [Google Scholar]
- 48. Yildirim ZG, Uzunlulu M, Caklili OT, Mutlu H, Oğuz A. Malnutrition rate among hospitalized patients with type 2 diabetes mellitus. Prog Nutr. 2018;20:183‐188. doi: 10.23751/pn.v20i2.6164 [DOI] [Google Scholar]
- 49. Chen Y, Wang P. Effect of glycated hemoglobin levels on nutritional status of elderly patients with diabetic nephropathy. Food Nutr. China. 2023;29:81‐83+88. doi: 10.19870/j.cnki.11-3716/ts.2023.01.001 [DOI] [Google Scholar]
- 50. Chu YM, Wei GY, Jiang B, Meng JH, Zhang K. Occurrence of malnutrition and its influencing factors in elderly patients with type 2 diabetes mellitus. Clin Misdiag Misther. 2020;33:57‐61. [Google Scholar]
- 51. Huang QJ, Wu J, Lin S, et al. Study on the current status of malnutrition risk and factors affecting patients with type 2 diabetes mellitus combined with macroangiopathy. Hebei Med. 2022;28:1502‐1506. [Google Scholar]
- 52. Lai LH, Huang Q, Chen SG, et al. Investigation on nutritional risk for inpatients with type 2 diabetes mellitus complicated with chronic complications. Guangxi Med J. 2022;44:1615‐1618. [Google Scholar]
- 53. Huang LR, Lv LX, Lao ML, Lai LH. Relationship between nutritional risk of patients with diabetic foot and their clinical prognosis and quality of life. Chin Nurs Res. 2020;34: 9, 17. [Google Scholar]
- 54. Kimura Y, Kimura N, Akazawa M. Increased nutrition‐related risk as an independent predictor of the incidence of hypoglycemia in the hospitalized older individuals with type 2 diabetes: a single‐center cohort study. Diabetol Int. 2021;12:420‐429. doi: 10.1007/s13340-021-00499-1 [DOI] [PMC free article] [PubMed] [Google Scholar]
- 55. Sanz‐París A, Gómez‐Candela C, Martín‐Palmero Á, et al. Application of the new ESPEN definition of malnutrition in geriatric diabetic patients during hospitalization: a multicentric study. Clin Nutr. 2016;35:1564‐1567. doi: 10.1016/j.clnu.2016.02.018 [DOI] [PubMed] [Google Scholar]
- 56. Zhang SS, Tang ZY, Fang P, Qian HJ, Xu L, Ning G. Nutritional status deteriorates as the severity of diabetic foot ulcers increases and independently associates with prognosis. Exp Ther Med. 2013;5:215‐222. doi: 10.3892/etm.2012.780 [DOI] [PMC free article] [PubMed] [Google Scholar]
- 57. Crichton M, Craven D, Mackay H, Marx W, de van der Schueren M, Marshall S. A systematic review, meta‐analysis and meta‐regression of the prevalence of protein‐energy malnutrition: associations with geographical region and sex. Age Ageing. 2019;48:38‐48. doi: 10.1093/ageing/afy144 [DOI] [PubMed] [Google Scholar]
- 58. Marshall S. Why is the skeleton still in the hospital closet? A look at the complex Aetiology of protein‐energy malnutrition and its implications for the nutrition care team. J Nutr Health Aging. 2018;22:26‐29. doi: 10.1007/s12603-017-0900-9 [DOI] [PubMed] [Google Scholar]
- 59. Lu BC, Ding CZ, Zhao Y‐L, Xue J, Huang L, Sun J. Research on the relationship between nutritional status and brachial‐ankle pulse wave velocity in elderly patients with type 2 diabetes mellitus. Chin J Mod Med. 2019;29:103‐107. [Google Scholar]
- 60. Skipper A, Coltman A, Tomesko J, et al. Adult malnutrition (undernutrition) screening: an evidence analysis center systematic review. J Acad Nutr Diet. 2020;120:669‐708. doi: 10.1016/j.jand.2019.09.010 [DOI] [PubMed] [Google Scholar]
- 61. van Bokhorst‐de van der Schueren MA, Guaitoli PR, Jansma EP, de Vet HC. Nutrition screening tools: does one size fit all? A systematic review of screening tools for the hospital setting. Clin Nutr. 2014;33:39‐58. doi: 10.1016/j.clnu.2013.04.008 [DOI] [PubMed] [Google Scholar]
- 62. Xi WZ, Wu C, Liang YL, Wang LL, Cao YH. Analysis of malnutrition factors for inpatients with chronic kidney disease. Front Nutr. 2022;9:1002498. doi: 10.3389/fnut.2022.1002498 [DOI] [PMC free article] [PubMed] [Google Scholar]
- 63. Ko Y, Kim C, Park YB, Mo EK, Moon JW. Changes in nutritional status in pulmonary tuberculosis: longitudinal changes in BMI according to acid‐fast bacilli smear positivity. J Clin Med. 2020;9:27. doi: 10.3390/jcm9124082 [DOI] [PMC free article] [PubMed] [Google Scholar]
- 64. Wessels J, Nel M, Walsh CM. A nutritional profile of patients with tuberculosis at Standerton Tuberculosis Specialised Hospital, Mpumalanga, South Africa. Health SA. 2021;26:1594. doi: 10.4102/hsag.v26i0.1594 [DOI] [PMC free article] [PubMed] [Google Scholar]
- 65. Evans DC, Corkins MR, Malone A, et al. The use of visceral proteins as nutrition markers: an ASPEN position paper. Nutr Clin Pract. 2021;36:22‐28. doi: 10.1002/ncp.10588 [DOI] [PubMed] [Google Scholar]
- 66. Gabay C, Kushner I. Acute‐phase proteins and other systemic responses to inflammation. N Engl J Med. 1999;340:448‐454. doi: 10.1056/nejm199902113400607 [DOI] [PubMed] [Google Scholar]
- 67. Frangos E, Trombetti A, Graf CE, et al. Malnutrition in very old hospitalized patients: a new etiologic factor of anemia? J Nutr Health Aging. 2016;20:705‐713. doi: 10.1007/s12603-015-0641-6 [DOI] [PubMed] [Google Scholar]
- 68. Shirahata T, Sato H, Yogi S, et al. Possible association of high‐density lipoprotein cholesterol levels with trunk muscle deficits and decrease in energy expenditure in patients with or at risk for COPD: a pilot study. Respir Investig. 2022;60:720‐724. doi: 10.1016/j.resinv.2022.06.005 [DOI] [PubMed] [Google Scholar]
- 69. Wewer Albrechtsen NJ, Junker AE, Christensen M, et al. Hyperglucagonemia correlates with plasma levels of non‐branched‐chain amino acids in patients with liver disease independent of type 2 diabetes. Am J Physiol Gastrointest Liver Physiol. 2018;314:G91‐g96. doi: 10.1152/ajpgi.00216.2017 [DOI] [PubMed] [Google Scholar]
- 70. Tu XW, Tu TQ, Yu J, Li YC. Analysis of serum ferritin and high sensitive C‐reactive protein levels in hemodialysis patients with type 2 diabetes mellitus. Chin J Integr Trad West Nephrol. 2017;18:430‐432. [Google Scholar]
- 71. Soenen S, Rayner CK, Jones KL, Horowitz M. The ageing gastrointestinal tract. Curr Opin Clin Nutr Metab Care. 2016;19:12‐18. doi: 10.1097/mco.0000000000000238 [DOI] [PubMed] [Google Scholar]
- 72. Sun JH, Tsai JS, Huang CH, et al. Risk factors for lower extremity amputation in diabetic foot disease categorized by Wagner classification. Diabetes Res Clin Pract. 2012;95:358‐363. doi: 10.1016/j.diabres.2011.10.034 [DOI] [PubMed] [Google Scholar]
- 73. Wei Y, Ren HB, Liu B, Xu WJ. The clinical observation of enteral nutrition in adults receiving extracorporeal membrane oxygenation after cardiac surgery procedure. Parenter Enteral Nutr. 2015;22:88‐91. doi: 10.16151/j.1007-810x.2015.02.008 [DOI] [Google Scholar]
- 74. Jenkins DJ, Wolever TM, Buckley G, et al. Low‐glycemic‐index starchy foods in the diabetic diet. Am J Clin Nutr. 1988;48:248‐254. doi: 10.1093/ajcn/48.2.248 [DOI] [PubMed] [Google Scholar]
- 75. Chen N, Li Y, Fang J, Lu Q, He L. Risk factors for malnutrition in stroke patients: a meta‐analysis. Clin Nutr. 2019;38:127‐135. doi: 10.1016/j.clnu.2017.12.014 [DOI] [PubMed] [Google Scholar]
- 76. Wilson R, Willis J, Gearry R, et al. Inadequate vitamin C status in prediabetes and type 2 diabetes mellitus: associations with glycaemic control, obesity, and smoking. Nutrients. 2017;9:30. doi: 10.3390/nu9090997 [DOI] [PMC free article] [PubMed] [Google Scholar]
- 77. Bonger Z, Shiferaw S, Tariku EZ. Adherence to diabetic self‐care practices and its associated factors among patients with type 2 diabetes in Addis Ababa, Ethiopia. Patient Prefer Adherence. 2018;12:963‐970. doi: 10.2147/ppa.S156043 [DOI] [PMC free article] [PubMed] [Google Scholar]
- 78. Zhang S, Chen Y, Sun S, et al. Effects of multi‐component exercise training on frailty and physical function in elderly diabetic patients in communities. Chin J Nurs. 2020;55:1445‐1451. [Google Scholar]
Associated Data
This section collects any data citations, data availability statements, or supplementary materials included in this article.
Supplementary Materials
Figure S1. Sensitivity analysis of malnutrition prevalence.
Figure S2. Sensitivity analysis of at‐risk for malnutrition prevalence.
Figure S3. GRADE ratings for the relevant between influencing factors with malnutrition.
Table S1. Search strategy.
Table S2. Measurement tools of nutritional disorder.
Table S3. Newcastle‐Ottawa Scale (NOS) assessment of the quality of cohort studies.
Table S4. Methodological quality assessment of included studies using the Joanna Briggs Institute's (JBI) critical appraisal checklist.