Abstract
When an optical beam passes through a thin slice of a homogeneous material, the change of its phase and amplitude is characterized by the material’s linear and nonlinear susceptibility, the latter also known as the hyperpolarizability. The standard method for measuring the nonlinear susceptibility is the scan. This widely used method is sometimes applied outside of its range of validity, leading to systematic errors. These errors are illustrated for a two-level system with parameters taken from atomic rubidium. The present paper proposes a method called the phase retrieval of modes to determine the nonlinear susceptibility without an assumption about its functional form, in contrast to both the -scan method and variants intended to apply in cases of saturation. In brief, a Gaussian beam passes through a thin sample and is detected on three planes in a focal scan. Phase retrieval methods are used to find coefficients of the modes which in turn determine the optical nonlinear susceptibility. Nearly exact recovery of the nonlinear susceptibility is shown numerically in the no-noise case. Additionally, two types of noise are considered: shot noise on the detector and intensity fluctuations of the input.
I. INTRODUCTION
The manipulation of light by light has been a key theme for optics research in recent years [1,2]. For example, hot atomic vapors are good sources of nonclassical light [3]. In a typical experiment in nonlinear optics, a high-power beam known as the pump prepares the system in some state. Other beams with names such as the probe and conjugate, or the signal and idler, enter and interact with the medium, possibly with a time delay. The beam of interest may emerge nearly instantaneously, or after a delay of microseconds to milliseconds in quantum memory [4]. The beams may have specified frequency, phase, intensity, and timing relations to each other as in the “counterintuitive pulse sequence” used for the adiabatic transfer of electrons in a three-level system [5].
The Kerr effect—the change of the index of refraction with the intensity of the light—is arguably the simplest nonlinear optical phenomenon since it involves a single beam at a single frequency without modulation such as an atomic frequency comb [6] or a chirp [7]. Atomic vapor systems can be saturated under common laboratory conditions [8]. A good starting point for a theory able to make predictions in quantum optics is the ability to describe the saturated Kerr effect. In principle, it is possible to predict these values by examination of a density matrix determined by a Lindblad master equation [9]. The rate equations offer a simpler alternative [10], albeit one with a smaller range of validity.
The scan is a widely used method to measure Kerr coefficients [11,12]. The -scan method is relatively simple to implement since it requires moving a sample through the focus of a laser beam with a single-channel detector in the far field. The method assumes that the Kerr coefficient is not saturated, i.e., that the index of refraction obeys
| (1) |
where is the linear index of refraction, is the unsaturated Kerr coefficient, is the optical intensity, and is the intensity-dependent index of refraction. Both and are complex numbers which are independent of the intensity. For the scan to be valid, the functional form of Eq. (1) must hold and .
The -scan method has been used for many measurements of the Kerr coefficient. In most cases, the third-order nonlinearity is weak and the assumptions of the method are valid. However, the -scan method has also been used to measure the saturated Kerr coefficient which is a function of and the assumption of a weak nonlinearity is not always valid. Restricting attention to cases in which the Kerr coefficient was saturated, there are still many measurements including rubidium [8,13], cesium [14,15], ruby and alexandrite [16], GaSb and GaInAsSb [17], tin diselenide [18], PbO [19], poly (3-hexadecylthiophene) [20], and polydiacetylene single crystals [21]. This list is representative, but not exhaustive. Refinement of the -scan method remains a topic of current research interest [22].
Oliveira et al. [16] and Bian et al. [23] generalized the scan to a particular functional form suitable for a two-level system, still requiring a small contribution to the nonlinear index. While this represents some progress, even two independent two-level systems with different parameters will follow a more general rule, and more general model forms for the optical nonlinear susceptibility have been proposed [24]. In another variant of the scan, Gao et al. [25] analyze the use of Gaussian-Bessel beams in the -scan method to improve understanding of saturation in Rb vapor, generalizing the original incident Gaussian beam. A more radical alternative from the scan and its generalizations is a spectral method to measure the saturated nonlinear susceptibility [26].
In the present paper, the systematic errors which result if the standard -scan method is applied to the measurement of the saturated Kerr coefficient for a two-level system are detailed in Sec. II. Such errors can amount to 100% errors in practical cases. Given the motivation to reduce such errors, a measurement method called the phase retrieval of modes (PROM) is proposed. The method allows an accurate measurement of the saturated Kerr coefficient regardless of the functional form of the nonlinear susceptibility. The hope is that PROM will lead to higher precision measurements of the saturated nonlinear susceptibility of atomic vapors. Such measurements, in turn, can be compared to results from fundamental theory [9,10].
II. -SCAN METHOD
A. Statement of the problem
When light passes through a thin sample of a nonlinear medium at normal incidence, in the absence of absorption, the medium changes the phase of the light at its exit face. Thereafter, beam propagation is described by Fresnel diffraction. In the far field, the Fresnel diffraction takes on the limiting form of the Fraunhofer diffraction formula: the intensity is given by a Fourier transform of the input with appropriate scaling [27]. A given point in the observation plane will have a strong dependence on an ever-increasing portion of the sample as the sample-detector distance increases, including the entire illuminated section of the exit face in the far-field limit. Differences in the phase across the exit face influence the intensity downstream, so the linear susceptibility, related to , is not measurable using a single beam. Although the -scan method is typically implemented with a small aperture detector in the far field, the signals reaching the detector depend on the phase induced over the whole region illuminated by a Gaussian beam, not simply the value at the maximum. In order for a single-channel measurement to determine the nonlinear susceptibility, there must be a known functional form for the susceptibility, namely Eq. (1) in the original method [11,12]. In the following, I will give an example of the consequences of assuming Eq. (1) holds for a two-level system, where it does not. The systematic errors which can arise in practice [8] motivate the development of an experimental method which makes fewer assumptions about the functional form of the nonlinear susceptibility.
B. The -scan method for the Kerr coefficient in the low-intensity limit
In the -scan method [11,12], a Gaussian mode is incident on a thin Kerr medium, positioned at with a detector located in the far field. The -scan method is intended to apply if there is an ideal Kerr susceptibility, given by Eq. (1). The incident wave gives rise to a second wave which is first order in . Functional forms are given in Appendix A. The transmission is the ratio of intensities detected on axis by a small aperture detector with and without the medium and is given by
| (2) |
where the superscript (0) indicates the fields are taken on axis. (“Transmission”, as defined in the -scan literature, may exceed 1.) The final term is neglected in the -scan method, as it is in holography. The Kerr coefficient can be found experimentally by fitting to the function
| (3) |
where is the phase change due to the central field at the focus and is the position of the Kerr medium relative to the laser focus in units of the Rayleigh length, given in Eq. (B2). An experimental Kerr coefficient can be found by fitting to the function in Eq. (3). A formula for the scan with the detector at a finite position on axis is given in Appendix A. Equation (3) is the far-field limit of Eq. (A7).
C. Susceptibility of the two-level system
Equation (1) is not a fundamental principle, but rather a term in a Taylor expansion of the susceptibility as a function of intensity. To generate a realistic saturated Kerr susceptibility, I choose a two-level system. A solution is given in the text of Grynberg, Aspect, and Fabre (GAF) [28]. Slightly adapting GAF’s Eq. (2.188), the susceptibility is given by
| (4) |
where is the number density of atoms, is the dipole moment of the transition, is the permittivity of free space, is the reduced Planck’s constant, is the spontaneous emission rate, and is the angular Rabi frequency defined in Eq. (B3). Equation (4) uses the detuning where is the angular frequency of the light and is the angular transition frequency between the ground state and the excited state. The form given here assumes any decoherence is due to spontaneous emission, and not, for example, collisional broadening, as discussed in the text. GAF introduce the saturation parameter ,
| (5) |
in GAF’s Eq. (2.189). GAF’s Eq. (2.180),
| (6) |
follows from Eqs. (4) and (5), where is the limit of Eq. (4). The saturation parameter is related to the intensity by with given by
| (7) |
Equation (7) follows from setting and using Eqs. (5), (B1), and (B3) from Appendix B, which also contains a table of parameters used in the calculation.
The saturated Kerr susceptibility is given by
| (8) |
where
| (9) |
which may be compared to Eq. (1). The unsaturated Kerr coefficient is given by the low-field limit which is the same as the limit. Hence,
| (10) |
D. The -scan method and the saturated Kerr coefficient
The -scan method was not designed to measure the saturated Kerr coefficient. Some examples of the systematic error which results from applying the -scan method in the saturated regime are given next. The susceptibility will be given by the two-level system, with parameters selected for Rb vapor [29]. See also Appendix B. Our procedure is as follows.
Choose a set of peak incident fields for the Gaussian beams.
Find using the two-level system susceptibility.
Find the electric field at the exit face.
Expand the electric field at the exit face into Laguerre-Gauss basis functions.
Find the intensity at the detector.
Find the peak-valley difference in a scan for each peak incident field using an expansion into Laguerre-Gauss modes.
Relate the peak-valley difference to the maximum induced phase , using Eq. (3).
From this phase and assumed system-geometry parameters, determine .
The theoretically known value of is compared to its counterpart as determined by the -scan method, as used by McCormick et al. [8].
Of these steps, the first five are performed only in a simulation and the last four are performed either in simulation or in an experiment. Next, more details are given with specialization to the present case.
Step 1. Three examples are chosen bracketing the saturation field of 38 kV/m in the Rb-like example [29].
Step 2. For the two-level system, use the formulas presented in Sec. IIC.
Step 3. The field incident on the thin Kerr medium is given by
| (11) |
where and are the respective positions just before and just after entering the thin sample at . Also, is a dimensionless radial coordinate. (The symbol is chosen because it is a capital .) The intensity is given by
| (12) |
using Eq. (B1). Variations of within the thin Kerr medium are assumed to be negligible. Upon exit, the field is modified to
| (13) |
where is the free-space wavelength, is the thickness of the Kerr medium, and is given by Eq. (12). To derive the -scan results, the first two terms of the second exponential in Eq. (13) are retained. Here, there is no assumption that the argument of the second exponential is small.
The function is shown for various incident intensities in Fig. 1. For the input field shown, the exit field is given under three different sets of assumptions. The curves labeled “Exact” use the saturated form of the susceptibility and the exponential phase factor. These are the exact answers. The curves labeled “K” assume that the unsaturated Kerr susceptibility holds and the exponential phase factor is applied. The curves labeled “” use the approximations of the scan, namely the unsaturated Kerr susceptibility and a linear approximation to the exponential phase factor. Below saturation, these three approximations lead to very similar results, as shown in Fig. 1(a). If the central field is a little into saturation, deviations exceeding 10% are seen in Fig. 1(b). Finally, well into saturation, as shown in Fig. 1(c), the three curves are qualitatively different including a near node in the -scan case which is absent in the exact case. Even at this early stage in the analysis, it is doubtful that the -scan field could differ so greatly from the exact field and still produce an accurate result for the susceptibility.
FIG. 1.
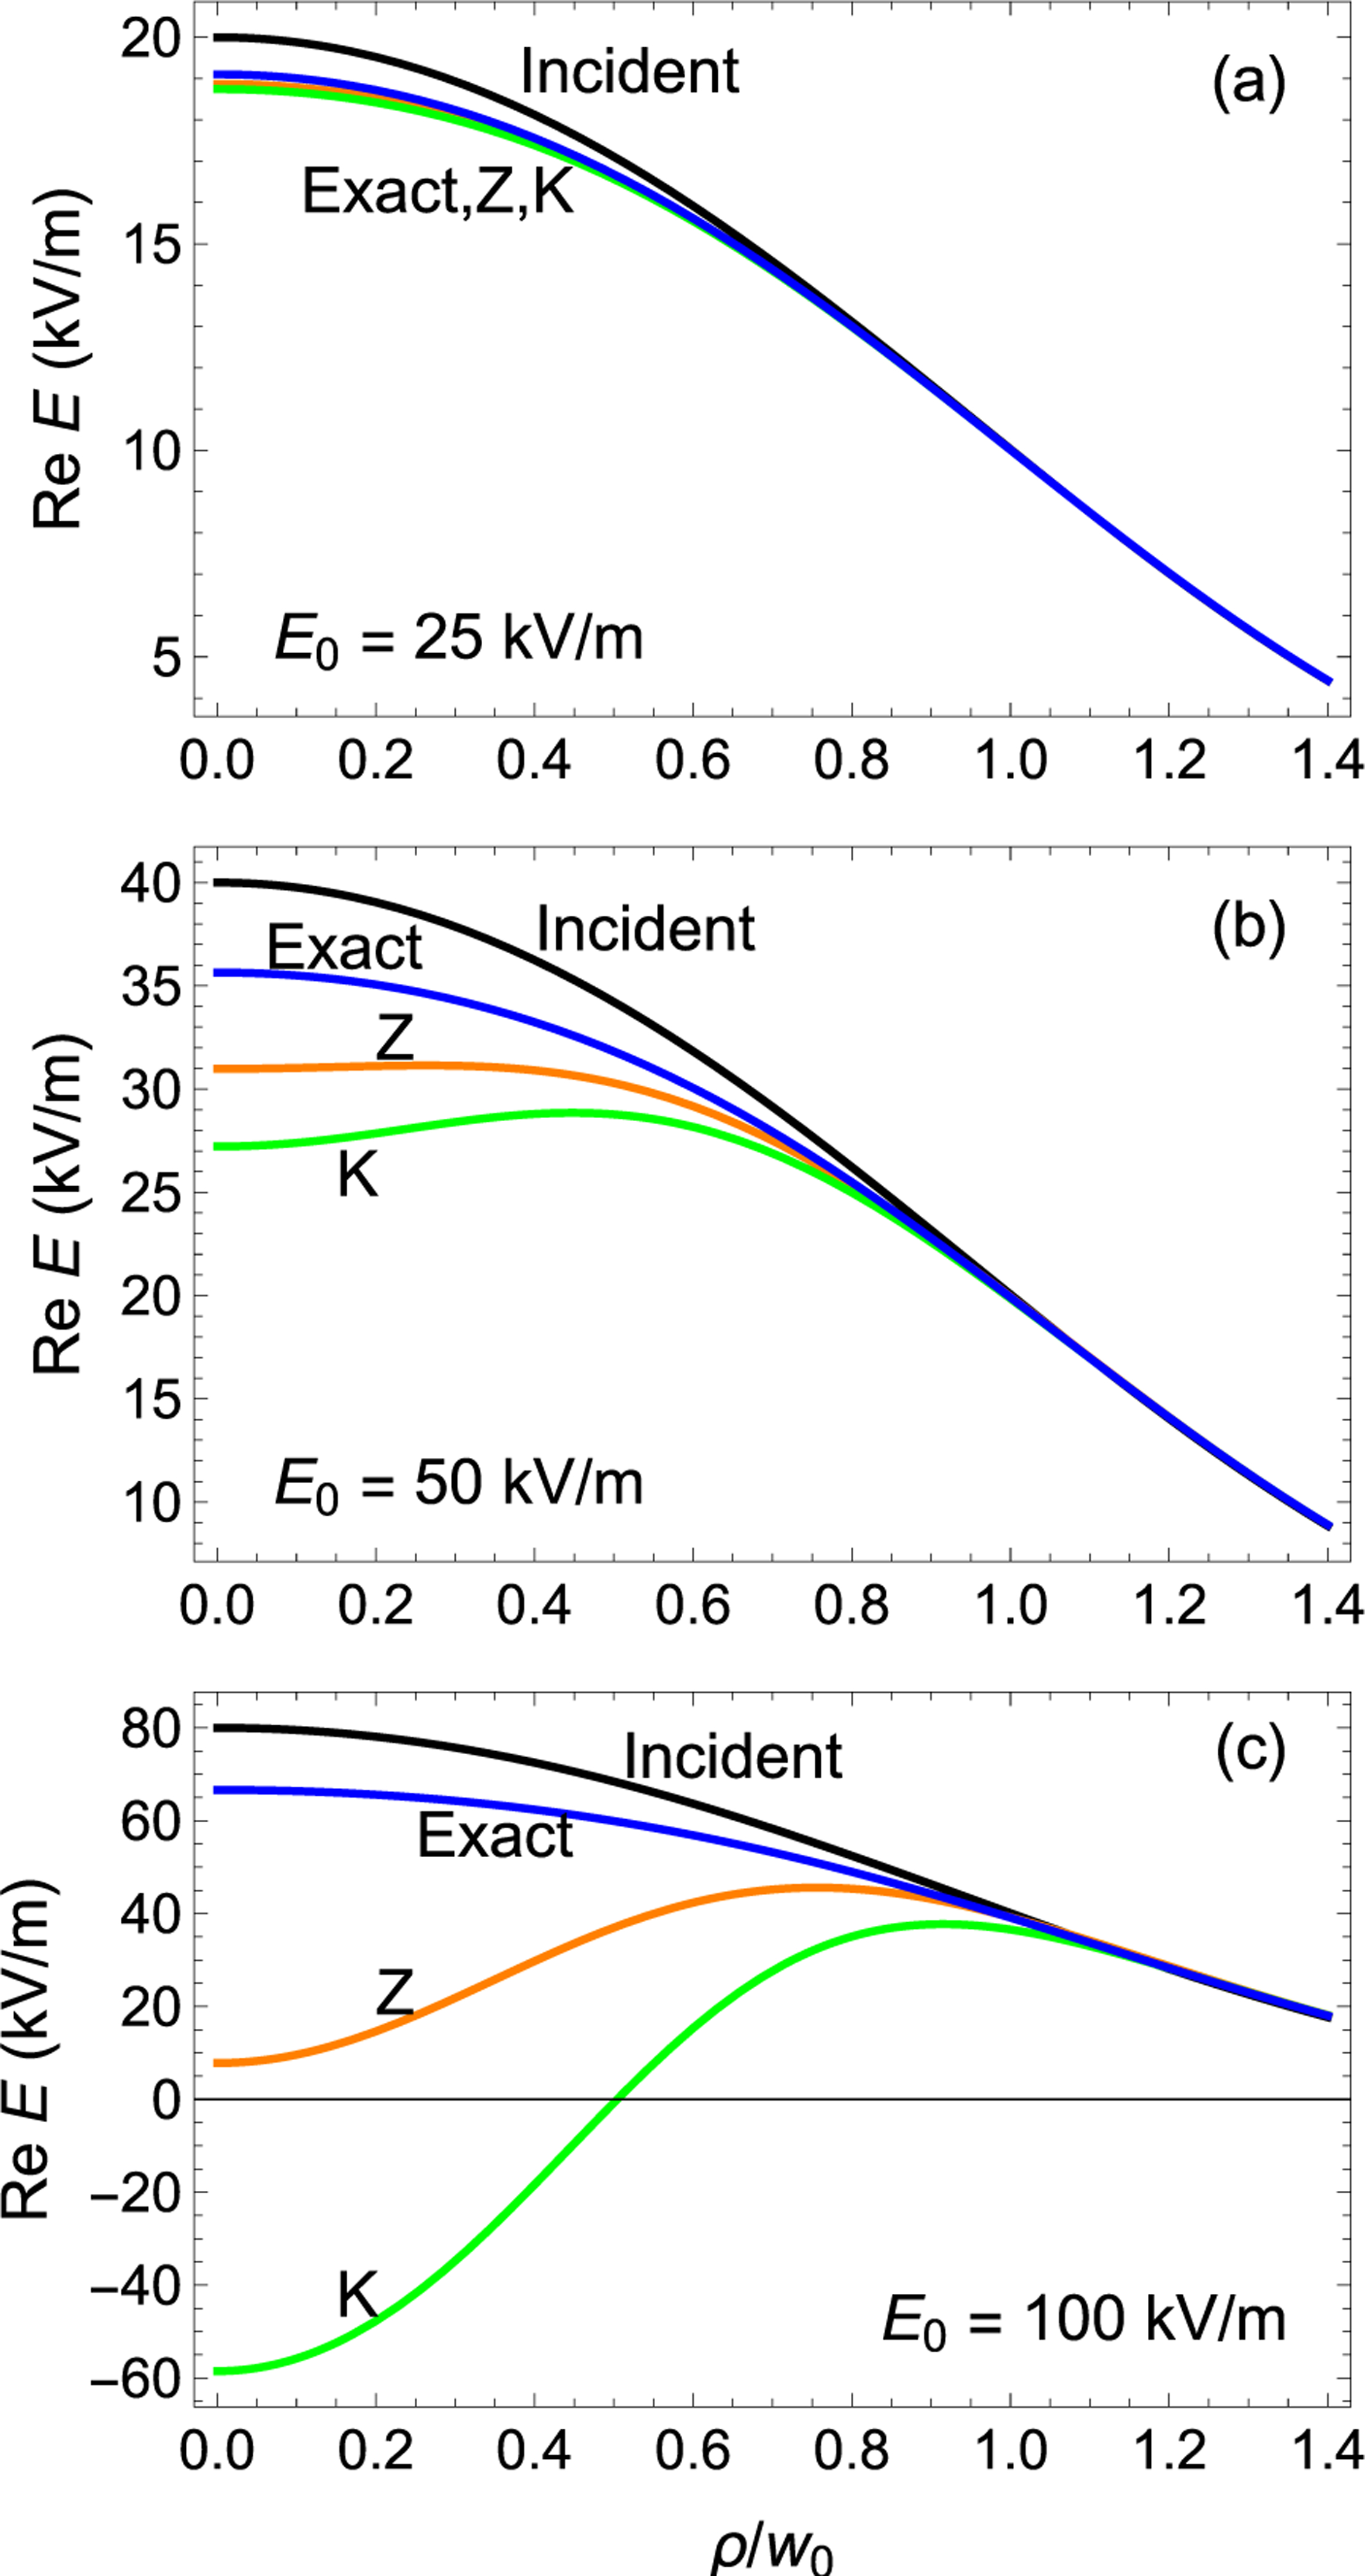
The real part of the electric field is given for (Incident, black) an incident Gaussian beam with maximum field strengths on of (a) 25 kV/m, (b) 50 kV/m, and (c) 100 kV/m, for the field after passing through a thin Kerr medium with parameters from Ref. [8] as approximated (Exact, blue) using the saturable nonlinear susceptibility from a two-level system. (Z, orange) denotes the approximation of the -scan method, and (K, green) denotes an ideal Kerr susceptibility. The labels are further defined in Table I. For this system, corresponds to 38 kV/m.
Step 4. Before and after interacting with a thin sample at , a Gaussian beam is given by Eqs. (11) and (13), respectively. We wish to find the Laguerre-Gaussian expansion coefficients of Eq. (13). The index of refraction is written as because it depends on the intensity of the light, which, in turn depends on and , which are proportional to and . The designation NL means that the real part of the linear index of refraction is subtracted off, i.e., . The position dependence of is due to the intensity of the beam in a Kerr medium. Let
| (14) |
Further details of how the electric field in the exit face is expanded into a series of Laguerre-Gauss functions are given in Appendix C.
The results of the expansion for the case of 100 kV/m on the two-level system example are given in Fig. 2. The real and imaginary parts of the exact ratio of electric fields are compared with expansions with 5, 10, 15, and 20 basis functions. Even five basis functions are sufficient to describe the electric field to a little past . Adding more functions extends the region of agreement to larger , i.e., to about with 20 basis functions. Numerically, I fit to the electric field past the sample and then divide by it before the sample. Since the electric field falls off like a Gaussian, this is an inherently noisy process at large radius. Nevertheless, is well described where it differs significantly from 1.
FIG. 2.
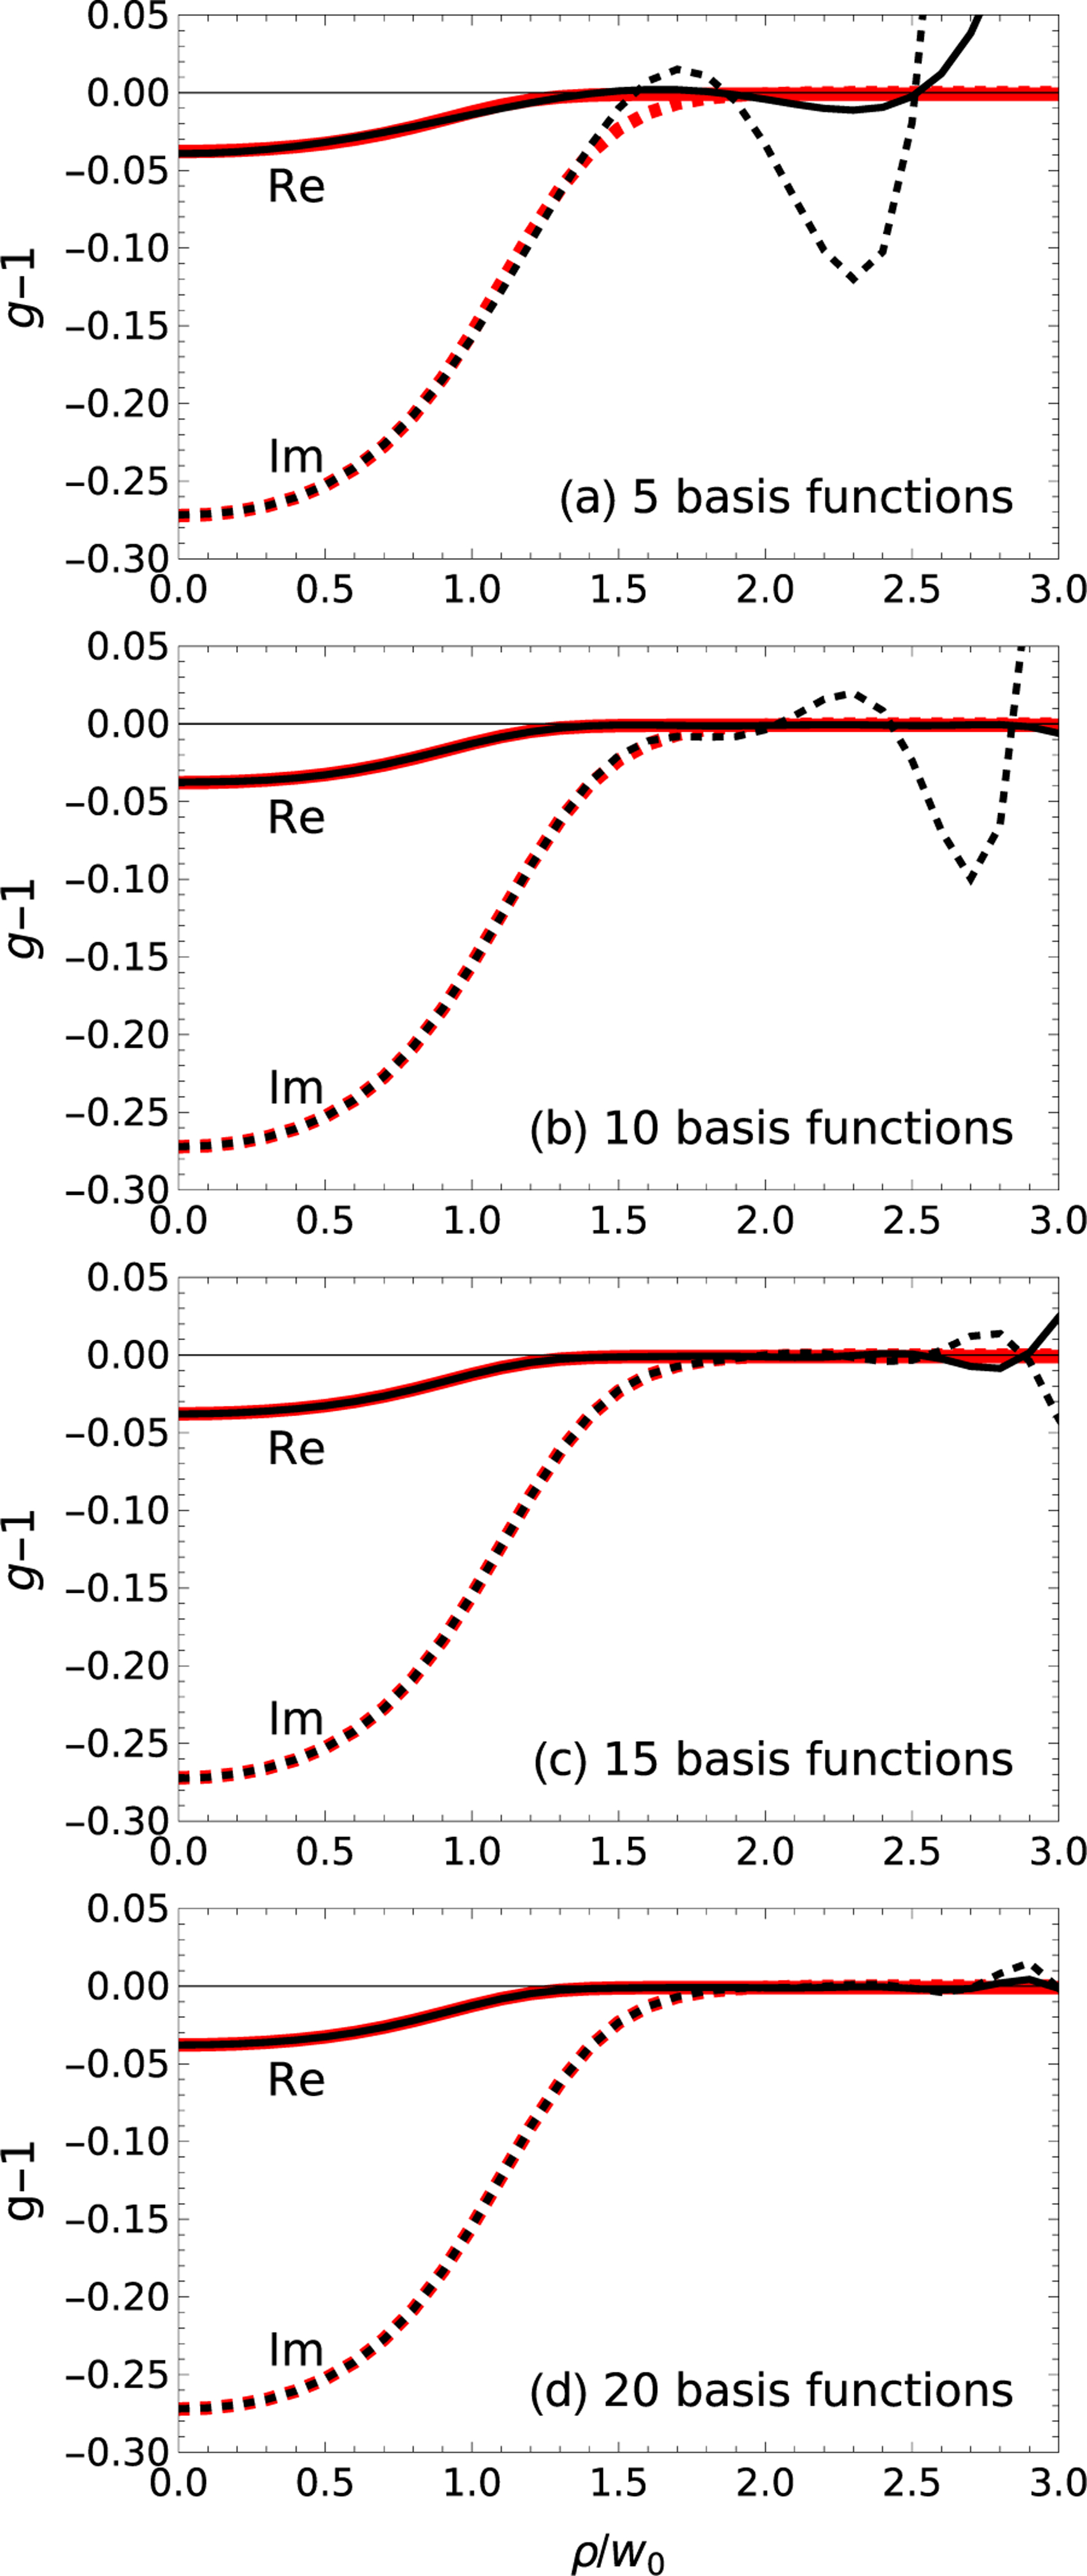
True function (solid red) vs finite Laguerre-Gauss expansion with 5, 10, 15, and 20 basis functions (dashed black) for a maximum central field of 100 kV/m. The thin Kerr medium is at the focus . This fit is made to the electric field just past the sample.
Step 5. The intensity on the detector plane is found by forming the electric field there using the Laguerre-Gauss modes whose functional form is given below in Eq. (18). For the scan, this expression should be evaluated with and taking on the value of the detector position. Rather than working out the far-field limit, for convenience, the detector plane is taken to be at . See Appendix A for a formula which shows the finite field transmission. The square of the electric field is proportional to the intensity, with the proportionality constant given in Eq. (B1).
Step 6. To implement this step, is varied with the detector position held fixed.
Step 7. No additional explanation is needed.
Step 8. The phase accumulated by passing through a sample of thickness is
| (15) |
where is the index of refraction.
Step 9. No additional explanation is needed.
The result of the process is given in Fig. 3. In Fig. 3(a), the -scan transmission is given in the unsaturated regime. In Fig. 3(b), the same function is given for fields which enter into the saturated regime. The positions of the peak and valley are given in Figs. 3(c) and 3(d), respectively, for various electric fields. These peak positions reproduce the values given by the original -scan papers [11,12].
FIG. 3.
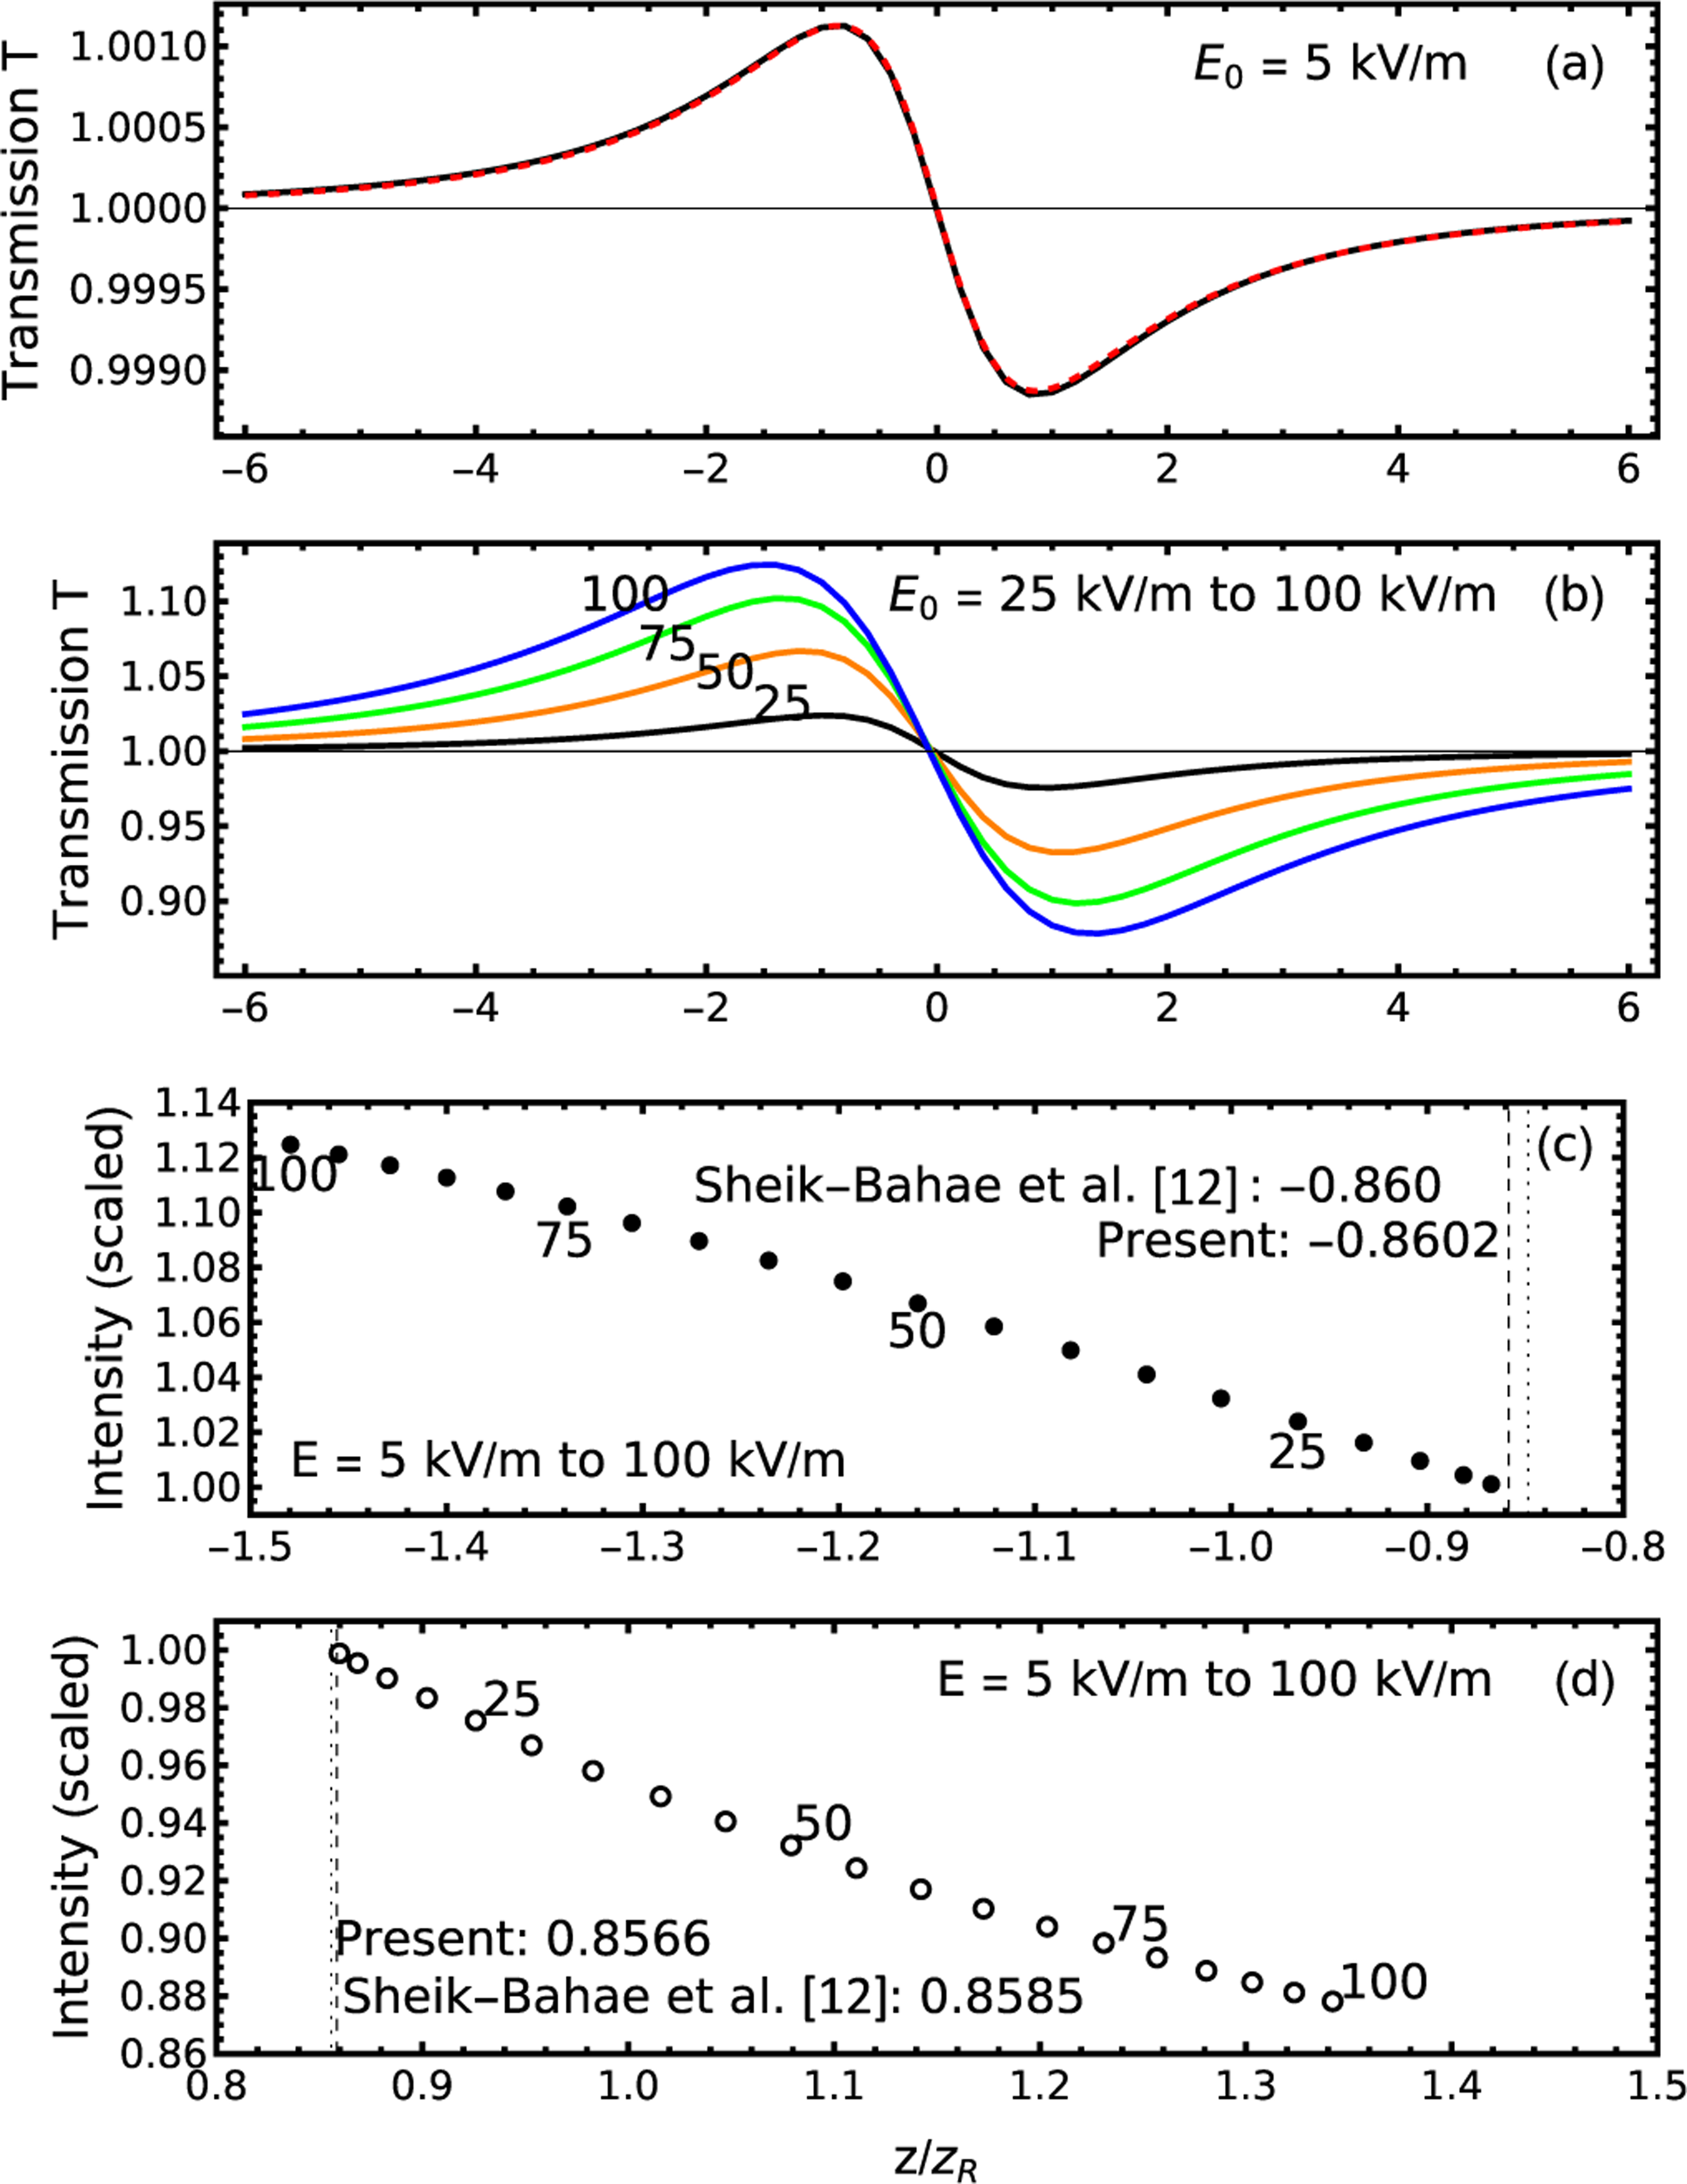
(a) For the low electric-field value of 5 kV/m, the scan (black, solid) as calculated with the present method is compared to (red, dashed) the analytic result of the -scan method, Eq. (3); (b) the -scan curves are calculated for higher electric fields, 25–100 kV/m, into the saturated regime; (c) the peak positions and magnitudes from part (b) are plotted along with the analytic and numerically extrapolated limit; (d) similar to (c) for the valley positions and magnitudes.
This problem was also studied earlier [23,30,31]; in particular, the increase of the spacing of the peaks shown here below was reported in Ref. [31], but not in Ref. [30]. In contrast, Ref. [23] reports the peak to valley spacing decreases with increasing saturation. The problem statement is a little different in Ref. [30] in that a top hat incident beam is considered instead of a Gaussian.
One the experimental side, McCormick et al. [8] use the peak-to-valley spacing for the unsaturated scan, but take the Rayleigh length to be a fitting parameter. Specifically, the 6-mm Rayleigh length is fit to 7–9 mm, i.e., an increase of 17 to 50%. If instead the Rayleigh length were held fixed, that increase would show up in the peak-to-valley spacing, which is consistent with the values shown in Fig. 3.
Finally, the exact nonlinear susceptibility is compared to the one derived from the nine-step process detailed above in Fig. 4. At low intensities, the two values are equal. However, as soon as saturation becomes important, there are significant deviations, as much as 100% in practical cases. Solving this serious metrological problem is the motivation for proposing the method described next.
FIG. 4.
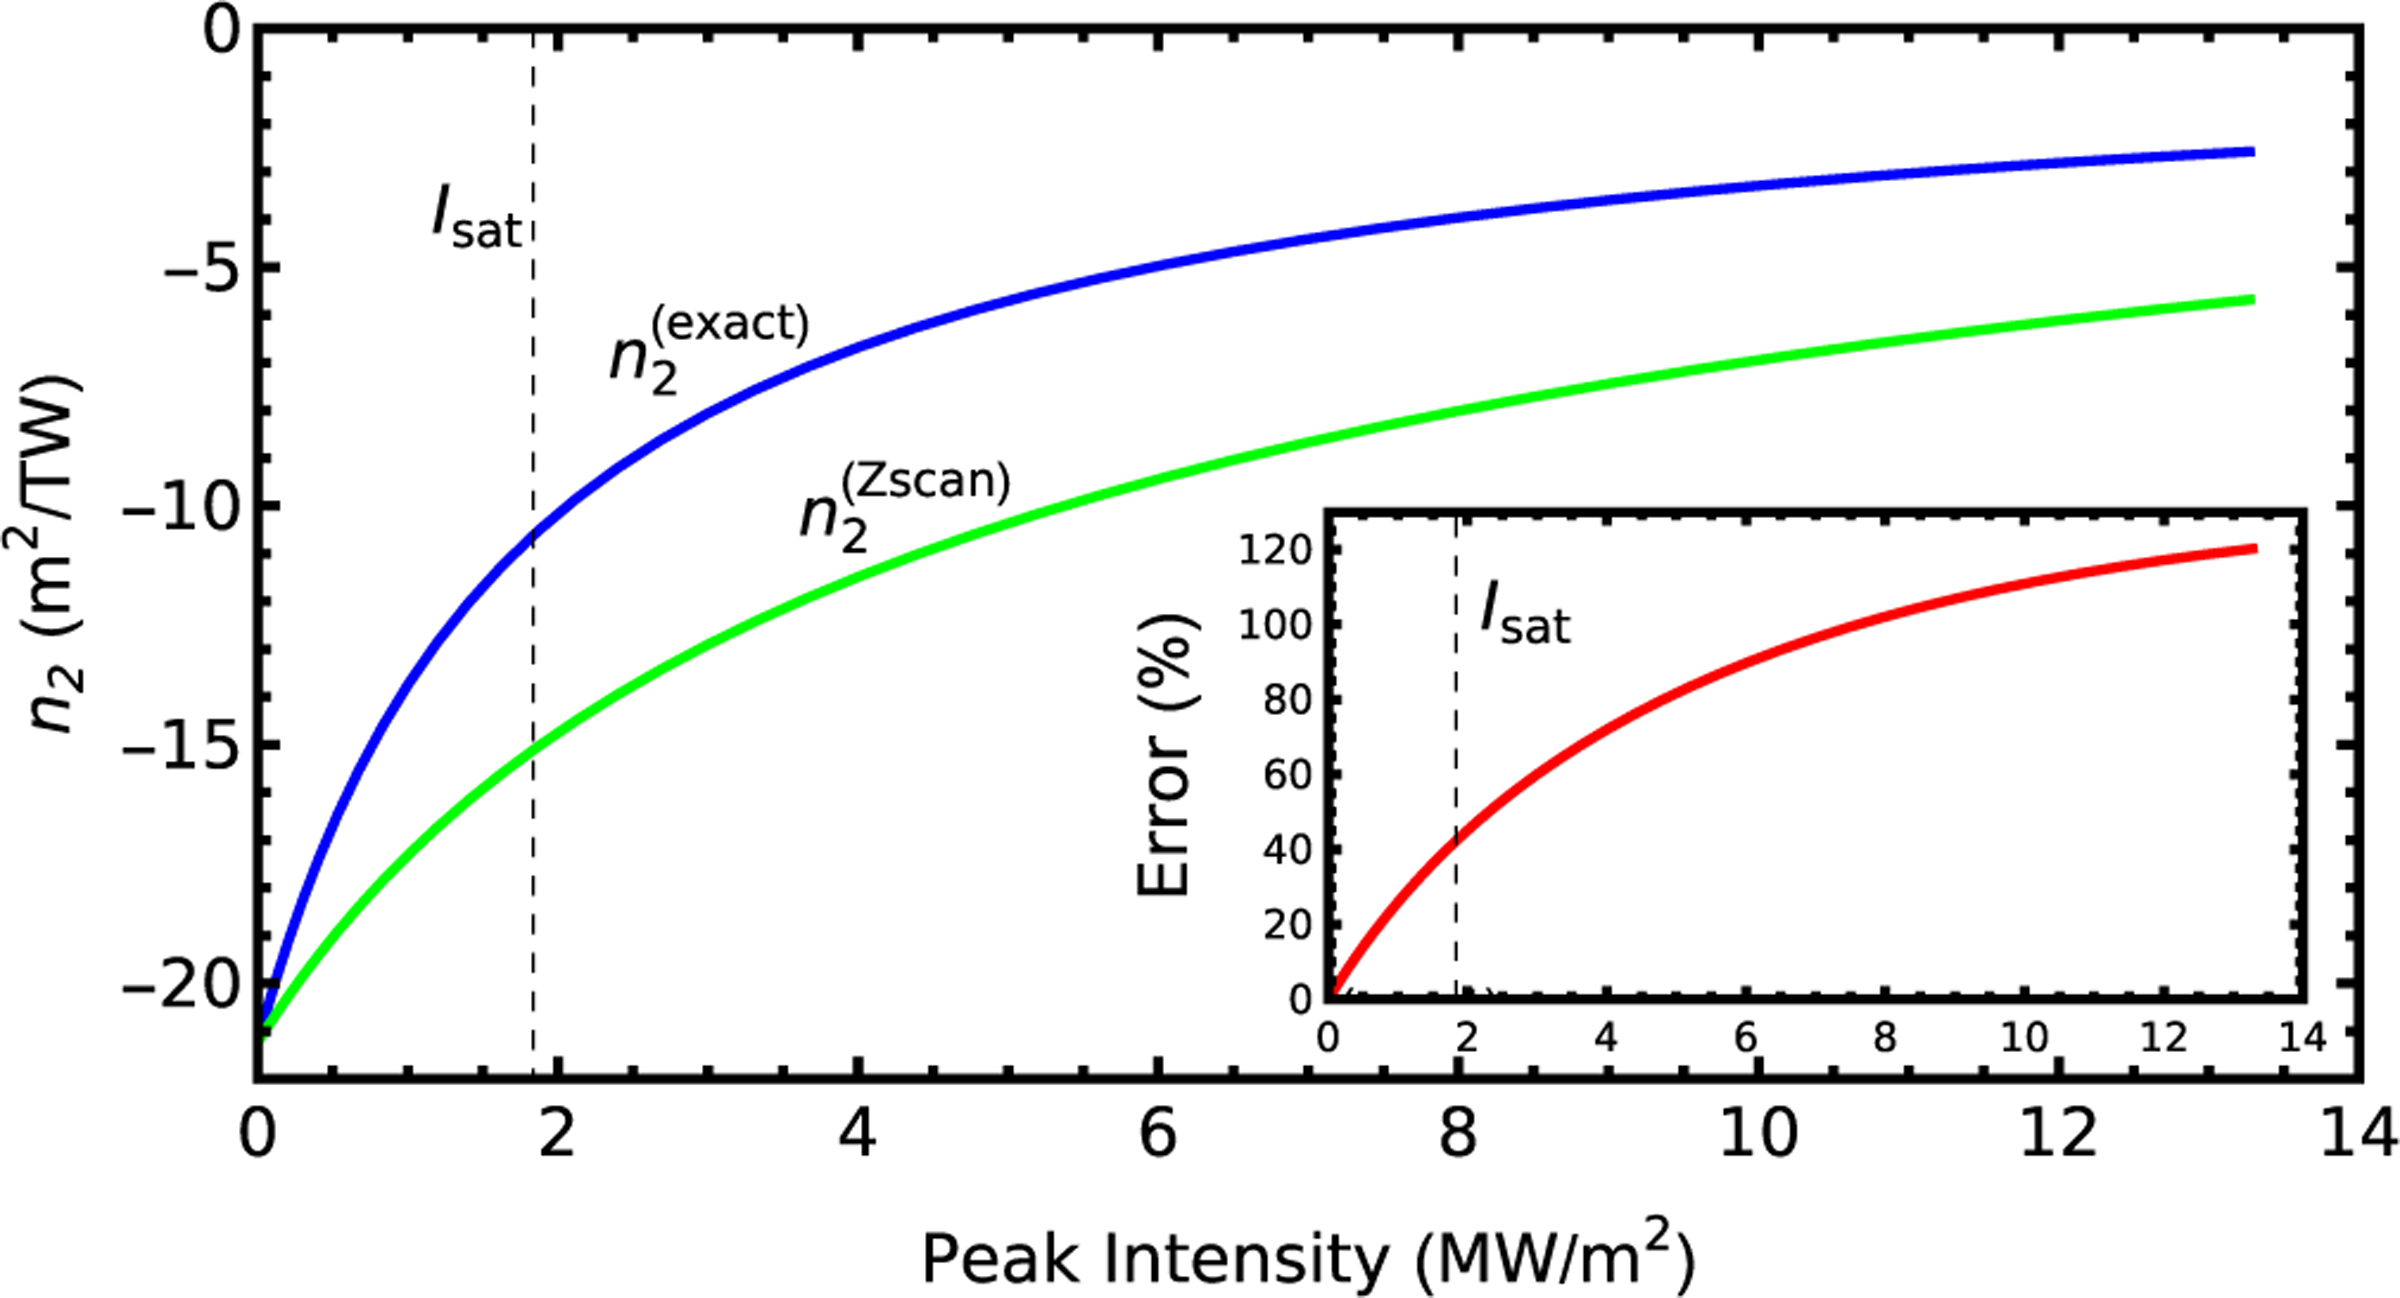
The Kerr coefficient is calculated (, blue) as a function of the peak intensity for a two-level system for the conditions given in the text; (, green) is determined by finding the -scan curve given the intensity-dependent Kerr coefficient presented here, finding the peak-valley difference on this curve, interpreting this peak-valley distance using low-intensity -scan theory, multiplying by constant factors following the procedure of McCormick et al. [8] for determining . The inset shows the systematic error of this procedure using . The saturation intensity is marked at which corresponds to .
III. PHASE RETRIEVAL OF MODES
In this section, an alternative to the -scan method, PROM, is presented. First, the modes themselves are described. These are used in a phase retrieval problem. By casting the problem in terms of modes, the propagation of the solution from one plane to another in free space is done analytically, avoiding a numerical step in some schemes [32,33]. A solution of interest is a linear combination of modes. The idea is to measure the intensity on a few planes, to find coefficients of the modes which match that intensity, then to extract parameters from the coefficients. The procedure is detailed below in this section, followed by consideration of noise in the detector and, separately, fluctuations in the input intensity.
The phase retrieval of nonperiodic objects has been a subject of great interest for at least the past 25 years [34]. A key issue was to clarify which observation domains could be used to perform phase retrieval. Early approaches used real space and reciprocal space [35,36]. The transport of intensity equation used nearby planes in a focal series [37]. Later, multiple widely spaced planes in the defocus series were used for phase retrieval [33], an approach which is followed here. Recognition that the Fresnel transformation interpolates between real space and reciprocal space [38] provides a unifying principle for these methods. For completeness, the very successful ptychography method retrieves the phase of a single plane by illuminating overlapping regions [39]. The field was reviewed by Shechtman et al. [27].
A. The paraxial equation and its modes
If a laser beam is not too tightly focused, its electric field may be described with the paraxial equation. In Ref. [40], the paraxial equation is given as
| (16) |
where , a function of (, , ), is a Cartesian component in the transverse plane. The subscript restricts the Laplacian to the (, ) plane, with being the direction of propagation. Equation (16) may be recast in dimensionless variables , , and . Introducing cylindrical coordinates, and , the dimensionless variables are with the azimuthal angle unchanged. The result is
| (17) |
The solutions to these equations are the standard Hermite-Gauss and Laguerre-Gaussian modes, respectively. For the circularly symmetric case, the modes are given by
| (18) |
for integer , with being a Laguerre polynomial. The result presented here is restricted to being constant in , although there are solutions for associated Laguerre-Gaussians as well as for Hermite-Gaussians [41]. The transformations used to take the formulas from Kogelnik and Li [41] to Eq. (18) are given in Appendix D. The standard Laguerre-Gauss modes are orthonormal with respect to the integral
| (19) |
where is the Kronecker function. Since the orthonormality applies for each plane with constant , flux conservation integrated over different planes is a corollary.
Any linear combination
| (20) |
where is the number of coefficients, is a solution of Eq. (17). Solutions which differ by a constant phase have the same intensity . Hence, is taken to be a real positive number in the computational basis. (The edge case of is excluded, but can be dealt with easily.) Later, we will see that the phase of has a meaning related to the phase of the incident wave and the wave just as it leaves the Kerr medium. There are two phase conventions in effect for the coefficients: a computational convention that Im , and a physical convention. Phase retrieval uses the computational convention, and the physical one is applied afterwards, if necessary.
B. Proposed experimental protocol
The proposed experiment is the following.
Send a coherent beam, preferably a Gaussian beam, through a thin, saturable Kerr medium such as an atomic vapor cell. Here, the term “thin” means that the thickness of the cell is small compared to the Rayleigh length. The cell is fixed at the focus.
Record the intensity in a two-dimensional array on three or more well-separated planes. In this paper, the detector planes are , , and relative to the central plane of the cell.
Choose a basis set consisting of Laguerre-Gaussian modes, where will be a small integer such as 12.
The measurement determines one real, positive coefficient, namely , and complex coefficients with .
These coefficients are used to determine the optical parameters.
Some key differences of the -scan method and the PROM protocol are given in Table II.
TABLE II.
Comparison of -scan method and PROM protocol.
| scan | PROM | |
|---|---|---|
|
| ||
| Kerr coefficient | Small, constant | Smooth function of intensity |
| Sample position | Variable, through focal region | Fixed, at focus |
| Detector position | Far field | A few planes such as , 1, and 2 |
| Detector | Single channel | Array |
The phase is accumulated over a line integral in the cell [42]. It is
| (21) |
where is the index of refraction at and . The integrals are performed independently for each value of . In our case, we expect the density of atoms and the electric field to be a constant , independent of and . The first Born approximation is valid for a thin, dilute sample. Then reduces to . Since the sample thickness and wavelength are parameters of the experiment, determines through
| (22) |
For a thin, dilute sample the electric field is a function of , hence the light intensity is a function of .
The defining equations for the unsaturated and saturated Kerr effects are given in Eqs. (1) and (9), respectively. An alternate nonlinear expansion is
| (23) |
where the even terms are excluded due to the centrosymmetry of the atoms in the gas, and, for simplicity, is taken to be a scalar. The vector nature of is important in some experiments [43]. These expansions are related by
| (24) |
The index of refraction is related to the susceptibility by
| (25) |
where the approximation is valid if , which is the case in the present paper. This assumption is also the validity condition for ignoring Clausius-Mossotti or Lorentz-Lorenz local fields, which is done in this paper.
C. Simulation of PROM protocol
As in many simulations of inverse problems, the strategy is to choose an ideal system with parameters, generate data, and recover the parameters. In more advanced versions, the measurements and even the geometry can be subject to noise. Our phase recovery strategy shares many features with one presented earlier [44]. For the proof of concept given in this paper, I specialize to the parameters used in an earlier experiment [8] given in Table IV.
TABLE IV.
Parameters used in the calculation. The number density is for 87 Rb using the 72% natural abundance.
| Quantity | Value | Remark |
|---|---|---|
|
| ||
| Grid points in | Zero to ten in steps of 0.1 | 101 points |
| Optical frequency | 384.230 484 468 5 THz | |
| 2.52 × 10⁻²⁹ C m | ||
| 0.72 × 10¹⁸ m−3 | ||
| 38.11 × 10⁶ s−1 | ||
| 1 mm | ||
| −1 GHz | ||
| 6 mm | ||
| 38.6 μm | Eq. (B2) | |
| 0.5, 1, 2 | ||
The following steps simulate the experiment.
Choose parameters for an incident Gaussian at some plane ; the focal plane, , is used in this paper.
Using a model nonlinear dielectric function, find the electric field at the exit plane of a thin Kerr medium
Fit to Laguerre-Gauss modes in the plane.
Find where indexes the detector planes.
Square to find the intensity .
Optionally, add shot noise to .
-
To simulate fluctuations in the intensity of the incident beams, integrate the intensity on the detector planes given by each incident intensity over the probability distribution of incident intensities.
The intensities are the result of the simulated experiment. The following steps may be applied to real or simulated data. Only simulated data are used in this paper.
Find the coefficients in the computational basis which fit the intensity in the computational basis.
Find the estimated
Find , the function “” as found in the computational basis.
Find , where is a real constant to be determined.
Determine by either (a) fitting to zero at some dimensionless radius which is sufficiently large so that the function is approximately zero or (b) finding the difference of the nonlinear susceptibility at the peak and its value at an intermediate value of such as .
If the (b) method is chosen, the experiment should be repeated with the peak intensity scaled down by a factor of . Eventually, the peak field is small enough that an unsaturated scaling relation becomes valid, and the process may be terminated. The variable may be found by summing a telescoping series.
D. PROM protocol simulation results
In Fig. 5, results are given for the selected two-level system. Three values for the maximum incident electric field are given. In each case, the fields are given for three cases, namely, (a) an exact solution if saturation is neglected, i.e., if Eq. (1) applies; (b) for the exact solution, including saturation, i.e., using Eq. (9); and (c) the solution found using PROM. The quantity plotted is or .
FIG. 5.
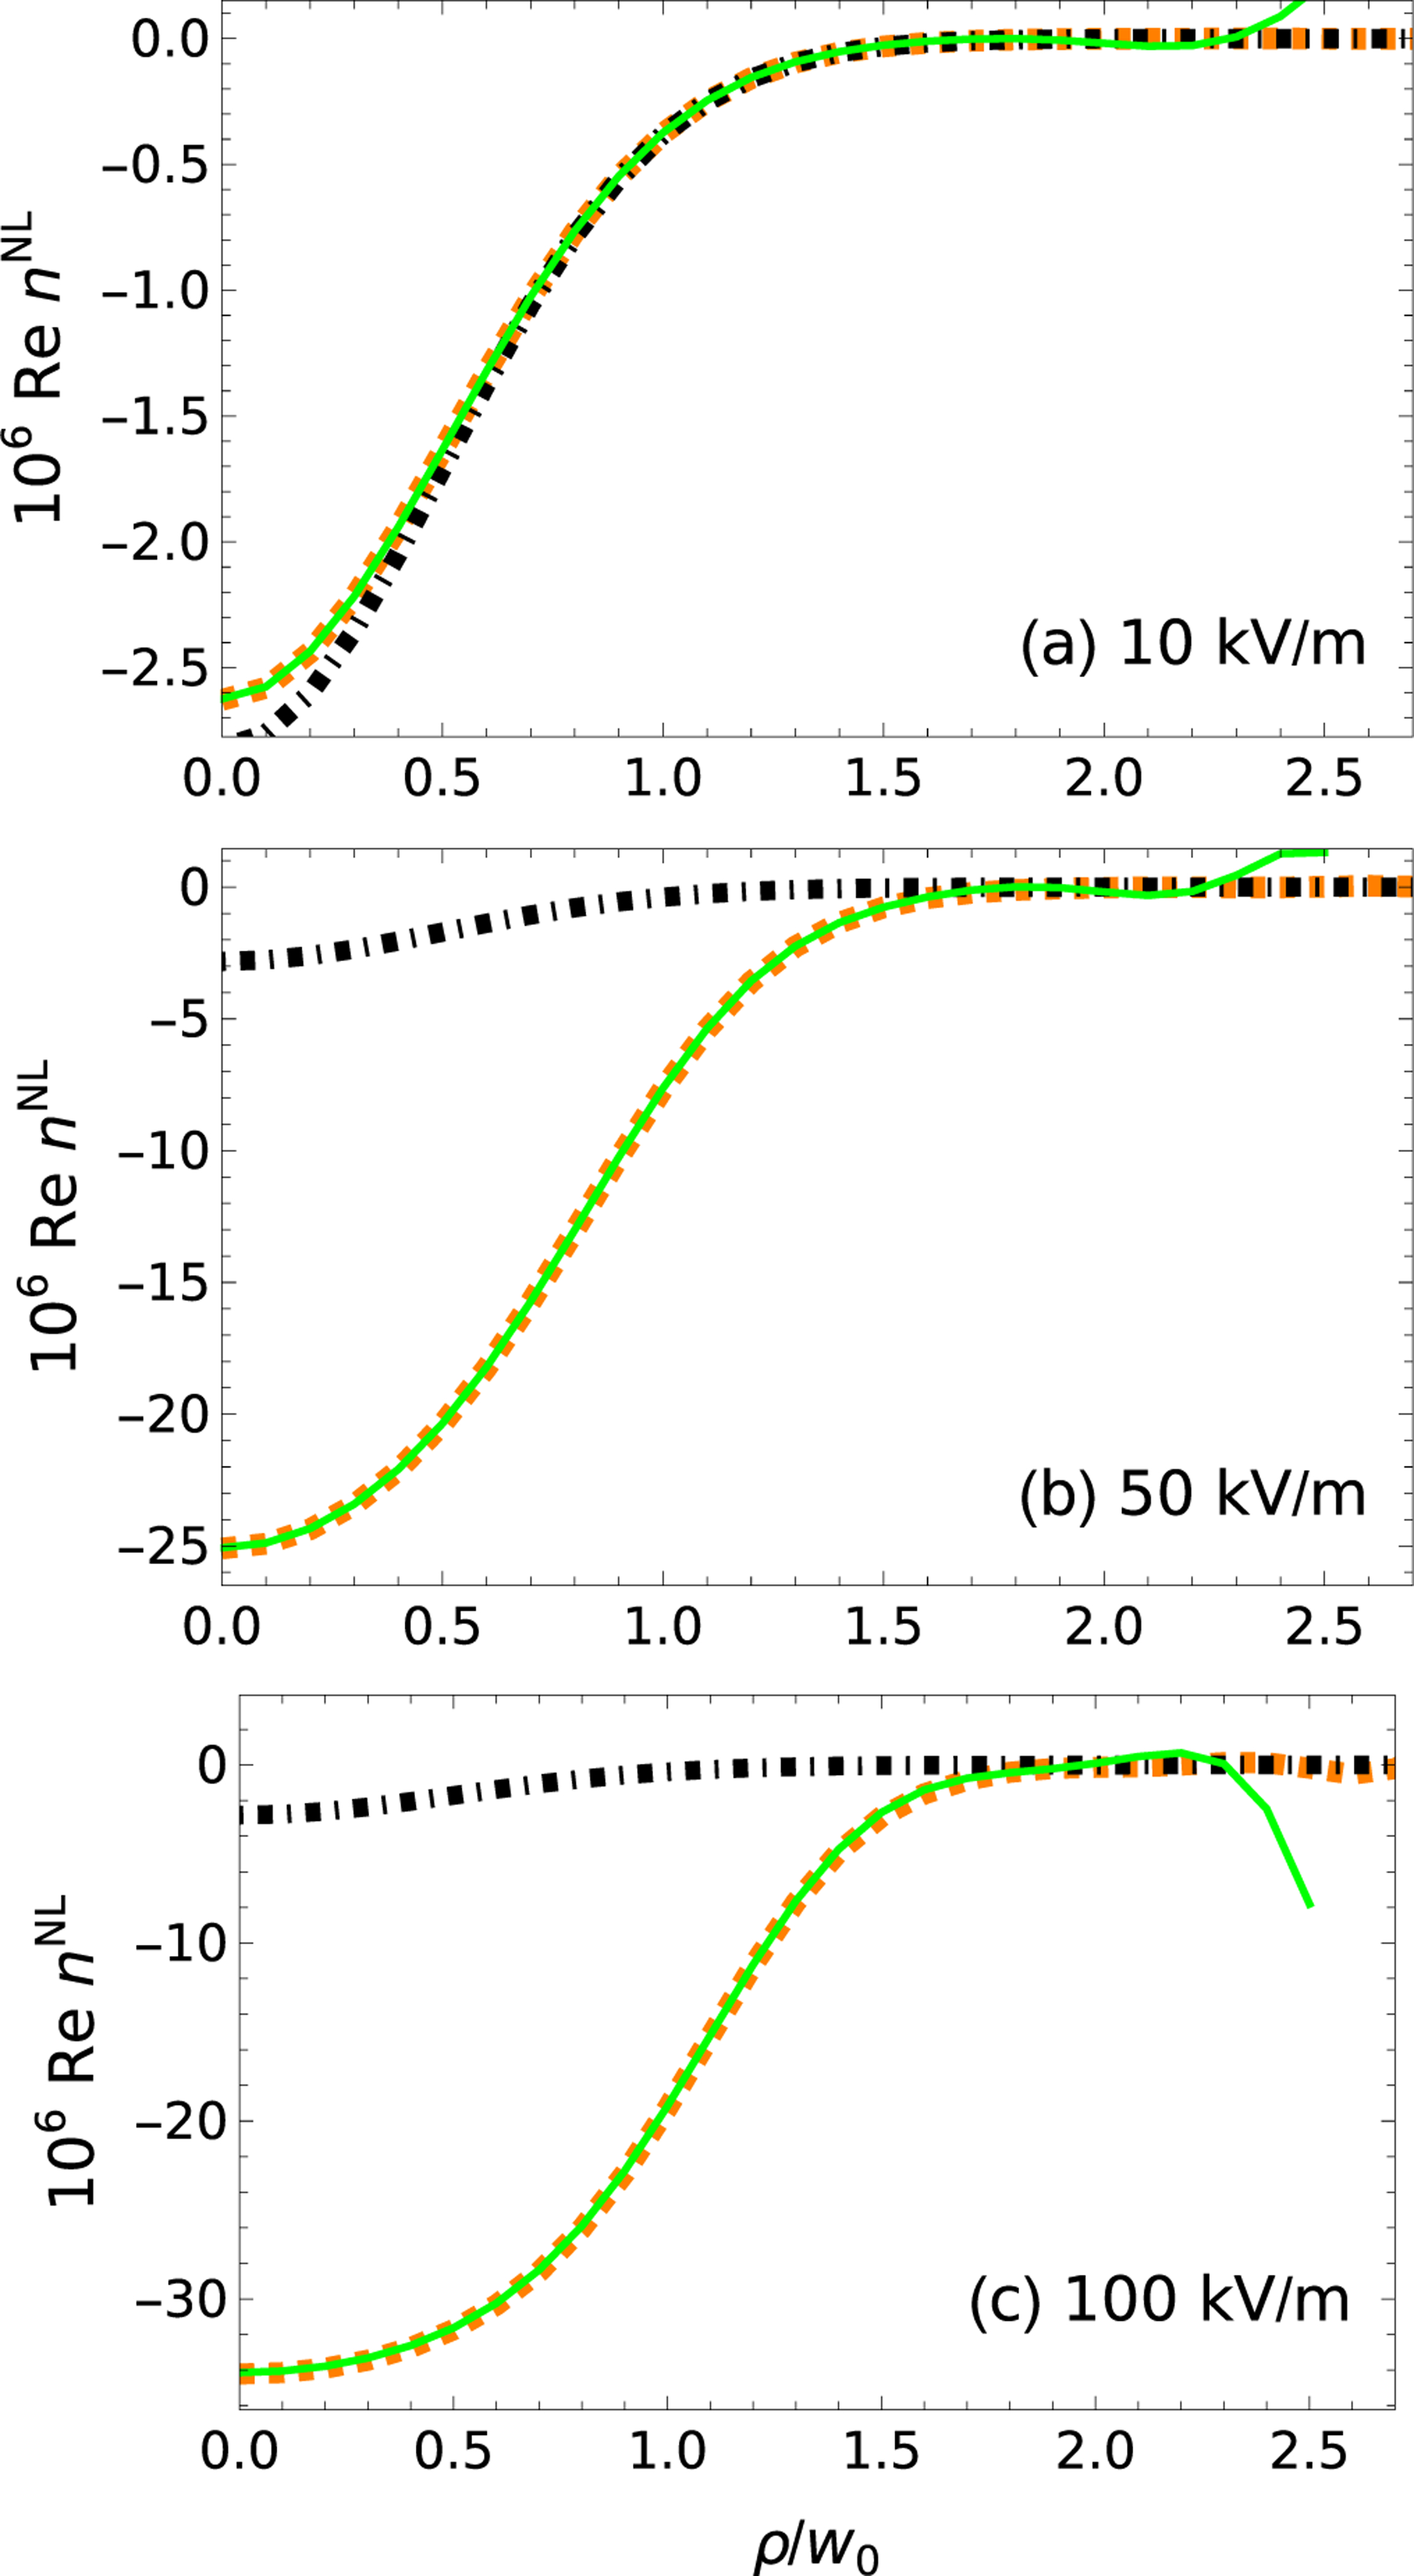
The real part of the nonlinear index is given for (a) 10 kV/m, (b) 50 kV/m, and (c) 100 kV/m. The real part of the nonlinear index is given, as calculated (wide dash-dotted black) with the two-level system neglecting saturation (wide dashed orange) with the two-level system including saturation, and (solid green) as recovered from simulated measurements on three detector planes, namely , 1, and 2 using PROM with 12 basis functions. An adjustable constant for the green curve was optimized by hand for best agreement.
If the maximum incident field is below saturation, the three solutions are seen to be similar, as illustrated in Fig. 5(a). Near or beyond saturation, the nonlinear contribution to the index of refraction differs greatly from the value given by the unsaturated Kerr effect. Nevertheless, PROM is able to reproduce the exact solution, at least for moderate values of . Past about , the solution is not recovered. If the number of basis functions is increased, the region of agreement may be pushed to somewhat larger , about 2.5 for the case of 20 basis functions. The convergence is similar to that plotted in Fig. 2 for the related quantity . Ultimately, it is difficult to get an accurate result at high because in the protocol the electric field after the sample is found and then divided by the incident electric field. Since the incident electric field is Gaussian, there is a division of two ever smaller numbers as increases, leading to a loss of numerical significance. The measurement must be derived from values obtained when is not too large, a point we return to below.
The coefficients of the true function are compared to the results obtained with PROM, which are given for various numbers of basis functions in Fig. 6, as well as to the exact function expanded into Laguerre-Gauss modes without using PROM. The coefficients are given accurately for . Beyond this, the deviation from the true values is on the order of the true value itself. Nevertheless, better results are obtained with more basis functions.
FIG. 6.
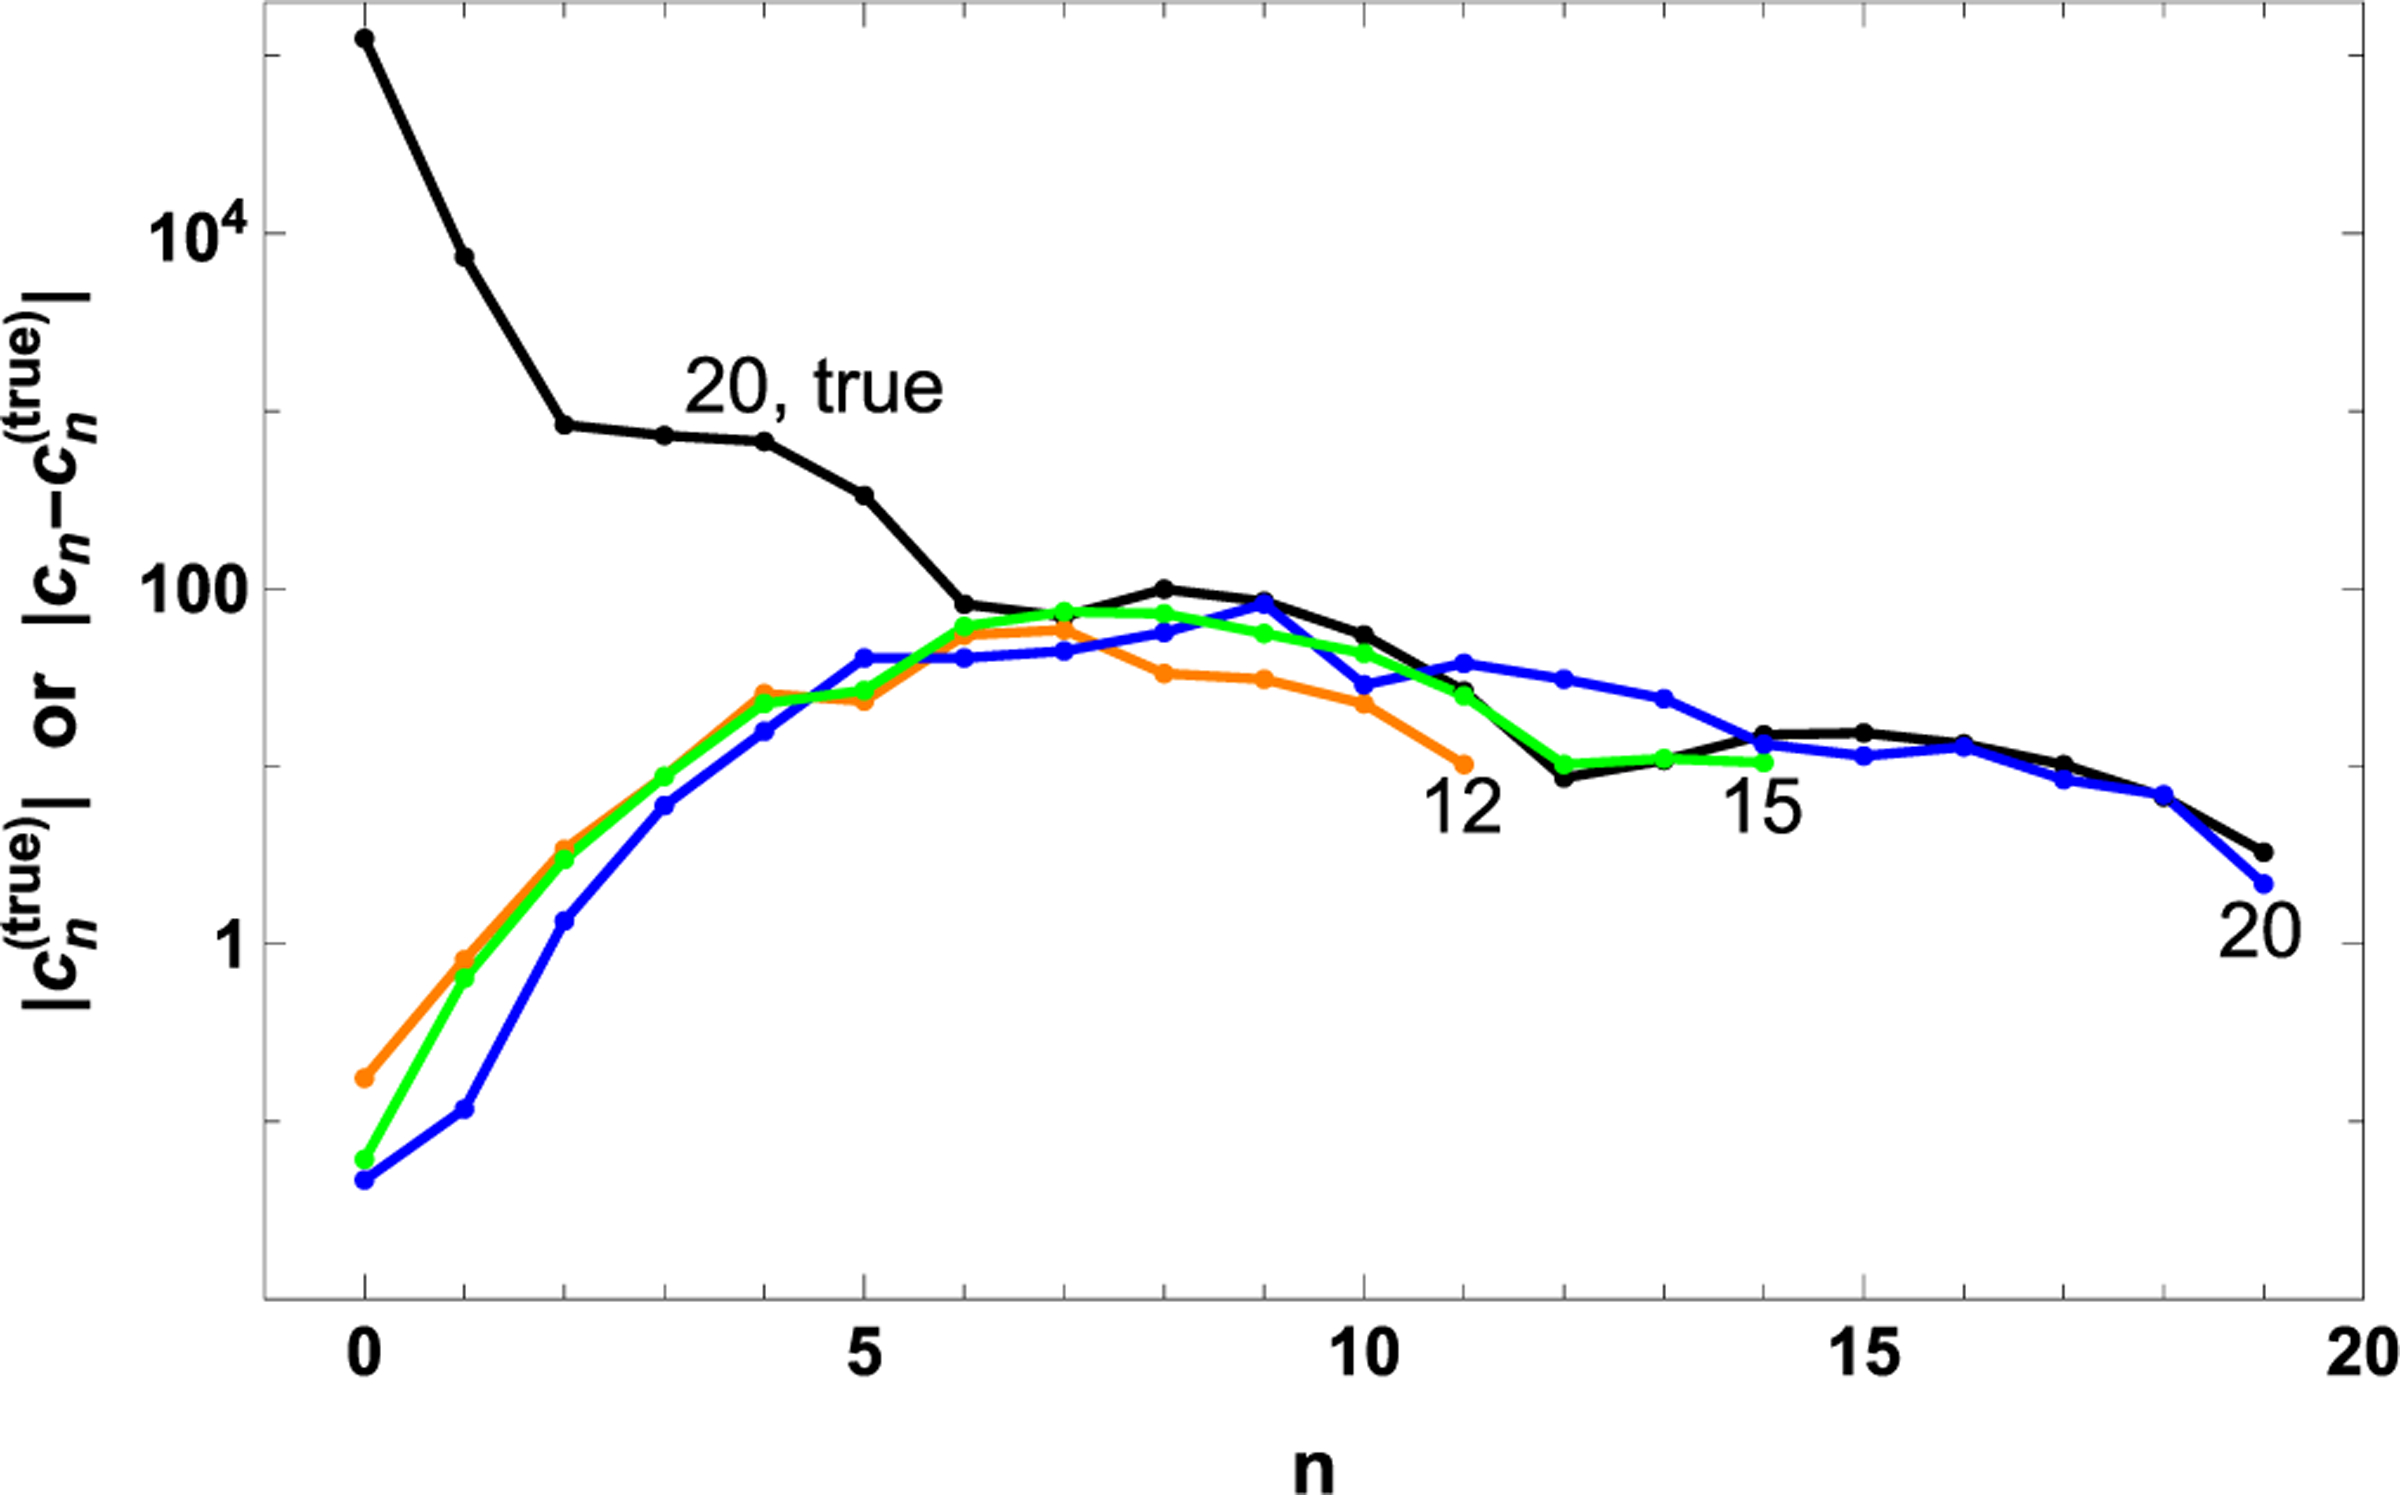
The coefficients of the expansion of the electric field after the sample based on (black) a 20 basis function expansion of the electric field just after passing through the thin Kerr medium labeled “20, true”, (orange) a 12, (green) 15, and (blue) 20 basis function expansion, as calculated with PROM. The solid lines are a guide to the eye.
Ultimately, we want to report as a function of the incident electric field, although it is found as a function of . Of course, the incident electric field, a Gaussian, is also a monotonic function of . Intuitively, the result should depend only the incident electric field and not on its associated peak electric field. For example, if the maximum electric field is 10 kV/m, then the value gives the nonlinear contribution to the index for that field. However, if the maximum electric field is 100 kV/m, then a 10-kV/m field occurs for . Operationally, these are very different, so the results of Fig. 7 are an important test on the validity of the numerical implementation. Since the curves lie on top of each other, it shows the reported field is independent of the maximum electric field, as expected.
FIG. 7.
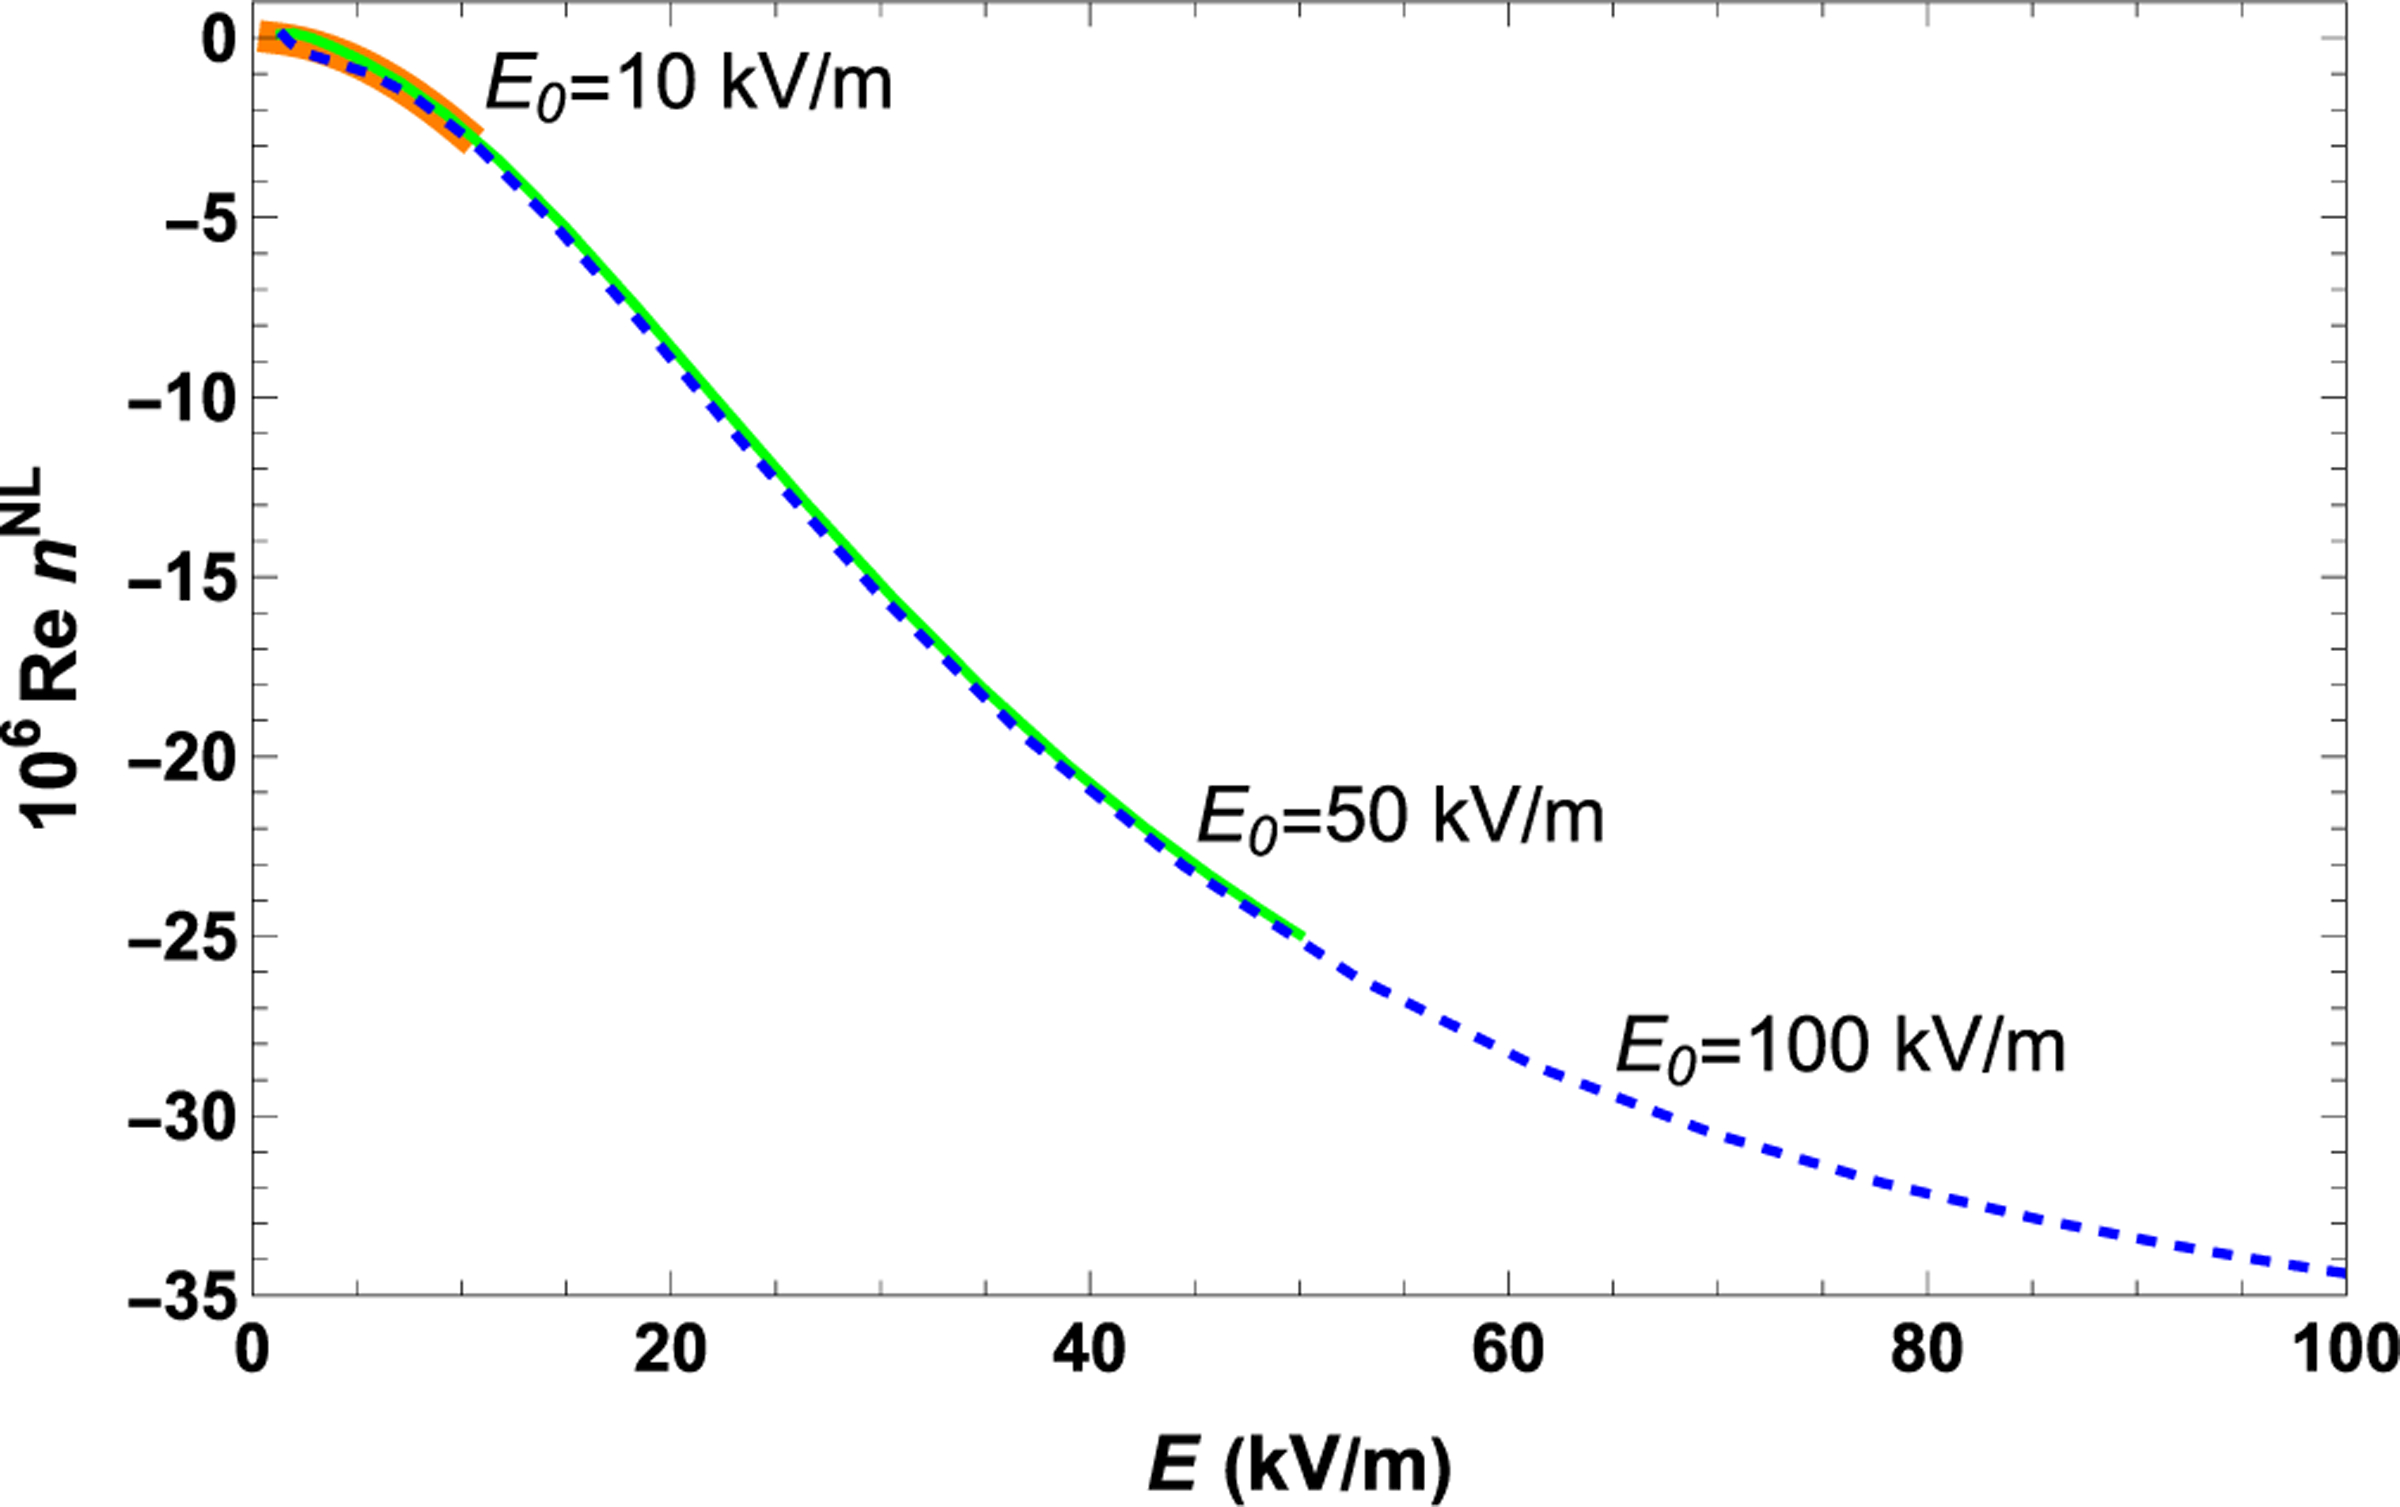
Saturated Kerr coefficient as a function of electric field based on the retrieved answer calculated with 20 basis functions and a peak electric field of (orange) 10 kV/m, (green) 50 kV/m, and (blue) 100 kV/m. The nonlinear indices have been adjusted so that all give the same answer at 1 kV/m, a deeply unsaturated value.
1. Results with detector noise
The effect of noise in the detector is shown in Fig. 8. The results in the figure were obtained by calculating the intensity on each of the three detector planes, then taking the integrated intensity to represent a mean number of photons arriving on the plane. The cases shown are for 107,109, and 1012 photons per plane. Hence, the total number of photons is three times larger. The intensity at each pixel is taken to be the mean of a Poisson distribution. A sampled intensity is made by drawing from the distribution for each pixel on each detector plane. The sampling is performed 50 times, with PROM applied to each sample to estimate the nonlinear contribution to the index of refraction. The uncertainties shown in Fig. 8 are statistical. As in Fig. 5, the uncertainties grow dramatically as becomes large. Increasing the number of photons allows low-noise results to be recovered at somewhat larger radii, but clearly the ability to push out to large radii is limited.
FIG. 8.
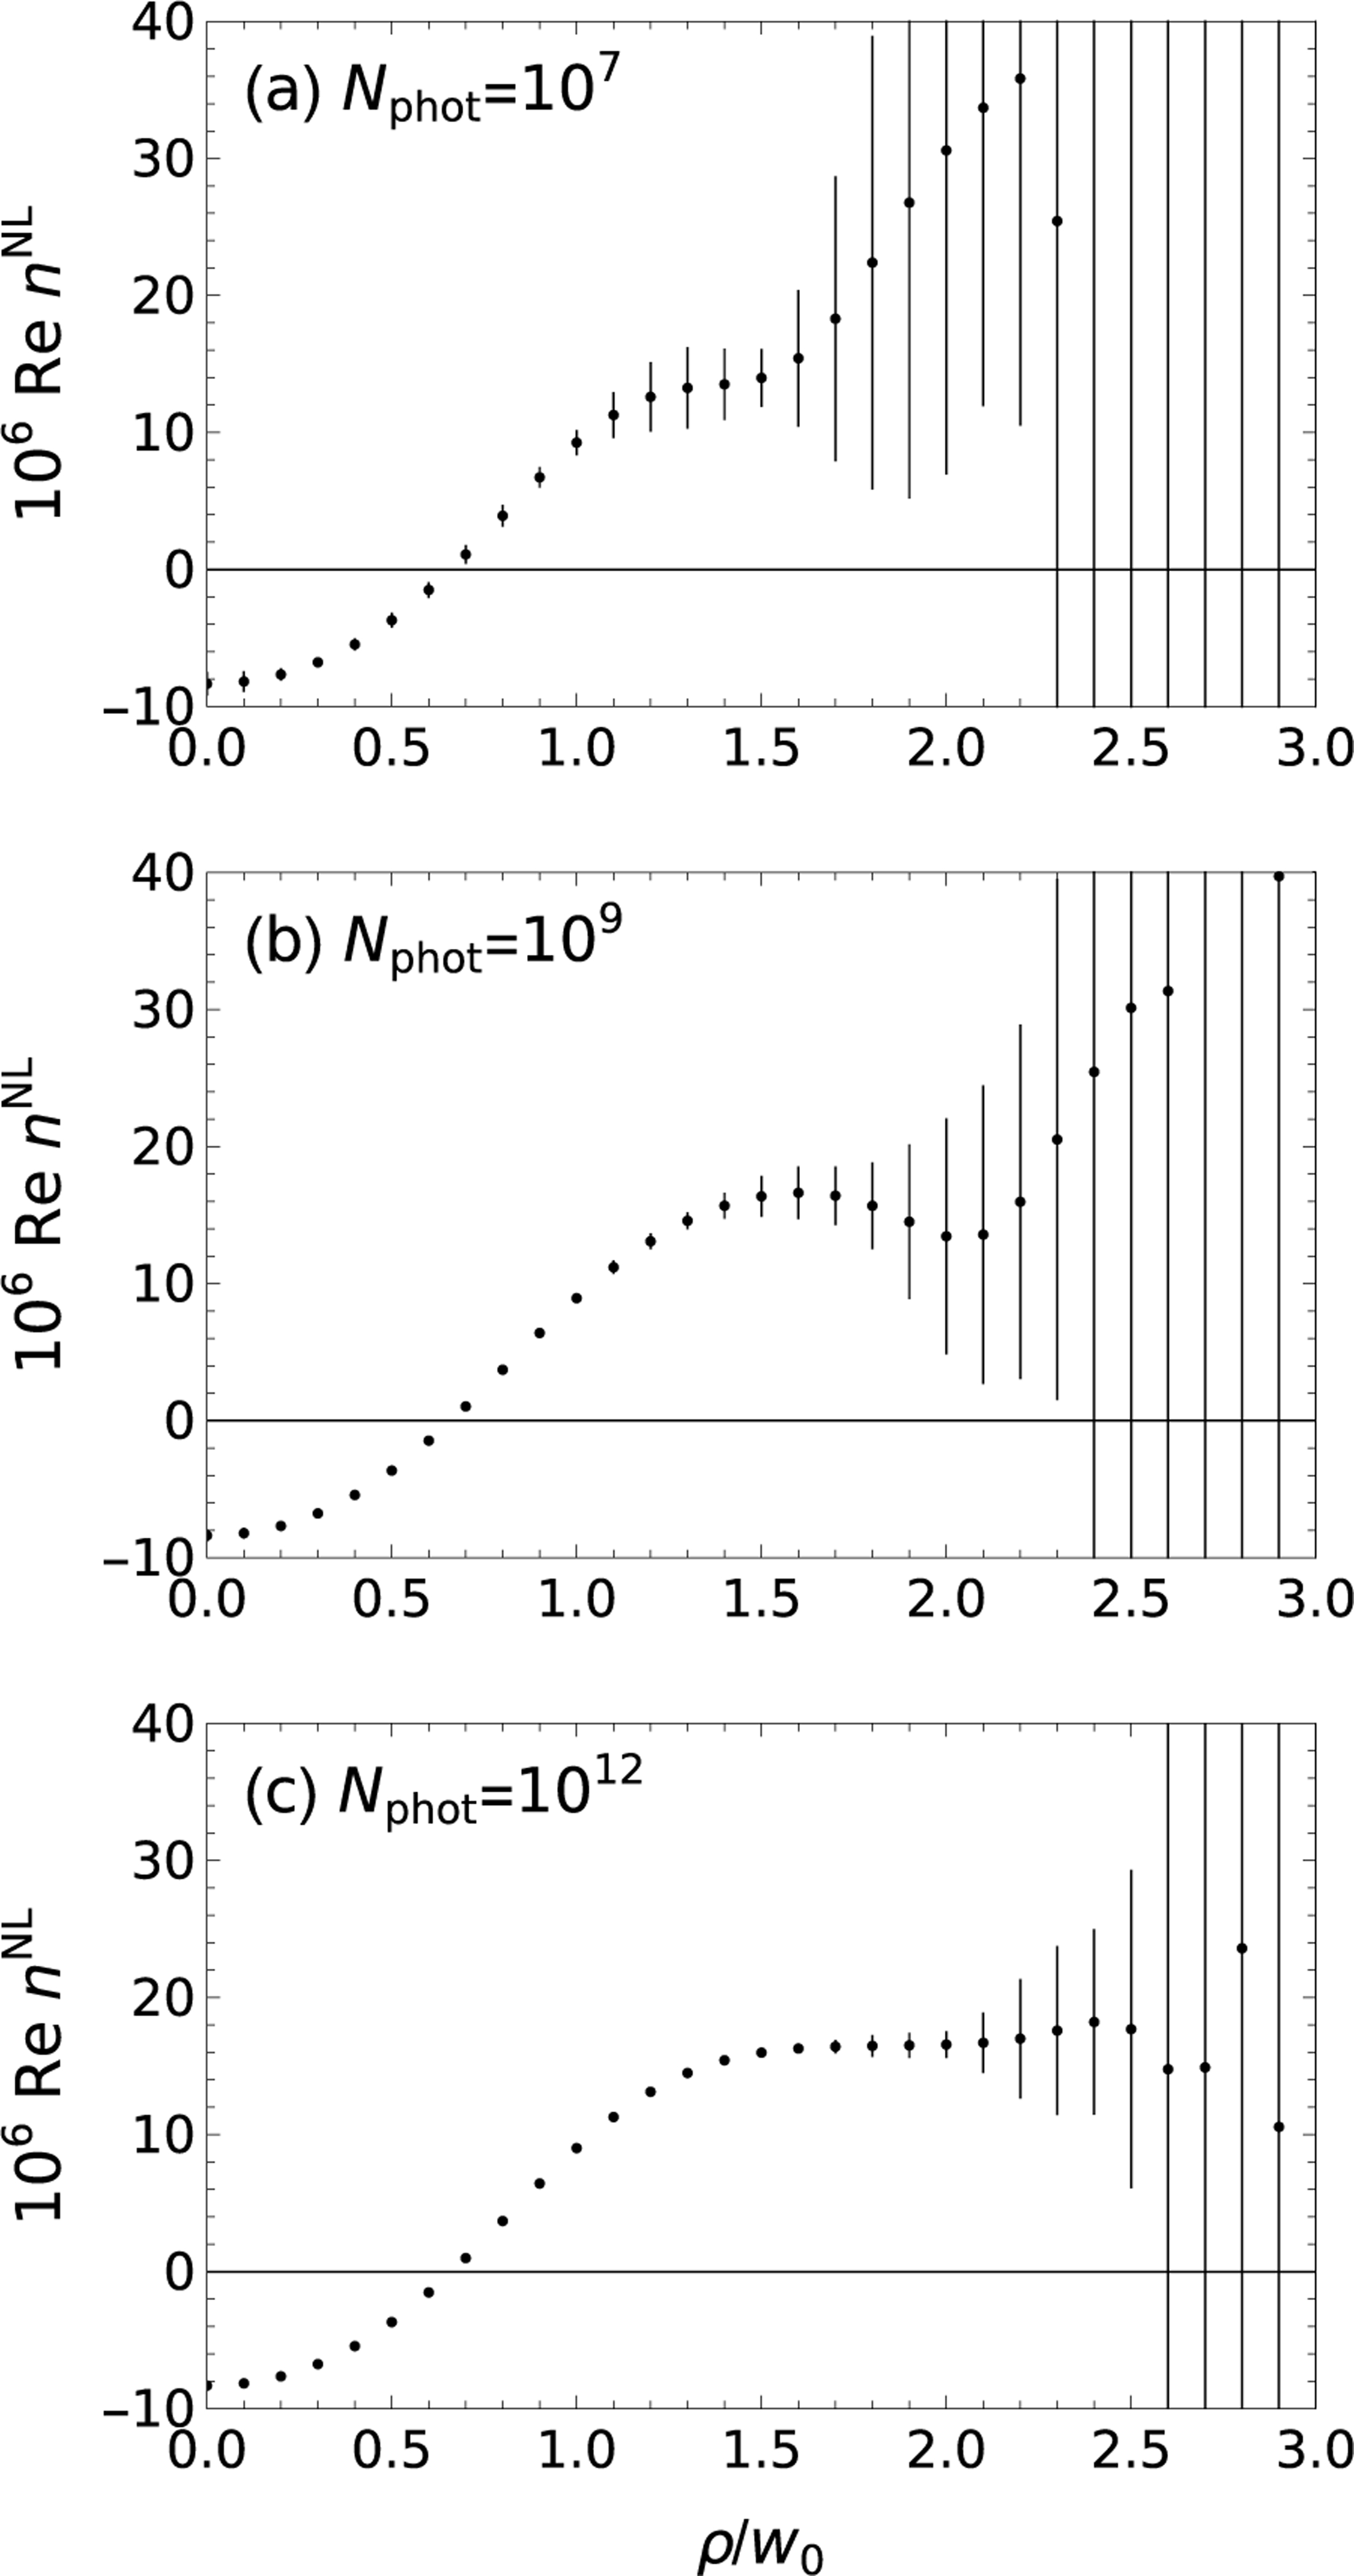
The saturated Kerr coefficient as a function of the radial position, as calculated with PROM with a maximum electric field of 50 kV/m using 12 basis functions and shot noise based on the intensity, assuming the total number of counts per detector plane is (a) 107, (b) 109, and (c) 1012 at each sampled plane in (, ). Each case is based on 50 samples. The uncertainties are statistical, and based on a coverage factor , often called “,” or 95% confidence.
To provide grounding to an experiment, the number of photons is converted to joules. Conveniently, for nm, there is 1.6 eV per photon. Hence, 107,109, and 1012 photons are 1 pJ, 100 pJ, and 100 nJ, respectively. If 1μW is incident on the detector, the required observation times per plane are 1μs, 100μs, and 100 ms, respectively.
2. Results with incident field fluctuations
The effect of fluctuations in the incident laser intensity is given in Fig. 9. There, a noise-free calculation for a two-level system presented in Fig. 5 is compared to the same result with a Gaussian distribution of input noise. Details about how these fluctuations are treated numerically are given in Appendix E. The results lie on top of each other in Fig. 9(a), hence the effect of the intensity fluctuations is shown in Fig. 9(b). The scale in Fig. 9(b) is about 100 times smaller than in Fig. 9(a). Usually, variations are quoted in terms of the electric field. These would be about double the values shown, namely 1 or 20%. These show the protocol is robust to fluctuations in the laser intensity.
FIG. 9.
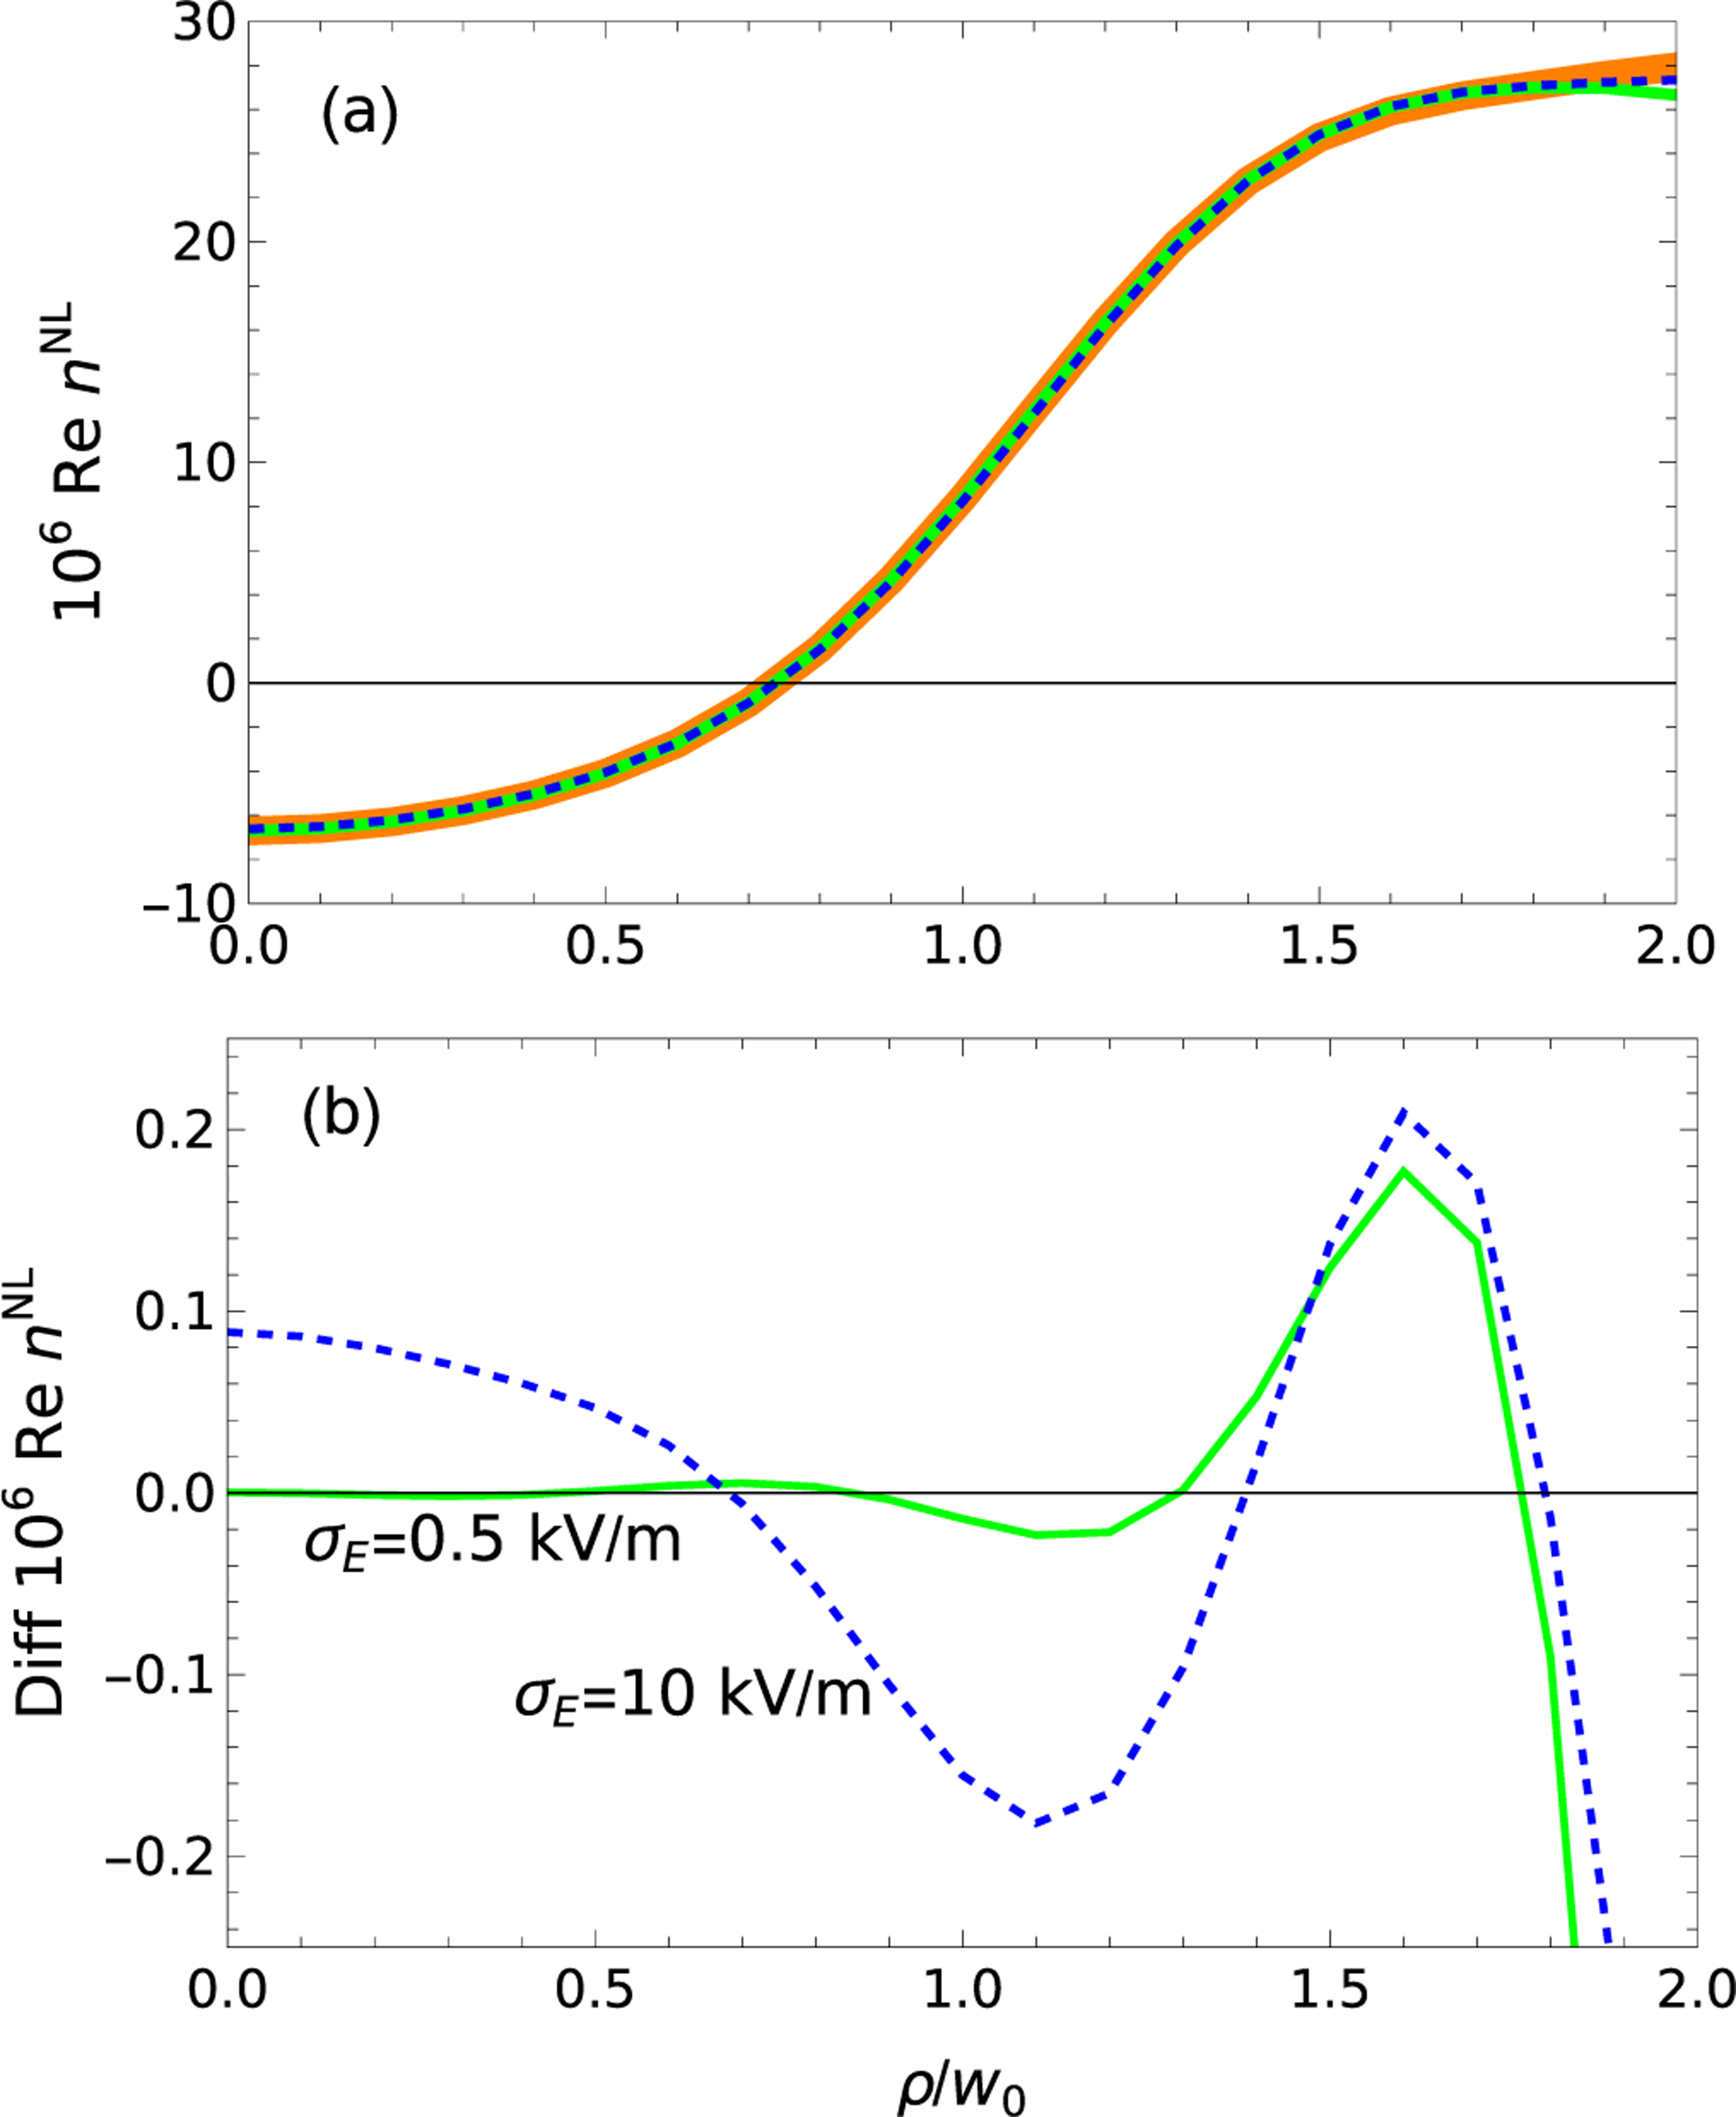
(a) The saturated Kerr coefficient as a function of the electric field, including (black) the exact expression for the two-level system as in Fig. 7, and values found with PROM using 12 basis assuming the incident electric field varies by (thick orange) 0, (green) 0.5%, and (dashed blue) 10%. There is no detector noise. The calculation uses 21 point Gaussian integration. In panel (b), the differences of the curves with 0.5 and 10% electric-field fluctuations from the noise-free answer are shown. The calculation was done with the computational convention, so differences in Re are meaningful, but not the value itself. Since all calculations use the same convention, intercomparisons are meaningful.
3. Results with telescoping series
As noted in steps L and M above, PROM gives the difference of the nonlinear contribution to the index of refraction. Additional information is needed to get the value itself. As noted above, this can be done with a single measurement which can be linked to a zero electric-field result, hence the nonlinear susceptibility is zero, or to an electric field small enough to be described in the unsaturated regime where other methods apply, including the scan.
As illustrated above, the results are prone to large uncertainties if taken with being too large, which might occur at a value as little as 2. As an alternative, a telescoping series variant is recommended. The differences of the nonlinear susceptibilities at two electric fields are given by PROM. A lower electric field will occur on the wings of the incident field. In the example shown in Fig. 10, the ratio of a point on the wing to the central value is taken to be 2, 4, or 8. In Table III, the nonlinear susceptibility is calculated in three ways and compared to the exact answer for the two-level system. As noted above, PROM gives the nonlinear susceptibility up to an additive constant. This implies that the differences are given correctly. For the results of Table III, the maximum incident field performed seven times with factor of 2 steps, namely 1.5625, 3.125, 6.25, 12.5, 25, 50, and 100 kV/m. Let for . The radial positions are chosen so that the electric field differs by a factor of between the peak and some general radial point. The telescoping series was formed in three ways. Here, the arguments to are the radial position in the variable and the electric field (kV/m). If only one argument is present, it is the electric field. For a factor of 8 difference, we take
| (26) |
FIG. 10.
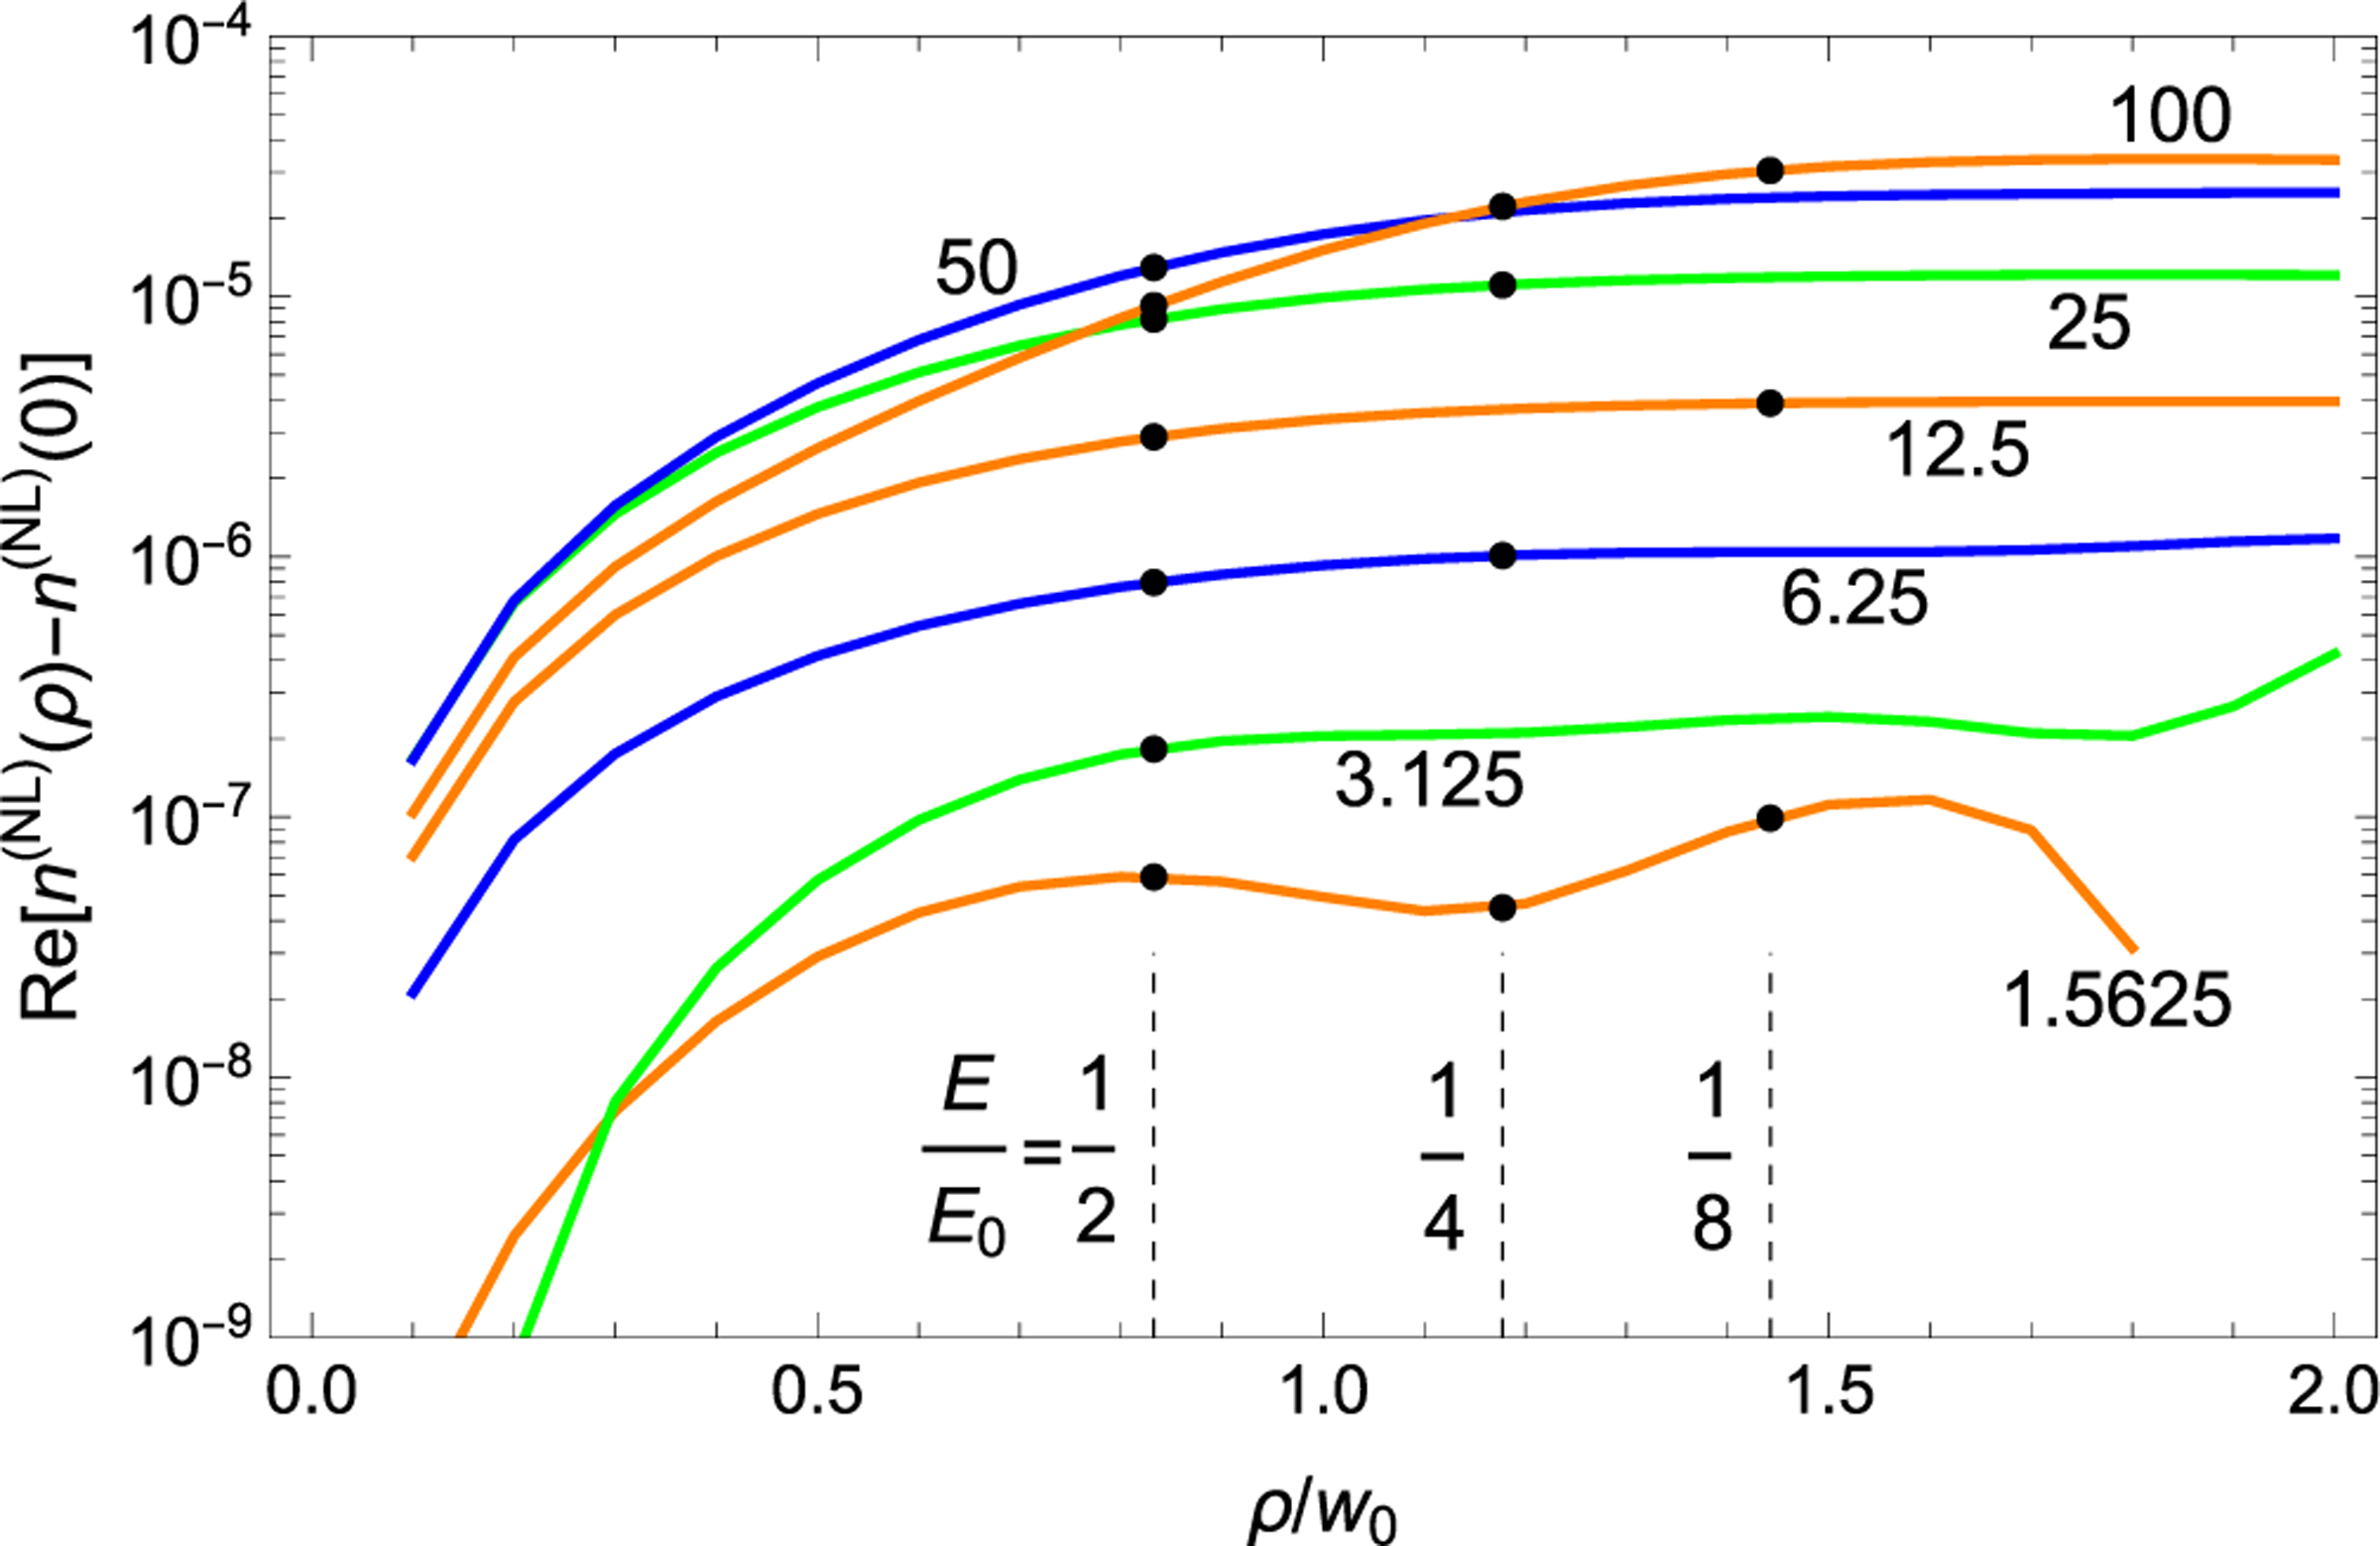
The difference of the nonlinear susceptibility as a function of radial position is given for several initial field strengths in units of kV/m. The incident electric field follows . The dashed vertical lines indicate the radial position for which the incident field has fallen by a given factor. The black dots are the points used to evaluate the series given in Eqs. (26)–(28).
TABLE III.
The nonlinear contribution to the susceptibility at , (Exact) as calculated from the two-level system, or (Telescoping) with a telescoping series based on the difference of the susceptibilities of two different fields. The label “2,” “4,” or “8” implies there is a factor of 2, 4, or 8 difference between these two fields
|
| |
|---|---|
| Exact | −34.32 |
| Telescoping 2 | −34.26 |
| Telescoping 4 | −34.30 |
| Telescoping 8 | −34.46 |
This is a telescoping series if which is true in principle because both represent the nonlinear susceptibility for an electric field of 12.5 kV/m. The equality is demonstrated numerically in Fig. 6. Hence, the single argument version of is the nonlinear contribution to the susceptibility for a given electric field. (For brevity, the units of kV/m are implied.) All other terms follow by analogy. For the factor of 4 difference, we take
| (27) |
For completeness, for the factor of 2 difference, we take
| (28) |
The final difference is corrected to account for the susceptibility differences down to , assuming the smallest incident field is in the unsaturated Kerr regime, which is true in the example. If the telescoping series involves a change by a factor of in the electric field, assuming the smallest electric fields are in the unsaturated Kerr regime, then it is simple to derive that the final interval must be increased by a factor of to account for the contributions of the limit. The points used are illustrated in Fig. 10.
The result given in Table III is significant for two reasons. On the one hand, it demonstrates a theoretical method which experimentalists could use to measure the nonlinear susceptibility in a way which avoids considering values at large radial coordinates where there is a potential for noise amplification with the PROM protocol. On the other hand, it provides a confirmation of the numerical methods. Although it is obvious that we can add and subtract the susceptibility at several intermediate electric fields, in practice, one susceptibility is found on the wing of a distribution with a strong incident electric field and another is found at the center of a weaker incident field.
IV. CONCLUDING REMARKS
The -scan method assumes the lowest-order functional form for the Kerr effect, namely , where is independent of the light intensity . Under this assumption, it is possible to measure using a single-channel detector. Such measurements have been performed countless times. However, if itself depends upon the intensity, then the results of the -scan method do not necessarily yield the unsaturated or the saturated values, but rather some functional of which is described by diffraction theory. In this paper, some examples of potential errors are presented using a simple analytic model of the nonlinear susceptibility, namely a two-level system [28] with Rb-like parameters [29]. At low intensities, the -scan method does an excellent job of recovering the associated Kerr coefficients, but at high intensities the reported values are only semiquantitatively correct.
The Introduction noted several materials for which the saturated susceptibility was measured, including atomic vapor cells. If an atomic vapor cell is excited with a Gaussian beam with cylindrical symmetry, the response will also have cylindrical symmetry. The optical response will depend on the intensity, but it will do so without rapid variation as a function of radius. Such a function can be expanded in terms of analytic functions such as Laguerre-Gaussian modes in a single plane in a rapidly convergent series [45]. The Laguerre-Gaussian mode can be used to predict the intensity on any plane. Each Laguerre-Gaussian mode is an analytic solution to the paraxial wave equation. The linearity of the paraxial wave equation guarantees that linear combinations of Laguerre-Gaussian modes also are solutions. Hence, we can write an objective function to compare the goodness of fit in the measurement space for complex coefficients referring to the interaction plane. The simplest objective function is a least-squares fit. In the absence of noise, the recovery is excellent. The PROM protocol is robust to both noise in the detector and fluctuations in the input optical intensity.
The required observation times and robustness to incident light fluctuations put low demands on laser stability or human resources, suggesting the experiment could be performed by a small, albeit specialized, research group in a single day. The required computing resources are also modest: an individual solution of PROM took about 1 h on a single processor of a 3.7-GHz workstation using a scripting language. Little effort was made to lower the computation time, so this figure should be regarded as an upper bound. Hopefully the method can be implemented in a real experiment, leading to an accurate measurement of the saturated Kerr effect, a prototypical nonlinear optical phenomenon.
TABLE I.
Formulas corresponding to the curves given in Fig. 1.
ACKNOWLEDGMENTS
Discussions with Paul Lett, Alan Migdall, Cory Nunn, and Quincy Webb are gratefully acknowledged.
APPENDIX A: THE SCAN AT FINITE DETECTOR POSITION
Sheik-Bahae et al. [11,12] give Eq. (2) for the normalized transmission in the case in which the detector is on axis in the far field. As discussed in Sec. II, the incident wave
| (A1) |
is multiplied by a phasor
| (A2) |
The first term is simply , and the second term leads to
| (A3) |
Equation (A3) is seen to be a Gaussian. The maximum induced phase is given by
| (A4) |
To make further progress, return to the unscaled variables and , note that is a Gaussian on the plane of the Kerr medium, and identify the real and imaginary parts of the reciprocal of the the coefficient of to identify the beam waist parameter and distance to the focus of . The results are that the beam waist of is given by
| (A5) |
where is the position of the Kerr medium relative to the focus beam in unscaled units and the focus of beam is given by
| (A6) |
With this expression for it is possible to calculate the interference of and at all points in space. For example, it is possible to develop an analytic expression for the integral over finite apertures. Similarly, using the same expansion as the references, the formula for the normalized transmission with the detector at a finite distance is
| (A7) |
where is the position of the on-axis detector relative to the focus of the laser beam in units of the Rayleigh length. Equation (2) is obtained from Eq. (A7) by taking . The function is plotted in Fig. 11 for a few representative cases for variable at fixed , i.e., with the Kerr medium scanned through the laser focus while the detector is held at some fixed position relative to the laser focus.
Although the peak and valley amplitudes have a modest dependence on the detector position , the effect on their difference is very small. For example, the far-field amplitudes are [12] , so their difference is approximately 0.406 068. , (i.e., the detector at 100 Rayleigh lengths from the focus), the peak amplitude, valley amplitude, and their difference are 1.206 538, 0.800 434, and 0.406 105 respectively. Some numerical calculations in this paper are performed using .
APPENDIX B: ADDITIONAL ASSUMPTIONS, COMMON RELATIONS, AND PARAMETERS
Some assumptions which were not otherwise given in the text are these: the paraxial approximation is valid; the incident field does not have a significant change of amplitude when going through the Kerr medium; there are no transient effects in the gas although in a real vapor cell the atoms are exposed to the electric field for a time measured in microseconds; the detuning is large enough so that thermal broadening can be neglected; and the Laguerre-Gauss expansions have a nonvanishing term .
Several common relations are listed here. The intensity of light is related to a plane wave with electric-field amplitude by
| (B1) |
The Rayleigh length is given by
| (B2) |
where is the Gaussian beam waist parameter. The Rabi (angular) frequency is given by
| (B3) |
Also, 1 [46].
Parameters used in the calculation are given in Table IV.
APPENDIX C: EXPANSION OF KERR PHASES INTO LAGUERRE-GAUSS FUNCTIONS
We seek the expansion coefficients of
| (C1) |
where the are complex coefficients. Using the orthonormality relation in Eq. (19),
| (C2) |
Taking the form of from Eq. (18),
| (C3) |
where and Equation (C3) is evaluated numerically through the use of Gauss-Laguerre quadrature points with weights . The formula is
| (C4) |
Fortunately, the formula used in the numerical evaluation does not depend on the phase factors of the Gaussian, but only on the phase induced by the Kerr medium.
APPENDIX D: CONVERSION OF THE KOGELNIK-LI SOLUTION TO DIMENSIONLESS FORM
Although the solution for the standard Laguerre-Gaussian modes [41] was given shortly after the invention of the laser, the transformation of the stated solution in their Eqs. (34) and (35) to dimensionless form took some care. The physical wave is related to the solution to the paraxial wave equation [40] by a factor . Reference [41] takes the plane wave to have the form . So we set . Another key simplification is
| (D1) |
where . Aside from these, the conversion involves routine algebraic substitutions applied to the solution in the reference in the following order: , , , , , and . The expressions were then simplified with computer algebra. The final expression, Eq. (18), was verified by showing it is a solution of the dimensionless paraxial wave equation, Eq. (17).
APPENDIX E: ACCOUNTING FOR SPREAD OF INCIDENT INTENSITIES WITH HERMITE-GAUSS QUADRATURE
To study the effect of a variation of incident intensity, I assume that the incident intensity varies as a Gaussian with some specified standard deviation, i.e.,
| (E1) |
where is the central optical intensity, is its standard deviation, and is the calculation of as discussed in Sec. III.
To evaluate this integral numerically, I use Hermite-Gauss quadrature. Setting , Eq. (E1) may be written as
| (E2) |
where the definition of is given from context. The integral is implemented as the sum
| (E3) |
Gauss-Hermite quadrature is traditionally given in terms of the integral
| (E4) |
Values are given in Abramowitz and Stegun [47] and a formula is given online [48]. From a change of variables in the integrals it is easy to show and . Equation (E3) is implemented with a 21 point quadrature. The calculation time is dominated by the time to find the coefficients from the intensity. The Gaussian integral introduces a negligible additional computational burden because the intensities are summed before the coefficients are recovered.
FIG. 11.
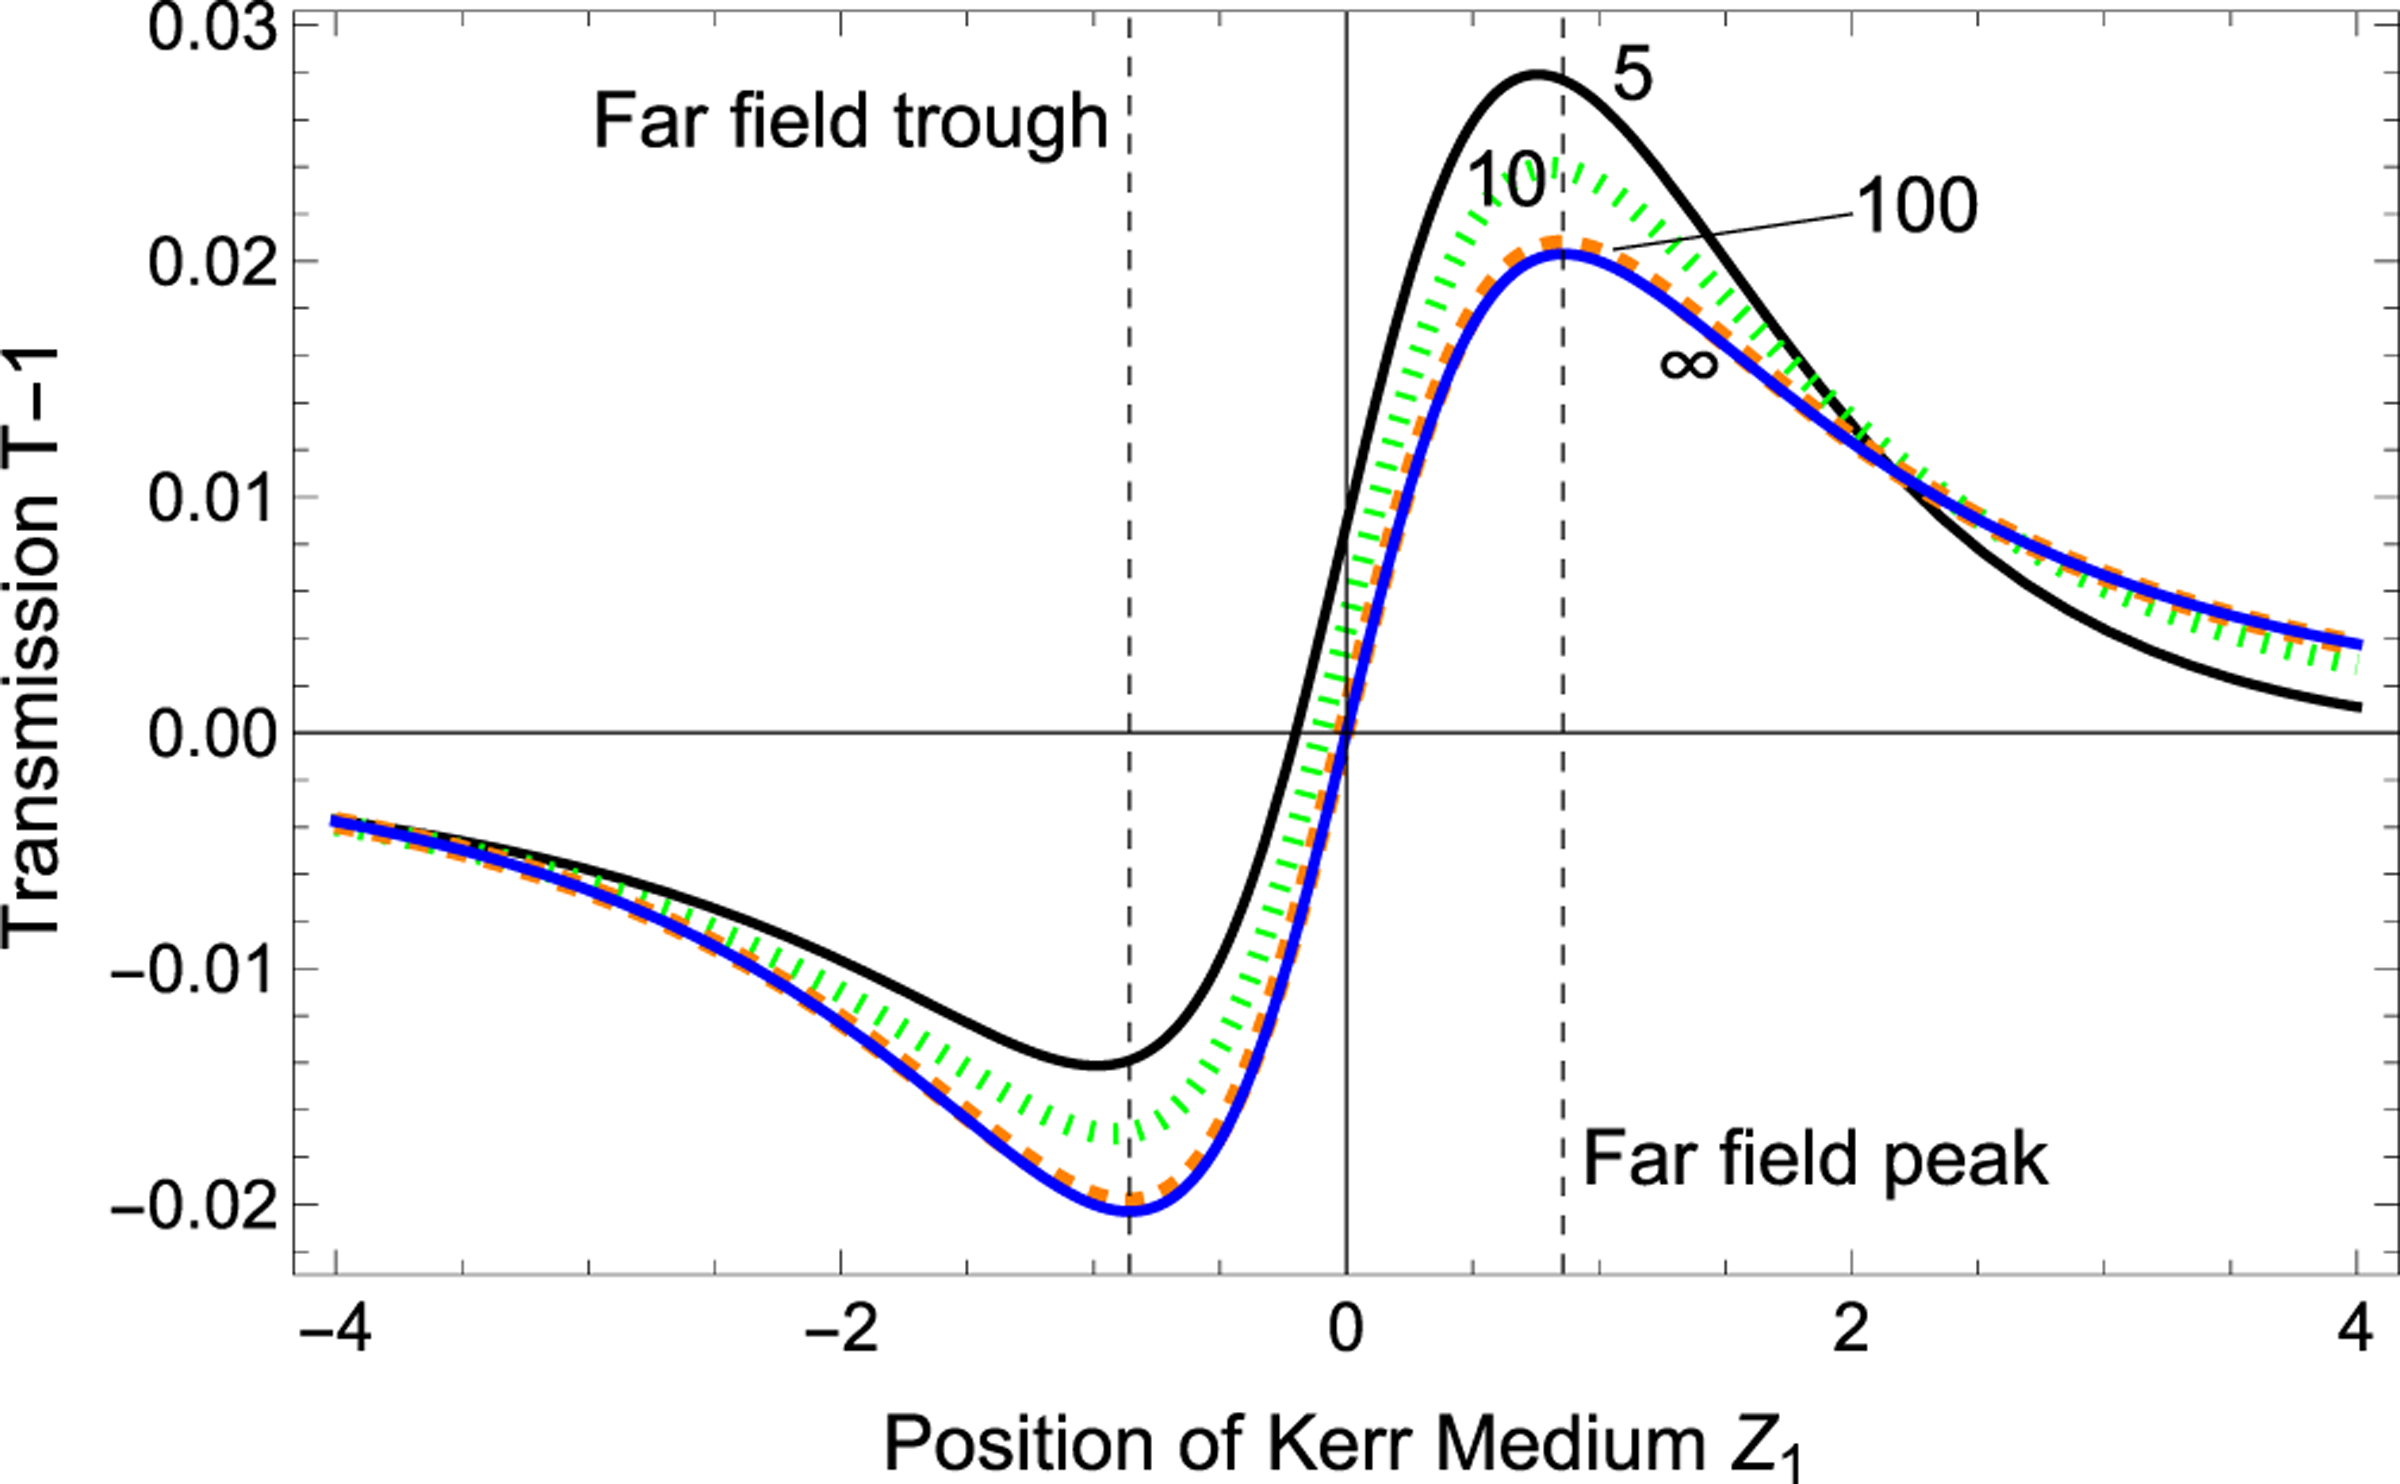
Normalized transmission curves for the scan are given with the detector at selected finite distances, (solid black) , (dotted green) , (dashed orange) , and (solid blue) or far field, as a function of the position of the Kerr medium from Eqs. (2) as and (A7). The Kerr medium is moved during a scan. The trough and peak in the far field are shown as dashed black vertical lines.
References
- [1].Chai Z, Hu X, Wang F, Niu X, Xie J, and Gong Q, Adv. Opt. Mater 5, 1600665 (2017). [Google Scholar]
- [2].Zhao Y, Yang Y, and Sun H-B, PhotoniX 2, 3 (2021). [Google Scholar]
- [3].Glorieux Q, Aladjidi T, Lett PD, and Kaiser R, New J. Phys 25, 051201 (2023). [Google Scholar]
- [4].Lvovsky AI, Sanders BC, and Tittel W, Nat. Photon 3, 706 (2009). [Google Scholar]
- [5].Eberly JH, Quantum Semiclass. Opt 7, 373 (1995). [Google Scholar]
- [6].Hollberg L, Oates CW, Curtis EA, Ivanov EN, Diddams SA, Udem T, Robinson HG, Bergquist JC, Rafac RJ, Itano WM et al. , IEEE J. Quantum Electron 37, 1502 (2001). [Google Scholar]
- [7].Dubietis A. and Matijošius A, Opto-Electron. Adv 6, 220046 (2023). [Google Scholar]
- [8].McCormick CF, Solli DR, Chiao RY, and Hickmann JM, Phys. Rev. A 69, 023804 (2004). [DOI] [PubMed] [Google Scholar]
- [9].Manzano D, AIP Advances 10, 025106 (2020). [Google Scholar]
- [10].Rao AS, Optik 267, 169638 (2022). [Google Scholar]
- [11].Sheik-Bahae M, Said AA, and Van Stryland EW, Opt. Lett 14, 955 (1989). [DOI] [PubMed] [Google Scholar]
- [12].Sheik-Bahae M, Said AA, Wei T-H, Hagan DJ, and Van Stryland EW, IEEE J. Quantum Electron 26, 760 (1990). [Google Scholar]
- [13].Wang S, Yuan J, Wang L, Xiao L, and Jia S, Opt. Express 28, 38334 (2020). [DOI] [PubMed] [Google Scholar]
- [14].Wang Y. and Saffman M, Phys. Rev. A 70, 013801 (2004). [Google Scholar]
- [15].Dos Santos FD, de Aquino Carvalho J, Moura G, and de Silans TP, J. Opt Soc. Am. B 36, 2468 (2019). [Google Scholar]
- [16].Oliveira LC, Catunda T, and Zilio SC, Jpn. J. Appl. Phys 35, 2649 (1996). [Google Scholar]
- [17].Turner MD, Roh WB, and Schepler KL, J. Opt. Soc. Am. B 17, 790 (2000). [Google Scholar]
- [18].Cheng C, Li Z, Dong N, Wang J, and Chen F, Opt. Express 25, 6132 (2017). [DOI] [PubMed] [Google Scholar]
- [19].Hashimoto T, Yamamoto T, Kato T, Nasu H, and Kamiya K, J. Appl. Phys 90, 533 (2001). [Google Scholar]
- [20].Demenicis L, Gomes A, Petrov D, de Araújo CB, de Melo CP, Dos Santos CG, and Souto-Maior R, J. Opt. Soc. Am. B 14, 609 (1997). [Google Scholar]
- [21].Quintero-Torres R. and Thakur M, J. Appl. Phys 85, 401 (1999). [Google Scholar]
- [22].Shahsavand Y, Karimarji S, and Khorsandi A, J. Opt 26, 045503 (2024). [Google Scholar]
- [23].Bian S, Martinelli M, and Horowicz RJ, Opt. Commun 172, 347 (1999). [Google Scholar]
- [24].Brée C, Demircan A, and Steinmeyer G, Phys. Rev. Lett 106, 183902 (2011). [DOI] [PubMed] [Google Scholar]
- [25].Gao W, Wang S, Yuan J, Wang L, Xiao L, and Jia S, Opt. Express 30, 7291 (2022). [DOI] [PubMed] [Google Scholar]
- [26].Wang D. and Leng Y, Opt. Commun 328, 41 (2014). [Google Scholar]
- [27].Shechtman Y, Eldar YC, Cohen O, Chapman HN, Miao J, and Segev M, Process. Mag 32, 87 (2015). [Google Scholar]
- [28].Grynberg G, Aspect A, and Fabre C, Introduction to Quantum Optics: From the Semi-Classical Approach to Quantized Light (Cambridge University, New York, 2010). [Google Scholar]
- [29].Levine ZH and Du Z, J. Opt. Soc. Am. B 40, 3190 (2023). [Google Scholar]
- [30].Gu B. and Wang H-T, Opt. Commun 263, 322 (2006). [Google Scholar]
- [31].dos Santos JF, Costa GG, Messias DN, and Catunda T, Opt. Commun 479, 126421 (2021). [Google Scholar]
- [32].Gureyev T, Roberts A, and Nugent K, J. Opt. Soc. Am. A 12, 1942 (1995). [Google Scholar]
- [33].Allen L. and Oxley M, Opt. Commun 199, 65 (2001). [Google Scholar]
- [34].Miao J, Charalambous P, Kirz J, and Sayre D, Nature (London) 400, 342 (1999). [Google Scholar]
- [35].Gerchberg RW and Saxton WO, Optik 35, 237 (1972). [Google Scholar]
- [36].Fienup JR, Appl. Opt 21, 2758 (1982). [DOI] [PubMed] [Google Scholar]
- [37].Gureyev T, Roberts A, and Nugent K, J. Opt. Soc. Am. A 12, 1932 (1995). [Google Scholar]
- [38].Pellat-Finet P, Opt. Lett 19, 1388 (1994). [DOI] [PubMed] [Google Scholar]
- [39].Maiden AM and Rodenburg JM, Ultramicroscopy 109, 1256 (2009). [DOI] [PubMed] [Google Scholar]
- [40].Waller L, Tsang M, Ponda S, Yang SY, and Barbastathis G, Opt. Express 19, 2805 (2011). [DOI] [PubMed] [Google Scholar]
- [41].Kogelnik H. and Li T, Appl. Opt 5, 1550 (1966). [DOI] [PubMed] [Google Scholar]
- [42].Paganin DM, Coherent X-Ray Optics (Oxford University Press, New York, 2006), Sec. 2.2. [Google Scholar]
- [43].McCormick CF, Boyer V, Arimondo E, and Lett PD, Opt. Lett 32, 178 (2007). [DOI] [PubMed] [Google Scholar]
- [44].Zhao L, Yan H, Bai J, Hou J, He Y, Zhou X, and Wang K, Opt. Express 28, 19726 (2020). [DOI] [PubMed] [Google Scholar]
- [45].Gottlieb D. and Orszag SA, Numerical Analysis of Spectral Methods: Theory and Applications (SIAM, Philadelphia, 1977). [Google Scholar]
- [46].Mohr PJ and Phillips WD, Metrologia 52, 40 (2015). [Google Scholar]
- [47].Abramowitz M. and Stegun IA, Handbook of Mathematical Functions with Formulas, Graphs, and Mathematical Tables (U.S. GPO, Washington, DC, 1968), Vol. 55. [Google Scholar]
- [48].https://mathworld.wolfram.com/Hermite-GaussQuadrature.html (2024).


