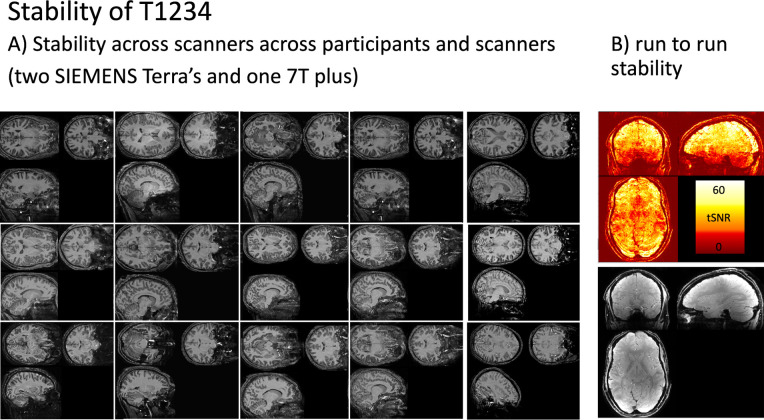
Fig. 4: Stability of T1234.
Panel A) depicts T1234 maps across 15 scan sessions, showing consistency across participants and different scanner models. The protocol reliably provides strong T1 contrast.
Panel B) shows run-to-run stability of the protocol in the form of tSNR maps, calculated as the mean divided by the standard deviation.

