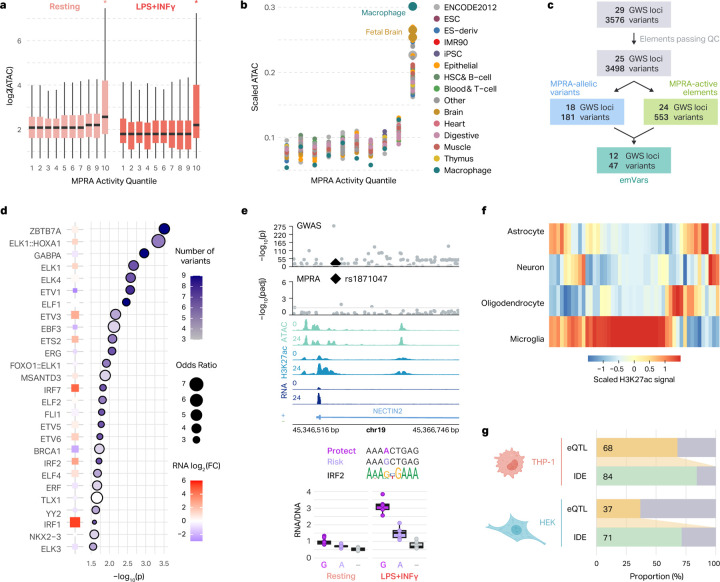
Fig. 3 |. MPRA-measured regulatory activity correlates with endogenous regulatory architecture of macrophages and microglia.
a, Box plots show the chromatin accessibility of AD-associated variants stratified by their MPRA-measured activity. Asterisks represent two-sided Wilcoxon rank-sum test p < 0.05. The log2(ATAC-seq counts) for the variants in each MPRA activity quantile are displayed for the resting (left) and LPS+INFγ-treated (right) macrophages. Box plots show the median and IQR with whiskers extending to the most extreme non-outliers. b, Normalized ATAC-seq counts for AD-associated genetic elements are shown across MPRA activity quantiles for different cell types from the Roadmap Epigenomics study37. c, Workflow illustrating how emVars are defined. d, TFs with motifs predicted to be altered by emVars. Enrichment was calculated by comparing TF disruption in emVars with that in MPRA-inactive and MPRA-non allelic variants. The color of each point represents the number of emVars that disrupt the motif and the size of the point represents the odds ratio (right). P-values were calculated with a two-sided Fisher’s exact test. TF expression is compared between LPS+INFγ (red) and resting (blue) macrophages (left, as described in RNA LFC). e, Example region of an emVar that disrupts TF motif binding at the NECTIN2 locus (top). Box plots show the transcriptional activity of each allele for the emVar for both resting and LPS+INFγ-treated macrophages compared to negative control (−) (bottom). Box plots show the median and IQR with whiskers extending to the most extreme non-outliers. f, Heatmap of H3K27ac signals across four brain cell types at emVars. g, Comparison of microglia eQTL overlap with emVars defined in THP-1 macrophages and HEK293T cells.

