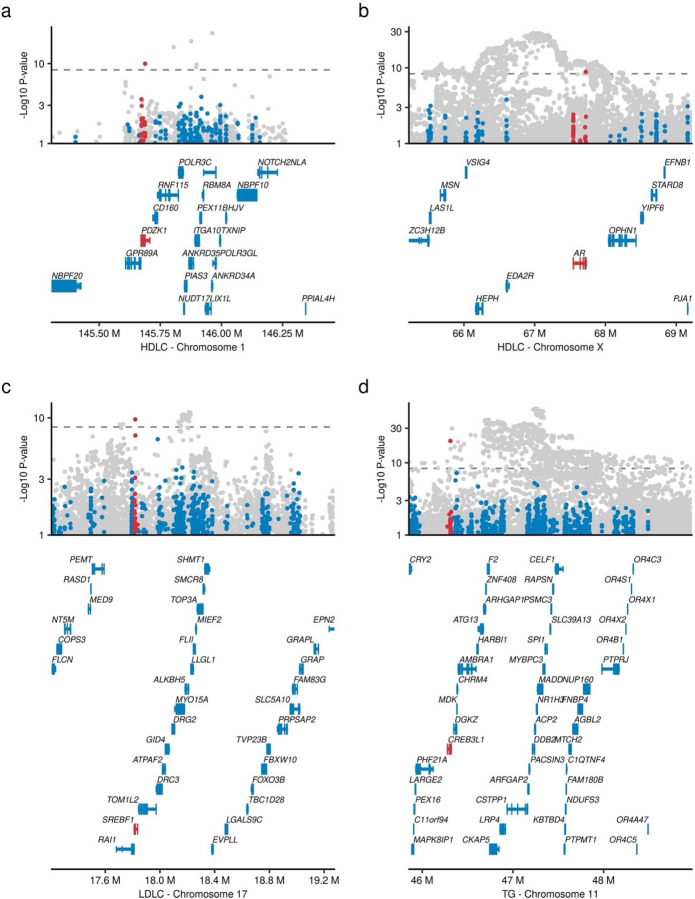
Extended Data Figure 5 |. Implicated causal genes in the established lipid associated loci.
The horizontal axes represent genomic coordinates, while the vertical axes denote the negative log10 P-values for PDZK1 (a), SREBF1 (b), AR (c), and CREB3L1 (d). Red dots illustrate the association of rare coding variants in genes with significant variants. In contrast, blue dots show the association of rare coding variants in genes without significant variants. Gray dots represent common variant associations from a previous study (Graham et al., Nature 2021). The dashed line in the upper panel indicates the exome-wide significance threshold (P < 4.4 × 10⁻⁹). The lower panel illustrates the coding genes within the locus; genes harboring significant variants are highlighted in red, and others are in blue. The P-values were calculated by linear mixed model with two-sided test. The P-values were not adjusted for multiple testing correction. The LDLC, low-density lipoprotein cholesterol; HDLC, high-density lipoprotein cholesterol; MVP, Million Veteran Program; UKB, UK Biobank; AFR, African-like population; EUR, European-like population; HIS, Hispanic-like population.

