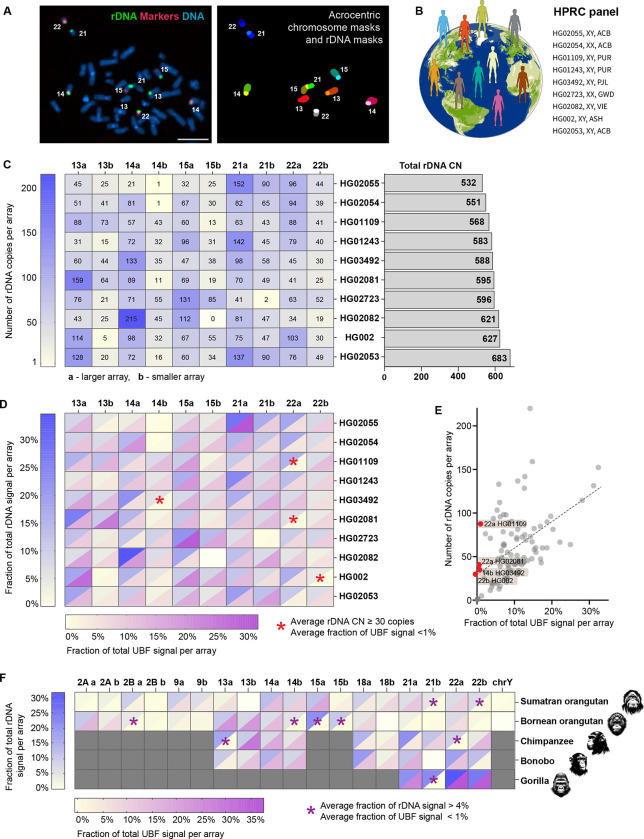
Figure 1. rDNA copy number and activity in human and primate genomes.
A. Identification of specific rDNA arrays for fluorescent intensity measurements. Left panel: chromosome spread from HG002 LCL labeled by FISH with rDNA probe (green) and chromosome identification markers CenSat 14/22 and PML (red). Right panel: segmentation and identification of acrocentric chromosomes and corresponding rDNA arrays. Bar, 10μm.
B. HPRC panel of lymphoblastoid cell lines (LCL) used in this study.
C. Heatmap of rDNA copy numbers of each acrocentric rDNA array in the selected panel of HPRC cell lines. “a” indicates larger array and “b” smaller array. Numbers are averages from 10 or more spreads, with more detailed boxplots provided in Supplementary Figure 1. The bar plot on the right shows estimates of total rDNA CN in corresponding samples.
D. Combined heatmap of average rDNA and UBF fluorescent intensities expressed as fractions of the total signal in a chromosome spread. rDNA was labeled by FISH, and UBF was labeled with an antibody. Both values are averages from 10 or more spreads, with detailed bar graphs shown in Supplementary Figure 2. The blue heat scale corresponds to the rDNA, and the magenta heat scale corresponds to UBF. Blank cell (15b in HG02082) indicates undetectable array. Asterisks denote arrays with 30 or more gene copies, but less than 1% of the total UBF signal.
E. Average fractions of the total UBF signal are plotted against the average rDNA CNs for all arrays in all HPRC samples. Linear regression indicates a positive trend (R2=0.27). Red points denote outlier arrays with 30 or more gene copies, but less than 1% of the total UBF signal.
F. Combined heatmap of average rDNA and UBF fluorescent intensities of rDNA arrays in non-human primates: Sumatran orangutan, Bornean orangutan, chimpanzee, bonobo, and western lowland gorilla. Chromosome identities were assigned as homo sapiens (hsa) homologues. Gray cells indicate non rDNA-bearing chromosomes in each primate species. Blank cells indicate undetectable rDNA arrays. The blue heat scale corresponds to the rDNA, and the magenta heat scale corresponds to UBF. Both parameters were expressed as percent of the total signal in a chromosome spread, showing averages from 10 or more spreads. Asterisks denote arrays with more than 4% of the total rDNA signal but less than 1% of the total UBF signal. Representative karyograms and fluorescence quantifications are shown in Supplementary Figure 3.

