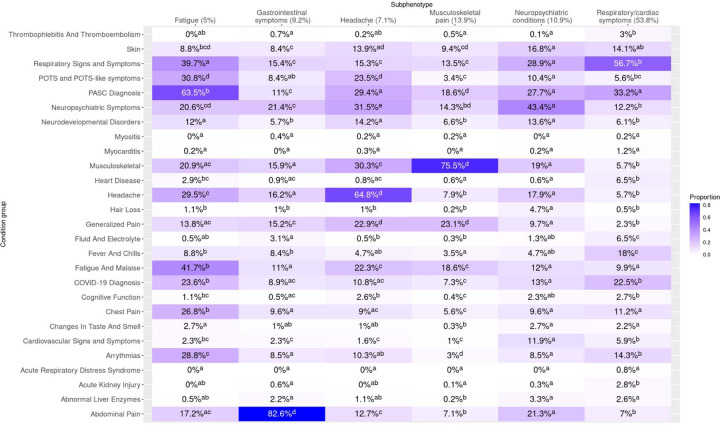
Figure 3: Heatmap of incident post-acute diagnoses, cohort B.
Summary of clusters by presence of incident PASC-associated diagnoses. To be counted, diagnoses in the respective clusters had to occur in the 28–179 post-acute period following infection and not have been present in the 18 months prior. Cells display proportions of patients in the cluster with the corresponding PASC-associated diagnosis group, and the results of Compact Letter Display (CLD) analysis are represented in superscripts. For a given incident PASC-associated diagnosis group (row), two clusters share the same letter when proportions did not differ significantly (via multiple-testing adjusted chi squared testing) between the two clusters.

