

Abstract
The biggest challenge in current isolation methods for lipid bilayer-encapsulated vesicles, such as exosomes, secretory, and synthetic vesicles, lies in the absence of a unified approach that seamlessly delivers high purity, yield, and scalability for large-scale applications. To address this gap, we have developed an innovative method that utilizes photosensitive lipid nanoprobes specifically designed for efficient isolation of vesicles and sorting them into subpopulations based on size. The photosensitive component in the probe undergoes cleavage upon exposure to light, facilitating the release of vesicles in their near-native form. We demonstrate that our method provides superior capability in isolating extracellular vesicles from complex biological media and separating them into size-based subpopulations within 1 hour, achieving more efficiency and purity than ultracentrifugation. Furthermore, this method’s cost-effectiveness and rapid enrichment of the vesicles align with demands for large-scale isolation and downstream analyses of nucleic acids and proteins. Our method opens new avenues in exploring, analyzing, and utilizing synthetic and extracellular vesicle subpopulations in various biomedical applications, including diagnostics, therapeutic delivery, and biomarker discovery.
Graphical Abstract

The photosensitive lipid nanoprobe-based isolation method transforms synthetic and extracellular vesicle research, offering a rapid, scalable, and universally applicable technique with higher purity and recovery rates than existing methods. The 3-step process efficiently isolates vesicle subpopulations from diverse biological sources. This advancement holds significant potential in large-scale extracellular vesicle research for diagnostics, disease mechanisms, and therapeutic applications.
1. Introduction
Extracellular vesicles (EVs), ranging from exosomes, microvesicles, and ectosomes to location specific variants such as mitochondrial EVs, encapsulate diverse molecular components from their parent cell, such as proteins and micro RNA, to fulfill specific physiological functions.1–7 It is widely accepted that EV subpopulations, each with distinct biophysical and biochemical traits, uniquely affect recipient cells, making enriched separation methods for these subpopulations critically important.8,9 However, their inherent heterogeneity, coupled with the coexistence of non-vesicular extracellular nanoparticles (NVEPs) like lipoproteins10, protein complexes, exomeres1, and supermeres2,6, poses substantial challenges to their isolation and thorough characterization.5,11 Commonly used isolation methods including ultracentrifugation and ultrafiltration often result in contamination and variability in sample preparation. While antibody-coupled magnetic beads provide a clean separation of exosomes12, they are unable to separate vesicles based on size. This limitation frequently demands the use of additional slower and complex methods, such as a differential or gradient ultracentrifugation13. Moreover, antibody-based affinity approaches tend to isolate only specific EV subpopulations based on surface proteins, leaving behind critical information about the diversity of the EV population. Thus, the EV field still faces challenges in managing yield and sorting heterogeneous populations without compromising their purity and structural integrity. To unlock the full diagnostic and therapeutic potential of EVs,14 developing a unified isolation technique that addresses the need for high-purity, efficient size-separation of EV subpopulations while retaining their heterogeneity, structure, and function is critical.
Recent advancements in vesicle research have spotlighted the transformative capabilities of lipid rafts15 and lipid nanoprobes (LNs).16–19 Instead of solely relying on surface-specific protein markers, LNs use strong hydrophobic interactions with EV membranes to capture and isolate all EV populations with high purity and without NVEPs. Consequently, LN-based isolations have emerged as a promising approach for cost-effective EV isolation for high purity and yield, offering a competitive edge over conventional strategies. Recently, a DNA-based lipid affinity capture method successfully isolated EVs in their near-native form.16 However, this approach requires the use of expensive DNase enzymes for the sample preparation and does not adequately address the issue of EV heterogeneity. Acknowledging the critical importance of understanding EV heterogeneity for diagnostic and therapeutic applications, a straightforward, cost-effective, and reliable method that can isolate native EVs and sort them by size-specific populations is essential. To address these challenges, we present an innovative approach for isolating and size-enriched sorting of sub-200 nm lipid bilayer-containing vesicles in their near-native form to meet large-scale clinical application demands.
Here, we synthesized multiple LNs with various lipid, photosensitive cleavable linker, and affinity tag chemistries (Fig.1 and Table S1) to effectively isolate EVs from large cell culture volumes and separate them into size-specific subpopulations without NVEPs. Our method simplifies the lengthy ultracentrifugation protocols, eliminating the need for bulky or costly equipment, and is capable of processing large volumes of biological media to isolate small EVs in under an hour at minimal cost. The cleavable linkers are designed to detach from the vesicles upon light exposure, thereby reverting the EVs to a state that closely mimics their native condition post-isolation. To demonstrate the efficacy of our method, we isolated EVs, preserving their near-native state and devoid of NVEPs, from the culture media of three distinct cell lines: primary macrophages (Mφ), insulin-producing cells (INS), and neuroblastoma cells (N2a). Our findings reveal the number of probes integrated into the vesicles correlates with their size. This relationship allowed us to modulate D-biotin concentration and light-mediated cleavage to selectively sort and enrich vesicle subpopulations based on size. We further demonstrated the broad applicability of the method by sorting proteoliposomes in a size range that is uniquely suitable for accurately recapitulating the cellular vesicles’ structure and behavior. In an investigation using the Streptozotocin (STZ)-induced Alzheimer’s model in N2a cells,20–23 we observed that the Alzheimer-associated marker, synaptic protein synaptotagmin-1 (Syt1), did not show a consistent correlation with tetraspanin containing exosomes. This finding emphasizes the importance of isolating complete vesicle populations for the accurate diagnosis of disorders. Our approach represents a breakthrough, offering a cost-effective solution that addresses the limitations of traditional methods. It ensures high-purity, scalable yields of EVs and elucidates the complexities within the spectrum of vesicular subpopulations.
Figure 1. Photosensitive LN for Isolating High Purity Vesicle.

a) (Top) Chemical structures of the photosensitive LN: DSPE-NIR-PEG_0.1K-DB with the NIR-induced singlet oxygen 1O2 -based cleavage mechanism of (Z)-2,2′-(ethene-1,2-diylbis(sulfanediyl)diethanamine (BSDA) cleavable linker. (Bottom) The non-photosensitive analog: DSPE-PEG_n-DB. b) Schematic depiction of a tri-phase protocol that includes lipid-affinity-based enrichment, purification, and isolation steps, designed to ensure high purity and yield in vesicle isolation. c) De novo docking analysis of PEG-desthiobiotin (DB) affinity tag (left; designed using Avogadro27) and competitive binding of D-biotin (right) in the ꞵ-barrel Avidin binding site (PDB ID: 2AVI). d) SEM image of avidin-functionalized high-capacity agarose beads (HCAB) with captured Insulin cell derived-sEV. Scale Bar 1μm. Inset Left: arrows indicate captured sEV. Scale Bar 200 nm. Inset Right: Negative stain TEM image of eluted sEVs. Scale Bar 200 nm.
2. Results and Discussion
2.1. Development of a Photosensitive Lipid-Nanoprobe System for Native Vesicle Isolation
Our vesicle isolation method relies on two principal components: the lipid nanoprobe (LN) and the associated capture unit. The LN design features a range of constructs, including those with a photocleavable linker – DSPE-NIR-PEG_0.1K-DB (Fig. 1a - Top) and their non-photocleavable counterparts - DSPE-PEG_n-DB (Fig. 1a - Bottom). All LN constructs used in the study can be found in Table S1. The LN is designed with four key components that synergize to optimize its functionality: first, a lipid insert (DSPE, 1,2-distearoyl-sn-glycero-3-phosphoethanolamine) that facilitates robust interaction with lipid bilayers, ensuring effective vesicle capture; second, a photosensitive linker, enabling controlled release of the vesicles upon exposure to near-infrared (NIR) light; third, a polyethylene glycol (PEG)-based tether, providing spatial separation and prevent non-specific absorption between the vesicles and the solid support; and finally, a biotin or desthiobiotin moiety, aiding in the affinity-based capture and subsequent release of the vesicles through competitive elution.
For the capture unit, we employed high-capacity monomeric avidin-functionalized agarose beads (HCABs) (Fig. S1a). The HCABs, with an average diameter of approximately 25 μm (Fig. S1b), are five times larger than previously reported magnetic counterparts.18,24,25 This increased size is critical in minimizing interference between larger vesicles and multiple beads. Despite their larger size, the HCABs are designed to be sufficiently compact, offering an improved surface-to-volume ratio when compared to flat capture surfaces. This design consideration not only significantly enhances vesicle capture efficiency but also contributes to the cost-effectiveness of the method.
Vesicle capture is initiated by incubating LNs with a vesicle-rich sample, allowing the LNs to integrate into the vesicle membranes before being captured by HCABs (Fig. 1b – d). Alternatively, the LNs can be first tagged with beads (like a fishing technique) before introducing them to the sample. The capture of the LNs on the beads was verified by identifying the presence of DSPE using the characteristic of R-O-P-O-R’ stretching26 (Fig. S1c), and using the beads to capture fluorescently labeled vesicles (Fig. S1d). After vesicle capture and enrichment (Fig 1b & 1d), their isolation was accomplished in one of two ways (Fig. 1b). The first employs a competitive elution process with D-biotin to displace LN-bound biotin derivatives from beads (Fig. 1c), followed by light exposure to detach the PEG and biotin tag. Alternatively, a photolytic method utilizes light-induced cleavage to separate the vesicles from the beads directly.
Our method enabled precise control over vesicle isolation, providing an option between chemical or light-based separation based on the application’s needs. More importantly, by having the ability to cleave off the functional unit, this technique bridges a significant gap by enabling the isolation of near-native vesicles directly from complex biological environments, marking a significant advancement over existing lipid-nanoprobe methods.16,18
2.2. Optimization and Characterization of LNs for Optimal Vesicle Isolation
2.2.1. Validation of LN Self-insertion Efficiency and Affinity Tag Efficacy
To assess the self-insertion efficiency of LNs into vesicles, we synthesized fluorescent alternatives of the DSPE-based LN by replacing the desthiobiotin affinity tag with a fluorescein marker (DSPE-NIR-FITC and DSPE-PEG_5K-FITC). Figure 2a shows the colocalization efficiency between the fluorescent LNs and liposomes, which serves as an indicator of LN self-insertion efficiency. We incubated 5 mol% of DSPE-PEG_5K-FITC probes with liposomes of two sizes (60 nm and 140 nm) labeled with ATTO 647N-DOPE fluorescent lipid. Within the span of 1 hour, a considerable increase in co-localization efficiency was observed, demonstrating the ability of our method to capture and isolate vesicles in a short time frame. Notably, the 140 nm liposomes showed a significant 70% enhancement in colocalization. However, the smaller 60 nm liposomes exhibited a lower colocalization efficiency, which could be due to lower surface area. This observation underscores a size-selective aspect of the LN self-insertion process.
Figure 2. Optimization of HCAB and LN for Liposome Isolation.
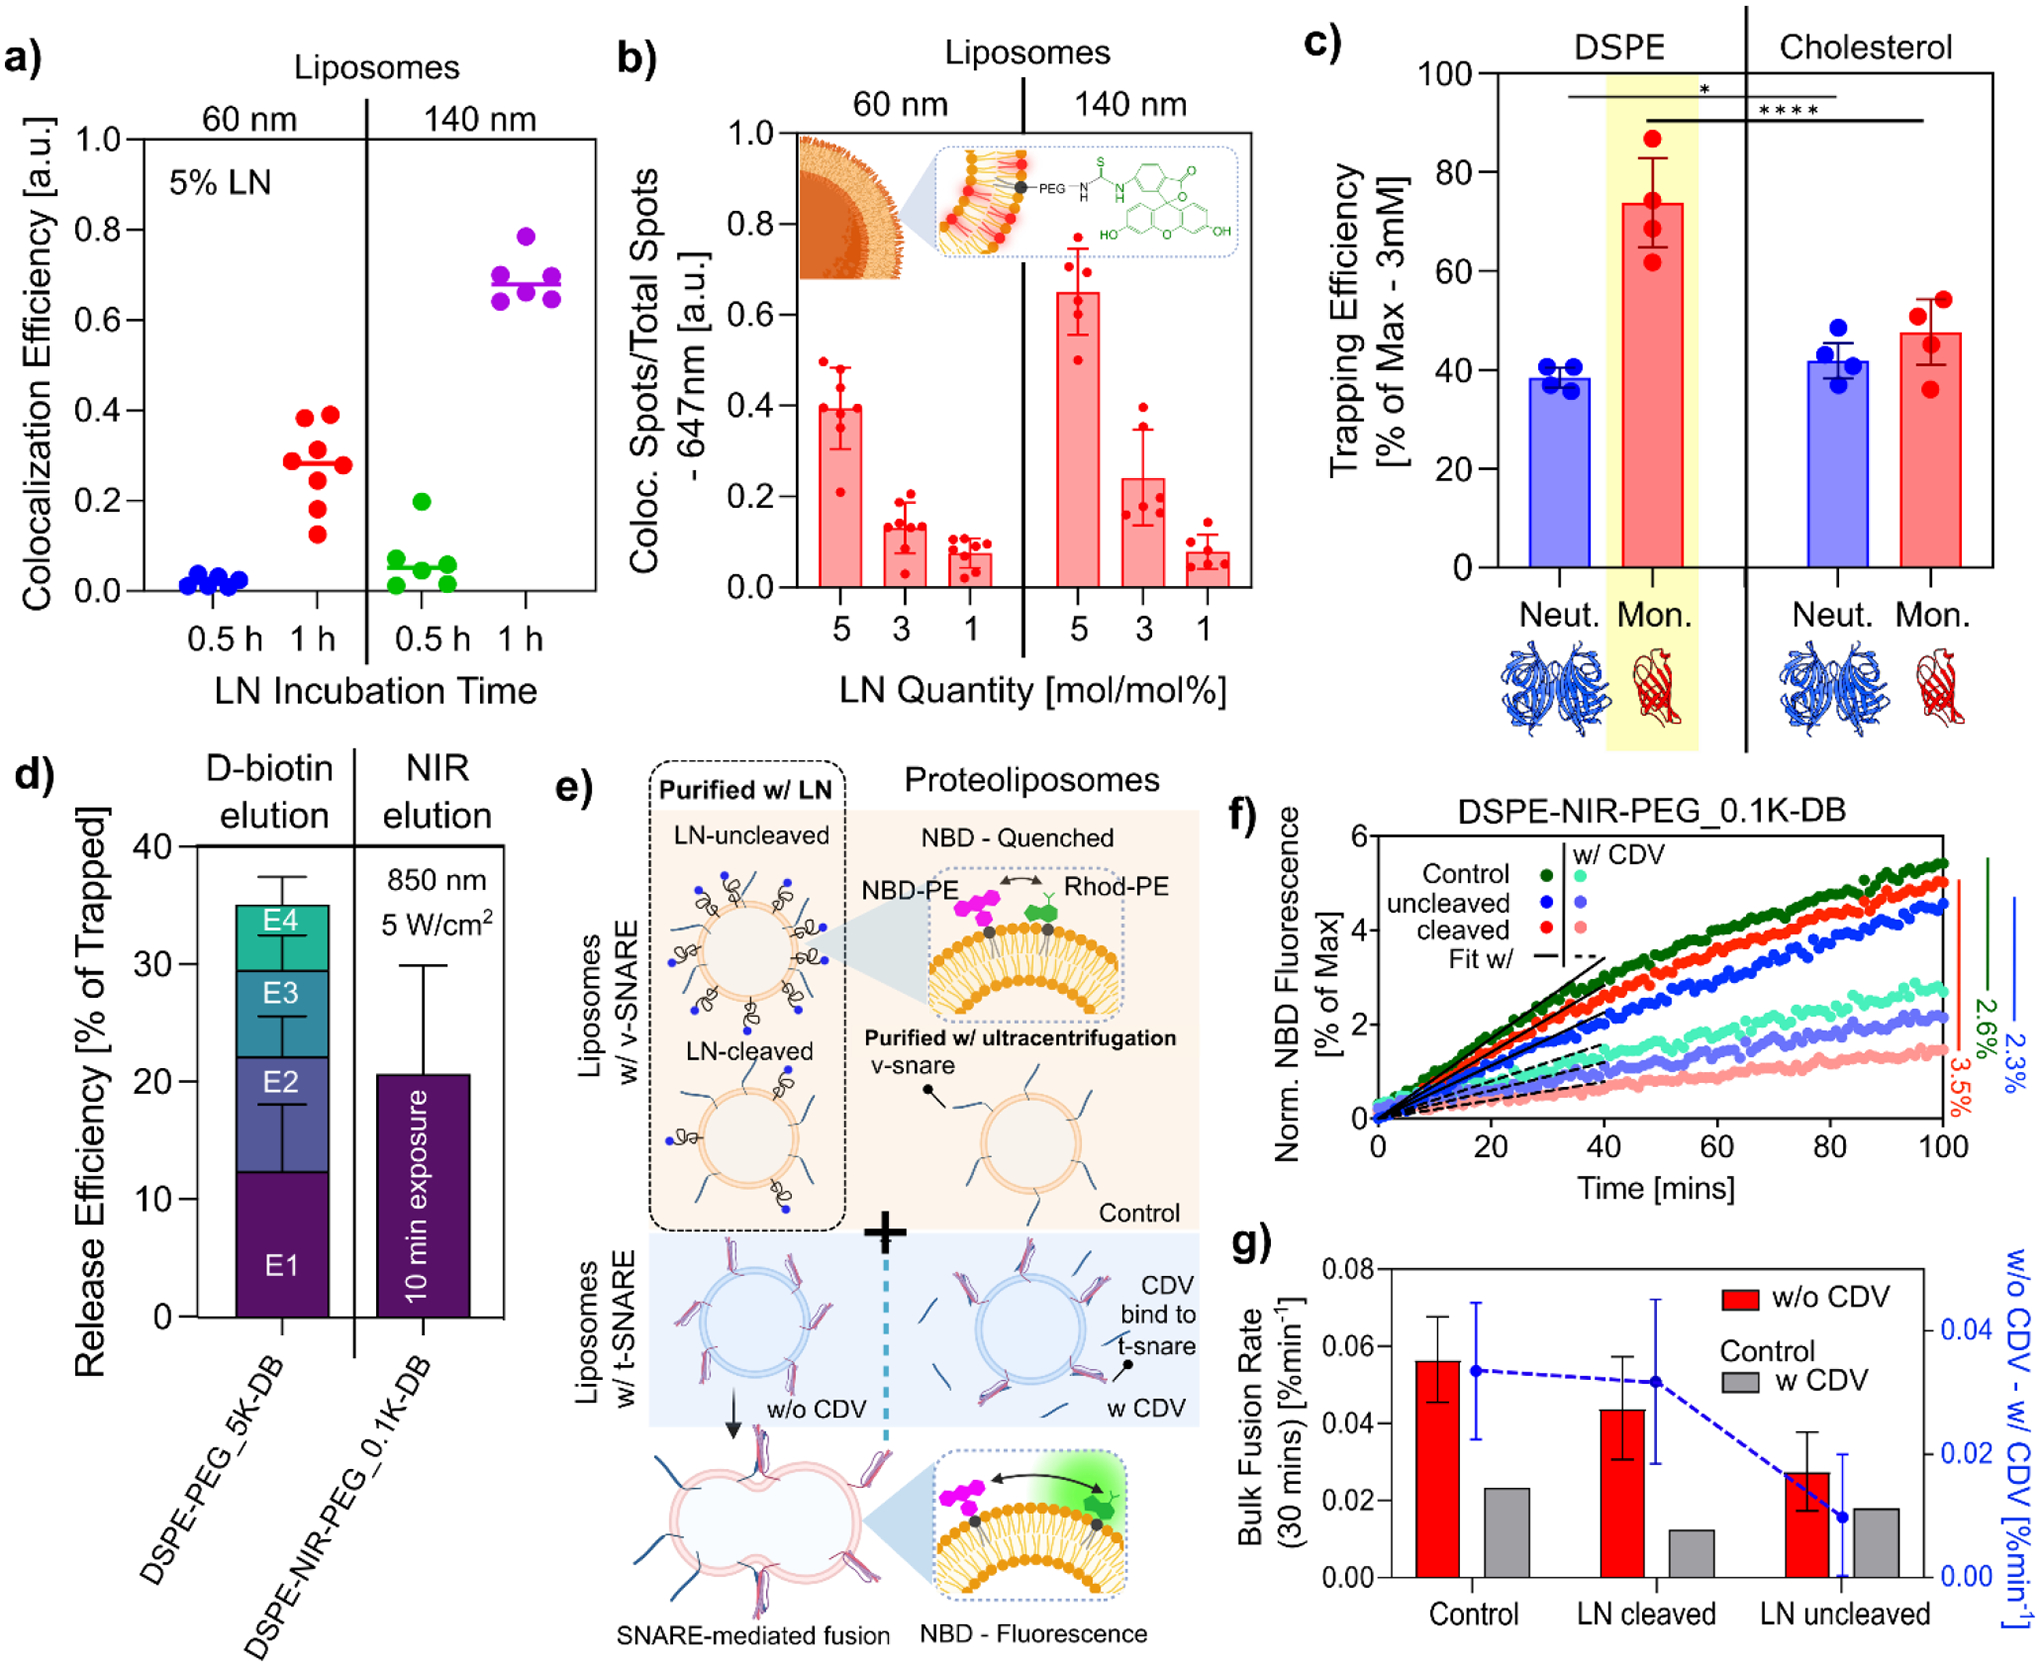
a) Temporal dependence of LN integration assessed using the colocalization efficiency of FITC and MEMGlow647™ for 60 nm and 140 nm vesicles with 5% DSPE-PEG_5K-FITC. Mean (n>6). b) The use of 5%, 3%, and 1% of LNs (mol/mol in 3 mM lipid concentration) self-insertion in 60 nm and 140 nm vesicles. Colocalization indicates the insertion of the LN into the vesicle. Mean ± S.E.M (n>6). c) Trapping efficiency analyses on neutravidin and monomeric avidin beads (200 μL slurry) with 60 + 140 nm liposome mixture containing DSPE and cholesterol LNs. Mean ± S.E.M (n=4). The yellow highlight indicates the combination with the highest trapping efficiency. Two-way ANOVA multiple comparisons using Tukey’s method *p ≤ 0.05, ****p ≤ 0.0001. d) Release efficiencies of 60 + 140 nm liposomes mixture isolated with 5% of the non-photosensitive probe - DSPE-PEG_5K-DB eluted over 4 elution steps (E1–4) and the photosensitive probe - DSPE-NIR-PEG_0.1K-DB eluted with a total 10-minute exposure of 850 nm NIR-light at 5 W/cm2. Mean ± S.E.M (n=4). e) Schematic representation of the NBD dequenching lipid mixing assay designed to elucidate bulk membrane fusion dynamics with and without LNs. V-SNARE liposomes contain NBD (green) and Rhodamine (pink) fluorophores, and t-SNARE liposomes without fluorescent dyes. Control experiments use solubilized cytosolic domain VAMP2 (CDV) to inhibit protein interactions. Membrane fusion reduces the spatial confinement of the fluorophores, leading to NBD dequenching and an increase in fluorescence. f) NBD dequenching lipid mixing assay showing normalized NBD fluorescence intensity between v-SNARE proteoliposomes prepared by ultracentrifugation and vesicles purified using lipid nanoparticles (LNs). This comparison includes vesicles with LNs that have been either cleaved or left uncleaved, and it is conducted both in the presence (with) and absence (without) of the competitive inhibitor CDV. g) Bulk fusion rate for the first 30 minutes (linear region) estimated with a linear regression (R2 > 0.95). The secondary axis shows the change in bulk fusion rate between samples with and without CDV. Mean ± S.E.M (n=2).
Next, we evaluated the optimal concentration of LNs necessary to achieve a better yield. We incubated varying concentrations of LN probes 1%, 3%, and 5% (expressed as mol%) with the vesicle samples. As expected, there was a proportional increase in the number of integrated probes corresponding to the increasing concentrations of LNs (Fig. 2b). We observed the presence of unincorporated LNs along with the vesicles (Fig. S2a–b). Transmission electron microscopy (TEM) further revealed the formation of micelles, with sizes predominantly less than 10 nm (Fig. S2c). Such micelle formation has been previously documented in studies using DSPE-PEG_2K based LNs.28 Similarly, these micelles were only visible in LNs with a larger PEG spacer (DSPE-PEG_5K-FITC) predominantly at lipid concentrations exceeding 3% of 3 mM lipids (Fig. S2d), indicating a critical micelle concentration < 90 μM, a threshold occasionally reached in large sample volumes.
We then assessed vesicle capture and release efficiency by comparing biotin to its lower-affinity analog, desthiobiotin. Although biotin derivatives have been used in LNs for vesicle sequestration18, their release efficiency has been less studied. Our initial Ab initio docking simulations indicated that adding a PEG segment reduced its affinity within the β-barrel binding pocket (Fig. 1c & S3a–e). Despite this, both biotin and desthiobiotin allowed for the efficient capture of LN-incorporated vesicles (Fig. S3f). The reduced affinity of desthiobiotin facilitated the competitive displacement of these vesicles with a D-biotin solubilized elution buffer. Confirming our computational predictions, we experimentally validated that LN probes containing desthiobiotin tag enhanced competitive elution, facilitating larger vesicle yield with gentle elution conditions (Fig. S3g).
2.2.2. Optimization of Vesicle Capture and Release
Next, we investigated the efficacy of DSPE and cholesterol as potential lipid tags. Their efficiency was evaluated in combination with high-capacity monomeric avidin and neutravidin functionalized agarose beads. Notably, HCABs functionalized with monomeric avidin demonstrated superior vesicle trapping efficiencies compared to their neutravidin counterparts (Fig.2c). Despite its documented lower biotin-binding affinity29, we believe the compact structure of monomeric avidin offers enhanced accessibility. Thus, this cost-effective variant is less susceptible to nonspecific interactions and aggregation as well as higher protein occupancies.30 Remarkably, the combination of monomeric avidin and DSPE yielded a trapping efficiency of nearly 75% for a liposome mixture containing both 60 nm and 140 nm sizes at a total lipid concentration of 3 mM, representing a substantial improvement of over 20% compared to other tested combinations. This efficiency could be further increased to around 95% with the utilization of increased quantities of HCABs (Fig. S4a). Although cholesterol-based probes are known to integrate more effectively into cell membrane bilayers and EVs,31,32 their affinity for binding to HCABs appeared to be less optimal. This observation is consistent with recent findings suggesting cholesterol-based LNs with a biotin tag exhibit reduced avidin binding at higher concentrations,33 which is potentially due to steric hindrance arising from the formation of cholesterol-rich lipid domains within the bilayer upon integration. Furthermore, we found the HCABs retained functionality for up to four cycles of use, with only a 10–30% reduction in trapping efficiency across repeated usage (Fig. S4b). This durability underscores the potential for a cost-effective approach in vesicle isolation applications.
During purification, we monitored the stability of captured vesicles and observed a minimal loss of approximately 5% across six wash cycles, suggesting successful vesicle retention (Fig. S4c). For elution, we compared both competitive elution and light-activated methodologies (Fig 2d). Both methods can be used interchangeably to achieve high-purity vesicles. However, the light cleavage method removes the PEG linker and desthiobiotin moiety from the linker, thereby yielding near-native vesicles.
For competitive elution, we used a buffer containing 2.5 mM of D-biotin. We observed that liposomes integrated with cholesterol-based LNs exhibited marginally lower release efficiency than those with DSPE-based LNs. Notably, the release efficiency was higher for smaller liposomes. A cumulative total of 6 elutions was required to achieve >50% elution for smaller liposomes (Fig. S4d & S4e), with nearly 100% release efficiency for 60 nm vesicles using 3% LNs (Fig. S4e). Interestingly, after a 1-hour incubation, the incorporation of DSPE-based probes into the larger model vesicles (140 nm) was 2.5 times greater than in the smaller model vesicles (60 nm) (Fig. S4f). This finding suggests the quantity of probes incorporated is directly proportional to the size of the vesicles. Consequently, smaller vesicles tend to release more readily due to a lower number of LNs bound to the HCAB resin. Additionally, our results demonstrated that PEG spacer length directly contributed to an enhancement in the release efficiency for each elution (Fig. S4f). However, as previously discussed, this would come at the cost of the co-isolation of LN micelles in concentrated liposome samples (Fig. S2b).
For light-activated elution, we utilized a photosensitive cleavage mechanism facilitated by a 1O2-cleavable linker, (Z)-2,2′-(ethene-1,2-diylbis(sulfanediyl)diethanamine (BSDA)34, which bridges between PEG chains and DSPE (Fig 1a). Typically, photosensitive linkers are designed to undergo cleavage through a reaction with reactive oxygen species (ROS), which are generated when ultraviolet (UV) or near-infrared (NIR) light is applied in the presence of a photosensitizer.35,36. These linkers often disrupt vesicle carriers and are used in pharmaceutical drug delivery applications37,35,38. It is also known that high-intensity near-infrared (NIR) and UV light can induce in situ ROS38–41. By directly applying non-invasive light, we were able to generate ROS sufficient to cleave the sulfur double bond to release the vesicle (Fig. 2d). To quantify 1O2-cleavable linker cleavage per vesicle, we carried out single vesicle fluorescence analysis with an LN fluorescent variant (DSPE-NIR-FITC) incorporated together with our non-photosensitive variant (DSPE-PEG_5K-DB), which allowed us to capture the vesicles in a neutravidin coated slide (Fig. S5a). We saw ~40% cleavage for a total of 10 minutes of exposure to 850 nm (5 mW/cm2) of NIR light (Fig. S5b). This led to the release of ~20% of the trapped vesicles in the 1st elution (Fig. 2d). We then compared it with a reported UV-responsive isoform42, using direct UV cleavage (Fig. S5c). We saw a progressively increasing temporal dependence compared to the NIR probe, but it resulted in a ~8% decrease in total release efficiency following 10 minutes of exposure (Fig. S5d). Overall, the comparative analysis of vesicle release efficiency demonstrates the superiority of the NIR probe over its UV-responsive counterpart. In addition, the NIR light is a less invasive approach, making it an optimal choice for isolation.
2.2.3. Vesicle Integrity and Protein Functionality
To ensure that our isolation technique preserves protein functionality, we conducted a lipid mixing assay,43–47 a pivotal test for verifying the biological activity of proteins within isolated vesicles. In this assay, liposomes were reconstituted with soluble N-ethylmaleimide sensitive factor attachment protein receptors (SNAREs), which play a central role in mediating membrane fusion – a fundamental process in various cellular functions. SNAREs consist of two types: v-SNAREs located on vesicle membranes and t-SNAREs on target membranes. They form a four-helix bundle that brings these membranes together, facilitating fusion. Our experiment involved reconstituting the neuronal/exocytotic v-SNARE vesicle-associated membrane protein VAMP2 into liposomes (final lipid to protein ratio ≈ 200:1). These liposomes also contained a fluorescence resonance energy transfer (FRET) pair of dye-labeled lipids, NBD-DOPE and Rhodamine-DOPE. In this context, the NBD signal serves as a readout for lipid-mixing kinetics. When fusion occurs, the spacing between the FRET dye pair increases, allowing us to track the NBD signal’s changes. Importantly, it is worth noting that we subjected only the control proteoliposomes to the standard ultracentrifugation for excess protein removal after reconstitution. For the other samples, liposomes were incubated with DSPE-NIR-PEG_0.1K-DB and isolated, where the excess proteins were removed during the purification stage. Part of the isolated sample was then exposed to light to cleave the functional PEG-DB component in the LN-cleaved sample (Fig. 2e).
We mixed VAMP2-containing liposomes with unlabelled (and unsorted) liposomes carrying cognate t-SNAREs at 37 °C with and without the presence of competitive inhibitor, soluble cytosolic domain v-SNAREs (CDV). The bulk fusion rate of the first 30 minutes was evaluated by fitting a linear regression. Our findings were twofold: The presence of LNs on the liposome surface significantly affected the fusion rate (Fig. 2g). Removing the LN from the liposome surface (through cleavage) brought the fusion rates closer to those observed in control samples. This was further evidenced by the marked difference in NBD fluorescence in the final readings, where LN-removed proteoliposomes exhibited the highest fusion (Fig. 2f). In all cases, the liposomes containing LNs conserved the protein functionality as evidenced by decreased fusion in the presence of CDV. In a parallel investigation, we assessed the performance of our UV-responsive isoform. Notably, we observed that prolonged UV exposure (more than 10 minutes) rendered vesicles non-functional, compromising the protein activity (Fig. S5e).
Additionally, to ensure that our technique effectively retained vesicle contents without leakage, we synthesized our 60 and 140 nm liposomes loaded with sulforhodamine B (SRB) dye as model cargo. Using single-vesicle fluorescence analysis, we assessed colocalization efficiency and SRB integrated intensity in colocalized vesicles before and after isolation (Fig. S6). This analysis confirmed that our isolation technique successfully preserved the contents of the vesicles, with the SRB dye serving as a reliable marker for the intactness of vesicle cargo throughout the isolation process.
2.3. Small Extracellular Vesicle (sEV) Isolation
We then tested our LN’s ability to isolate high-purity EVs from the cell culture medium. We introduced an additional 0.22 μm filtration step to remove cellular debris and dead cells, thereby avoiding the need for ultracentrifugation and simplifying the isolation procedure. We tested our methods on two different cell lines, a primary macrophage (Mφ) cell line and insulin-secreting beta cells. This approach served a dual purpose: to validate the adaptability of our method across different cellular models and to examine its effectiveness given the distinct sEV secretion patterns of Mφ and INS beta cells. The successful isolation of high purity sEVs from both cell types was confirmed using negative stain TEM imaging (Fig 3a & 3b).
Figure 3. sEV Isolation and Characterization from Multiple Cell Types.

a, b) TEM Images of INS-sEV derived from INS cell culture media and Mφ-sEV sourced from primary BMDM cell culture milieu. Scale Bars 100 nm. Left and right Insets: spotlight smaller and larger sEV profiles. Scale Bars 20 nm and 50 nm, respectively. c, d) NTA-derived size distribution and particle concentration charts, cross-validated with standalone DLS assessments for INS-sEV and Mφ-sEV. The red demarcation underscores the typical sEV size range. Mean±S.E.M (n=3). e, f) dSTORM visualization spotlighting tetraspanin surface markers, namely CD9 and CD81, on the isolated INS-sEV and Mφ-sEV. Scale Bar, 5 μm. The dSTORM evaluation was grounded on the identification of sEVs presenting in excess of 15 localizations of either or both tetraspanin antibodies. Insets: magnify regions representing 16 localizations for CD9 and 21 for CD81. Scale Bar 1 μm. g) Representative images elucidate the diverse tetraspanin expression profiles—single-positive (CD9+CD81− and CD9−CD81+) and double-positive (CD9+CD81+) configurations. Each line delineates the localization area of the highlighted sEVs. Scale Bar 100nm. h, i) Localization length profiles of the identified sEVs with tetraspanin markers, drawn for INS-sEV and Mφ-sEV. Insets: Pie charts showing the abundance of CD9+ (yellow), CD81+ (pink), and the double-positive CD9+CD81+ (orange) against the total detected sEVs. INS-sEV (n=2174, sEV analyzed), Mφ-sEV (n=1709, sEV analyzed).
For comparative analysis, we isolated INS-sEV samples from a 50 mL culture medium at ~50% confluence of INS cells (Fig. S7a) using a well-established ultracentrifugation protocol48 and a commonly available polymer precipitation-based commercial kit (Total exosome isolation kit, ThermoFisher). Our method showed superior sample purity, as indicated by the negative stain TEM images, which are used frequently in the field to indicate the purity and yield of isolated vesicles49–51 (Fig. S7b–d). In contrast, the polymer precipitation method exhibited higher levels of contamination due to its non-specific precipitation of a broad spectrum of particles, necessitating further purification by size exclusion chromatography. However, the precipitation method yielded a 9-fold increase in particle concentration between 60–140 nm. It’s important to note that polymer precipitation-based isolation strategies are not membrane-specific, resulting in the co-isolation of non-vesicular entities, NVEP, including larger lipoproteins, exomeres, and supermeres. which contribute to the overall particle count10,52. In addition to TEM, we tested the purity of isolated SVs using the western blot method using a supermere marker ENO1.2 We found that ENO1 is present in EVs isolated using the total exosome isolation kit but not in the EVs isolated using our LN (Fig. S7e), indicating the robustness of our method in achieving high-purity sEVs. When compared to ultracentrifugation, our samples not only exhibited higher purity but also demonstrated a 4-fold enrichment (Fig. S7f). These findings underscore the versatility and effectiveness of our nanoprobe-enhanced protocol. To further evaluate the cellular uptake and functionality of purified sEVs, we tagged them with DSPE-PEG_5K-FITC as an EV tracker and exposed them to INS cells. Our results indicate clear evidence of sEVs internalization similar to commercial kits (Fig S8), thus reinforcing the practical utility of our approach in sEV research and applications.
We used dynamic light scattering (DLS) and nanoparticle tracking analysis (NTA) to determine the size distribution of sEVs isolated from both cell lines (Fig. 3c & 3d). The consistent vesicle size across experimental replicates highlighted the reproducibility of our method. Importantly, more than 90% of these vesicles were within the 50–200 nm range, meeting the criteria for sEVs. Starting with a 50 mL volume, we obtained approximately ~107 particles per milliliter for both samples, with a predominant diameter around 100 nm. It is noteworthy that the yield from Mφ-sEVs was three times less than from INS-sEVs; the difference in yield may be due to phagocytic activity inherent to macrophages that could lead to EV reuptake. Further analysis was conducted using exosomal markers CD9 and CD81, with dSTORM single molecule localization microscopy (SMLM) (Fig. 3e & 3f). Another advantage of our LNs is their facilitation of sEV fixation, enabling biotinylated sEVs to directly adhere to avidin-functionalized slides (Fig. S5a). This feature is particularly beneficial during SMLM sample preparation, streamlining the imaging analysis process.
This analysis confirmed the trend of a reduced exosomal count in Mφ-sEV samples, aligning with the previously observed differences in yield between the two cell types. To assess vesicle size, we leveraged the capability of our method to identify localization lengths specifically for CD9 and CD81 carrying exosomes (Fig. 3g–3i). Intriguingly, these exosomal localization lengths exhibited a smaller peak diameter compared to the DLS and NTA results. However, it is noteworthy that recent studies have highlighted that DLS and NTA techniques can sometimes provide slightly larger diameter values, exhibit broader size distributions, and encompass the entire EV size population.53
Using this approach, we were able to relatively assess the size distribution contribution of single positive (CD9+CD81− and CD9−CD81+) and double-positive (CD9+CD81+) exosomes within the exosome cohort. Detailed size distribution analysis revealed that smaller vesicles were predominantly CD81+ in macrophage samples (Fig S9a), a distinction not evident in INS-sEVs (Fig S9b). Furthermore, INS-sEVs were additionally labeled using the membrane-associated dye MEMGlow560™, revealing a distinct sEV subpopulation within the expected size range that lacked both tetraspanins (Fig S9b). This observation suggests potential limitations in solely relying on affinity-based isolation strategies. Interestingly, these double-negative (CD9−CD81−) sEVs exhibited a peak >150 nm, beyond the size cutoff for the exosome size range54. Circularity studies conducted on the isolated population showed a mean circularity > 0.7 for all isolated sEVs, indicating retention of morphology55 (Fig. S9c & S9d). As a validation of our isolation technique’s ability to capture exosomes within the lower size range, we imaged anti-CD81 antibodies conjugated to 4 nm colloidal gold particles (Au-Tag) using negative stain electron microscopy. This approach successfully revealed exosomes around 30 nm in size (Fig. S9e), demonstrating our method’s capability to isolate smaller exosomes and distinguish them from lipoproteins and other non-vesicular extracellular particles prevalent in that size range.
2.4. Size-selective Vesicle Enrichment
To address the challenges in size-based separations of vesicles, we conducted experiments using our standard liposomes with hydrodynamic diameters of 60 nm and 140 nm (Fig. 4a). We established a standard curve representing the integration of 5 mol% of LN constructs with different PEG lengths (as listed in Table S1). Intriguingly, despite the increment in PEG length, we observed that the hydrodynamic diameter exhibited a saturation effect. Specifically, for the smaller 60 nm liposomes, the diameter increased by approximately +10 nm, while the larger 140 nm liposomes exhibited an increase of roughly + 20 nm (Fig. S10a). To further corroborate our findings and confirm the cleavage of the PEG-DB tether, we utilized the photosensitive DSPE-NIR-PEG_0.1K-DB probe. Following light cleavage, we observed the PEG components were removed from the liposomes, effectively restoring them to their original size (Fig.4a).
Figure 4. Size selective Enrichment of Vesicles Dependent on D-Biotin Concentration.

a) Sequential mean diameters of model liposomes with initial sizes of 60 nm and 140 nm after incubation with LN (DSPE-NIR-PEG_0.1K-DB) and subsequent cleavage by NIR light exposure. The mean diameter for each step was determined by fitting a Gaussian on DLS spectra (Fig. S10). The mean diameter was calculated by fitting a Gaussian function on the average of all DLS spectra. Mean ± S.D (n=5). b) Analysis of fold change in the release ratio of small vesicles (60 nm) to larger vesicles (140 nm) equipped with a photosensitive probe (DSPE-NIR-PEG_0.1K-DB) across a D-biotin concentration gradient ranging from 0.001 mM to 100 mM. Equal quantities of releases are highlighted by the dotted line. Inset: Release efficiencies from the first elution (E1) that underpin these calculations, with efficiency metrics extracted from baseline extruded samples that were prepared from a lipid concentration of 3 mM. Mean ± S.D (n = 3 for each concentration tier). b) DLS spectra visualizing size differentiation of liposomes contingent on D-biotin concentrations. Scale bar 25% intensity in the vertical axis for each spectrum. Mean ± S.D (n=4). c, d) NTA analysis of INS-sEV and Mφ-sEV size enrichment across select D-biotin concentrations: 0.001mM, 0.1 mM, 10mM, and 100mM. Mean ± S.D (n=3 per concentration). Graphical representations delineate yield in relation to the mean vesicle size, plotted in descending order of increasing D-biotin concentration. e) Summary plot underscores a negative correlation between D-biotin concentration and the diameter of the eluted vesicles, encompassing liposomes, INS-sEV, and Mφ-sEV. Each data point represents the global mean diameter calculated over 3 replicas of each concentration with a Lorentzian (Cauchy) fit that best correlates to the peak center. All R2 ≥ 0.9, with the sole exception of 0.001mM Mφ-sEV, which had low particle count - circled in red. f) Terminal NBD fluorescence (last 10 minutes) of lipid mixing assay with v-SNARE proteoliposomes, juxtaposing model synaptic vesicles proteoliposomes (SV) initially (1) eluted with 2.5 mM D-biotin and model Large Dense Core Vesicles (LDCV) proteoliposomes eluted with (2) NIR light using the same HCABs; model liposomes at 1:200 VAMP2/lipid composition. Mean±S.D (n=2). All relevant DLS spectra can be found in figure S10.
Next, we evaluated the possibility of size-selective release efficiency of 60 and 140 nm liposome mixture across a gradient of D-biotin concentrations, spanning from 0.1 mM to 100 mM (Fig. 4b). As expected, we observed a concentration-dependent release trend due to the variation of the number of probes inserted depending on the vesicle size (Fig. 4c). At lower D-biotin concentrations, fewer vesicles were released, whereas this release efficiency increased progressively with rising D-biotin concentrations (Fig. 4b-inset). However, the amount of smaller 60 nm liposomes released was larger, and at the highest concentration tested (100 mM), we noted an almost 2-fold enrichment compared to 140 nm liposomes (Fig. 4b). Smaller vesicles have a significantly lower number of LNs attached to them, 6-fold fewer, as illustrated in Supplementary Note 1- Table S5. This difference in probe density among vesicles of varying sizes plays a pivotal role in determining their release efficiency.
Despite the broader peaks associated with NTA, as reported in previous studies, we consistently observed that smaller EVs were preferentially released at higher D-biotin concentrations. This trend was evident in both INS-sEV and Mφ-sEV samples (Fig. 4d), with the mean diameter decreasing as the D-biotin concentration increased (Fig. 4e). However, at lower D-biotin concentrations, the number of EVs released decreased. For Mφ-sEVs, we were able to measure their sizes, but most of these measurements were near the detection limit of our instrument. Our findings highlight the potential of gentle D-biotin elution LNs for selective isolation and enrichment of specific-sized EV populations. This novel concentration-dependent vesicle release mechanism provides a versatile platform for researchers and broad applications in vesicle research. Adjusting lipid concentrations presents a viable strategy to counter potential vesicle losses during elution, facilitating effective exploration and manipulation of vesicle populations.
To showcase the flexibility of our method, we performed experiments to separate and classify model proteoliposomes that mimic synaptic vesicles (SVs) and large dense core vesicles (LDCVs) without using ultracentrifugation. We achieved this by implementing a two-step elution process. Initially, we used a 2.5 mM D-biotin solution to elute smaller vesicles. Subsequently, we applied near-infrared (NIR) light to release the larger vesicles left behind.
Following this separation, we analyzed the fusion behavior of these liposomes using our lipid mixing assay, focusing on how vesicle size influences lipid mixing kinetics (illustrated in Fig. 4f). We observed that smaller liposomes fused more quickly, with a trend showing that the most fusogenic proteoliposomes had a higher final NBD fluorescence, indicating a faster fusion rate. This pattern is consistent with findings from a previous study that sorted liposomes based on size using a DNA-brick assisted ultracentrifugation approach56. Although our study focused on the minimal fusion machinery (SNAREs) to demonstrate the concept, this platform can, in principle, be adapted to model more complex physiological conditions. For instance, it can be extended to study the interplay between membrane curvature and molecular factors governing vesicular fusion, such as Syt1 or Munc18, underpinning vesicle dynamics in neurons and other cellular processes.
2.5. Alzheimer’s disease (AD) specific markers enriched in EV Subpopulations
To further validate our size-selective isolation approach, we applied it to EVs derived from the neuroblastoma N2a cell line, employing a 0.4μm filter to allow for a larger size diversity of EVs. Following EV capture and purification, a D-biotin concentration of 2.5 mM preferentially released sEVs with mean hydrodynamic diameters of 100–150 nm (Fig 5a). A secondary NIR exposure was conducted to recover the larger EVs retained on the HCABs. As expected, the photocleavage process eluted vesicles of larger sizes, with hydrodynamic diameters between 220–350nm.
Figure 5. Photosensitive Nanoprobe to Enrich EV Subpopulation.
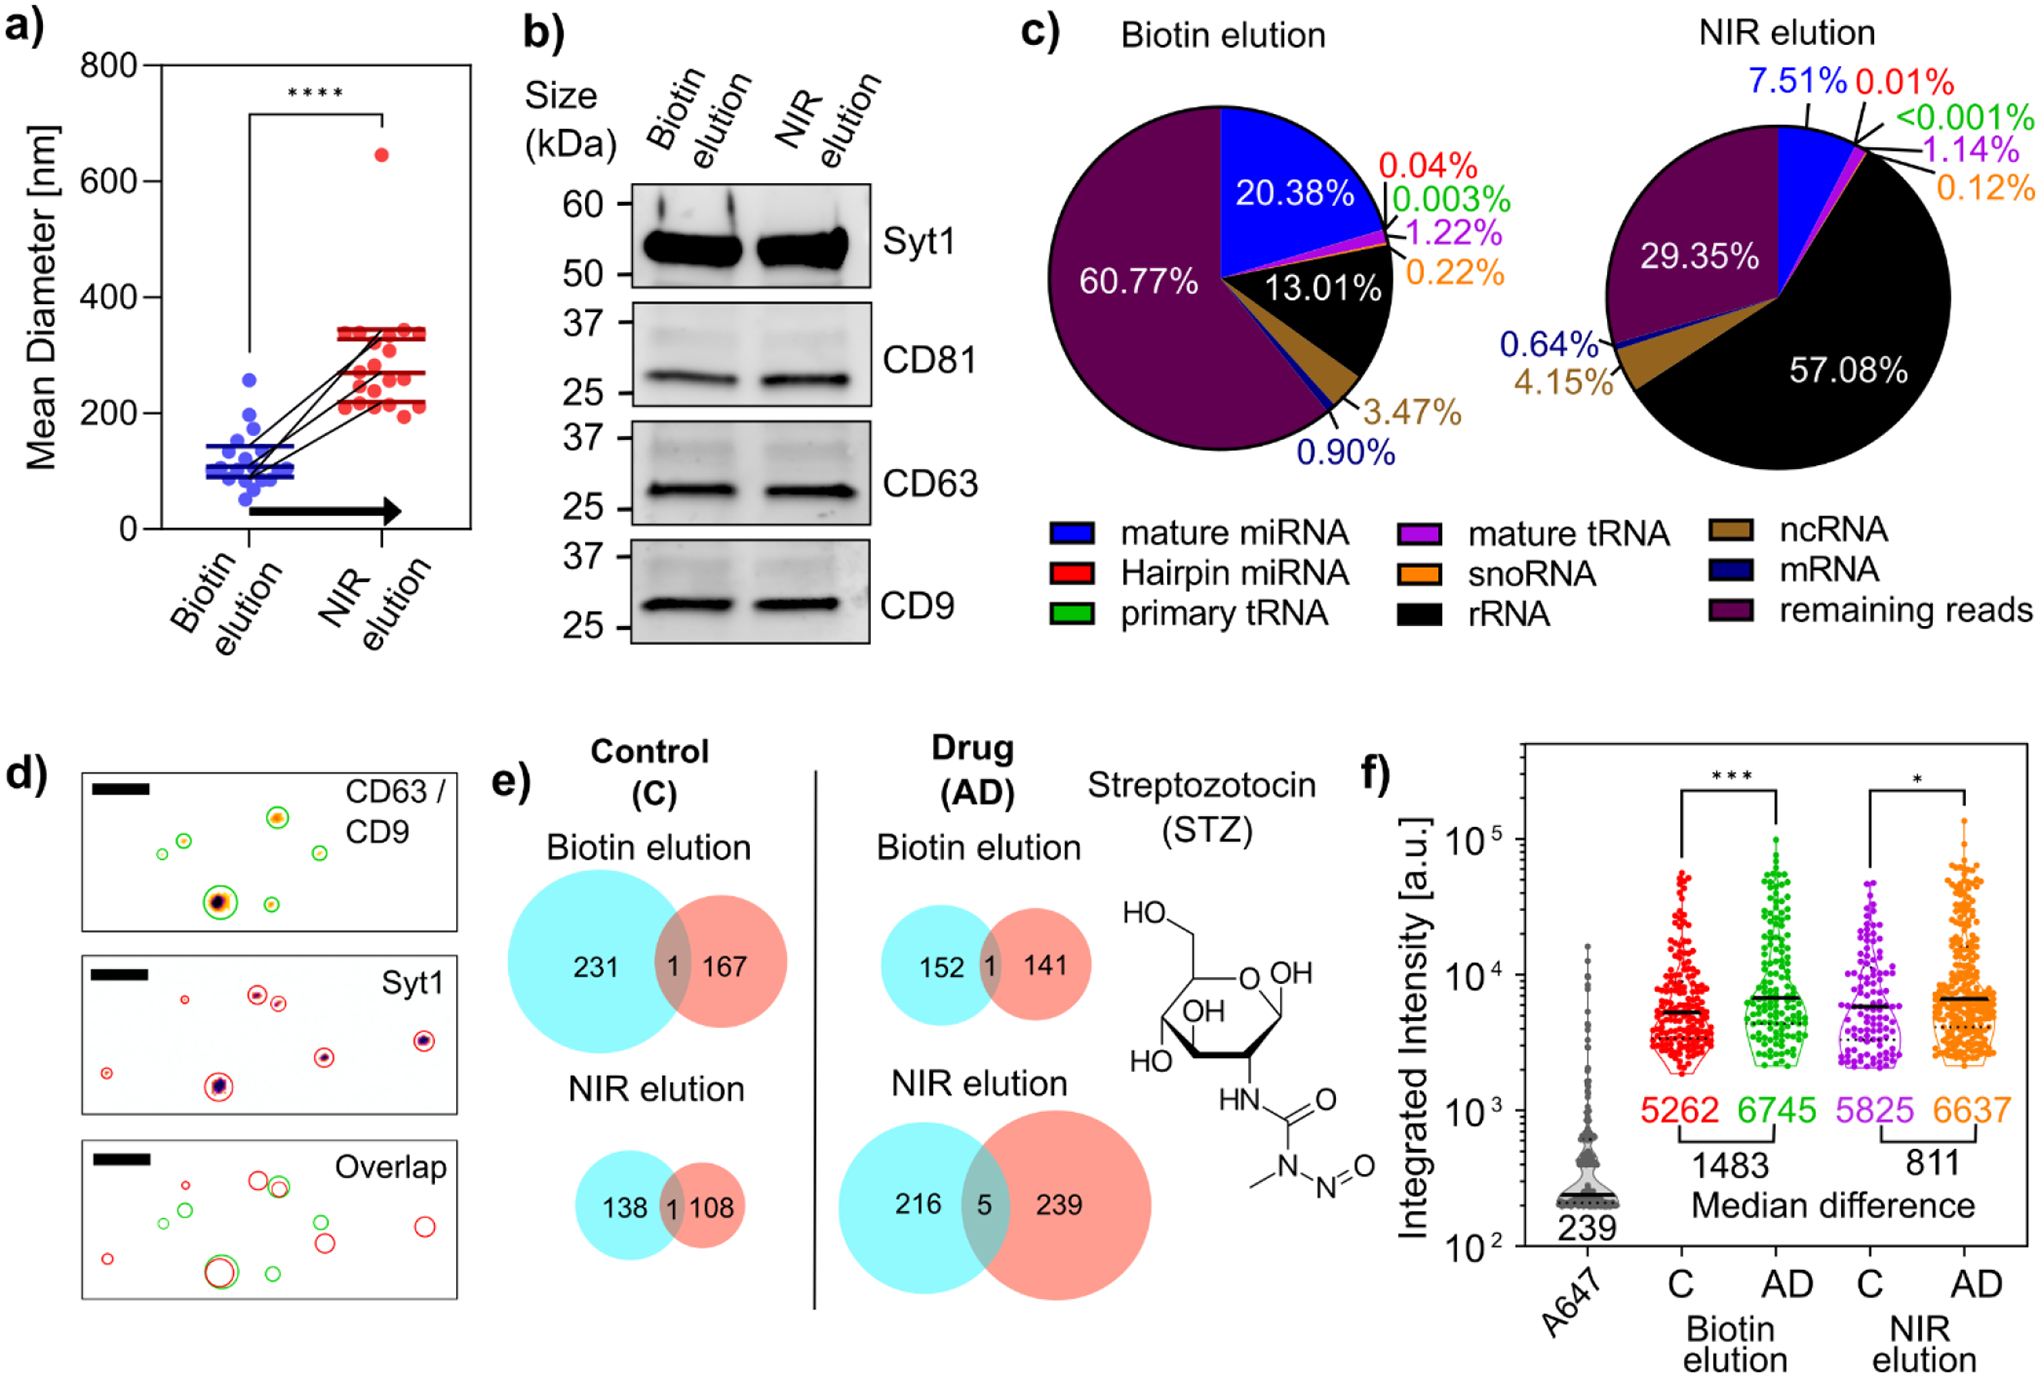
A) Hydrodynamic diameter of EVs sorted via the sequential dual elution strategy. Initially, the samples were eluted with 2.5mM D-biotin elution buffer, followed by a 10-minute exposure to NIR- light while in suspension in the buffer. Mean DLS measurements are represented by the horizontal line. (n=5). Unpaired t-test **** p ≤ 0.0001. b) Western blot analysis for exosomal markers (CD63, CD9, CD81) and synaptic protein Syt1 in D-biotin and NIR-eluted samples. c) RNA-seq-derived pie chart illustrating small-RNA read percentages: miRNA, micro-RNA; tRNA; transfer RNA; snoRNA, small nucleolar; rRNA, ribosomal RNA; ncRNA, non-coding RNA; mRNA, messenger RNA. d) Representative two-color TIRF images (inverse color map) of EVs of Syt1 and dual labeled CD63 and CD9. Green and red circles portray the EV area derived custom Mathematica code based on optimized thresholding of puncta (Fig. S11c). Merged profiles (Overlap) demonstrate overlapping puncta for Syt1 and CD63/CD9. Scale Bar 500 nm. e) Venn diagram depicting identified vesicles in each channel, including colocalized vesicles, for Control (C) and Alzheimer’s model (AD) (induced by 100 mM Streptozotocin) samples. Circle sizes indicate EV counts; 1400 vesicles were analyzed (n=2). f) Truncated violin plot of integrated intensity for Syt1-associated EVs. A647 corresponds to Alexa Fluor® 647 secondary antibody, which was used to identify the integrated fluorescent of a single fluorescent unit. The center solid line indicates the median, and the dotted line indicates the 25th and 75th percentiles. The median of each population and the median difference between control Vs. Drug for sEVs (D-biotin elution) and larger EVs (NIR elution) are listed. Two-way ANOVA multiple comparisons using Tukey’s method *p ≤ 0.05, ***p ≤ 0.001.
Western blot analysis confirmed the presence of canonical exosomal tetraspanin markers—CD63, CD9, and CD81—in both eluted samples (Fig. 5b). However, a thorough examination of the sRNA cargo revealed notable disparities in their relative abundances (Fig 5c). Specifically, the sEVs obtained via biotin elution showed a twofold increase in mature micro-RNA (miRNA) levels. In contrast, the larger EVs obtained from the NIR elution exhibited a fivefold increase in ribosomal RNA (rRNA). This difference suggests the intriguing possibility of distinct cellular origination and cargo enrichment, depending on the vesicle size. It is well-documented that rRNA is a major constituent of microvesicles, presumably due to their closer association with cellular compartments where ribosomal machinery is abundant.57,58 Conversely, mature miRNAs, which are frequently associated with post-transcriptional regulation, are a common presence in sEVs, suggesting their involvement in intercellular communication. In our EV samples, two of the most abundant miRNAs were noteworthy (Fig. S11a). MiRNA 335:5p has been linked to cancer and is known as a cancer-secreted exosomal miRNA59,60. Meanwhile, miRNA 16:5p has shown promise as a potential diagnostic marker for AD61.
We also evaluated the presence of synaptotagmin (Syt1), a synaptic protein proposed as an AD biomarker. The literature presents conflicting reports—some studies postulate elevated Syt1 levels62, especially in cerebrospinal fluid samples, while others argue the opposite63,64. A recent research study has successfully isolated exosomes from CSF, suggesting a consortium of synaptic proteins, including SYT1, as potential biomarkers65. However, many studies label their vesicles as “exosomes” without comprehensively analyzing the canonical tetraspanin markers, potentially misleading the term. To illustrate this point, we utilized AD model N2a cells induced by the neurotoxicity of streptozotocin (STZ).20–23 We exposed 100 μM STZ to N2a cells for a duration of 48 hours and isolated smaller and larger EVs. Imaging revealed the widespread presence of tetraspanin, CD9, and CD63, in conjunction with Syt1 (Fig 5d). While the western blot indicated the presence of all proteins, we observed minimal colocalization of 1–2% in the fluorescence images, which indicated two distinct EV pools, one abundant with SYT1 and the other predominantly marked by the exosome-associated canonical markers, CD9 and CD63 (Fig. 5e). After STZ administration, there was a noticeable increase in SYT1-associated EVs. Furthermore, integrated intensity evaluations revealed an SYT1 overexpression in both EV categories (Fig. 5f). Such overexpression was not observed in EVs containing CD9 and CD63 (Fig. S11b). These SYT1-rich EVs appeared to lack the exosomal markers under investigation, raising questions about the broad usage of the term ‘exosome.’ Highlighting the necessity for size-based sEV separation, our findings reveal subtle but significant differences in cargo and surface proteins that could be pivotal in disease diagnostics.
3. Conclusions
In conclusion, our photosensitive LN-based isolation method successfully demonstrated a series of significant achievements in the field of synthetic and extracellular vesicle (EV) research. Our method provides a rapid, scalable, and universally applicable approach for isolating and enriching size-specific vesicle subpopulations from biological media in under 1 hour. Our innovative 3-step (Enrichment, Purification, Isolation) technique yields high purity vesicles.66 Compared to traditional ultracentrifugation techniques, our method achieved higher recovery rates, enhancing the efficiency of EV isolation. We demonstrated the ability of our technique to isolate vesicles from a variety of biological sources, including primary macrophages, N2a neuroblastoma, and insulin-secreting beta-cell lines, highlighting its wide-ranging utility. Furthermore, we introduced a streamlined process for the direct detection of enriched EVs, utilizing ELISA techniques within 30 minutes, showcasing the platform’s capability for rapid analysis. Lastly, we achieved the separation and enrichment of vesicle populations based on specific sizes, demonstrating the method’s precision in targeting and isolating distinct EV subsets. This suite of advancements underscores the potential of our approach to significantly impact EV research, offering a more efficient, accurate, and rapid means of isolating and analyzing extracellular vesicles for a variety of applications. As the field progresses, there is a clear demand for refined and accessible isolation techniques. Our work lays the groundwork in this direction, offering both a novel approach to EV studies using photosensitive probes and paving the way for the development of user-friendly vesicle isolation kits.
4. Materials & Methods
Non-photosensitive chemistry probes were obtained from NANOCs. Photosensitive LNs were synthesized and purified in-house, see Supplementary Note 2 for synthesis and characterization details. All lipids were purchased from Avanti Polar Lipids (Table S2). All LNs, lipids, and buffer compositions are listed in Table S1–3.
4.1. Liposome and proteoliposome preparation
4.1.1. Solvent evaporation and lipid rehydration
To prepare liposomes containing 3 mM of total lipids of a specific composition (Table S3), appropriate volumes of lipid stocks (dissolved in chloroform) were mixed in a borosilicate glass disposable culture tube. The mixture was blown dry under N2 gas for at least 30 min. The resulting lipid film at the bottom of the tube was further dried for 1h in a desiccator under vacuum. Unless noted otherwise, 1 mL of Buffer A (Table S3) was added to the tube and agitated for 30 min. To test for the leakage, 10 mM sulforhodamine B (SRB, dissolved in Buffer A) was used. The glass tubes were always wrapped with aluminum foil to reduce the photobleaching of the fluorescent labels.
4.1.2. Proteoliposomes Reconstitution
v-SNARE (VAMP2) and t-SNARE used in this study were purified as described in the Supporting Information section 1.4. They were reconstituted into liposomes using rapid detergent (1% w/v Octyl-beta-Glucoside) dilution and dialysis method as described previously63–65. In short, lipids (lipid composition in Table S3) were dried to a thin film in a glass test tube using nitrogen gas and then stored under a vacuum for 1h to remove any residual chloroform. Lipids were resuspended in protein (the final protein/lipid ratio for proteoliposomes is shown in Table S3.) and buffer A with 1% w/v Octyl-beta-Glucoside (OG) detergent up to a final volume of 100 μL. Volume was increased to 300 μL with no OG buffer A and dialyzed against 25 mM HEPES, 120 mM KCl, and 1 mM DTT overnight to remove any residual detergent. The next day, 150 μL of 80% OptiPrep™ (Iodixanol in the same buffer) was mixed with the sample and then loaded into a 0.8-mL tube (Beckman Coulter), overlaid with 250 μL of 30% OptiPrep™, followed by 50 μL of HEPES buffer. Tubes were centrifuged in an SW55 rotor at 48,000 rpm for 4 h. Proteoliposomes were collected from the gradient near the buffer/30% OptiPrep™ interface. The reconstitution efficiency for both SNAREs has been previously validated to be nearly identical (50%–60%).
4.2. Lipid mixing assay
FRET-based lipid mixing experiments were conducted on a plate reader (Molecular Devices). 5 μL of v-SNARE liposomes labeled with a pair of FRET dyes (donor: NBD-DOPE, acceptor: Rhodamine-DOPE) and 45 μL of unlabeled t-SNARE liposomes (Table S3), with a total lipid concentration of 3 mM were separately heated to 37 °C and transferred to a Pierce™ 96-Well Polystyrene Plates. NBD fluorescence was monitored at emission/excitation of ~535/460 nm every 1 min for 1 hour and 40 mins. The fluorescence signal was normalized using the NBD fluorescence [% of Imax] = 100%×(It-Imin)/(Imax-Imin), where Imin was the lowest observed NBD fluorescence intensity, and Imax was the maximum NBD fluorescence intensity observed after the addition of detergent (2.5% [w/v] n-dodecylmaltoside [DM]).
4.3. Tissue culture
4.3.1. Bone marrow-derived macrophage extraction & primary culture
Primary bone marrow-derived macrophage (BMDM) cells were obtained through the bone marrow of the hind limbs in C57BL/6J mouse (JAX™) wild type (WT) mice. WT mice were first euthanized through CO2 overdose for 15 min; mice are sequentially euthanized with bone extraction immediately following the euthanasia procedure of one mouse before the euthanasia of the next. Incisions near the groin and ankle area were made to remove the skin and tissue surrounding the thighs and the hind limbs were dislocated from the ball-and-socket hip joint. Muscle was removed carefully upon the separation of the femur, tibia and fibula, and hind foot. The femur and tibia and fibula bones were immediately placed in ice cold Gibco Iscove’s Modified Dulbecco’s Medium (IMDM) (ThermoFisher) media to keep moist. Under the tissue culture hood, bones were dipped in 70% EtOH 5X then H2O 5X to sterilize and wash off excess non-bone contaminants. In a petri dish, small segments of the two ends of the femur and tibia and fibula were sectioned off with a razor blade to reveal bone marrow that was flushed out with cold IMDM through a needle and syringe. Aggregated bone marrow was separated and further passed through 40 μm mesh syringe filters into a 15 mL tube. Upon obtaining a pellet through one centrifuge spin down (300 g × 5 min), 1 mL of Ack Lysing buffer (Lonza) was added for 30 seconds to lyse red blood cells. 10 mL IMDM was used to neutralize the buffer and the sample was centrifuged to obtain the final pellet containing bone marrow-derived cells. 5 million cells were plated in one 10 cm non-TC treated dish with 10 mL IMDM, 10% ultracentrifuged exosome-free FBS, 1% Penicillin-Streptomycin, and 20 ng/mL recombinant macrophage colony-stimulating factor (M-CSF). Media with 10 ng/mL M-CSF was changed every 2–3 days with the macrophages fully differentiated and ready for experimentation on day 7. Culture media was extracted at ~50% confluence.
4.3.2. INS-1 rat insulinoma cell culture
The clonal beta-cell line 832/3, derived from the parental INS-1 rat insulinoma cells, was purchased from Millipore Sigma and cultured in complete Roswell Park Memorial Institute (RPMI) medium (Sigma Aldrich) supplemented with 10% ultracentrifuged exosome-free FBS (Sigma Aldrich), 10 mM HEPES (Sigma Aldrich), 2 mM L-Glutamine (Sigma Aldrich), 1 mM sodium pyruvate (Sigma Aldrich) and 0.05 mM beta-mercaptoethanol (Sigma Aldrich) in 5% CO2 at 37 °C. Media was changed every 2–3 days and allowed the cells to grow up to ~50% confluency to collect the media for EV isolation (Fig. S7a).
4.3.3. Neuroblastoma N2a cell culture
Neuro-2a (N2a) CCL-131™ cell line was purchased from ATCC and cultured with Dulbecco’s Modified Eagle’s Medium (DMEM) (Sigma Aldrich) supplemented with 10% exosome-free FBS, 2 mM glutamine, and 100 μg mL−1 penicillin/streptomycin (Gibco) in 5% CO2 at 37 °C. Media was changed every 2–3 days, and the cells were grown up to ~80% confluency before media collection. For the AD model, the cells were treated with 100 μM STZ for 48 h. Culture media was extracted at ~80% confluence for EV isolation.
4.4. Liposomes, proteoliposomes, and EV isolation
If not mentioned otherwise, in most experiments, 200 μL of avidin (monomeric/neutravidin) - HCAB slurry (Thermo Scientific) was pipetted into 0.8 mL centrifuge columns with 30 μm polyethylene filters (Thermo Scientific) (Fig. S5d). For larger volumes, 5 mL and 10 mL centrifuge columns were used (Thermo Scientific). Given that 4% beaded agarose is provided in a 50% slurry, 100 μL of settled resin equates to 200 μL of slurry. Buffer exchange was performed on the HCAB with Buffer A for liposome and proteoliposome isolation or PBS for EV isolation, through a series of 5 – 200 μL washes based on slurry volume. In parallel, 5% of LN (150 μM for 3 mM lipid concentration) was incubated for 1h with liposomes and proteoliposomes if not mentioned otherwise. In some cases, 1% and 3% mol/mol were tested for the micelle characterization study. For EV isolation, 100 μg of LN was added into 50 mL of culture media and incubated for 1 h. The buffer exchanged HCAB was then incubated with an LN incorporated vesicle sample and shaken for 30 minutes. In cases of EV isolation with large 50 mL sample volumes, the HCABs were left overnight to maximize vesicle capture and enrichment. Following incubation, the sample was centrifuged (150 g x 20 sec) to collect the post-capture sample, which would be used to determine the liposome trapping efficiency of the HCABs. The HCAB were prevented from drying and washed 5–10 times using the 200 μL (based on slurry volume) of relevant buffer during the purification stage based on the sample. EV samples were washed with up to 2 mL of PBS. For the elution step, to concentrate the sample, 100 μL (1/2 slurry volume) of 2.5 mM D-biotin in the buffer was pipetted into HCAB and agitated for a 2-minute incubation period. For sequential D-biotin elution, the process was repeated. For the D-biotin concentration experiments, elution buffer - buffer A or PBS with the desired D-biotin concentration was used. For light-based elution, the purified HCAB was incubated with 100 μL (1/2 slurry volume) of buffer A or PBS without D-biotin, and the column was exposed to either 840 or 365 nm lamp at 5mW/cm2 for NIR and UV, respectively. The sample was exposed to light for 10 mins, unless mentioned otherwise. The solution was centrifuged (200 g × 20 sec) to elute isolated vesicles. For reuse, the HCAB were washed with regeneration buffer containing 0.1M glycine at pH 2.8 (Thermo Scientific) and centrifuged (200 g × 15 sec) a total of 5 times, then exchanged with buffer 5 times. Note that all centrifugation steps were performed using a benchtop unit. This process has been summarized in Figure 1b.
4.5. Liposome trapping and release quantification assays
The trapping and release were evaluated using bulk fluorescence measurements obtained using a plate reader (Molecular Devices). The liposome solution was diluted from 3mM to 50 μM (60X) to allow for clearer downstream fluorescence analysis. To retain quantitative relevance, all flowthroughs, including the intermediate washes and eluted samples, were diluted 60X. The trapping efficiency [% of Max] = 100% ×((Iinitial-Ipost-capture-Ibuffer)/(Iinitial-Ibuffer)), where the Iinitial is the initial fluorescence intensity of the liposomes. Ibuffer is the intensity of the buffer and Ipost-capture is the intensity of the sample collected post-capture. For the release efficiency [% of Trapped] = 100%×((Ielute-Ibuffer)/(Iinitial-Ipost-capture-Ibuffer)) and release efficiency [% of Max] = 100%×((Ielute-Ibuffer)/(Iinitial-Ibuffer)), where Ielute is the intensity of the eluted sample. The fluorescence intensity readings were taken over 5 minutes at 20 second intervals and averaged to account for photobleaching effects.
4.6. Liposomes, proteoliposome and EV size characterization
4.6.1. Dynamic light scattering (DLS)
DLS was performed using Wyatt DynaPro Nanostar model WDPN-06. 25 μL of each elution was pipetted into a disposable cuvette. Peak radius cutoffs were at 0.5 nm and 10,000 nm. 10 acquisitions were collected at 25°C for each sample, with one acquisition captured every 10 seconds. Batch DLS with regularization processing was utilized to average repeat experiments to calculate the average hydrodynamic diameter within each sample. This allowed us to visualize the sizes of single vesicles and determine the presence of any aggregated vesicles as outliers. Samples were not diluted in this study. The raw data was obtained and fitted with GraphPad Prism.
4.6.2. Nanoparticle Tracking Analysis (NTA)
NTA was performed on a ZetaView® x30, Next Generation Nanoparticle Tracking Analyzer (Particle Metrix GmbH), equipped with a 405 nm laser and a CMOS camera. Data analysis was performed on the ZetaView software (version 8.04.04), applying a bin class width of 5 nm, a minimum brightness of 25, a minimum area of 5, a maximum area of 1000, and a trace length of 15. First, the device was first calibrated with polystyrene beads (Sigma-Aldrich) diluted by 1:500,000 (v/v) at a concentration of ~100 particles per frame. For the measurements, the shutter was set to 150, the sensitivity to 85, and the frame rate to 30. EV samples were diluted 1:10 (v/v) in PBS for the measurements. The raw data was plotted and fitted with GraphPad Prism.
4.6.3. DLS and NTA size data analysis
For both DLS and NTA, the experimental replicates (3–5) were first averaged and fitted using either a Gaussian function G(x) or a Lorentzian L(x) based on the presence or absence of trailing end of the distribution and were verified with R-squared value.
where ‘a’ is the amplitude or peak intensity of the curve, ‘b’ is the mean diameter where the peak occurs, and ‘c’ is the standard deviation which controls the width of the bell curve.
where a is the amplitude or peak intensity of the curve, ‘b’ is the center of the, and c is the standard deviation that controls the width of the bell curve. From this equation, we also calculated the polydispersity index, a measure of size heterogeneity in the sample, by squaring the ratio of standard deviation to mean size .
4.7. Single-molecule localization microscopy (SMLM)
SMLM of EVs were obtained using a temperature-controlled Nanoimager S Mark II microscope from ONI (Oxford Nanoimaging, Oxford, UK) equipped with a 100x, 1.4NA oil immersion objective, an XYZ closed-loop piezo 736 stage, and 405 nm/150 mW, 473 nm/1 W, 560 nm/1 W, 640 nm/1 W lasers, as well as dual/triple emission channels split at 640 / and 555 nm. For sample preparation, we used a manufacturer’s microfluidic slide coated with avidin. The sEVs were prelabelled with antibodies for CD9 and CD81, as mentioned in supporting information section 1.2. The samples were incubated in the channels for 20 minutes and washed with PBS before imaging. Two-channel (647 and 488 nm) dSTORM data (5000 frames per channel) or three channels (2000 frames per channel) (647, 555, and 488 nm) were acquired sequentially at 30 Hertz in total internal reflection fluorescence (TIRF) mode. Two colors were used for Mφ-sEVs, and three colors were used for INS-sEVs with an additional label using the membrane-associated dye MEMGlow560™. Before each imaging session, bead slide calibration was performed to align fluorescent channels, achieving a channel mapping precision smaller than 12 nm. Single-molecule data was filtered using NimOS (Version 1.18.3, ONI) based on the point spread function shape, photon count, and localization precision to minimize background noise and remove low-precision and non-specific co-localization. All pictures were analyzed using algorithms developed by ONI via their CODI website platform (https://alto.codi.bio/).
4.8. Single vesicle fluorescence microscopy
A custom TIRF microscopy, previously described65,66 - Nikon inverted microscope equipped with three laser lines (488, 532, and 633 nm), a Photometrics DV2 dual view, and an Andor EMCCD digital camera was used for single vesicle fluorescence imaging. Two fluorophore channels were used based on the experiment; FITC and MEMGlow647™ were performed in the 488 and 647 nm channel, SRB and Atto-647N-PE were performed in the 555 and 647 nm channel; CD9/CD63 labeled with Alexa Fluor 488 and Syt1 labeled with Alexa Fluor 647 were performed in 488 and 647 nm channel. For all measurements, images were obtained at 512 × 512 pixels with a dynamic range of 16-bit grayscale. The exposure time was set to 150 ms in both channels. Images were converted to TIFF using FIJI67 and analyzed with a custom Wolfram Mathematica algorithm. The flowchart in figure S11c describes the data analysis pipeline. All colocalization efficiencies were computed using the identified vesicles in each channel.
4.9. Scanning-electron microscopy (SEM)
Samples were fixed in a 2% EMS-quality paraformaldehyde aqueous solution and washed twice with 1x PBS or Buffer A, based on the EV or liposome sample, respectively. The agarose beads with vesicles were used within 7 days of cell culture media extraction. All samples were dehydrated in a series of increasing ethanol concentrations (10, 20, 30, 50, 70, 90, and 100%), following which, they were transferred onto conductive double-sided carbon tape fixed on an SEM stage and dried. Prior to imaging, the samples were thoroughly blow dried under a fume hood. A Hitachi SU8230 SEM was used for all the imaging under low beam energies (1.0–3.0 kV).
4.10. Negative stain electron microscopy
For preparing the negative stain EM grids of sEVs and Au-labelled sEVs (CD81 was labeled – see Supporting information), 5 μL of the isolated samples (in PBS) were directly applied to a glow discharged Carbon Type-B, 400 mesh, Copper grid (Ted Pella). After 1-minute incubation on the grid, the samples were quickly washed with 5 μL of 2% (w/v) uranyl formate solution, followed by staining with another 5 μL of 2% uranyl formate for 1 minute. The grids were imaged using an 80 kV JEOL JEM-1400Plus microscope equipped with a bottom-mount 4 k × 3 k charge-coupled device camera (Advanced Microscopy Technologies).
4.11. RNA isolation and sequencing
4.11.1. RNA isolation from EVs
The Total exosome RNA and protein isolation kit (Invitrogen) was utilized for recovery of RNA from both NIR and biotin eluted N2a EVs. Two hundred microliter of each sample (brought up to volume with PBS if necessary) was combined with 205 μL of 2× denaturing solution, vortexed to lyse, and then incubated on ice for 5 min. After incubation, 410 μL of Acid-Phenol: Chloroform was added to the mixture and vortexed for 30–60 s to mix. Samples were then centrifuged for 5 min at 10000 g at room temperature to separate the mixture into aqueous and organic phases. Once centrifugation was complete, the aqueous (upper) phase was carefully removed without disturbing the lower phase or the interphase and transferred to a fresh tube. One point twenty-five volumes of 100% EtOH was added to the aqueous phase for each sample then vortexed to mix. About 700 μL of volume was placed onto spin column in a collection tube then spun at 10000 g for 15 s to move the sample through the filter cartridge. Samples were then washed once with 700 μL Wash Solution 1 × and 2 × with 500 μL wash solution 2/3 (centrifuged at 10000 g for 15 s for each wash). After washing, filter was dried by spinning for an additional 1 min at 10000 g. The filter cartridge was transferred into a fresh collection tube and 50 μL of preheated (95 °C) nuclease-free water was applied to the center of the filter. Samples were centrifuged for 30 s at 10000 g to recover the RNA, then a second 50 μL volume of preheated (95 °C) nuclease-free water was applied to the center of the filter and centrifuged for 30 s at 10000 g. After the second spin, the eluate containing the RNA was collected and stored at −20 °C.
4.11.2. miRNA Seq quality control
RNA quality was determined by estimating the A260/A280 and A260/A230 ratios by nanodrop. RNA was run on the Agilent Bioanalyzer gel or Agilent Fragment Analyzer.
4.11.3. miRNA Seq library prep
Library preparation was performed using the Qiagen QIAseq miRNA Library Kit. 5uL of RNA eluate was taken for each sample. Adapters were ligated sequentially to the 3’ and 5’ ends of miRNAs prior to cDNA synthesis with UMI assignment, cDNA cleanup, amplification, and final library cleanup. The library was run on the Agilent Tapestation and size selection was performed if there was excess adapter dimer. The library was then quantified by qRT-PCR using a commercially available kit (KAPA Biosystems).
4.11.4. Flow cell preparation and sequencing
Sample concentrations were normalized to 1.2 nM and loaded onto an Illumina NovaSeq flow cell at a concentration that yields 5–10 million passing filter clusters per sample. Samples were sequenced using 100 bp paired-end sequencing on an Illumina NovaSeq according to Illumina protocols. The 10 bp unique dual index was read during additional sequencing reads that automatically followed the completion of read 1. Data generated during sequencing runs were simultaneously transferred to the YCGA high-performance computing cluster. A positive control (prepared bacteriophage Phi X library) provided by Illumina was spiked into every lane at a concentration of 0.3% to monitor sequencing quality in real time.
4.11.5. Data analysis and storage
Signal intensities were converted to individual base calls during a run using the system’s Real Time Analysis (RTA) software. Base calls were transferred from the machine’s dedicated personal computer to the Yale High Performance Computing cluster via a 1 Gigabit network mount for downstream analysis. Primary analysis - sample de-multiplexing and alignment to the human genome - was performed using Illumina’s CASAVA 1.8.2 software suite. The data was returned if the sample error rate was less than 2% and the distribution of reads per sample in a lane was within reasonable tolerance.
4.12. Western Blot
EV samples were lysed with electrophoresis (Laemmli) sample buffer and boiled the mixture at 95–100 °C for 5 min. Proteins were separated by the SDS/PAGE method and performed western blots based on the Biorad western blot protocol. The blots were stained with antibodies depending on the protein analyzed and incubated overnight. The antibodies used, and the dilution can be found in Table S4. The blot was developed with ECL western blot substrate.
4.13. Statistics and reproducibility
Data were represented as the means ± SEM or mean ± SD, mentioned in all appropriate cases. Unpaired Student’s t-test was used to analyze data with only two sets. Two-way analysis of variance (ANOVA) was performed to determine whether there was a significant difference between more than two datasets, following Tukey’s method, using GraphPad Prism 6.0. Group differences at the level of P < 0.05 were considered statistically significant. Asterisk (*) represented p ≤ 0.05; double asterisk (**) represented p ≤ 0.01; triple asterisk (***) represented p ≤ 0.001; quadruple asterisk (****) represented p ≤ 0.0001.
Supplementary Material
Acknowledgments
We thank WM Keck Biotechnology Resource Laboratory at the Yale School of Medicine for their assistance with the NTA. We thank the Yale Center for Genome Analysis (YCGA) for RNA sequencing.
Funding
Sathish Ramakrishnan is supported by Yale startup grant and P30 DK045735 (NIH), Themis Kyriakides is supported by R01HL157491 (NIH), and Roshan Gunasekara is supported by UL1 TR001863
Footnotes
Supporting Information
Supporting Information is available from the Wiley Online Library or the corresponding authors.
Conflict of Interest
J.S.W, S. T., A. R, T. R. K., R. W. G, and S.R are inventors on patent applications related to the photosensitive LN composition and the size-enriched sorting of native vesicles. The authors declare no other competing interests.
Data Availability
The data supporting this study’s findings are available from the corresponding author upon reasonable request. We have also submitted all relevant data to the EV-TRACK knowledge base (EV-TRACK ID: EV240006)68.
References
- (1).Zhang Q; Higginbotham JN; Jeppesen DK; Yang Y-P; Li W; McKinley ET; Graves-Deal R; Ping J; Britain CM; Dorsett KA; Hartman CL; Ford DA; Allen RM; Vickers KC; Liu Q; Franklin JL; Bellis SL; Coffey RJ Transfer of Functional Cargo in Exomeres. Cell Reports 2019, 27 (3), 940–954.e6. 10.1016/j.celrep.2019.01.009. [DOI] [PMC free article] [PubMed] [Google Scholar]
- (2).Zhang Q; Jeppesen DK; Higginbotham JN; Graves-Deal R; Trinh VQ; Ramirez MA; Sohn Y; Neininger AC; Taneja N; McKinley ET; Niitsu H; Cao Z; Evans R; Glass SE; Ray KC; Fissell WH; Hill S; Rose KL; Huh WJ; Washington MK; Ayers GD; Burnette DT; Sharma S; Rome LH; Franklin JL; Lee YA; Liu Q; Coffey RJ Supermeres Are Functional Extracellular Nanoparticles Replete with Disease Biomarkers and Therapeutic Targets. Nat Cell Biol 2021, 23 (12), 1240–1254. 10.1038/s41556-021-00805-8. [DOI] [PMC free article] [PubMed] [Google Scholar]
- (3).Mathieu M; Martin-Jaular L; Lavieu G; Théry C Specificities of Secretion and Uptake of Exosomes and Other Extracellular Vesicles for Cell-to-Cell Communication. Nat Cell Biol 2019, 21 (1), 9–17. 10.1038/s41556-018-0250-9. [DOI] [PubMed] [Google Scholar]
- (4).van Niel G; D’Angelo G; Raposo G Shedding Light on the Cell Biology of Extracellular Vesicles. Nat Rev Mol Cell Biol 2018, 19 (4), 213–228. 10.1038/nrm.2017.125. [DOI] [PubMed] [Google Scholar]
- (5).Jeppesen DK; Fenix AM; Franklin JL; Higginbotham JN; Zhang Q; Zimmerman LJ; Liebler DC; Ping J; Liu Q; Evans R; Fissell WH; Patton JG; Rome LH; Burnette DT; Coffey RJ Reassessment of Exosome Composition. Cell 2019, 177 (2), 428–445.e18. 10.1016/j.cell.2019.02.029. [DOI] [PMC free article] [PubMed] [Google Scholar]
- (6).Clancy JW; Boomgarden AC; D’Souza-Schorey C Profiling and Promise of Supermeres. Nat Cell Biol 2021, 23 (12), 1217–1219. 10.1038/s41556-021-00808-5. [DOI] [PMC free article] [PubMed] [Google Scholar]
- (7).Mathieu M; Névo N; Jouve M; Valenzuela JI; Maurin M; Verweij FJ; Palmulli R; Lankar D; Dingli F; Loew D; Rubinstein E; Boncompain G; Perez F; Théry C Specificities of Exosome versus Small Ectosome Secretion Revealed by Live Intracellular Tracking of CD63 and CD9 | Nature Communications. Nature Communications 2021, 12 (1), 4389. 10.1038/s41467-021-24384-2. [DOI] [PMC free article] [PubMed] [Google Scholar]
- (8).Kowal J; Arras G; Colombo M; Jouve M; Morath JP; Primdal-Bengtson B; Dingli F; Loew D; Tkach M; Théry C Proteomic Comparison Defines Novel Markers to Characterize Heterogeneous Populations of Extracellular Vesicle Subtypes. Proceedings of the National Academy of Sciences 2016, 113 (8), E968–E977. 10.1073/pnas.1521230113. [DOI] [PMC free article] [PubMed] [Google Scholar]
- (9).Zhang H; Freitas D; Kim HS; Fabijanic K; Li Z; Chen H; Mark MT; Molina H; Martin AB; Bojmar L; Fang J; Rampersaud S; Hoshino A; Matei I; Kenific CM; Nakajima M; Mutvei AP; Sansone P; Buehring W; Wang H; Jimenez JP; Cohen-Gould L; Paknejad N; Brendel M; Manova-Todorova K; Magalhães A; Ferreira JA; Osório H; Silva AM; Massey A; Cubillos-Ruiz JR; Galletti G; Giannakakou P; Cuervo AM; Blenis J; Schwartz R; Brady MS; Peinado H; Bromberg J; Matsui H; Reis CA; Lyden D Identification of Distinct Nanoparticles and Subsets of Extracellular Vesicles by Asymmetric Flow Field-Flow Fractionation. Nat Cell Biol 2018, 20 (3), 332–343. 10.1038/s41556-018-0040-4. [DOI] [PMC free article] [PubMed] [Google Scholar]
- (10).Kashkanova AD; Blessing M; Reischke M; Baur J-O; Baur AS; Sandoghdar V; Van Deun J Label-Free Discrimination of Extracellular Vesicles from Large Lipoproteins. Journal of Extracellular Vesicles 2023, 12 (8), 12348. 10.1002/jev2.12348. [DOI] [PMC free article] [PubMed] [Google Scholar]
- (11).Kowal J; Arras G; Colombo M; Jouve M; Morath JP; Primdal-Bengtson B; Dingli F; Loew D; Tkach M; Théry C Proteomic Comparison Defines Novel Markers to Characterize Heterogeneous Populations of Extracellular Vesicle Subtypes. Proceedings of the National Academy of Sciences 2016, 113 (8), E968–E977. 10.1073/pnas.1521230113. [DOI] [PMC free article] [PubMed] [Google Scholar]
- (12).Park J; Park JS; Huang C-H; Jo A; Cook K; Wang R; Lin H-Y; Van Deun J; Li H; Min J; Wang L; Yoon G; Carter BS; Balaj L; Choi G-S; Castro CM; Weissleder R; Lee H An Integrated Magneto-Electrochemical Device for the Rapid Profiling of Tumour Extracellular Vesicles from Blood Plasma. Nat Biomed Eng 2021, 5 (7), 678–689. 10.1038/s41551-021-00752-7. [DOI] [PMC free article] [PubMed] [Google Scholar]
- (13).Zhang Q; Jeppesen DK; Higginbotham JN; Franklin JL; Coffey RJ Comprehensive Isolation of Extracellular Vesicles and Nanoparticles. Nat Protoc 2023, 18 (5), 1462–1487. 10.1038/s41596-023-00811-0. [DOI] [PMC free article] [PubMed] [Google Scholar]
- (14).Cheng L; Hill AF Therapeutically Harnessing Extracellular Vesicles. Nat Rev Drug Discov 2022, 21 (5), 379–399. 10.1038/s41573-022-00410-w. [DOI] [PubMed] [Google Scholar]
- (15).Liu H-Y; Kumar R; Zhong C; Gorji S; Paniushkina L; Masood R; Wittel UA; Fuchs H; Nazarenko I; Hirtz M Rapid Capture of Cancer Extracellular Vesicles by Lipid Patch Microarrays. Advanced Materials 2021, 33 (35), 2008493. 10.1002/adma.202008493. [DOI] [PMC free article] [PubMed] [Google Scholar]
- (16).Pan W-L; Feng J-J; Luo T-T; Tan Y; Situ B; Nieuwland R; Guo J-Y; Liu C-C; Zhang H; Chen J; Zhang W-H; Chen J; Chen X-H; Chen H-Y; Zheng L; Chen J-X; Li B Rapid and Efficient Isolation Platform for Plasma Extracellular Vesicles: EV-FISHER. Journal of Extracellular Vesicles 2022, 11 (11), e12281. 10.1002/jev2.12281. [DOI] [PMC free article] [PubMed] [Google Scholar]
- (17).Marvar J; Kumari A; Onukwugha N-E; Achreja A; Meurs N; Animasahun O; Roy J; Paserba M; Raju KS; Fortna S; Ramnath N; Nagrath D; Kang Y-T; Nagrath S Porous PDMS-Based Microsystem (ExoSponge) for Rapid Cost-Effective Tumor Extracellular Vesicle Isolation and Mass Spectrometry-Based Metabolic Biomarker Screening. Advanced Materials Technologies 2023, 8 (9), 2201937. 10.1002/admt.202201937. [DOI] [Google Scholar]
- (18).Wan Y; Cheng G; Liu X; Hao S-J; Nisic M; Zhu C-D; Xia Y-Q; Li W-Q; Wang Z-G; Zhang W-L; Rice SJ; Sebastian A; Albert I; Belani CP; Zheng S-Y Rapid Magnetic Isolation of Extracellular Vesicles via Lipid-Based Nanoprobes. Nat Biomed Eng 2017, 1 (4), 1–11. 10.1038/s41551-017-0058. [DOI] [PMC free article] [PubMed] [Google Scholar]
- (19).Liu X; Zong Z; Xing M; Liu X; Li J; Liu D pH-Mediated Clustering of Exosomes: Breaking Through the Size Limit of Exosome Analysis in Conventional Flow Cytometry. Nano Lett. 2021, 21 (20), 8817–8823. 10.1021/acs.nanolett.1c03211. [DOI] [PubMed] [Google Scholar]
- (20).Biswas J; Goswami P; Gupta S; Joshi N; Nath C; Singh S Streptozotocin Induced Neurotoxicity Involves Alzheimer’s Related Pathological Markers: A Study on N2A Cells. Mol Neurobiol 2016, 53 (5), 2794–2806. 10.1007/s12035-015-9144-z. [DOI] [PubMed] [Google Scholar]
- (21).Chen L; Feng P; Peng A; Qiu X; Lai W; Zhang L; Li W Protective Effects of Isoquercitrin on Streptozotocin-Induced Neurotoxicity. Journal of Cellular and Molecular Medicine 2020, 24 (18), 10458–10467. 10.1111/jcmm.15658. [DOI] [PMC free article] [PubMed] [Google Scholar]
- (22).Park J; Won J; Seo J; Yeo H-G; Kim K; Kim YG; Jeon C-Y; Kam MK; Kim Y-H; Huh J-W; Lee S-R; Lee D-S; Lee Y Streptozotocin Induces Alzheimer’s Disease-Like Pathology in Hippocampal Neuronal Cells via CDK5/Drp1-Mediated Mitochondrial Fragmentation. Frontiers in Cellular Neuroscience 2020, 14. [DOI] [PMC free article] [PubMed] [Google Scholar]
- (23).Kadhim HJ; Al-Mumen H; Nahi HH; Hamidi SM Streptozotocin-Induced Alzheimer’s Disease Investigation by One-Dimensional Plasmonic Grating Chip. Sci Rep 2022, 12 (1), 21878. 10.1038/s41598-022-26607-y. [DOI] [PMC free article] [PubMed] [Google Scholar]
- (24).Shao H; Chung J; Lee K; Balaj L; Min C; Carter BS; Hochberg FH; Breakefield XO; Lee H; Weissleder R Chip-Based Analysis of Exosomal mRNA Mediating Drug Resistance in Glioblastoma. Nat Commun 2015, 6 (1), 6999. 10.1038/ncomms7999. [DOI] [PMC free article] [PubMed] [Google Scholar]
- (25).Zhang K; Yue Y; Wu S; Liu W; Shi J; Zhang Z Rapid Capture and Nondestructive Release of Extracellular Vesicles Using Aptamer-Based Magnetic Isolation. ACS Sens. 2019, 4 (5), 1245–1251. 10.1021/acssensors.9b00060. [DOI] [PubMed] [Google Scholar]
- (26).Varga Z; Mihály J; Berényi Sz.; Bóta A Structural Characterization of the Poly(Ethylene Glycol) Layer of Sterically Stabilized Liposomes by Means of FTIR Spectroscopy. European Polymer Journal 2013, 49 (9), 2415–2421. 10.1016/j.eurpolymj.2013.02.025. [DOI] [Google Scholar]
- (27).Hanwell MD; Curtis DE; Lonie DC; Vandermeersch T; Zurek E; Hutchison GR Avogadro: An Advanced Semantic Chemical Editor, Visualization, and Analysis Platform. Journal of Cheminformatics 2012, 4 (1), 17. 10.1186/1758-2946-4-17. [DOI] [PMC free article] [PubMed] [Google Scholar]
- (28).Sun F; Adrian M; Beztsinna N; van den Dikkenberg JB; Maas-Bakker RF; van Hasselt PM; van Steenbergen MJ; Su X; Kapitein LC; Hennink WE; van Nostrum CF Influence of PEGylation of Vitamin-K-Loaded Mixed Micelles on the Uptake by and Transport through Caco-2 Cells. Mol. Pharmaceutics 2018, 15 (9), 3786–3795. 10.1021/acs.molpharmaceut.8b00258. [DOI] [PMC free article] [PubMed] [Google Scholar]
- (29).Kohanski RA; Daniel Lane M [20] Monovalent Avidin Affinity Columns. In Methods in Enzymology; Wilchek M, Bayer EA, Eds.; Avidin-Biotin Technology; Academic Press, 1990; Vol. 184, pp 194–200. 10.1016/0076-6879(90)84274-K. [DOI] [PubMed] [Google Scholar]
- (30).Janolino VG; Fontecha J; Swaisgood HE A Spectrophotometric Assay for Biotinbinding Sites of Immobilized Avidin. Appl Biochem Biotechnol 1996, 56 (1), 1–7. 10.1007/BF02787865. [DOI] [Google Scholar]
- (31).Wan Y; Wang L; Zhu C; Zheng Q; Wang G; Tong J; Fang Y; Xia Y; Cheng G; He X; Zheng S-Y Aptamer-Conjugated Extracellular Nanovesicles for Targeted Drug Delivery. Cancer Res 2018, 78 (3), 798–808. 10.1158/0008-5472.CAN-17-2880. [DOI] [PMC free article] [PubMed] [Google Scholar]
- (32).Wan Y; Maurer M; He H-Z; Xia Y-Q; Hao S-J; Zhang W-L; S. Yee N; Zheng S-Y Enrichment of Extracellular Vesicles with Lipid Nanoprobe Functionalized Nanostructured Silica. Lab on a Chip 2019, 19 (14), 2346–2355. 10.1039/C8LC01359D. [DOI] [PMC free article] [PubMed] [Google Scholar]
- (33).Vabbilisetty P; Boron M; Nie H; Ozhegov E; Sun X-L Chemical Reactive Anchoring Lipids with Different Performance for Cell Surface Re-Engineering Application. ACS Omega 2018, 3 (2), 1589–1599. 10.1021/acsomega.7b01886. [DOI] [PMC free article] [PubMed] [Google Scholar]
- (34).Li J; Huang J; Lyu Y; Huang J; Jiang Y; Xie C; Pu K Photoactivatable Organic Semiconducting Pro-Nanoenzymes. J. Am. Chem. Soc 2019, 141 (9), 4073–4079. 10.1021/jacs.8b13507. [DOI] [PubMed] [Google Scholar]
- (35).Zhou H; Liao Y; Han X; Chen DS; Hong X; Zhou K; Jiang X; Xiao Y; Shi J ROS-Responsive Nanoparticle Delivery of mRNA and Photosensitizer for Combinatorial Cancer Therapy. Nano Lett. 2023, 23 (9), 3661–3668. 10.1021/acs.nanolett.2c03784. [DOI] [PubMed] [Google Scholar]
- (36).Duosiken D; Yang R; Dai Y; Marfavi Z; Lv Q; Li H; Sun K; Tao K Near-Infrared Light-Excited Reactive Oxygen Species Generation by Thulium Oxide Nanoparticles. J. Am. Chem. Soc 2022, 144 (6), 2455–2459. 10.1021/jacs.1c11704. [DOI] [PubMed] [Google Scholar]
- (37).Lu M; Xing H; Shao W; Zhang T; Zhang M; Wang Y; Li F; Weng Y; Zheng A; Huang Y; Liang X-J Photoactivatable Silencing Extracellular Vesicle (PASEV) Sensitizes Cancer Immunotherapy. Advanced Materials 2022, 34 (35), 2204765. 10.1002/adma.202204765. [DOI] [PubMed] [Google Scholar]
- (38).Qin Y; Chen L-J; Dong F; Jiang S-T; Yin G-Q; Li X; Tian Y; Yang H-B Light-Controlled Generation of Singlet Oxygen within a Discrete Dual-Stage Metallacycle for Cancer Therapy. J. Am. Chem. Soc 2019, 141 (22), 8943–8950. 10.1021/jacs.9b02726. [DOI] [PubMed] [Google Scholar]
- (39).Golovynska I; Golovynskyi S; Qu J Comparing the Impact of NIR, Visible and UV Light on ROS Upregulation via Photoacceptors of Mitochondrial Complexes in Normal, Immune and Cancer Cells. Photochemistry and Photobiology 2023, 99 (1), 106–119. 10.1111/php.13661. [DOI] [PubMed] [Google Scholar]
- (40).Jockusch S; Turro NJ; Thompson EK; Gouterman M; Callis JB; Khalil GE Singlet Molecular Oxygen by Direct Excitation. Photochem Photobiol Sci 2008, 7 (2), 235–239. 10.1039/b714286b. [DOI] [PubMed] [Google Scholar]
- (41).Kochevar IE Singlet Oxygen Signaling: From Intimate to Global. Science’s STKE 2004, 2004 (221), pe7–pe7. 10.1126/stke.2212004pe7. [DOI] [PubMed] [Google Scholar]
- (42).Yamahira S; Misawa R; Kosaka T; Tan M; Izuta S; Yamashita H; Heike Y; Okamoto A; Nagamune T; Yamaguchi S Photoactivatable Materials for Versatile Single-Cell Patterning Based on the Photocaging of Cell-Anchoring Moieties through Lipid Self-Assembly. J. Am. Chem. Soc 2022, 144 (29), 13154–13162. 10.1021/jacs.2c02949. [DOI] [PubMed] [Google Scholar]
- (43).Park Y; Vennekate W; Yavuz H; Preobraschenski J; Hernandez JM; Riedel D; Walla PJ; Jahn R α-SNAP Interferes with the Zippering of the SNARE Protein Membrane Fusion Machinery. Journal of Biological Chemistry 2014, 289 (23), 16326–16335. 10.1074/jbc.M114.556803. [DOI] [PMC free article] [PubMed] [Google Scholar]
- (44).Panda A; Giska F; Duncan AL; Welch AJ; Brown C; McAllister R; Hariharan P; Goder JND; Coleman J; Ramakrishnan S; Pincet F; Guan L; Krishnakumar S; Rothman JE; Gupta K Direct Determination of Oligomeric Organization of Integral Membrane Proteins and Lipids from Intact Customizable Bilayer. Nat Methods 2023, 20 (6), 891–897. 10.1038/s41592-023-01864-5. [DOI] [PMC free article] [PubMed] [Google Scholar]
- (45).Liu F; He R; Xu X; Zhu M; Yu H; Liu Y Munc18c Accelerates SNARE-Dependent Membrane Fusion in the Presence of Regulatory Proteins α-SNAP and NSF. Journal of Biological Chemistry 2024, 105782. 10.1016/j.jbc.2024.105782. [DOI] [PMC free article] [PubMed] [Google Scholar]
- (46).Wang S; Liu Y; Crisman L; Wan C; Miller J; Yu H; Shen J Genetic Evidence for an Inhibitory Role of Tomosyn in Insulin-Stimulated GLUT4 Exocytosis. Traffic 2020, 21 (10), 636–646. 10.1111/tra.12760. [DOI] [PMC free article] [PubMed] [Google Scholar]
- (47).Liu F; He R; Xu X; Zhu M; Yu H; Liu Y Munc18c Accelerates SNARE-Dependent Membrane Fusion in the Presence of Regulatory Proteins α-SNAP and NSF. Journal of Biological Chemistry 2024, 105782. 10.1016/j.jbc.2024.105782. [DOI] [PMC free article] [PubMed] [Google Scholar]
- (48).Chhoy P; Brown CW; Amante JJ; Mercurio AM Protocol for the Separation of Extracellular Vesicles by Ultracentrifugation from in Vitro Cell Culture Models. STAR Protocols 2021, 2 (1), 100303. 10.1016/j.xpro.2021.100303. [DOI] [PMC free article] [PubMed] [Google Scholar]
- (49).Bradberry MM; Mishra S; Zhang Z; Wu L; McKetney JM; Vestling MM; Coon JJ; Chapman ER Rapid and Gentle Immunopurification of Brain Synaptic Vesicles. J. Neurosci 2022, 42 (17), 3512–3522. 10.1523/JNEUROSCI.2521-21.2022. [DOI] [PMC free article] [PubMed] [Google Scholar]
- (50).Chantranupong L; Saulnier JL; Wang W; Jones DR; Pacold ME; Sabatini BL Rapid Purification and Metabolomic Profiling of Synaptic Vesicles from Mammalian Brain. eLife 2020, 9, e59699. 10.7554/eLife.59699. [DOI] [PMC free article] [PubMed] [Google Scholar]
- (51).Ahmed S; Holt M; Riedel D; Jahn R Small-Scale Isolation of Synaptic Vesicles from Mammalian Brain. Nat Protoc 2013, 8 (5), 998–1009. 10.1038/nprot.2013.053. [DOI] [PubMed] [Google Scholar]
- (52).Van Deun J; Jo A; Li H; Lin H-Y; Weissleder R; Im H; Lee H Integrated Dual-Mode Chromatography to Enrich Extracellular Vesicles from Plasma. Advanced Biosystems 2020, 4 (12), 1900310. 10.1002/adbi.201900310. [DOI] [PMC free article] [PubMed] [Google Scholar]
- (53).Kashkanova AD; Blessing M; Gemeinhardt A; Soulat D; Sandoghdar V Precision Size and Refractive Index Analysis of Weakly Scattering Nanoparticles in Polydispersions. Nat Methods 2022, 19 (5), 586–593. 10.1038/s41592-022-01460-z. [DOI] [PMC free article] [PubMed] [Google Scholar]
- (54).Dixson AC; Dawson TR; Di Vizio D; Weaver AM Context-Specific Regulation of Extracellular Vesicle Biogenesis and Cargo Selection | Nature Reviews Molecular Cell Biology. Nature Reviews Molecular Cell Biology 2023. 10.1038/s41580-023-00576-0. [DOI] [PMC free article] [PubMed] [Google Scholar]
- (55).Saftics A; Abuelreich S; Romano E; Ghaeli I; Jiang N; Spanos M; Lennon KM; Singh G; Das S; Van Keuren-Jensen K; Jovanovic-Talisman T Single Extracellular VEsicle Nanoscopy. Journal of Extracellular Vesicles 2023, 12 (7), 12346. 10.1002/jev2.12346. [DOI] [PMC free article] [PubMed] [Google Scholar]
- (56).Yang Y; Wu Z; Wang L; Zhou K; Xia K; Xiong Q; Liu L; Zhang Z; Chapman ER; Xiong Y; Melia TJ; Karatekin E; Gu H; Lin C Sorting Sub-150-Nm Liposomes of Distinct Sizes by DNA-Brick-Assisted Centrifugation. Nat. Chem 2021, 13 (4), 335–342. 10.1038/s41557-021-00667-5. [DOI] [PMC free article] [PubMed] [Google Scholar]
- (57).Miranda KC; Bond DT; McKee M; Skog J; Păunescu TG; Da Silva N; Brown D; Russo LM Nucleic Acids within Urinary Exosomes/Microvesicles Are Potential Biomarkers for Renal Disease. Kidney International 2010, 78 (2), 191–199. 10.1038/ki.2010.106. [DOI] [PMC free article] [PubMed] [Google Scholar]
- (58).Cheng L; Hill AF Therapeutically Harnessing Extracellular Vesicles. Nat Rev Drug Discov 2022, 21 (5), 379–399. 10.1038/s41573-022-00410-w. [DOI] [PubMed] [Google Scholar]
- (59).Sun X; Lin F; Sun W; Zhu W; Fang D; Luo L; Li S; Zhang W; Jiang L Exosome-Transmitted miRNA-335–5p Promotes Colorectal Cancer Invasion and Metastasis by Facilitating EMT via Targeting RASA1. Molecular Therapy - Nucleic Acids 2021, 24, 164–174. 10.1016/j.omtn.2021.02.022. [DOI] [PMC free article] [PubMed] [Google Scholar]
- (60).Chen D; Bao C; Zhao F; Yu H; Zhong G; Xu L; Yan S Exploring Specific miRNA-mRNA Axes With Relationship to Taxanes-Resistance in Breast Cancer. Frontiers in Oncology 2020, 10. [DOI] [PMC free article] [PubMed] [Google Scholar]
- (61).Liu S; Fan M; Zheng Q; Hao S; Yang L; Xia Q; Qi C; Ge J MicroRNAs in Alzheimer’s Disease: Potential Diagnostic Markers and Therapeutic Targets. Biomedicine & Pharmacotherapy 2022, 148, 112681. 10.1016/j.biopha.2022.112681. [DOI] [PubMed] [Google Scholar]
- (62).Öhrfelt A; Brinkmalm A; Dumurgier J; Brinkmalm G; Hansson O; Zetterberg H; Bouaziz-Amar E; Hugon J; Paquet C; Blennow K The Pre-Synaptic Vesicle Protein Synaptotagmin Is a Novel Biomarker for Alzheimer’s Disease. Alzheimer’s Research & Therapy 2016, 8 (1), 41. 10.1186/s13195-016-0208-8. [DOI] [PMC free article] [PubMed] [Google Scholar]
- (63).Jia L; Zhu M; Kong C; Pang Y; Zhang H; Qiu Q; Wei C; Tang Y; Wang Q; Li Y; Li T; Li F; Wang Q; Li Y; Wei Y; Jia J Blood Neuro-Exosomal Synaptic Proteins Predict Alzheimer’s Disease at the Asymptomatic Stage. Alzheimer’s & Dementia 2021, 17 (1), 49–60. 10.1002/alz.12166. [DOI] [PMC free article] [PubMed] [Google Scholar]
- (64).Goetzl EJ; Kapogiannis D; Schwartz JB; Lobach IV; Goetzl L; Abner EL; Jicha GA; Karydas AM; Boxer A; Miller BL Decreased Synaptic Proteins in Neuronal Exosomes of Frontotemporal Dementia and Alzheimer’s Disease. The FASEB Journal 2016, 30 (12), 4141–4148. 10.1096/fj.201600816R. [DOI] [PMC free article] [PubMed] [Google Scholar]
- (65).Jia L; Zhu M; Kong C; Pang Y; Zhang H; Qiu Q; Wei C; Tang Y; Wang Q; Li Y; Li T; Li F; Wang Q; Li Y; Wei Y; Jia J Blood Neuro‐exosomal Synaptic Proteins Predict Alzheimer’s Disease at the Asymptomatic Stage. Alzheimers Dement 2021, 17 (1), 49–60. 10.1002/alz.12166. [DOI] [PMC free article] [PubMed] [Google Scholar]
- (66).Théry C; Witwer KW; Aikawa E; Alcaraz MJ; Anderson JD; Andriantsitohaina R; Antoniou A; Arab T; Archer F; Atkin-Smith GK; Ayre DC; Bach J-M; Bachurski D; Baharvand H; Balaj L; Baldacchino S; Bauer NN; Baxter AA; Bebawy M; Beckham C; Bedina Zavec A; Benmoussa A; Berardi AC; Bergese P; Bielska E; Blenkiron C; Bobis-Wozowicz S; Boilard E; Boireau W; Bongiovanni A; Borràs FE; Bosch S; Boulanger CM; Breakefield X; Breglio AM; Brennan MÁ; Brigstock DR; Brisson A; Broekman ML; Bromberg JF; Bryl-Górecka P; Buch S; Buck AH; Burger D; Busatto S; Buschmann D; Bussolati B; Buzás EI; Byrd JB; Camussi G; Carter DR; Caruso S; Chamley LW; Chang Y-T; Chen C; Chen S; Cheng L; Chin AR; Clayton A; Clerici SP; Cocks A; Cocucci E; Coffey RJ; Cordeiro-da-Silva A; Couch Y; Coumans FA; Coyle B; Crescitelli R; Criado MF; D’Souza-Schorey C; Das S; Datta Chaudhuri A; de Candia P; De Santana Junior EF; De Wever O; del Portillo HA; Demaret T; Deville S; Devitt A; Dhondt B; Di Vizio D; Dieterich LC; Dolo V; Dominguez Rubio AP; Dominici M; Dourado MR; Driedonks TA; Duarte FV; Duncan HM; Eichenberger RM; Ekström K; EL Andaloussi S; Elie-Caille C; Erdbrügger U; Falcón-Pérez JM; Fatima F; Fish JE; Flores-Bellver M; Försönits A; Frelet-Barrand A; Fricke F; Fuhrmann G; Gabrielsson S; Gámez-Valero A; Gardiner C; Gärtner K; Gaudin R; Gho YS; Giebel B; Gilbert C; Gimona M; Giusti I; Goberdhan DC; Görgens A; Gorski SM; Greening DW; Gross JC; Gualerzi A; Gupta GN; Gustafson D; Handberg A; Haraszti RA; Harrison P; Hegyesi H; Hendrix A; Hill AF; Hochberg FH; Hoffmann KF; Holder B; Holthofer H; Hosseinkhani B; Hu G; Huang Y; Huber V; Hunt S; Ibrahim AG-E; Ikezu T; Inal JM; Isin M; Ivanova A; Jackson HK; Jacobsen S; Jay SM; Jayachandran M; Jenster G; Jiang L; Johnson SM; Jones JC; Jong A; Jovanovic-Talisman T; Jung S; Kalluri R; Kano S; Kaur S; Kawamura Y; Keller ET; Khamari D; Khomyakova E; Khvorova A; Kierulf P; Kim KP; Kislinger T; Klingeborn M; Klinke II DJ; Kornek M; Kosanović MM; Kovács ÁF; Krämer-Albers E-M; Krasemann S; Krause M; Kurochkin IV; Kusuma GD; Kuypers S; Laitinen S; Langevin SM; Languino LR; Lannigan J; Lässer C; Laurent LC; Lavieu G; Lázaro-Ibáñez E; Le Lay S; Lee M-S; Lee YXF; Lemos DS; Lenassi M; Leszczynska A; Li IT; Liao K; Libregts SF; Ligeti E; Lim R; Lim SK; Linē A; Linnemannstöns K; Llorente A; Lombard CA; Lorenowicz MJ; Lörincz ÁM; Lötvall J; Lovett J; Lowry MC; Loyer X; Lu Q; Lukomska B; Lunavat TR; Maas SL; Malhi H; Marcilla A; Mariani J; Mariscal J; Martens-Uzunova ES; Martin-Jaular L; Martinez MC; Martins VR; Mathieu M; Mathivanan S; Maugeri M; McGinnis LK; McVey MJ; Meckes DG Jr; Meehan KL; Mertens I; Minciacchi VR; Möller A; Møller Jørgensen M; Morales-Kastresana A; Morhayim J; Mullier F; Muraca M; Musante L; Mussack V; Muth DC; Myburgh KH; Najrana T; Nawaz M; Nazarenko I; Nejsum P; Neri C; Neri T; Nieuwland R; Nimrichter L; Nolan JP; Nolte-’t Hoen EN; Noren Hooten N; O’Driscoll L; O’Grady T; O’Loghlen A; Ochiya T; Olivier M; Ortiz A; Ortiz LA; Osteikoetxea X; Østergaard O; Ostrowski M; Park J; Pegtel DM; Peinado H; Perut F; Pfaffl MW; Phinney DG; Pieters BC; Pink RC; Pisetsky DS; Pogge von Strandmann E; Polakovicova I; Poon IK; Powell BH; Prada I; Pulliam L; Quesenberry P; Radeghieri A; Raffai RL; Raimondo S; Rak J; Ramirez MI; Raposo G; Rayyan MS; Regev-Rudzki N; Ricklefs FL; Robbins PD; Roberts DD; Rodrigues SC; Rohde E; Rome S; Rouschop KM; Rughetti A; Russell AE; Saá P; Sahoo S; Salas-Huenuleo E; Sánchez C; Saugstad JA; Saul MJ; Schiffelers RM; Schneider R; Schøyen TH; Scott A; Shahaj E; Sharma S; Shatnyeva O; Shekari F; Shelke GV; Shetty AK; Shiba K; Siljander PR-M; Silva AM; Skowronek A; Snyder II OL; Soares RP; Sódar BW; Soekmadji C; Sotillo J; Stahl PD; Stoorvogel W; Stott SL; Strasser EF; Swift S; Tahara H; Tewari M; Timms K; Tiwari S; Tixeira R; Tkach M; Toh WS; Tomasini R; Torrecilhas AC; Tosar JP; Toxavidis V; Urbanelli L; Vader P; van Balkom BW; van der Grein SG; Van Deun J; van Herwijnen MJ; Van Keuren-Jensen K; van Niel G; van Royen ME; van Wijnen AJ; Vasconcelos MH; Vechetti IJ Jr; Veit TD; Vella LJ; Velot É; Verweij FJ; Vestad B; Viñas JL; Visnovitz T; Vukman KV; Wahlgren J; Watson DC; Wauben MH; Weaver A; Webber JP; Weber V; Wehman AM; Weiss DJ; Welsh JA; Wendt S; Wheelock AM; Wiener Z; Witte L; Wolfram J; Xagorari A; Xander P; Xu J; Yan X; Yáñez-Mó M; Yin H; Yuana Y; Zappulli V; Zarubova J; Žėkas V; Zhang J; Zhao Z; Zheng L; Zheutlin AR; Zickler AM; Zimmermann P; Zivkovic AM; Zocco D; Zuba-Surma EK Minimal Information for Studies of Extracellular Vesicles 2018 (MISEV2018): A Position Statement of the International Society for Extracellular Vesicles and Update of the MISEV2014 Guidelines. Journal of Extracellular Vesicles 2018, 7 (1), 1535750. 10.1080/20013078.2018.1535750. [DOI] [PMC free article] [PubMed] [Google Scholar]
- (67).Ramakrishnan S; Bera M; Coleman J; Rothman JE; Krishnakumar SS Synergistic Roles of Synaptotagmin-1 and Complexin in Calcium-Regulated Neuronal Exocytosis. eLife 2020, 9, e54506. 10.7554/eLife.54506. [DOI] [PMC free article] [PubMed] [Google Scholar]
- (68).Ramakrishnan S; Bera M; Coleman J; Krishnakumar SS; Pincet F; Rothman JE Synaptotagmin Oligomers Are Necessary and Can Be Sufficient to Form a Ca2+-Sensitive Fusion Clamp. FEBS Letters 2019, 593 (2), 154–162. 10.1002/1873-3468.13317. [DOI] [PMC free article] [PubMed] [Google Scholar]
- (69).Bera M; Radhakrishnan A; Coleman J; Sundaram K, R. V; Ramakrishnan S; Pincet F; Rothman JE Synaptophysin Chaperones the Assembly of 12 SNAREpins under Each Ready-Release Vesicle. Proceedings of the National Academy of Sciences 2023, 120 (45), e2311484120. 10.1073/pnas.2311484120. [DOI] [PMC free article] [PubMed] [Google Scholar]
- (70).Kalyana Sundaram RV; Bera M; Coleman J; Weerakkody JS; Krishnakumar SS; Ramakrishnan S Native Planar Asymmetric Suspended Membrane for Single-Molecule Investigations: Plasma Membrane on a Chip. Small 2022, 18 (51), 2205567. 10.1002/smll.202205567. [DOI] [PubMed] [Google Scholar]
- (71).Schindelin J; Arganda-Carreras I; Frise E; Kaynig V; Longair M; Pietzsch T; Preibisch S; Rueden C; Saalfeld S; Schmid B; Tinevez J-Y; White DJ; Hartenstein V; Eliceiri K; Tomancak P; Cardona A Fiji: An Open-Source Platform for Biological-Image Analysis. Nat Methods 2012, 9 (7), 676–682. 10.1038/nmeth.2019. [DOI] [PMC free article] [PubMed] [Google Scholar]
- (72).Van Deun J; Mestdagh P; Agostinis P; Akay Ö; Anand S; Anckaert J; Martinez ZA; Baetens T; Beghein E; Bertier L; Berx G; Boere J; Boukouris S; Bremer M; Buschmann D; Byrd JB; Casert C; Cheng L; Cmoch A; Daveloose D; De Smedt E; Demirsoy S; Depoorter V; Dhondt B; Driedonks TAP; Dudek A; Elsharawy A; Floris I; Foers AD; Gärtner K; Garg AD; Geeurickx E; Gettemans J; Ghazavi F; Giebel B; Kormelink TG; Hancock G; Helsmoortel H; Hill AF; Hyenne V; Kalra H; Kim D; Kowal J; Kraemer S; Leidinger P; Leonelli C; Liang Y; Lippens L; Liu S; Lo Cicero A; Martin S; Mathivanan S; Mathiyalagan P; Matusek T; Milani G; Monguió-Tortajada M; Mus LM; Muth DC; Németh A; Nolte-’t Hoen ENM; O’Driscoll L; Palmulli R; Pfaffl MW; Primdal-Bengtson B; Romano E; Rousseau Q; Sahoo S; Sampaio N; Samuel M; Scicluna B; Soen B; Steels A; Swinnen JV; Takatalo M; Thaminy S; Théry C; Tulkens J; Van Audenhove I; van der Grein S; Van Goethem A; van Herwijnen MJ; Van Niel G; Van Roy N; Van Vliet AR; Vandamme N; Vanhauwaert S; Vergauwen G; Verweij F; Wallaert A; Wauben M; Witwer KW; Zonneveld MI; De Wever O; Vandesompele J; Hendrix A EV-TRACK: Transparent Reporting and Centralizing Knowledge in Extracellular Vesicle Research. Nat Methods 2017, 14 (3), 228–232. 10.1038/nmeth.4185. [DOI] [PubMed] [Google Scholar]
Associated Data
This section collects any data citations, data availability statements, or supplementary materials included in this article.
Supplementary Materials
Data Availability Statement
The data supporting this study’s findings are available from the corresponding author upon reasonable request. We have also submitted all relevant data to the EV-TRACK knowledge base (EV-TRACK ID: EV240006)68.