

Abstract
We implemented a randomized controlled trial among transnational households in the Philippines estimating impacts on financial behaviors of a financial education treatment, a financial access treatment, and the combination of the two. We test whether there are complementarities between both interventions and provide insight into the nature of constraints operating in financial services markets. We find no evidence of complementarities between the financial education and access treatments. In addition, while we find no evidence of constraints in access to formal credit and savings products, our results suggest that access constraints exist in the formal insurance market. Impacts on other financial behaviors are suggestive of the importance of information constraints in financial decision-making. These results provide guidance to designers of financial interventions in similar populations.
I. Introduction
International migrants numbered 244 million worldwide in 2015, of which 190 million were born in middle- and low-income countries (United Nations 2015, 2016). The remittances that these migrants send to origin countries are an important but relatively poorly understood type of international financial flow. In 2015, migrant remittances sent to developing countries amounted to US$432 billion, roughly three times official development aid. However, we are still learning what development policies might increase the development impact of remittances (McKenzie and Yang 2015). While migrant remittance flows are large in magnitude, they amount to only a minority of the total developed-country earnings of migrant workers from developing countries (Clemens, Montenegro, and Pritchett 2009; Clemens 2011; Yang 2011). The prospect that migrants might be encouraged to send even more remittances, and that these remittances might be better leveraged for the economic development of migrant-origin countries, has led to substantial interest in academic and policy circles in development policies related to migrant remittances (e.g., World Bank 2006, Fajnzylber and Lopez 2007).
Recent research in the economics of migration has documented several beneficial impacts of remittance flows on household well-being and investments. Households in the Philippines experiencing exogenous increases in remittances become more likely to leave poverty status, to send their children to school, and to invest in entrepreneurial enterprises (Yang & Martinez 2005, Yang 2006, Yang 2008a). In El Salvador, households receiving more remittances have higher rates of child schooling (Cox-Edwards & Ureta 2003). In Mexico, households with migrants invest more in small businesses than households without migrants (Woodruff & Zenteno 2007). In addition, remittances appear to serve as insurance, rising in the wake of negative shocks (Yang & Choi 2007, Yang 2008b). However, formal instruments of remitting and receiving money are costly and involve complex paperwork and administrative difficulties. In addition, the lack of financial knowledge amongst migrants and their families can create barriers to poverty reduction and household well-being.
In this paper, we seek to shed light on the potential interaction between two types of interventions that are commonly carried out with transnational households by government and non-government organizations (NGOs). The first type of intervention is financial education for transnational household members. Theoretically, these are motivated by imperfect information market failures: households may have incomplete knowledge about financial services availability, how to use financial services, or about financial planning, budgeting, and financial decision-making more generally. Empirically, financial education has been shown to be associated with the quality of financial decision-making, in both observational and randomized experimental studies, in developed-country contexts. 1 Randomized studies of the impact of financial education interventions have been carried out in developing country populations, several of which find impacts on business practices of micro-entrepreneurs, while impacts on household and individual decision-making are typically more muted.2 Recent studies have examined impacts on transnational households. Gibson, McKenzie, and Zia (2014) found limited impacts of migrant financial education training aimed at improving remittance decision-making. Doi, McKenzie, and Zia (2014) examined the impact of pre-departure financial education training in Indonesia, finding that training has positive impacts on financial practices and on savings when migrants and family members are trained together. Seshan and Yang (2014) find that a motivational financial seminar provided to migrant Indian workers in Qatar has positive impacts in transnational households that have low pre-treatment savings levels, raising savings and remittances and leading to increases in joint decision-making between migrant husbands and wives left behind in India.
The second type of intervention involves improving financial access. Motivated by concerns about incompleteness or failures in financial services markets, a number of studies in a wide range of developing countries have examined the impacts of providing or facilitating access to financial services such as credit (e.g., Karlan and Zinman 2011, Banerjee et al 2015), savings (e.g., Dupas and Robinson 2013a and 2013b, Brune et al 2016, Carter et al 2016), and insurance (Karlan et al 2014, Elabed and Carter 2014, Cole et al 2013). There has also been recent work examining the impact of providing new types of financial services targeted at transnational households, for which financial remittance services are additionally relevant. Ashraf et al (2015) find in a randomized study among migrants from El Salvador that improving monitoring and control over savings (by providing new types of savings accounts that allow migrant joint- or sole-ownership) leads to higher savings in the home country. Ambler et al (2015) and De Arcangelis et al (2015) examine, among El Salvador and Philippine transnational households respectively, the impact of novel remittance products that channel funds toward education in the home country. Jack and Suri (2014) and Blumenstock (2016) find that internal remittances via mobile (cellphone) money systems contribute to risk-sharing within Kenya and Rwanda, respectively.
Our contribution is to examine the impact of financial education and financial access interventions simultaneously in the same study. We implemented a randomized controlled trial among transnational households in the Philippines, specifically targeting members of the household who remain in the home country. We considered households in and around Cabanatuan City (in central Luzon) with one or more members working overseas. Households were randomly assigned to a control group, a financial education treatment, a financial access treatment, and a treatment that combined financial education and financial access. The financial education treatment involved an invitation to a one-day workshop that covered topics such as financial goal-setting, budgeting and planning, savings, credit, insurance and small enterprise investment.3 The financial access treatment involved offering formal credit (group microloans), savings, and insurance products in partnership with local financial institutions.
We are most interested in shedding light on how the impact of offering both financial education and financial access differs from the sum of impacts when simply offering one or the other (in other words, whether the two are complementary or substitutes for one another.) The two types of interventions may be complementary, leading to higher impacts than the sum of the two offered separately. Financial education, by improving knowledge about financial services and suggesting strategies and planning approaches, could lead to higher demand for (take-up of) financial services. Offers of financial services could also lead to higher demand for financial education, if individuals realize that financial education could help them make better use of the offered services. On the other hand, it is also possible that the two could be substitutes, so that the impact of offering both is less than the sum of offering each separately. Theoretically, this could arise if, for example, financial education teaches households how to achieve their objectives by using the financial services they already have, or by using informal means that do not require new demand for formal financial services. In this case financial education could dampen demand for financial services, leading a concurrently-offered financial access intervention to have less impact than if the financial access intervention had been offered alone.
To our knowledge, only one other study has explored the independent and combined effects of these two interventions. Jamison et. al. (2014) randomize financial education and access, in the form of group savings accounts, among 250 Ugandan youth clubs and do not find any evidence of complementarities between the two types of interventions. Our study would be the first to see the combined effect of these interventions among transnational households. Moreover, no other study has evaluated the effect of financial education and financial access given to migrant families after the migrants have departed overseas. Our study would also be the first to simultaneously offer access to formal credit (group microloans), savings, and insurance products. This innovation allows us to estimate whether the two types of interventions are complementary or substitutes and if these differ by type of financial product offered.
Our population of interest, transnational households, and the financial sector intervention are policy relevant for at least three reasons. First, transnational households are characterized by information asymmetries arising from the geographical distance separating family members. For example, Seshan and Yang (2014) find among Indian migrants in Qatar that migrants underestimate how much their wives are saving back home. For the same migrant population, Seshan and Zubrickas (2017) show that the underreporting of husband’s income abroad by wives is correlated with lower remittances. De Laat (2014) shows that male Kenyan migrants spend significant resources to monitor their rural wives, consistent with the existence of moral hazard. Chen (2013) finds that non-cooperation by wives when husbands in China have migrated is greater for behaviors that are more difficult to monitor. Barua, Shastry and Yang (2018) find evidence of information asymmetries among female migrant domestic workers in Singapore and their families back in the Philippines. Moreover, they find that a financial literacy workshop urges women to seek more information on how their remittances are spent or saved suggesting that promoting financial education may reduce information asymmetries. Second, international organizations and developing country governments are interested in identifying policies that can enhance the development impacts of international migration and remittances (Hall, 2010). Several migration policies have been recommended across different sectors such as financial, employment, human rights and social sector. These policies can also be implemented across different stages of the migration process i.e. pre-departure, during the migrants stay abroad and upon arrival back to the home country. However, there is limited empirical evidence that can help guide policy (McKenzie and Yang, 2015). In this paper, we focus on a particular intervention in the financial sector that is implemented after the migrants’ departure. Third, transnational households often prefer informal methods of remitting and receiving money. This could be driven by factors such as risks of exchange rate fluctuations, lack of financial knowledge and/or lack of access to banking facilities in the remittance receiving country. Further, migrant families end up relying on remittances in times of financial needs as the migrant becomes a substitute for bank credit (Ambrosius, 2013). Thus, providing financial education and exposure to the formal financial sector may be a policy relevant way to encourage transnational households to use formal methods of saving, borrowing and investing, leveraging remittance funds into larger amounts via credit, as well as for financial deepening (Demirguc-Kunt et. al. 2011).
We find no evidence of either complementarity or substitutability of our interventions. Take-up of the financial products we offered was not affected by whether or not study participants received the financial education treatment. And the reverse is also true: take-up of the financial education treatment was not affected by whether or not we made financial product offers to the study participants. This result provides guidance to organizations designing financial interventions in similar populations, suggesting that there might not be substantial interaction between financial education and financial access interventions. Although our findings may be specific to the features of the interventions and products we offered, decisions regarding whether or not to provide financial education and access interventions can consider the costs and benefits of these interventions singly, without having to consider potential interactions between them in circumstances where they might be implemented simultaneously.
Other patterns in our results are suggestive of the underlying constraints households face. We find little evidence of constraints in access to certain financial services, in particular formal credit and savings. When we offered these products to study participants, take-up was zero or very low. In addition, treatments involving financial education led to changes – and in some cases reductions – in usage of credit and savings products that were not related to our product offers. Both of these findings are inconsistent with binding constraints on access to these types of financial services. On the other hand, we do find substantial take-up of the formal insurance product that we offered to study participants. This finding suggests that households do face constraints on access to formal insurance.
The impact of financial education on financial decision-making also points to prima facie evidence of the importance of information constraints. In response to the financial education treatment (whether alone or in combination with financial access), study participants appeared to change their borrowing decisions: they borrowed lower amounts on average, and (conditional on borrowing) shifted their borrowing from sources of credit that are informal (family and friends) to formal ones (e.g., banks and MFIs).
That said, we examine the impact of financial education and access interventions, separately and together, on broader measures of well-being such as consumption, mental health, and self-reported life satisfaction. We also estimate aggregate impacts on financial decision-making, savings goals, remittances, and a variety of other outcomes. Outcome variables come from a follow-up survey that we implemented. We find little evidence of the impact of treatments (either separately or together) on these measures of broader household well-being. While effects on individual variables are occasionally statistically significantly different from zero, we examine a large number of outcome variables, and when we make corrections for multiple inference we cannot reject the hypothesis of no effect on broader measures of household well-being.
The remainder of this paper is structured as follows. Section 2 presents the experimental design. Summary statistics are described in section 3, and we present the empirical analysis in section 4. Section 5 concludes.
II. Experimental Design
A. Partners and Study Sample
The project was a collaboration between a number of institutions that were brought together by the authors. Alalay sa Kaunlaran Inc. Global Ltd. (ASKI) is a large and well-known microfinance institution based in Cabanatuan City. The institution has a good reputation in delivering quality service: since 2005, the organization has received yearly recognition for its work related to microfinance and training programs. 4 The Overseas Workers Welfare Association (OWWA) is the lead government agency tasked to promote the well-being of overseas Filipino workers. The Bank of the Philippine Islands (BPI) is the oldest, second largest, and most profitable bank in the country. OWWA was instrumental in endorsing the study and providing links to some study participants. The savings accounts offered were from BPI. ASKI delivered the financial literacy training and offered micro-loan and micro-insurance services to study participants. Both ASKI and BPI provided administrative data on take-up of financial products by study participants. Innovations for Poverty Action (IPA) conducted the fieldwork, which involved offering assigned treatments and collecting survey and administrative data.
The study sample consists of 1,808 transnational households residing in Cabanatuan City and surrounding localities. Transnational households were defined as those with at least one household member who had departed for abroad in the past 3 years. OWWA provided contact details of OFW households in our study location from their database of workers who had attended a pre-departure orientation seminar.5 Because a portion of these contact details was unusable, our survey team simultaneously conducted a door-to-door campaign in Cabanatuan and surrounding areas to locate other migrant households and to ask them to participate in our study if they fit our criteria. Fieldwork progressed from areas closest to the ASKI headquarters in Cabanatuan City to surrounding localities: Santa Rosa, Talavera, and Palayan City. Figure 1 displays a map of the study area. Although we were unable to record refusals at this stage of sampling, OWWA provided a letter endorsing participation in the study, which should have minimized bias due to selective non-participation. These activities were carried out until the target number of 1800 households was achieved. Figure 2 provides a brief timeline of activities.
Figure 1:
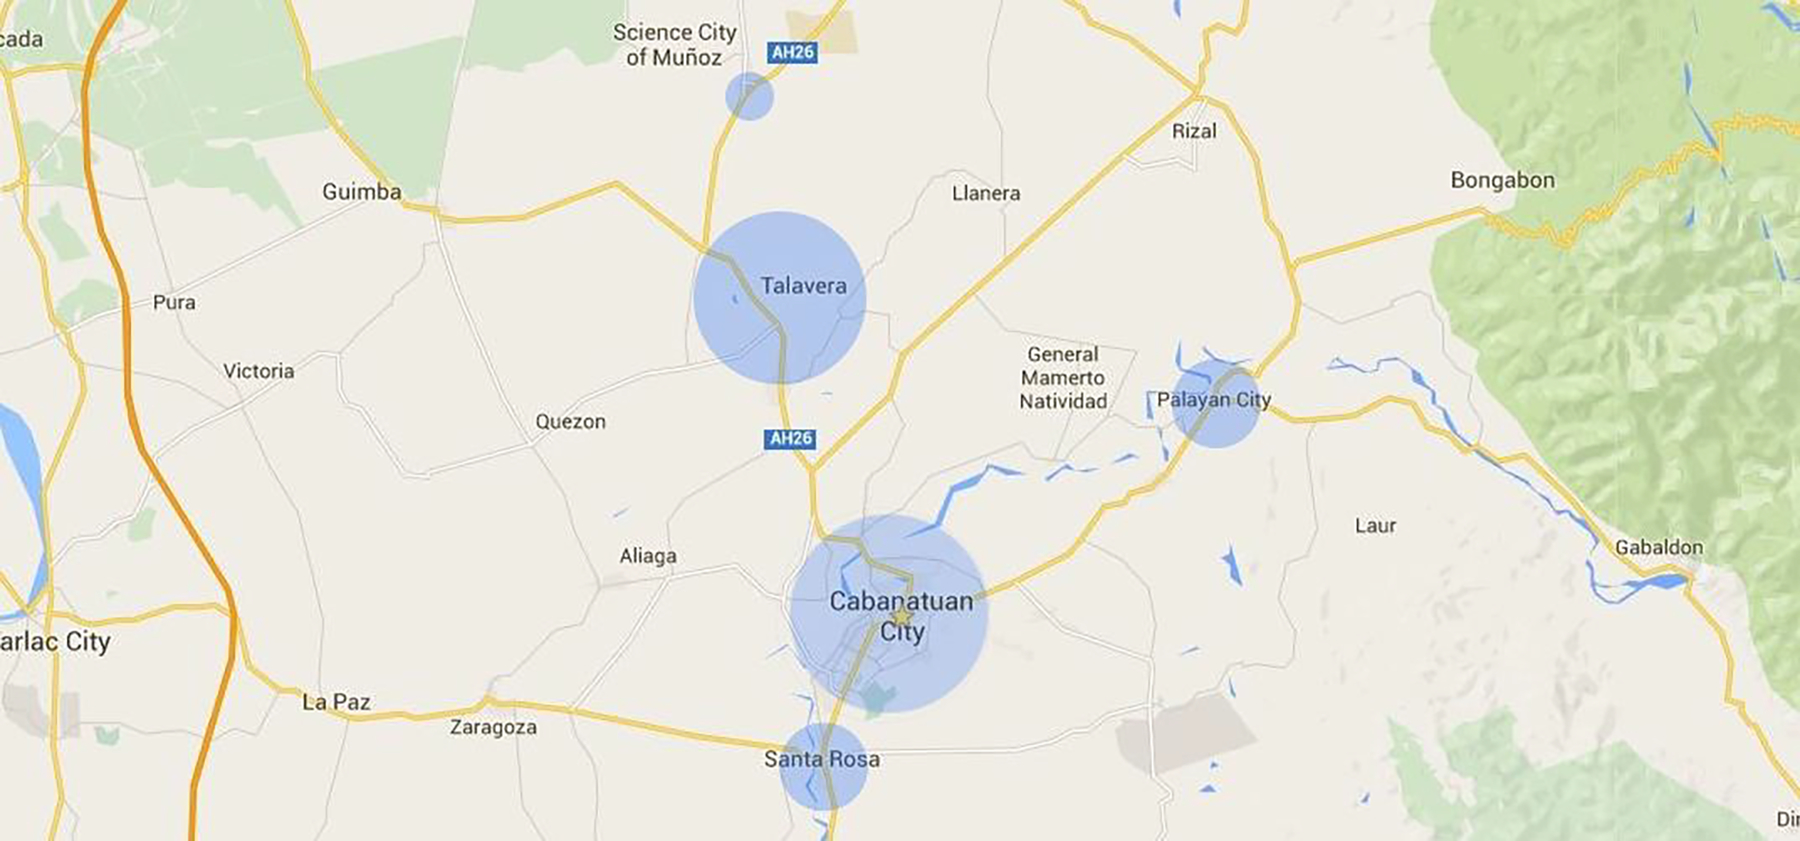
Map of Cabanatuan City and the Surrounding Localities
Note: Data collection areas are in blue.
Figure 2:

Project Timeline
B. The Baseline Survey and Allocation to Treatment
We began by administering a baseline survey to consenting migrant households between September 2014 and April 2015. We interviewed the person considered to be the household head among remaining household members. The survey took approximately 45 minutes and covered information about household members, their education, household income, expenditures, savings, remittances, and work abroad of OFW members of the family. Survey data was collected electronically via tablet devices.
Random treatment assignment was conducted via tablet computers. At the end of each survey, the survey program automatically generated a random number for each household which determined assignment to treatment.
There were four treatment and control groups. We present the four groups in Table 1 below. First, households were randomized into either a financial education treatment, or into a group that receives no financial education at all. Then households were independently cross-randomized into being offered access to formal credit, and savings products, or into a group that is not offered any access. This generated four groups with approximately 450 households each. The offer to attend a financial education program and to avail of financial products constitutes an encouragement design, since in practice we could not require households to use these services.
Table 1.
The Treatment and Control Groups
|
Control Group (N=434) Participants were not made offers for financial education or financial products. |
Treatment 2: Financial Products Only (N=369) Participants were given access to ASKI microloans, ASKI micro-insurance (life or accident), and a BPI savings account. |
|
Treatment 1: Financial Education Only (N=517) Participants were invited to attend a one-time financial education workshop that was 6–8 hours in length. |
Treatment 3: Combined Financial Education and Financial Product Access (N=488) Participants were given combined access to both the financial education workshop and the full set of financial products. |
We describe below each of the treatment and control groups in detail:
Control Group: No offer of financial education program and/or financial services was made to this group.
Treatment 1: Invitation to attend a financial education program: The household head was invited to attend a short workshop on financial education in ASKI’s training center. OWWA provided a letter endorsing participation in the program. The workshop covered topics ranging from financial planning, budgeting, savings, to investing in an enterprise, insurance and credit management (Online Appendix A contains a full list of topics discussed in the financial education workshop). It was not, however, intended to promote any specific product, including products offered in the financial access treatment. The program was designed by ASKI’s Skills and Knowledge Institute, one of the organization’s business units. The institute offers government accredited courses on microfinance management, micro-insurance, and financial management. Skilled facilitators from the institute conducted our financial education sessions. The facilitators were highly trained and had an average of over 15 years of experience in financial management. The sessions were free and scheduled on Saturdays. They lasted 6–8 hours and were completed in a day. To facilitate take-up, the household head was allowed to bring a companion. Figure 3 provides some snapshots of these sessions.
Treatment 2: Access to savings account and microloan products: This treatment group was only provided access to financial services and not financial literacy training. In particular, enumerators invited respondents to open a BPI savings and remittance account; they specified requirements and indicated nearby branch offices and BPI representatives from whom they may obtain assistance. The BPI savings account is an established BPI product offered nationwide. One of its appealing features is that it allows clients to receive remittances from any of its 800 branches and 2,500 outlets of partner institutions nationwide. In addition, migrant families were also invited to avail of ASKI’s microloan products for small enterprise development, the same product they offered to general clients but tailored to migrant households. The loans could be anywhere between 3,000 to 300,000 pesos (approximately 660 to 6,600 USD)6 with a term of 2 to 24 months. Our enumerators provided a letter on how respondents could avail of such products and supplied contact information on loan officers from ASKI for more details. At a later stage, we also invited this treatment group to avail of ASKI’s life and accident micro-insurance product, which were new offerings by ASKI at that time. We explain in the next section the reason for adding this product during the course of the experiment.
Treatment 3: Invitation to a financial education program and access to financial products: This treatment group was invited to attend both a financial education workshop and given access to financial services offered by ASKI and BPI, as in households in treatment groups 1 and 2.
Figure 3:

The Financial Education Sessions
Again, we note that these interventions were targeted not towards the migrants but to their household members remaining in the Philippines. In principle, the results of these interventions could differ if one or both of the interventions had been offered to the migrants themselves. Online Appendix A displays the written invitations and marketing materials we supplied to each treatment group.
C. Financial Incentives, Micro-insurance, and Follow-up
The biggest challenge to the project was the low take-up to our offered treatments. We began field activities in September 2014. Four months into the project, only 36 had participated in our financial education sessions out of the 487 invited. In the same period, only 4 individuals had availed of the BPI savings account following our invitations, while only one person had obtained an ASKI microloan, out of 438 respondents invited. We thus decided to more aggressively market our treatments.
Starting January 2015, we provided financial incentives to encourage households to take-up the treatments. The incentives were presented as compensating for time and transportation costs. We offered household heads in treatment group 1 (financial education) 500 pesos (approximately USD 11) to attend the financial education session.7 For context, this amount is almost equivalent to the daily average wage of a non-agricultural worker in Central Luzon, which was 556 pesos in 2014.8 For treatment group 2 (financial access), we provided 100 pesos (approximately USD 2) per respondent to avail of the microloan, or bank account. Treatment group 3 (both financial education and access) respondents were provided both 500 pesos and 100 pesos incentives if they availed of both the financial education seminar and any of the financial products. These incentives applied to all households who had yet to be interviewed at that time, and to respondents who had not taken-up our offers.
Starting September 2015, we also offered a new product in the form of micro-insurance from ASKI to treatment groups 2 and 3, given that take-up rates for the financial products continued to be low. ASKI micro-insurance consisted of either life or accident insurance. These products covered losses caused by accidental death or bodily injury due to an accident occurring in any country in the world. Online Appendix A provides product details.
We revisited households in the financial education and product treatment groups between September to December 2015 to inform them of the incentives and the new product, in addition to encouraging them to take up the original products and services we offered, if they still had not taken these up. To those in treatment groups 2 and 3 who still had not taken-up any of our offered products at that point, we also conducted a short follow-up survey to get reasons for lack of interest. The revisits and incentives were relatively effective, as evidenced by positive and non-trivial take-up rates (presented below in Table 4).
Table 4.
Determinants of Financial Service Take-up in Post Treatment Period Across Treatment Groups (Admin data)
| (1) Treatment 1: Financial Education |
(2) Treatment 2: Financial Access |
(3) Treatment 3: Financial Education and Access |
Mean in Control Group | N | R2 | Joint tests of treatment groups on outcomes |
||||
|---|---|---|---|---|---|---|---|---|---|---|
| T1=T2 (p-value) | T1 = T3 (p-value) | T2 = T3 (p-value) | T1+T2=T3 (p-value) | |||||||
|
|
||||||||||
| Take up of financial education | 0.414*** (0.024) |
−0.009 (0.013) |
0.389*** (0.024) |
0.037 | 1808 | 0.227 | 0 | 0.431 | 0 | 0.647 |
| Take up of financial services | 0.010 (0.006) |
0.256*** (0.023) |
0.288*** (0.021) |
0 | 1808 | 0.177 | 0 | 0 | 0.302 | 0.485 |
| Take up of BPI savings product | −0.001 (0.001) |
0.011* (0.005) |
0.010** (0.004) |
0 | 1808 | 0.019 | 0.040 | 0.023 | 0.885 | 0.984 |
| Take up of ASKI credit product | 0.004 (0.003) |
0.003 (0.003) |
0.002 (0.002) |
0 | 1808 | 0.015 | 0.755 | 0.606 | 0.876 | 0.319 |
| Take up of ASKI insurance product | 0.007 (0.005) |
0.251*** (0.023) |
0.280*** (0.020) |
0 | 1808 | 0.177 | 0 | 0 | 0.348 | 0.474 |
Note: Data taken from administrative data from partner institutions. Each row is a separate regression. All regressions include baseline control variables. Regressions also include indicators for missing baseline covariates. Observations with a missing baseline covariate are set to 0 for that variable. See Online Appendix Table B1 for further details on baseline control variables.
p<0.10,
p<0.05,
p<0.010
III. Summary Statistics
We provide descriptive statistics for our study sample in Table 2. The average age of the household head is 42 with only one-third of the household heads being males. On average, migrant members of the household have been abroad for 4 years. 42% of the sample report being satisfied with their savings at baseline. Though average education levels are quite high (approximately 16 years of education), financial literacy scores at baseline are low. We calculate the financial literacy score as the fraction of household heads who answer two financial literacy questions correctly during our survey.9 Only 20% of the sample answered both financial literacy questions correctly, suggesting a possible benefit of financial education. The rest of the table presents summary statistics for our main set of outcome variables on financial behavior.
Table 2.
Summary Statistics of Key Baseline and Outcome Variables
| Study Sample | LFS 2015 | ||||
|---|---|---|---|---|---|
| Variable Name | Mean | SD | Count | Mean | SD |
| Baseline Variables | |||||
| Gender of household head (1=male) | 0.259 | 0.438 | 1808 | 0.501 | 0.501 |
| Age of household head | 42.35 | 12.91 | 1808 | 48.79 | 13.55 |
| Years of education completed | 15.63 | 2.850 | 1808 | 15.67 | 3.921 |
| Financial literacy (fraction answering two questions correctly) | 0.206 | 0.404 | 1808 | ||
| % answering Q1 correctly | 0.529 | 0.499 | 1808 | ||
| % answering Q2 correctly | 0.371 | 0.483 | 1808 | ||
| Household size | 5.768 | 2.163 | 1808 | 5.350 | 2.112 |
| Migrant duration abroad in years | 3.936 | 5.243 | 1808 | ||
| Log household income (monthly) | 5.745 | 4.398 | 1808 | ||
| Log remittances received in past 12 months | 10.34 | 3.295 | 1808 | ||
| Log household expenses in past 12 months | 9.116 | 0.985 | 1808 | ||
| Asset index | 0 | 1 | 1808 | ||
| Log household savings | 1.547 | 3.48 | 1808 | ||
| Satisfaction with savings (Dummy = 1 if satisfied) | 0.424 | 0.494 | 1808 | ||
| Log of borrowing amount outstanding | 3.069 | 4.399 | 1808 | ||
| Log of loan amounts to others outstanding | 1.920 | 3.739 | 1808 | ||
| Key Outcome Variables | |||||
| Borrowing | |||||
| HH has borrowed from somewhere in past 3 months | 0.309 | 0.462 | 1553 | ||
| Total amount borrowed in past 3 months (PHP) | 4457 | 16627 | 1503 | ||
| Log of amount borrowed in past 3 months | 2.542 | 4.074 | 1503 | ||
| Borrowed from a formal source in past 3 months | 0.373 | 0.484 | 480 | ||
| Borrowed from an informal source in past 3 months | 0.533 | 0.499 | 480 | ||
| Borrowed from other sources in past 3 months | 0.098 | 0.298 | 480 | ||
| Saving | |||||
| Total number of bank accounts | 0.426 | 0.785 | 1386 | ||
| Total savings in past 3 months (PHP) | 3434 | 27074 | 1248 | ||
| Log total savings in past 3 months | 1.624 | 3.328 | 1248 | ||
Note: Formal sources of credit include banks, microfinance lenders, and private lenders while informal sources include immediate and extended family, friends, and neighbors. The respondent noted if credit did not come from any of these sources (other sources). Monetary amounts are quoted in Philippine pesos. In 2015, 1 U.S. dollar was equivalent to 45.45 Philippine pesos, on average. Financial literacy is measured as the fraction of household heads who answer two questions on financial literacy correctly. The first question asked household heads to compute the simple interest they would earn from a bank account deposit after one month, while the second question asked household head to compute compound interest from a deposit and to select the correct answer from five choices. In Online Appendix Table B1, we provide a more detailed description of these baseline variables.
Because our sampling approach was not designed to generate a representative sample of migrant households in Central Luzon, we also present our summary statistics in Table 2 alongside similar variables gathered by another survey, the Labor Force Survey (LFS) in 2015, to gauge how the study sample compares to typical migrant households in the region. Although we can only compare a few variables on household characteristics that were collected in both surveys, the LFS is nationally representative and identifies households of overseas Filipino workers. We find that household heads in our study sample are more likely to be female than household heads of typical migrant households in Central Luzon. They are also more likely to be younger, but this could be because we targeted households who had sent a member abroad within the past 3 years, whereas the LFS identifies migrant households in general, including those with members who have spent years abroad. With respect to education of the household head and household size, our sample is similar to the typical migrant household in Central Luzon.
IV. Empirical Results
A. Test for Balance on Baseline Characteristics and Attrition
We first test for balance along baseline characteristics between control and treatment groups. Randomization achieves its goal of balance in terms of these pre-treatment variables if the number of statistically different means between groups is not more than what is expected by chance.
We regress baseline characteristics on each of the treatment indicator variables in Table 3. None of the baseline characteristics are statistically predicted by treatment group assignment, which is as expected, except for gender. Respondents from treatment groups 1 and 3 are more likely to be female than those in the control group, although we have no reason to believe this is due to anything but chance. In the proceeding analysis, we correct for this apparent imbalance by controlling for gender and other baseline characteristics.
Table 3.
Balance on Baseline Characteristics
| (1) Gender | (2) Age | (3) Education | (4) Financial Literacy | (5) HH Size | (6) Migration Duration | (7) HH Income | |
|---|---|---|---|---|---|---|---|
|
| |||||||
| Treatment 1: Financial Education |
−0.085*** (0.029) |
0.038 (0.855) |
0.212 (0.189) |
0.009 (0.026) |
−0.158 (0.140) |
0.183 (0.350) |
−0.422 (0.284) |
| Treatment 2: Financial Services |
−0.042 (0.032) |
0.356 (0.931) |
0.248 (0.203) |
0.005 (0.028) |
0.012 (0.155) |
0.224 (0.367) |
−0.027 (0.307) |
| Treatment 3: Education & Services |
−0.088*** (0.029) |
0.808 (0.851) |
−0.095 (0.188) |
0.023 (0.027) |
−0.103 (0.141) |
−0.281 (0.340) |
−0.390 (0.290) |
| Control group mean | 0.316 | 42.053 | 15.546 | 0.196 | 5.839 | 3.914 | 5.977 |
| N | 1,808 | 1,808 | 1,808 | 1,808 | 1,808 | 1,808 | 1,808 |
| R-squared | 0.007 | 0.001 | 0.003 | 0.000 | 0.001 | 0.001 | 0.002 |
| F Stat | 3.972 | 0.416 | 1.556 | 0.284 | 0.647 | 0.932 | 1.211 |
| Prob >F | 0.001 | 0.741 | 0.198 | 0.837 | 0.585 | 0.424 | 0.304 |
|
| |||||||
| (8) Remittances | (9) Expenses | (10) Assets | (11) Savings | (12) Satisfaction with Savings | (13) Borrowing | (14) Lending | |
|
| |||||||
| Treatment 1: Financial Education |
−0.263 (0.212) |
0.054 (0.065) |
0.038 (0.067) |
−0.041 (0.220) |
0.009 (0.032) |
0.264 (0.285) |
0.161 (0.241) |
| Treatment 2: Financial Services |
−0.206 (0.226) |
0.015 (0.076) |
0.077 (0.072) |
0.028 (0.243) |
0.018 (0.035) |
0.132 (0.309) |
−0.093 (0.259) |
| Treatment 3: Education & Services |
−0.191 (0.211) |
0.037 (0.070) |
0.010 (0.068) |
0.344 (0.235) |
−0.033 (0.032) |
0.178 (0.287) |
0.345 (0.248) |
| Control group mean | 10.507 | 9.088 | −0.029 | 1.461 | 0.426 | 2.919 | 1.799 |
| N | 1,808 | 1,808 | 1,808 | 1,808 | 1,808 | 1,808 | 1,808 |
| R-squared | 0.001 | 0.000 | 0.001 | 0.002 | 0.002 | 0.000 | 0.002 |
| F Stat | 0.582 | 0.275 | 0.482 | 1.152 | 0.933 | 0.298 | 1.147 |
| Prob >F | 0.627 | 0.843 | 0.695 | 0.327 | 0.424 | 0.827 | 0.329 |
Note: The table presents regression results of baseline characteristics on treatment indicator variables. Each column is a separate regression. Robust standard errors are in parenthesis. See Online Appendix Table B1 for more information on baseline characteristics.
p<0.10,
p<0.05,
p<0.010
We next test for balance on attrition at endline. Overall attrition is relatively low; the endline survey success rate was 86%. To check whether attrition varied by treatment status, we regress a survey completion indicator on each of the treatment indicator variables. The results are shown in Online Appendix Table B2. The sample appears balanced in terms of attrition; attrition is not predicted by treatment assignment.
We proceed with two types of analyses that are of interest: 1) an analysis of the relative effects of our two interventions on behaviors related to credit, savings, and insurance utilization, and 2) estimation of the impact of treatments on individual outcomes such as income, remittances, educational expenditures, housing investments, and the like.
B. Effects of Financial Education and Financial Access on Credit, Savings, and Insurance
The treatments investigated in this study are all related to financial decision-making, and so our primary outcomes of interest are related to financial product take-up and usage, and take-up of financial education. We first examine impacts of the treatments on take-up of the financial education and financial products we offered (all of which are measured in our administrative data). We then turn to examining self-reported financial behaviors from our follow-up survey.
To measure impacts of our various treatments, we estimate the following regression equation:
| (1) |
The dependent variable is some financial behavior in the post-treatment period . and are dummy variables indicating assignment to treatment 1 (financial education), 2 (financial access), and 3 (financial education and access), respectively. is a mean-zero error term. The coefficients and provide the impact of the financial education program and financial services access respectively on take up, while the coefficient measures the impact of providing both financial education and services simultaneously to the household. is the vector of baseline/pre-treatment () characteristics.
i). Take-up of interventions
We first examine take-up of the offered interventions (either financial education or financial products). Regression results from estimation of equation (1) are in Table 4. Dependent variables are indicators for take-up of financial education or the different financial products. In the latter case we examine an indicator for taking up any of the financial products (“Take up of financial services”), as well as for take-up of each type of financial service (savings, credit, and insurance) separately. We use administrative data from our partner institutions to measure take-up.
There is positive take-up of financial education: treatments 1 (financial education) and 3 (both education and access) both lead to substantial increases in attendance of the ASKI financial education sessions, amounting to roughly 39–41 percentage points. These impacts are relative to a take-up rate in the control group of 3.7%.10 In addition, participants appeared satisfied with the training. At endline, we asked participants about the topics in our financial education sessions that were useful to them. 72% named one or several topics. Majority agreed that the modules on budgeting and planning as well as on savings were most useful.
Examining take-up of financial services helps reveal whether our interventions helped remove or loosen any constraints on financial access. As background, rates of financial services usage are relevant. Non-trivial fractions of households do use financial services in general, but usage is far from universal. In the baseline survey, 52% of households in the sample do have formal bank accounts, and 9% have a bank account with BPI. 31% have some form of formal credit (from banks, microfinance lender, or private lender), and 29% have some form of informal credit (from immediate and extended family, friends, and neighbors). 58% have any credit at all (either formal, informal, or a combination). These access rates are relatively high compared to financial inclusion indicators nationally. A national survey by the Central Bank of the Philippines (BSP 2015) finds that 32.7% of Filipino adults have bank accounts and 47.1% have access to formal and informal sources of credit.
Take-up of the savings and credit products that we offered study participants was very low. Only nine individuals ended up opening BPI savings accounts, and only two took up the ASKI credit product. Regression coefficients in the credit regression are all very small in magnitude and not statistically significantly different from zero. For the savings regressions, the coefficients actually are statistically significantly different from zero for treatments 2 (financial access) and 3 (both interventions), but the magnitudes are very small, at only about 1 percentage point in both cases.11 The low demand for savings and credit that we observed is suggestive that constraints on access to these financial services are not binding for our study households, or at least were not loosened by our interventions.12
In contrast, there was substantial take-up of the insurance product we offered as part of the financial access treatment. Impacts of treatments 2 (financial access) and 3 (both interventions) amount to 25.1 and 28.0 percentage points, respectively, and are statistically significant at the 1% level (These impacts are relative to a take-up rate in the control group of zero.) We conclude from this result that our intervention loosened constraints on access in the insurance market.
As opposed to credit and savings products, one reason constraints to micro-insurance may bind is because it is still a relatively uncommon and novel product. Although we cannot provide baseline access rates to insurance for our study sample13, the Central Bank’s national survey on financial inclusion (BSP 2015) shows that access to non-health insurance is quite low for Filipino adults: Only 3.2% of hFilipino adults have micro-insurance, 13.9% have life insurance, and 11.6% have accident insurance. It was also only at the time of our study that ASKI started offering micro-insurance to its clients in general.
Driven by take-up of the insurance product, take-up of any financial service is also positive; impacts of treatments 2 and 3 each amount to 26–29 percentage points (both coefficients are statistically significantly different from zero at the 1% level).
ii). Are the two interventions complements or substitutes? The interaction between financial education and financial access
A key question our study is designed to answer is whether financial education and access turn out to be complements or substitutes to each other. Theoretically, offering financial education may bolster the effects of financial access, over and above the effects of providing each intervention separately, if improved knowledge makes households demand more services because they can utilize such services better. Alternatively, financial education may dampen demand for services if it teaches alternate strategies for households to achieve goals apart from formal financial services, in which case the impact of financial access would be less than if it had been offered alone.
Answering this question involves seeking evidence for any interaction between the financial education and financial access treatments, in terms of affecting take up rates for the other intervention. Does financial education affect take-up of offered financial products? Does access to financial products affect take-up of financial education?
Comparison of regression coefficients in Table 4 helps answer these questions. We divide our analysis into two sections. First, we investigate the interaction between financial education and the savings and credit component of financial access, reflecting the original design of the study. Financial education may interact with financial access in the sense of generating demand for our partner organizations’ savings and credit products, even though overall demand for these products was low to begin with. We acknowledge though that it may be difficult to expect substitution or complementarity between our treatments in an environment where access to financial services is widespread. Second, we examine whether interaction effects exist between financial education and the insurance component of financial access, which we later on decided to include as part of our intervention. Our financial education sessions covered the definition and importance of insurance as well as introduced attendees to different types of insurance products including life, home, property, automobile, health/medical, accident/disability, education and retirement. Thus theoretically, financial education may influence insurance take-up, although we note that since our insurance offer came a bit later than financial education, this may partially explain the lack of interaction effects.14
It does not appear that financial education increased take-up of BPI savings accounts or ASKI microloans. The coefficients in the BPI savings and ASKI credit take-up regressions are very similar to one another across column 2 (impact of financial access) and column 3 (impact of both financial education and financial), and the differences between coefficients are not statistically significantly different from zero (as can be seen in the p-values for the comparison between coefficients for treatments 2 and 3 in the next-to-last column of the table). It helps that the coefficient estimates are fairly precise across regressions; that is, standard errors are small. We conclude from this that combining financial education with financial access for savings and credit has no additional impact on take-up of financial services, over and above offering financial access alone
Neither does financial education appear to interact with the offer of micro insurance. The take-up of ASKI insurance is statistically the same between the group who were offered insurance and those who were offered insurance plus financial education. Columns 2 and 3 of the ASKI micro insurance take-up regression show that the effects associated with these offers are of the same magnitude (p-value 0.348). Financial education has no additional impact on take-up of micro insurance, over and above the offer of insurance alone.
We can also examine whether our financial access interventions affect take-up of the financial education program. This involves comparing coefficients on take up of financial education (first row) in columns 1 and 3. Again, the coefficients are very similar in columns 1 and 3, and the difference between the coefficients is not statistically significantly different from zero (p-value 0.431). The conclusion here is similar: combining financial education with financial access has no additional impact on take-up of financial education, over and above offering financial education alone.
A highly related comparison of coefficients in Table 4 yields the same conclusion. Another way to view complementarity or substitutability is to ask whether coefficient on the combined treatment (in column 3) is different from the sum of coefficients on the treatments offered separately (columns 1 and 2). The p-value of this test is presented in the rightmost column of Table 4. For no outcome in the table do we find that the impact of the combined treatment is different from the sum of impacts when the treatments are offered separately (no p-value indicates statistical significance at conventional levels).
In sum, financial education and financial access appear to be neither complements nor substitutes for one another. These findings are relevant for design of programs that might consider combining financial education with financial access interventions. Notwithstanding theoretical reasons why interactions might exist, it does not appear that, in this study population, providing one of the interventions (either financial education or access) affects demand for the other type of intervention, whether financial access refers to offering credit and savings or insurance.
iii). Impacts on other financial decisions
We now examine the impact of the treatments on other financial decisions, using outcomes reported in the endline survey. Patterns of impacts can provide additional insight into the likely constraints or barriers that are operating in financial services markets.
In Table 5, we examine impacts on savings and borrowing. Regressions use the specification of equation (1) but with different dependent variables. There is suggestive evidence of impacts on bank account ownership due to the treatments involving financial education (whether alone or in combination with financial access). The financial education treatment alone (treatment 1) leads households to hold more bank accounts (statistically significant at the 10% level). The coefficient on the financial education and financial access treatment (treatment 3) is also positive, but slightly smaller in magnitude and not statistically significantly different from zero at conventional levels. When it comes to the total amount of savings (in pesos or in log of 1+pesos), coefficients on the treatments involving financial education are positive but not statistically significantly different from zero. (Impacts of the financial access treatment are small in magnitude and not statistically significant.)
Table 5.
Utilization of Similar Products and Services
| (1) Treatment 1: Financial Education |
(2) Treatment 2: Financial Access |
(3) Treatment 3: Financial Education and Access |
Mean in Control Group | N | R2 | Joint tests of treatment groups on outcomes |
||||
|---|---|---|---|---|---|---|---|---|---|---|
| T1=T2 (p-value) | T1 = T3 (p-value) | T2 = T3 (p-value) | T1+T2=T3 (p-value) | |||||||
|
|
||||||||||
| Savings | ||||||||||
| Total # of household bank accounts | 0.091* (0.055) |
−0.013 (0.060) |
0.061 (0.055) |
0.377 | 1386 | 0.096 | 0.081 | 0.588 | 0.225 | 0.838 |
| Total savings (PHP) | 817.987 (1355.118) |
−140.497 (1322.629) |
2834.286 (2172.257) |
1667 | 1248 | 0.038 | 0.544 | 0.474 | 0.246 | 0.513 |
| Log of total household savings | 0.291 (0.254) |
0.351 (0.276) |
0.408 (0.260) |
1.309 | 1248 | 0.046 | 0.824 | 0.650 | 0.838 | 0.537 |
| Borrowing | ||||||||||
| Respondent borrowed from any source in past 3 months | −0.028 (0.033) |
−0.056 (0.034) |
−0.031 (0.033) |
0.329 | 1553 | 0.067 | 0.385 | 0.924 | 0.441 | 0.251 |
| Total amount borrowed in past year (PHP) | −1935.530* (1134.367) |
−1942.959 (1557.960) |
−2033.035* (1168.528) |
5724 | 1503 | 0.050 | 0.996 | 0.919 | 0.947 | 0.301 |
| Log of total amount borrowed in past year | −0.184 (0.294) |
−0.476 (0.307) |
−0.256 (0.295) |
2.693 | 1503 | 0.072 | 0.316 | 0.792 | 0.452 | 0.328 |
Note: Data taken from the endline survey. Each row is a separate regression. All regressions include baseline control variables. All financial services data in the table are self-reported. Household bank accounts are inclusive of accounts held by migrant members. Regressions also include indicators for missing baseline covariates. Missing baseline covariates for an observation are set to 0. See Online Appendix B for further details on baseline control variables.
p<0.10,
p<0.05,
p<0.010
There is no large or statistically significant impact of any of the treatments on the extensive margin of borrowing (whether the respondent borrowed from any source in the last three months). That said, when examining amount borrowed in pesos (where those not borrowing are coded as zeros), treatments 1 and 3 (the two treatments that involve financial education, either alone or in combination with financial access) lead to reductions in borrowing.15 The financial education treatment does not appear to affect the extensive margin of borrowing, but does appear to affect the amount borrowed (conditional on borrowing).
It is also of interest to examine impacts on the composition or sources of borrowing, since the treatments could in principle shift respondents to different credit sources. In Table 6 we examine impacts on sources of borrowing for only those individuals who did any borrowing. (The sample of borrowers does not appear to be selected on the basis of treatment; as shown above, none of the treatments have a large or statistically significant impact on the extensive margin of borrowing.) Both treatments 1 and 3, which involve financial education, lead to shifts in the composition of borrowing from informal to formal sources of credit. Treatments 1 and 3 lead to shifts away from informal sources (family, friends, and neighbors) amounting to 13 to 16 percentage points (statistically significant at the 5% or 1% levels respectively), while leading to shifts towards formal sources (banks, microfinance lenders, or other private lenders) amounting to roughly 10 percentage points (statistically significant at the 10% level in both cases).16
Table 6.
Source of Borrowing
| (1) Treatment 1: Financial Education |
(2) Treatment 2: Financial Access |
(3) Treatment 3: Financial Education and Access |
Mean in Control Group | N | R2 | Joint tests of treatment groups on outcomes |
||||
|---|---|---|---|---|---|---|---|---|---|---|
| T1=T2 (p-value) | T1 = T3 (p-value) | T2 = T3 (p-value) | T1+T2=T3 (p-value) | |||||||
|
|
||||||||||
| Formal Source | 0.097* (0.054) |
0.070 (0.061) |
0.100* (0.060) |
0.292 | 480 | 0.152 | 0.650 | 0.973 | 0.651 | 0.430 |
| Informal Source | −0.127** (0.057) |
−0.188*** (0.065) |
−0.160*** (0.062) |
0.658 | 480 | 0.145 | 0.344 | 0.585 | 0.680 | 0.0818 |
| Other Source | 0.008 (0.036) |
0.075 (0.047) |
−0.008 (0.036) |
0.083 | 480 | 0.060 | 0.145 | 0.636 | 0.0734 | 0.127 |
Note: Data taken from endline survey. Formal sources of credit include banks, microfinance lenders, and private lenders while informal sources include immediate and extended family, friends, and neighbors. The respondent noted if credit did not come from any of these sources (Other). Each row is a separate regression. All regressions include baseline control variables. All financial services data in the table are self-reported. Regressions also include indicators for missing baseline covariates. Missing baseline covariates for an observation are set to 0. See Online Appendix B for further details on baseline control variables.
p<0.10,
p<0.05,
p<0.010
Considered all together, these results are suggestive of the types of constraints operating in financial services markets. First of all, financial education alone (treatment 1) – which simply provided financial education but not any change in access to services – caused an increase in bank account ownership and a reduction in amounts borrowed. Merely providing financial education led households to open more bank accounts, and actually caused them to voluntarily reduce amounts borrowed. This suggests that constraints on access to either savings or credit cannot be fully binding.
In addition, any effect of financial education on financial decisions is strongly suggestive of the importance of information constraints in financial services markets, again since the financial education sessions were focused on providing education rather than expanding financial access in any way.
C. Impacts of Financial Education and Financial Access on Other Outcomes
We also estimate impacts of the treatments on a wide variety of outcome variables. Regression specifications are along the lines of equation (1), and thus are ITT estimates. The outcomes are broadly grouped in eight categories: life satisfaction and mental stress; income; migration and remittances; consumption and expenditure; goals; savings; borrowing and lending; financial and literacy. The full set of outcomes included in the indices are presented in Online Appendix Table B4.
Since we estimate impacts on a large number of outcomes within categories, we expect some of our treatments to show statistically significant impacts just by chance. Hence, following Kling, Liebman and Katz (2007), for each group of outcomes, we present the impact on an index of all of the outcomes taken together. In creating the index, we define each outcome so that higher values correspond to better outcomes. Then for each outcome, we create a z-score by subtracting the control group mean and dividing by the control group standard deviation. We average z-scores by category and standardize following the same procedure. We estimate treatment effects on these category indices. In addition, we account for the fact that we are reporting multiple families of outcomes. We correct for the potential issue of simultaneous inference using multiple inference testing. We calculate q-values using the Benjamini-Hochberg step-up method to control for the false discovery rate (FDR) and follow the procedure outlined in Anderson (2008), and test α at all significance levels (1.000, 0.999, 0.998… 0.000). The q-value is the smallest α at which the null hypothesis is rejected.
We do not find statistically significant impacts of the treatments on any of the groups of outcome variables. Table 7 reports results displaying q-values, which correct for presenting results on multiple indices. We find no statistically significant effects of our interventions on household outcomes: no q-values achieve conventional statistical significance thresholds. Neither do we find any evidence which suggests complementarity (or substitution) between financial education and access in terms of their effect on outcomes. As shown in the last row of Table 7 (T1 + T2 = T3), in no case do we reject the hypothesis that the sum of and equals .
Table 7:
Impact on Categorical Indices
| Life Satisfaction Index | Income Index | Migrant Index | Consumption Expenditures Index | Goals Index | Savings Index | Borrow and Lend Index | Financial Literacy Index | |
|---|---|---|---|---|---|---|---|---|
| b/se/p/q | b/se/p/q | b/se/p/q | b/se/p/q | b/se/p/q | b/se/p/q | b/se/p/q | b/se/p/q | |
|
Treatment 1: Financial
Education Only |
0.064 | 0.073 | 0.024 | −0.054 | −0.078 | 0.123* | −0.056 | 0.067 |
| (0.069) | (0.066) | (0.067) | (0.063) | (0.070) | (0.070) | (0.069) | (0.071) | |
| P-values for the coefficients | 0.353 | 0.264 | 0.718 | 0.395 | 0.266 | 0.078 | 0.415 | 0.343 |
| Q-values for all 8 hypotheses | 0.475 | 0.475 | 0.718 | 0.475 | 0.475 | 0.475 | 0.475 | 0.475 |
|
Treatment 2: Financial
Services Only |
0.056 | 0.038 | 0.004 | 0.036 | 0.205** | 0.117 | −0.093 | 0.007 |
| (0.074) | (0.072) | (0.076) | (0.058) | (0.101) | (0.075) | (0.071) | (0.077) | |
| P-values for the coefficients | 0.451 | 0.597 | 0.957 | 0.538 | 0.043 | 0.121 | 0.189 | 0.928 |
| Q-values for all 8 hypotheses | 0.796 | 0.796 | 0.957 | 0.796 | 0.344 | 0.484 | 0.504 | 0.957 |
|
Treatment 3: Financial
Education and Services |
0.072 | 0.115* | 0.090 | −0.129 | 0.060 | 0.148** | −0.044 | 0.136* |
| (0.073) | (0.068) | (0.067) | (0.084) | (0.080) | (0.069) | (0.069) | (0.073) | |
| P-values for the coefficients | 0.32 | 0.090 | 0.181 | 0.126 | 0.453 | 0.031 | 0.523 | 0.063 |
| Q-values for all 8 hypotheses | 0.427 | 0.240 | 0.290 | 0.252 | 0.518 | 0.240 | 0.523 | 0.240 |
| Mean in Control Group | 0 | 0 | 0 | 0 | 0 | 0 | 0 | 0 |
| N | 1558 | 1560 | 1558 | 1558 | 1531 | 1557 | 1557 | 1560 |
| R Squared | 0.059 | 0.099 | 0.074 | 0.151 | 0.039 | 0.082 | 0.065 | 0.037 |
| P-values for the following tests | ||||||||
| T1 = T2 (p-value) | 0.904 | 0.607 | 0.774 | 0.113 | 0.005 | 0.935 | 0.590 | 0.417 |
| T1 = T3 (p-value) | 0.907 | 0.529 | 0.285 | 0.358 | 0.057 | 0.709 | 0.861 | 0.331 |
| T2 = T3 (p-value) | 0.823 | 0.279 | 0.229 | 0.037 | 0.163 | 0.672 | 0.483 | 0.092 |
| T1 + T2 = T3 (p-value) | 0.636 | 0.969 | 0.530 | 0.268 | 0.577 | 0.362 | 0.284 | 0.555 |
Note: Data from endline survey. Each column is a separate regression. To create categorical indices, for each outcome, we create a z-score by subtracting the control group mean and dividing by the control group standard deviation. Then, we average z-scores by category and standardize again following the same procedure. We estimate treatment effects on these category indices. Simultaneous inference is corrected for using multiple inference testing. The q-values are calculated using the Benjamini-Hochberg step-up method to control for the false discovery rate (FDR). We follow the procedure outlined in Anderson (2008), and test α at all significance levels (1.000, 0.999, 0.998… 0.000). The q-value is the smallest α at which the null hypothesis is rejected.
p<0.10,
p<0.05,
p<0.010
V. Conclusion
We implemented a field experiment in which transnational households (households with one or more members overseas) were randomly assigned to either a control group, a financial education treatment, a financial access treatment, or a joint treatment that offered both financial education and financial access.
To our knowledge, only one other study (Jamison et al 2014) has independently randomized financial education and financial access, as well as the combination, simultaneously in the same study population. However, our study would be the first to simultaneously offer access to formal credit (group microloans), savings, and insurance products. This innovation allows us to estimate the interaction of the two types of interventions, revealing whether the two are complementary or substitutes and whether these differ by type of financial product offered. In addition, patterns of impacts can help suggest the types of constraints or barriers faced by households in financial services markets.
We find no evidence of any interaction between the financial services and financial access treatments (the treatments are neither complements nor substitutes from the standpoint of generating demand for either financial services or financial education). Our results also suggest that constraints on access to formal financial services are not binding for common services such as savings and credit, but do appear to exist for a relatively uncommon or novel product such as insurance. We do find that financial education does affect usage of financial services that were not offered in the context of our study, which is likely to reflect that financial education alleviated information constraints of some sort. In general, however, we find no impacts of the interventions on broad measures of well-being and financial behavior, when estimates are corrected for multiple hypothesis testing.
These results are relevant for helping policy-makers and non-government organizations (NGOs) design financial interventions for the households that migrants leave behind in their home areas. Where certain financial services are widespread (such as savings and credit in our context), interventions providing financial education could be prioritized over financial access interventions. On the other hand, for new financial services (such as microinsurance in our case), financial access interventions would still be helpful in promoting adoption. In addition, our finding that financial education may change certain aspects of financial decision-making points to the continued importance of information constraints, helping justify interventions aimed at alleviating information problems. However, implementers must continue to exercise caution when promoting similar programs as we found no evidence of impacts on broad measures of household well-being. We also found a general lack of demand for our interventions, given that participants had to be incentivized to attend the financial education program and to avail of any of our products. For those offered financial education, incentives amounted to almost the daily average wage of workers in Central Luzon, which can be a concern for NGOs operating on a tight budget.
Our results also point to future directions for research. First, as in all empirical research, it is important for future studies to ask similar questions in different contexts and populations, to ascertain the generalizability of the results. For example, similar studies should be conducted in populations of families without migrant workers, and in other locales with varying income levels and financial services development. In addition, it would be important for future studies to further probe our results and provide a more nuanced understanding of mechanisms. For example, impacts we found of financial education raise the question of what aspect of financial education is having the impact: is it advice on budget and planning, or facilitation of household goal-setting, or more detailed information on how to use specific financial services such as credit and savings? It may be true that financial education programs that emphasize particular strategies are more effective and lead to complementarities with different types of financial products. Future studies could randomize the inclusion of these specific sub-components of financial education to tease out which are leading to changed financial behaviors.
Supplementary Material
Acknowledgments
We are grateful to the Citi Foundation and the Citi-IPA Financial Capability Research Fund for generous funding and support of this research. Chinny Jin Cruz, Marius Karabaczek, and Dina Emam provided excellent research assistance. The views expressed herein and all errors are ours.
Footnotes
See, among others, Bernheim, Garrett, and Maki (2001), Bernheim and Garrett (2003), Bertrand and Morse (2011), Cole, Paulson, and Shastry (2012), Duflo and Saez (2003), Lusardi (2004), Lusardi and Mitchell (2007a, 2007b), Lusardi and Tufano (2009), Stango and Zinman (2009), and van Rooij, Lusardi, and Alessie (2007).
Drexler, Fischer, and Schoar (2014), Berge, Bjorvatn, and Tungodden (2010), Bjorvatn and Tungodden (2010), Field, Jayachandran, and Pande (2010), and Karlan and Valdivia (2011) examine impacts of financial education training on micro-entrepreneurs, while studies of impacts on individuals include Carpena, Cole, Shapiro, and Zia (2011) and Cole, Sampson, and Zia (2011). Also see review articles by World Bank (2009), Miller et al (forthcoming) and Kaiser and Menkhoff (2016).
Online Appendix A provides more information regarding the treatments offered.
Among the organization’s citations are awards from the Association of Development Financing Institutions in Asia and the Pacific, the Technical Education and Skills Development Authority of the government, and the European Organization for Sustainable Development. For a full list, refer the following link, http://aski.com.ph/about?page=awards.
The Pre-Departure Orientation Seminar (PDOS) is a mandatory one-day event conducted for all departing OFWs to prepare them for life abroad. It teaches basic things such as how to board a plane and how to conduct oneself while in a foreign country. The PDOS is typically administered by the Philippine government through OWWA but accredited recruitment agencies may also administer it, so not all departing workers go through OWWA.
On average, in 2015, 1 US dollar was equal to 45.45 pesos.
We initially set the incentive at 250 pesos group, but changed it to 500 pesos a few weeks after implementation after initial responses remained lukewarm.
Data on wages are provided by the Philippine Statistics Authority’s Occupational Wages Survey 2014. Data are available at http://psa.gov.ph/occupational-wages-survey/statistical-tables/2014.
The first question was relatively simple and asked household heads to compute the simple interest they would earn from a bank account deposit after one month, while the second question was relatively sophisticated and asked household heads to compute compound interest from a deposit and to select the correct answer from five choices. The exact questions are presented in Table B1 in the Online Appendix. Although far from exhaustive, the questions were designed to capture different levels of financial literacy. The endline survey repeated these questions.
There is some take up in the control group because household heads were allowed to bring a companion to the financial education seminar; in some cases, the companion was a household head from the control group.
Take-up rates of the offered financial products are zero in the control group, which is sensible since we did not offer them these products in the course of field work.
In the follow-up survey, we asked households who did not take up the savings product why they failed to take it up. The dominant response by far (given by 46.9% of respondents) was that they preferred other establishments instead of BPI for savings products. (The next most common response was “Just not interested”, given by 18.1%. Online Appendix Table B3 provides a complete tabulation of responses.) That households felt that they had better products to avail of in the market also helps support the conclusion that households are not constrained in their access to savings products.
Again, we did not expect to change our study design to include an insurance product.
Note though that while the offer for insurance came later, we continually informed study participants of upcoming financial education sessions if they had not yet availed of our offer to participate. We kept in touch with household heads through SMS. In addition, we re-invited relevant households to attend our financial education session during revisits to households between September to December 2015, when we started offering the micro insurance product.
Results when borrowing is expressed in log (1+pesos borrowed) have similar signs, but are not statistically significantly different from zero.
These shifts are fairly large compared to rates of each type of borrowing in the control group (53.3% of borrowers borrowed from informal sources, and 37.3% from formal sources).
Contributor Information
Paolo Abarcar, Mathematica Policy Research, 1100 1st Street NE, 12th Floor, Washington, DC 20002-4221.
Rashmi Barua, Centre for International Trade and Development, School of International Studies, Jawaharlal Nehru University, New Delhi 110067.
Dean Yang, Department of Economics & Ford School of Public Policy, 735 S. State Street, #3315, University of Michigan, Ann Arbor, MI 48109.
References
- Ambler Kate, Aycinena Diego, and Yang Dean, “Channeling Remittances to Education: A Field Experiment among Migrants from El Salvador,” American Economic Journal: Applied Economics, Vol. 7, No. 2, April 2015, pp. 207–232. [DOI] [PMC free article] [PubMed] [Google Scholar]
- Ambrosius C, “Are remittances a substitute for credit? Carrying the financial burden of health shocks in national and transnational households,” World Development, 46: 143–152, 2013. [Google Scholar]
- Anderson Michael L., “Multiple inference and gender differences in the effects of early intervention: A reevaluation of the Abecedarian, Perry Preschool, and Early Training Projects,” Journal of the American Statistical Association, 103, 2008, pp. 1481–1495. [Google Scholar]
- Ashraf Nava, Aycinena Diego, A Claudia Martinez. & Yang Dean, “Savings in Transnational Households: A Field Experiment among Migrants from El Salvador,” The Review of Economics and Statistics, 2(97), 2015, pp. 332–351. [Google Scholar]
- Bangko Sentral ng Pilipinas (BSP), “National Baseline Survey on Financial Inclusion.” Report. 2015 [Google Scholar]
- Banerjee Abhijit, Duflo Esther, Kinnan Cynthia, and Glennerster Rachel, “The miracle of microfinance? Evidence from a randomized evaluation,” American Economic Journal: Applied Economics, 7(1), 2015, pp. 22–53. [Google Scholar]
- Barua Rashmi, Shastry Kartini G. & Yang Dean, “Evaluating the Effect of Peer-Based Financial Education on Savings and Remittances for Foreign Domestic Workers in Singapore,” Working Paper 2018. [Google Scholar]
- Berge Lars, Bjorvatn Kjetil, and Tungodden Bertil, “Human and financial capital for microenterprise development: evidence from a field and lab experiment,” CMI Working Paper WP 2011:1. [Google Scholar]
- Bernheim B.Douglas and Garrett Daniel M, “The effects of financial education in the workplace: evidence from a survey of households,” Journal of Public Economics, 87(7–8), 2003, pp. 1487–1519. [Google Scholar]
- Bernheim B.Douglas, Garrett Daniel M, and Maki Dean M, “Education and saving: the long-term effects of high school financial curriculum mandates,” Journal of Public Economics, 80(3), 2001, pp. 435–465. [Google Scholar]
- Bertrand Marianne and Morse Adair, “Information disclosure, cognitive biases, and payday borrowing,” Journal of Finance, 66(6), 2011, pp. 1865–1893. [Google Scholar]
- Bjorvatn Kjetil and Tungodden Bertil, “Teaching business in Tanzania: Evaluating participation and performance,” Journal of European Economic Association, 8(2–3), 2010, pp. 561–570. [Google Scholar]
- Blumenstock Joshua, “Airtime transfers and mobile communications: Evidence in the aftermath of natural disasters,” Journal of Development Economics, 120, 2016, pp. 157–181. [Google Scholar]
- Brune Lasse, Xavier Giné Jessica Goldberg, and Yang Dean, “Facilitating Savings for Agriculture: Field Experimental Evidence from Malawi,” Economic Development and Cultural Change, 64(2), 2016, pp. 187–220. [Google Scholar]
- Carpena Fenella, Cole Shawn, Shapiro Jeremy, and Zia Bilal, “The ABCs of Financial Literacy: Experimental Evidence on Attitudes, Behavior and Cognitive Biases,” Policy Research Working Paper, 2015. [Google Scholar]
- Carter Michael, Laajaj Rachid, and Yang Dean, “Subsidies, Savings, and Sustainable Technology Adoption: Field Experimental Evidence from Mozambique,” Working Paper, 2016. [Google Scholar]
- Chen Joyce J., “Identifying non-cooperative behavior among spouses: child outcomes in migrant-sending households.” Journal of Development Economics 100 (1): 1–18, 2013. [Google Scholar]
- Clemens Michael, “Economics and Emigration: Trillion Dollar Bills on the Sidewalk?” Journal of Economic Perspectives, 25(3), 2011, pp. 83–106. [Google Scholar]
- Clemens Michael, Montenegro Claudio E., and Pritchett Lant, “The Place Premium: Wage Differences for Identical Workers Across the US Border,” World Bank Policy Research Working Paper No. 4671, 2008. [Google Scholar]
- Clemens Michael and Tiongson Erwin, “Split Decisions: Household Finance When a Policy Discontinuity Allocates Overseas Work,” Review of Economics and Statistics, Forthcoming. [Google Scholar]
- Cole Shawn, Paulson Anna, and Shastry Gauri K., “Smart Money: The Effect of Education on Financial Behavior, Working Paper 2012. [Google Scholar]
- Cole Shawn, Sampson Thomas and Zia Bilal, “Prices or Knowledge: What Drives Demand for Financial Services in Emerging Markets?” Journal of Finance, 66(6), 2011, pp.1933–1967 [Google Scholar]
- Cole Shawn, Gine Xavier, and Vickery James (2013), “How Does Risk Management Influence Production Decisions? Evidence from a Field Experiment,” Working paper, 2013. [Google Scholar]
- Arcangelis De, Giuseppe Majlinda Joxhe, David McKenzie Erwin Tiongson, and Yang Dean, “Directing Remittances to Education with Soft and Hard Commitments: Evidence from a Lab-in-the-field Experiment and New Product Take-up among Filipino Migrants in Rome,” Journal of Economic Behavior and Organization, 111, 2015, pp. 197–208. [Google Scholar]
- de Laat Joost.. “Household allocations and endogenous information: The case of split migrants in Kenya.” Journal of Development Economics 106:108–117, 2014 [Google Scholar]
- Demirgüç-Kunt A, Feyen Eric and Levine Ross, “The evolving importance of banks and securities markets”, World Bank, Policy Research Working Paper, no 5805. 2011. [Google Scholar]
- Doi Yoko, McKenzie David, and Zia Bilal, “Who you Train Matters: Identifying Complementary Effects of Financial Education on Migrant Households,” Journal of Development Economics, 109, 2014, pp. 39–55. [Google Scholar]
- Drexler Alejandro, Fischer Greg, and Schoar Antoinette, “Keeping it Simple: Financial Literacy and Rules of Thumb,” American Economic Journal: Applied Economics, 6(2), 2014, pp. 1–31.25485039 [Google Scholar]
- Duflo Esther and Saez Emmanuel, “The role of information and social interactions in re- tirement plan decisions: evidence from a randomized experiment,” Quarterly Journal of Economics, 118(3), 2003, pp. 815–842. [Google Scholar]
- Dupas Pascaline and Robinson Jonathan (2013a), “Why Don’t the Poor Save More? Evidence from Health Savings Experiments,” American Economic Review, 103 (4), 2013a, pp. 1138–1171. [DOI] [PubMed] [Google Scholar]
- Dupas Pascaline and Robinson Jonathan (2013b), xomment“Savings Constraints and Microenterprise Development: Evidence from a Field Experiment in Kenya,” American Economic Journal: Applied Economics, 5(1), 2013b, pp. 163–192. [Google Scholar]
- Edwards Alejandra Cox and Ureta Manuelita, (2003), “International migration, remittances, and schooling: evidence from El Salvador,” Journal of Development Economics, 72, issue 2, p. 429–461. [Google Scholar]
- Elabed Ghada and Carter Michael, “Ex-Ante Impacts of the Agricultural Insurance: Evidence from a Field Experiment in Mali,” Working Paper, 2014. [Google Scholar]
- Fajnzylber Pablo, and López J. Humberto, Close to Home: The Development Impact of Remittances in Latin America. World Bank. Washington, DC, 2007. [Google Scholar]
- Field Erica, Jayachandran Seema, Pande Rohini, “Do traditional institutions constrain female entrepreneurship? A field experiment on business training in India,” American Economic Review: Papers and Proceedings, 100(2), 2010, pp. 125–129. [Google Scholar]
- Field Erica, Jayachandran Seema, Pande Rohini, and Rigol Natalia, “Friendship at Work: Can Peer Effects Catalyze Female Entrepreneurship?” American Economic Journal: Economic Policy, Forthcoming. [Google Scholar]
- Gibson John, McKenzie David, and Zia Bilal, “The Impact of Financial Literacy Training for Migrants,” World Bank Economic Review, 28(1), 2014, pp. 130–161. [Google Scholar]
- Hall Joan, Ten Years of Innovation in Remittances: Lessons Learned and Models for the Future, Independent Review of the Multilateral Investment Fund Remittance Portfolio, InterAmerican Development Bank, 2010. [Google Scholar]
- Jack William and Suri Tavneet, “Risk Sharing and Transaction Costs: Evidence from Kenya’s Mobile Money Revolution,” American Economic Review, 104(1), 2014, pp. 183–223. [Google Scholar]
- Jaeger DA, Dohmen T, Falk A, Huffman D, Sunde U, & Bonin H, “Direct evidence on risk attitudes and migration,” Review of Economics & Statistics, 92(3), 2010, pp. 684–689. [Google Scholar]
- Jamison Julian, Karlan Dean, and Zinman Jonathan, “Financial Education and Access to Savings Accounts: Complements or Substitutes? Evidence from Ugandan Youth Clubs,” NBER Working Paper No. 20135, May 2014. [Google Scholar]
- Kaiser Tim and Menkhoff Lukas, “Does Financial Education Impact Financial Behavior, and if So, When?” DIW Berlin Discussion Paper 1562, 2016. [Google Scholar]
- Karlan Dean and Valdivia Martin, “Teaching Entrepreneurship: Impact of Business Training on Microfinance Clients and Institutions,” Review of Economics and Statistics, 93(2), 2011, pp. 510–527. [Google Scholar]
- Karlan Dean and Zinman Jonathan, “Microcredit in Theory and Practice: Using Randomized Credit Scoring for Impact Evaluation,” Science, 10, 2011, pp. 1278–1284. [DOI] [PubMed] [Google Scholar]
- Karlan Dean, Osei Robert, Osei-Akoto Isaac, and Udry Christopher, “Agricultural Decisions after Relaxing Credit and Risk Constraints,” Quarterly Journal of Economics, 129(2), 2014, pp. 597–652. [Google Scholar]
- Kling Jeffrey R., Liebman Jeffrey B., and Katz Lawrence F., (2007) “Experimental analysis of neighborhood effects,” Econometrica, 75(1), 2007, pp. 83–119. [Google Scholar]
- Lusardi Annamaria, “Savings and the effectiveness of financial education.” In: Mitchell Olivia, Utkus Stephen (Eds.), Pension Design and Structure: New Lessons from Behavioral Finance, Oxford University Press, Oxford, 2004. pp. 157–184. [Google Scholar]
- Lusardi Annamaria and Mitchell Olivia S., “Baby boomer retirement security: the roles of planning, financial literacy, and housing wealth,” Journal of Monetary Economics, 54(1), 2007a, pp. 205–224. [Google Scholar]
- Lusardi Annamaria and Mitchell Olivia S., “Financial literacy and retirement preparedness: evidence and implications for financial education,” Business Economics, 42 (1), 2007b, pp. 35–44. [Google Scholar]
- Lusardi Annamaria and Tufano Peter, “Debt literacy, financial experiences, and overin-debtedness. Working Paper 2009. [Google Scholar]
- McKenzie David and Yang Dean, “Evidence on Policies to Increase the Development Impacts of International Migration,” World Bank Research Observer, 30(2), 2015, pp. 155–192. [Google Scholar]
- Miller Margaret, Reichelstein Julia, and Salas Christian, and Zia Bilal, “Can You Help Someone Become Financially Capable? A Meta-Analysis of the Literature,” World Bank Research Observer, forthcoming. [Google Scholar]
- Philippine Statistics Authority. “Occupational Wages Survey 2014.” http://psa.gov.ph/occupational-wages-survey/statistical-tables/2014. (accessed on February 20, 2018) [Google Scholar]
- Seshan Ganesh and Yang Dean, “Motivating Migrants: A Field Experiment on Financial Decision-Making in Transnational Households,” Journal of Development Economics, 108, 2014, pp. 119–127. [Google Scholar]
- Seshan Ganesh and Zubrickas Robertas, “Asymmetric Information about Migrant Earnings and Remittance Flows,” The World Bank Economic Review, Volume 31, Issue 1, 1 February 2017, Pages 24–43 [Google Scholar]
- Stango Victor and Zinman Jonathan, “Exponential growth bias and household finance,” Journal of Finance, 64(6), 2009, pp. 2807–2849. [Google Scholar]
- Nations United, International Migration Report 2015: Highlights, Department of Economic and Social Affairs, Population Division (ST/ESA/SER.A/375), 2016. [Google Scholar]
- Nations United, Trends in International Migrant Stock: Migrants by Destination and Origin, Department of Economic and Social Affairs, Population Division (United Nations database, POP/DB/MIG/Stock/Rev.2015), 2015. [Google Scholar]
- van Rooij Maarten, Lusardi Annamaria, and Alessie R.J.M. (Rob), “Financial literacy and stock market participation,” MRRC Working Paper No. 2007. —162, 2007. [Google Scholar]
- Woodruff Christopher & Zenteno Rene (2007), “Migration networks and microenterprises in Mexico,” Journal of Development Economics, 82(2), 2007, pp 509–528. [Google Scholar]
- World Bank, Global Economic Prospects 2006: Economic Implications of Remittances and Migration. Washington, DC, 2006. [Google Scholar]
- World Bank, The case for financial literacy in developing countries, 2009. [Google Scholar]
- World Bank, Migration and Remittances Research Group. Annual Migrant Remittance Inflow Data, 2015. [Google Scholar]
- Yang Dean, “Migrant Remittances,” Journal of Economic Perspectives, 25(3), 2011, pp. 129–152. [Google Scholar]
- Yang Dean, “International Migration, Remittances, and Household Investment: Evidence from Philippine Migrants’ Exchange Rate Shocks,” Economic Journal, 118, 2008a, pp. 591–630. [Google Scholar]
- Yang Dean, “Coping with Disaster: The Impact of Hurricanes on International Financial Flows, 1970–2002,” B.E. Journal of Economic Analysis and Policy, Vol. 8, No. 1 (Advances), Article 13, 2008b. [Google Scholar]
- Yang Dean, “Why Do Migrants Return to Poor Countries? Evidence from Philippine Migrants’ Exchange Rate Shocks,” Review of Economics and Statistics, 88(4) 2006, pp. 715–735. [Google Scholar]
- Yang Dean and Choi HwaJung, “Are Remittances Insurance? Evidence from Rainfall Shocks in the Philippines,” World Bank Economic Review, 21(2), 2007, pp. 219–248. [Google Scholar]
- Yang Dean and A Claudia Martinez., “Remittances and Poverty in Migrants’ Home Areas: Evidence from the Philippines,” in Ozden Caglar and Schiff Maurice, eds., International Migration, Remittances, and the Brain Drain, World Bank, 2005. [Google Scholar]
Associated Data
This section collects any data citations, data availability statements, or supplementary materials included in this article.