

Abstract
This study sheds new light on the timescale through which histone post-translational modifications (PTMs) respond to environmental stimuli, demonstrating that the histone PTM response does not necessarily precede the proteomic response or acclimation. After a variety of salinity treatments were administered to Mozambique tilapia (Oreochromis mossambicus) throughout their lifetimes, we quantified 343 histone PTMs in the gills of each fish. We show here that histone PTMs differ dramatically between fish exposed to distinct environmental conditions for 18 months, and that the majority of these histone PTM alterations persist for at least 4 weeks, irrespective of further salinity changes. However, histone PTMs respond minimally to 4-week-long periods of salinity acclimation during adulthood. The results of this study altogether signify that patterns of histone PTMs in individuals reflect their prolonged exposure to environmental conditions.
Keywords: histone PTMs, developmental plasticity, epigenetic memory, mass spectrometry, euryhaline fishes, salinity
Introduction
Phenotypes arise from the collective action of numerous cellular components, including histone post-translational modifications (PTMs). Histone PTMs are epigenetic marks that regulate heritable patterns of gene expression, and they too exhibit complex regulation. For example, histone PTMs can be influenced by cell type, an organism’s developmental stage and environmental conditions, and the life experiences of ancestors [1–3]. As such, histone PTMs are challenging to study, but they are emerging as an ecologically important mediator of physiological and evolutionary processes [4–6]. They can offer organisms, and their descendants, biological resilience to changing environments [7–9]. Developmental plasticity is one strategy by which histone PTMs can facilitate resilience within an organism’s lifetime. In this process, an organism’s environmental condition during specific developmental stages influences its phenotype during adulthood, theoretically in a manner that maximizes fitness [10].
Initially, in this study, we sought to determine whether histone PTMs facilitate developmental plasticity in Mozambique tilapia (Oreochromis mossambicus) amid salinity challenges. Mozambique tilapia inhabit a wide range of salinities in nature, from freshwater to four times the salinity of seawater [11, 12]. Their exceptional tolerance to salinity, however, is restrained by both prior life experience and the rate of acclimation to new salinities [12–15]. Recent studies have mapped the identity and mean relative abundance of 343 histone PTMs in Mozambique tilapia tissues and found four histone PTMs to be salinity responsive in the gills and gonads of adults [16, 17]. To test whether histone PTMs contribute to salinity tolerance through developmental plasticity, we exposed Mozambique tilapia to two sets of salinity treatments. The first set of salinity treatments was administered throughout the development of fish. We exposed Mozambique tilapia to either freshwater or hypersalinity during their early critical window of development, being gonadal sex differentiation [5, 18–20], then we continued to raise the fish in either freshwater or seawater, respectively, for 18 months. Therefore, fish were raised either in freshwater or under salinity stress. Once the fish reached adulthood, we began the second set of salinity treatments. Fish were acclimated to either freshwater or seawater for 4 weeks because, within that timeframe, Mozambique tilapia reach complete acclimation to either of the environmental conditions by altering their gill morphology and physiology [21–24]. To maximize the power for detecting environmentally induced changes in histone PTMs, we used siblings of Mozambique tilapia, collected as larvae, for this study. The siblings belonged to the same clutch and therefore shared the epigenetic history of their ancestors [25, 26].
In total, four distinct salinity treatments were administered to fish over the course of their lifetimes: (i) salinity stress during development and seawater during adulthood (HS*/S), (ii) salinity stress during development and freshwater during adulthood (HS*/F), (iii) freshwater during development and seawater during adulthood (FF*/S), and (iv) freshwater during both development and adulthood (FF*/F). Following all salinity treatments, we quantified 343 biologically relevant histone PTMs, collectively referred to as the global histone PTM landscape, in the gills of each fish. By comparing the global histone PTM landscape between fish given these different salinity treatments, we sought to investigate not only developmental plasticity, but also whether histone PTMs are impacted by environmental conditions when exposures are lifelong, long-term throughout development, or 4 weeks during adulthood.
The results of this study challenge our previous perceptions of how histone PTMs fit into the central dogma of molecular biology. As a consequence, we are left with a nondefinitive conclusion as to whether histone PTMs facilitate developmental plasticity in the context of Mozambique tilapia facing salinity challenges. However, we gain fascinating insight into the timescale at which histone PTMs change and persist, and thereby break new ground for epigenetics research in the context of ecology.
Results
The 343 histone PTMs, collectively referred to as the global histone PTM landscape, were quantified within the gills of each fish and subjected to five pairwise comparisons. To determine whether lifelong exposure to two distinct environmental conditions impacts histone PTMs, we first compared the global histone PTM landscape between fish exposed exclusively to freshwater and fish exposed exclusively to increased salinity for 18 months (treatments FF*/F and HS*/S). Two comparisons were made to evaluate the influence of long-term environmental exposures during development. First, we compared histone PTMs between the fish that experienced freshwater or salinity stress during development when, as adults, the fish were acclimated to freshwater (treatments FF*/F and HS*/F). Second, we compared histone PTMs between the fish raised in freshwater or under salinity stress when the fish were acclimated to seawater as adults (treatments FF*/S and HS*/S). Another two comparisons were made to determine whether salinity acclimation during adulthood alters the global histone PTM landscape. In one instance, histone PTMs were compared between fish acclimated to either freshwater or seawater during adulthood when the fish were raised in freshwater (treatments FF*/F and FF*/S). Similarly, histone PTMs were compared between fish acclimated to either freshwater or seawater when the fish were raised under salinity stress (treatments HS*/F and HS*/S). A complete account of the results from this study is displayed in Supplementary Table S1, which includes, for each salinity treatment group, the mean relative abundance and M-value of all 343 histone PTMs, and for each salinity treatment comparison, values of log2 fold change, P-value, and conditioned q-value. In the following sections, we highlight the major findings.
Lifetime exposure to environmental conditions
When the 343 histone PTMs were compared between fish exposed to distinct environmental conditions throughout their lives (treatments FF*/F and HS*/S), 34 histone PTMs (9.9%) were significantly different (Fig. 1, Supplementary Table S1). The histone PTMs detected to change included modifications of methylation, dimethylation, trimethylation, and biotinylation, for which fish in freshwater displayed low relative abundance of the modifications on a genome-wide level when compared to the fish exposed to increased salinity. The modification of lactylation and/or carboxyethylation also followed this pattern. It should be noted that lactylation and carboxyethylation cannot be distinguished from each other using our method of histone PTM analysis because these two chemical groups have the same molecular formula. We hereby refer to modifications of lactylation and/or carboxyethylation simply as lactylation, because lactylation is more likely to appear as a histone PTM than carboxyethylation [27]. The environmentally responsive histone PTMs containing modifications of 4-hydroxynonelation and amidation displayed the highest relative abundance in the gills of fish exposed only to freshwater and the lowest relative abundance in the gills of fish exposed to increased salinity. Mixed patterns of change were observed for histone PTMs containing modifications of acetylation, phosphorylation, oxidation, dioxidation, and deamidation; in some instances, these histone PTMs had the lowest relative abundance in fish exposed to freshwater and the highest relative abundance in fish exposed to increased salinity, but in other instances, the opposite pattern was observed.
Figure 1.
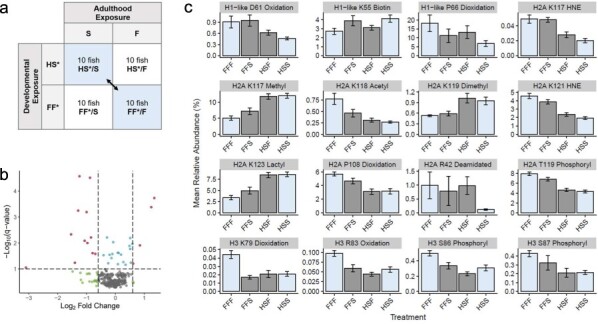
Impact of lifelong environmental exposures on histone PTMs. (a) The global histone PTM landscape of the gills was compared between fish exposed exclusively to freshwater (treatment FF*/F) and fish exposed exclusively to increased salinity (treatment HS*/S). (b) A volcano plot depicts the pattern of change for all 343 histone PTMs between the fish in these treatment groups, where colored points represent histone PTMs found to have a high-fold change (green), low conditioned q-value (blue), both a high-fold change and low conditioned q-value (red), or no substantial difference (gray). (c) For each of the histone, PTMs found to have both a high-fold change and low conditioned q-value when compared between fish in the FF*/F and HS*/S treatment groups (blue), the mean relative abundance is displayed for each salinity treatment group. Error bars represent the mean relative abundance ± the standard error of the mean.
Long-term exposure to environmental conditions during development
To determine whether histone PTMs induced by long-term environmental exposures during development persist within the gills of fish after their environmental conditions change in adulthood, we performed two sets of comparisons. First, we compared histone PTMs between fish raised either in freshwater or under salinity stress when the fish were acclimated to freshwater as adults (treatments FF*/F and HS*/F). Between these fish, 27 of 343 histone PTMs (7.9%) were found to be significantly different (Fig. 2, Supplementary Table S1). The 27 histone PTMs detected in this treatment comparison included modifications of acetylation, methylation, oxidation, dimethylation, 4-hydroxynonelation, lactylation, dioxidation, phosphorylation, and deamidation. A few patterns emerged from this comparison. First, the modification of 4-hydroxynonelation had the highest relative abundance when the fish were raised in freshwater and a significantly lower relative abundance when fish were raised under salinity stress. Yet, several types of modifications exhibited the opposite pattern. Specifically, the histone PTMs containing methylation, dimethylation, and lactylation had low relative abundances when fish were raised in freshwater and significantly higher relative abundances when fish were raised under salinity stress. A mixed pattern of change was observed for histone PTMs containing modifications of acetylation, oxidation, dioxidation, deamidation, and phosphorylation. Of the 27 histone PTMs found to be significantly different between fish in the FF*/F and HS*/F treatment groups, only eight were not significantly different between fish in the FF*/F and HS*/S treatment groups. The histone PTMs that did not overlap in their significance are histone H2A lysine 122 dimethylation, histone H2A proline 48 dioxidation, histone H2A lysine 122 methylation, histone H3 arginine 83 deamidation, histone H2A.Z isoform X1 lysine 156 methylation, histone H1.10 lysine 116 acetylation, histone H4-like threonine 73 acetylation, and H4-like threonine 75 acetylation.
Figure 2.
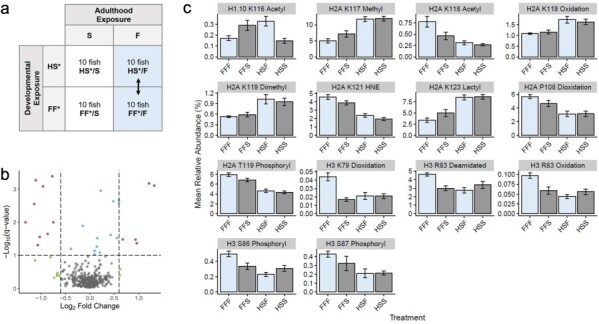
Impact of long-term environmental exposures on histone PTMs in fish acclimated to freshwater. (a) The global histone PTM landscape of the gills was compared between fish exposed exclusively to freshwater (treatment FF*/F) and fish that were raised under salinity stress but acclimated to freshwater during adulthood (treatment HS*/F). (b) The pattern of change for all 343 histone PTMs is depicted in a volcano plot. Colored points represent the histone PTMs found to have a high fold change (green), low conditioned q-value (blue), both a high-fold change and low conditioned q-value (red), or no substantial difference (gray). (c) The histone PTMs found to have both a high-fold change and low conditioned q-value when compared between the gills of fish in the FF*/F and HS*/F treatment groups (blue) are further depicted in bar graphs, which display the mean relative abundance of the histone PTMs in each salinity treatment group. Error bars represent the mean relative abundance ± the standard error of the mean.
To further evaluate the influence of long-term environmental exposures during development, we compared histone PTMs between the fish raised either in freshwater or under salinity stress when the fish were acclimated to seawater as adults (treatments FF*/S and HS*/S; Fig. 3, Supplementary Table S1). This comparison revealed 9 of 343 histone PTMs (2.6%) to be significantly different. The nine histone PTMs that significantly differed between the fish in these salinity treatment groups were composed of acetylation, phosphorylation, oxidation, and 4-hydroxynonelation. In the cases of histone phosphorylation, oxidation, and 4-hydroxynonenation, all environmentally responsive histone PTMs in the gills had a higher relative abundance in fish raised in freshwater than in fish raised under salinity stress. Only one of the histone acetylation modifications was shown to have a higher relative abundance in the gills of fish raised under salinity stress when compared to fish raised in freshwater.
Figure 3.

Impact of long-term environmental exposures on histone PTMs in fish acclimated to seawater. (a) The global histone PTM landscape of the gills was compared between fish exposed exclusively to increased salinity (treatment HS*/S) and fish that were raised in freshwater then acclimated to seawater during adulthood (treatment FF*/S). (b) A volcano plot portrays the influence of salinity treatment on all 343 histone PTMs The colored points represent histone PTMs found to have a high-fold change (green), low conditioned q-value (blue), both a high-fold change and low conditioned q-value (red), or no substantial difference (gray). (c) For the histone PTMs found to have both a high-fold change and low conditioned q-value when compared between fish in the HS*/S and FF*/S treatment groups (blue), the mean relative abundance in each salinity treatment group is displayed. Error bars represent the mean relative abundance ± the standard error of the mean.
Acclimation to environmental conditions during adulthood
To determine the influence of salinity acclimation on histone PTMs, we compared the global histone PTM landscape of the gills between fish acclimated to either freshwater or seawater during adulthood. This comparison was made twice: once when fish were raised in freshwater, and once when fish were raised under salinity stress (Fig. 4, Supplementary Table S1). Among the fish raised in freshwater, only one of the 343 histone PTMs (0.3%) exhibited a significant difference when fish were acclimated to either freshwater or seawater as adults. This histone PTM was histone H3 lysine 79 dioxidation (P-value: 1.81e-05; conditioned q-value: 0.0057), and its relative abundance was highest in fish acclimated to freshwater (0.044%) and lowest in fish acclimated to seawater (0.017%). Among the fish raised under salinity stress, none of the 343 quantified histone PTMs in the gills were found to be significantly different between fish acclimated to either freshwater or seawater as adults.
Figure 4.

Impact of salinity acclimation during adulthood on histone PTMs. (a) First, the global histone PTM landscape of the gills was compared between fish acclimated to either freshwater or seawater during adulthood, specifically when the fish were raised in freshwater (treatments FF*/F and FF*/S, respectively). (b) A volcano plot depicts the pattern of change for all 343 histone PTMs between the fish in these treatment groups. (c) For the one histone PTM found to have both a high-fold change and low conditioned q-value when compared between fish in the FF*/F and FF*/S treatment groups (blue), the mean relative abundance in each salinity treatment group is displayed, with error bars representing the mean ± the standard error of the mean. (d) Second, the global histone PTM landscape of the gills was compared between fish acclimated to either freshwater or seawater during adulthood, specifically when the fish were raised under salinity stress (treatments HS*/F and HS*/S, respectively). (e) The pattern of change for all quantified histone PTMs is depicted in a volcano plot. In both volcano plots shown here (B and E), colored points represent histone PTMs found to have a high-fold change (green), both a high-fold change and low conditioned q-value (red), or no substantial difference (gray).
Discussion
Three key results shape our overarching conclusion that environmental conditions elicit a slow but enduring response of histone PTMs in the gills of Mozambique tilapia. First, histone PTMs vary dramatically between fish exposed to distinct environmental conditions throughout their entire lives. Second, the majority of the environmentally induced changes in histone PTMs persist after fish acclimate to new salinities during adulthood. Third, the acclimation of fish to different salinities during adulthood leads to minimal changes in histone PTMs.
To begin interpreting these results, we will first consider what happens to fish when they acclimate to either freshwater or seawater during adulthood. Four weeks is the time attributed to full acclimation of Mozambique tilapia to these salinities, as the necessary morphological and physiological changes in the gills take place within that timeframe [21–23]. In this study, we investigated the impact of salinity acclimation during adulthood on histone PTMs across two scenarios: once when fish were raised in freshwater and once when fish were raised under salinity stress. Between these two scenarios, only one histone PTM was found to change significantly between fish acclimated to either freshwater or seawater during adulthood. This histone PTM was histone H3 lysine 79 dioxidation, and it changed significantly between these salinities when the fish were raised in freshwater. The extent of this histone PTM response is consistent with a previous study we conducted on acute salinity stress in Mozambique tilapia, where only two histone PTMs significantly responded to salinity stress in the gills [17].
What we did not anticipate was the extent to which histone PTMs vary in the gills of fish following a lifetime of exposure to distinct environmental conditions. When the 343 histone PTMs that we quantified were compared between fish exposed exclusively to freshwater and fish exposed exclusively to increased salinity, 34 histone PTMs (9.9%) were found to be significantly different at a genome-wide level. This result was particularly surprising because the histone PTM response to environmental stimuli is presumed to occur within a matter of minutes [3, 28]. A quick response like this is intuitive given the central dogma of molecular biology, where DNA is transcribed into RNA, and RNA is translated into protein [29]. If histone PTMs mediate the transcription of DNA into RNA, and if proteins are responsive to environmental stimuli, it would follow that the histone PTM response to environmental stimuli precedes the proteomic response [29]. Because Mozambique tilapia experiencing an ambient salinity change compensate for osmoregulation by altering gill proteome networks well within 4 weeks of exposure [30], we assumed that histone PTMs would respond fully to ambient salinity change during adulthood within that timeframe as well. This assumption was invalidated upon our finding that histone PTMs are impacted minimally by a four-week acclimation, but dramatically by lifelong exposure to different salinities.
Because our experimental design was founded on the invalid assumption that the histone PTM response to environmental stimuli precedes the proteomic response, we were unable to detangle the influence of exposure to hypersalinity during gonadal sex differentiation (i.e. an early critical window of development) via developmental plasticity from the influence of long-term exposure to seawater on histone PTMs in this study. Therefore, as early life history impacts the histone PTM response to ambient salinity during adulthood (Figs 2 and 3), we perceive two explanations for this change. The first explanation is that histone PTMs facilitate developmental plasticity in the gills. Developmental plasticity is a common event that is often attributed to epigenetic marks established during early critical windows of development [31–33]. Even within humans, early life experiences impact the progression of non-communicable diseases in adulthood through epigenetic processes [34]. The second explanation of our results, however, is that enduring levels of histone PTMs result from the gradual accumulation of life experiences over a very long time.
Based on the patterns of change exhibited by the environmentally responsive histone PTMs identified in this study (Figs 1–4), we find stronger support for the second explanation that unexpectedly large amounts of time are needed to establish global histone PTM landscapes representative of an organism’s life experience. The fish that were exposed to distinct environmental conditions throughout their lifetimes tended to display the extreme values of relative abundance for these histone PTMs (Fig. 1). In other words, the highest and lowest values of relative abundance for the environmentally responsive histone PTMs were typically found in fish that were exposed exclusively to freshwater (treatment FF*/F) or increased salinity (treatment HS*/S), while intermediate values of relative abundance were exhibited by the fish acclimated to new salinities for 4 weeks during adulthood (treatments FF*/S and HS*/F). This pattern suggests that, given more time, the relative abundance of histone PTMs in fish exposed to new salinities during adulthood would have resembled the relative abundance of histone PTMs in fish exposed to those salinities throughout their lives. This, however, does not preclude the possibility that both developmental plasticity and long-term exposure meaningfully contributed, perhaps at disproportionate degrees, to the global histone PTM landscape [35, 36].
Regardless of the mechanism by which histone PTMs were influenced, the majority of induced changes persisted within the gills of Mozambique tilapia, even 4 weeks after fish were transferred to new environmental conditions. This is evident in the number of histone PTMs that, within fish acclimated to the same salinity during adulthood, differed significantly depending on the environmental conditions in which the fish were raised. Specifically, fish acclimated to freshwater as adults displayed 27 significantly different histone PTMs (Fig. 2), and fish acclimated to seawater as adults displayed nine significantly different histone PTMs (Fig. 3), depending on their long-term environmental condition during development. Due to the difference in the extent to which histone PTMs are retained when fish are acclimated to seawater or freshwater, we speculate that seawater elicits a stronger histone PTM response than freshwater. The influence of salinity on histone H3 lysine 79 dioxidation further reinforces this speculation, as fish exposed to seawater for any duration and at any developmental stage in this study displayed a significantly lower relative abundance of this histone PTM in their gills compared to fish only exposed to freshwater (Fig. 4). All of these persistent histone PTMs signify epigenetic memory of environmental conditions, and their 4-week retention is striking, especially given the rapid turnover of histone proteins [37]. Such retention of histone PTMs can nonetheless be explained by processes such as genomic bookmarking and the faithful transmission of PTMs on parent histones to newly synthesized histones [38, 39]. Altogether, our results reveal that environmental conditions elicit global changes in histone PTMs on a scale much slower than previously thought, but that alterations in histone PTMs are highly persistent. This finding sheds light on the variability of histone PTM responses and epigenetic memory previously reported across taxa, as experimental treatments have ranged in duration from hours to lifetimes [17, 40–44]. We therefore anticipate that histone PTM responses to environmental stimuli would prove much more pervasive if investigated in ecological contexts, where organisms experience prolonged exposure to environmental parameters of interest.
Based on the results of this study, several open questions remain, including the following. To what extent did developmental plasticity versus long-term exposure contribute to environmentally induced changes in histone PTMs? Where along the genome do these histone PTMs accumulate? How long could each of the histone PTM alterations have persisted within organisms and, if applicable to gonads, descendants? Do the histone PTM alterations impart a beneficial phenotype? Further investigation into questions such as these, which address the physiological and evolutionary role of environmentally induced changes in histone PTMs, represents a critical next step in epigenetic research that we anticipate will unlock the potential to use histone PTMs as tools to predict an organism’s environmental past and phenotypic future.
Materials and methods
Salinity treatments
The salinity treatments imposed on Mozambique tilapia in this study were conducted in two phases. In total, 40 fish were analyzed, and individual fish served as experimental units. The fish were lab-bred, and all originated from broodstock originally obtained at the University of Stellenbosch, South Africa. Randomization of salinity treatment assignment was achieved using a random number generator. All researchers were aware of fish treatment assignments during the allocation, experiment, and data analysis.
The first phase of salinity treatments was designed to extend throughout fish development, and the second phase of salinity treatments was designed to represent a period of salinity acclimation of fish during adulthood. For this purpose, Mozambique tilapia larvae from a single clutch were collected at an estimated age of 7 days post-hatching. Upon collection, fish were separated randomly into one of two primary treatment groups: the freshwater primary treatment group (FF*) or the salinity stressed primary treatment group (HS*). Fish assigned to the freshwater primary treatment group were exposed only to freshwater throughout development. For fish in the salinity stressed primary treatment group, salinity was increased from freshwater at a rate of 7.5 g/kg each day, beginning on day 9 post-hatching. This rate of salinity increase continued until salinity reached a maximum of 85 g/kg on day 20 post-hatching. Salinity was maintained at 85 g/kg until day 25 post-hatching. The period of exposure to these hypersaline conditions corresponded to a critical early window of development in Mozambique tilapia, being gonadal sex differentiation [18]. Starting on day 26 post-hatching, salinity was decreased at a rate of 10 g/kg per day, until a final salinity of 30 g/kg (i.e. seawater) was reached on day 31 post-hatching.
Fish were maintained in the designated salinity of their primary treatment groups until reaching 1.5 years of age. At that point, the fish in each primary exposure condition were further divided randomly into two secondary treatment groups: the freshwater secondary treatment group (F) and the seawater secondary treatment group (S). Each secondary treatment represented a four-week exposure to either freshwater or seawater. In order to transition fish from freshwater to seawater, or vice versa, for their secondary salinity treatment, salinity was increased or decreased at a rate of 5 g/kg/day. Once the desired salinity was reached, the four-week period of exposure began. All salinity treatments were completed on the same day; therefore, all fish analyzed in this study were of the same age.
In summary, fish were exposed to four distinct salinity treatments in this study: (i) salinity stress during development and seawater during adulthood (HS*/S; n = 10), (ii) salinity stress during development and freshwater during adulthood (HS*/F; n = 10), (iii) freshwater during development and seawater during adulthood (FF*/S; n = 10), and (iv) freshwater during both development and adulthood (FF*/F; n = 10). Upon the completion of these salinity treatments, all fish were euthanized, and the gill epithelial tissue from each fish was collected. The use of the 40 fish used in this experiment was approved by the UC Davis IACUC under the protocol number 21846.
Processing samples for histone PTM analysis
Samples of gill epithelial tissue were processed through our previously described workflow for histone PTM analysis, where tissues are dissociated into cells through a protocol of mechanical single-cell suspension, cells are enriched for histone proteins through histone acid extraction, and histone proteins are digested into peptides using multiple digestion methods in parallel [16]. The digestion methods chosen for this study were (i) the protease V8 in the buffer ammonium bicarbonate, which cleaves proteins at the carboxyl end of glutamate, and (ii) the protease V8 in the buffer sodium phosphate, which cleaves proteins at the carboxyl end of both glutamate and aspartate (ThermoScientific, cat# 20151). Liquid chromatography mass spectrometry was employed to obtain values of histone peptide abundance, which were then converted to values of histone PTM abundance [16]. Notably, a PTM AScore threshold was not applied in this study. Using these methods, we quantified the relative abundance and M-value of 343 biologically relevant histone PTMs in each sample of gill epithelial tissue.
Statistical analyses
To elucidate how histone PTMs in the gills of Mozambique tilapia respond to environmental conditions through time, we compared all 343 quantified histone PTMs, collectively referred to as the global histone PTM landscape, between fish exposed to specific salinity treatments using t-tests. To determine how lifelong exposure to distinct environmental conditions impacts histone PTMs, the global histone PTM landscape was compared between fish in the FF*/F and HS*/S treatment groups. Two sets of comparisons were made to determine the impact of long-term environmental conditions during development on histone PTMs. First, the global histone PTM landscape was compared between fish in the FF*/S and HS*/S treatment groups. Second, the global histone PTM landscape was compared between fish in the FF*/F and HS*/F treatment groups. Another two sets of comparisons were made to determine the impact of salinity acclimation during adulthood on histone PTMs in the gills. First, the global histone PTM landscape was compared between fish in the FF*/F and FF*/S treatment groups. Second, the global histone PTM landscape was compared between fish in the HS*/F and HS*/S treatment groups. No data points from the 40 fish sampled in this experiment were excluded in these analyses. To correct for the multiple hypothesis testing within each salinity treatment comparison, we applied Boca and Leek’s FDR regression method [45, 46]. Because this method of multiple hypothesis testing correction increases power in statistical analyses by accounting for covariates, we designated the modification type (e.g. acetylation, phosphorylation) of each histone PTM as the covariate in our analyses. Using the R programming environment (version 4.2.0) [47], we prepared volcano plots and bar graphs with the R packages ggplot2 [48] and tidyverse [49] to depict major results.
Supplementary Material
Acknowledgements
We would like to thank Sophie Scott, Selina Zhang, and Shae Hill for their assistance in dissecting the fish used in this experiment.
Contributor Information
Elizabeth A Mojica, Department of Animal Sciences and Genome Center, University of California—Davis, Davis, CA 95616, United States.
Kathleen A Petcu, Department of Animal Sciences and Genome Center, University of California—Davis, Davis, CA 95616, United States.
Dietmar Kültz, Department of Animal Sciences and Genome Center, University of California—Davis, Davis, CA 95616, United States.
Author contributions
Elizabeth A. Mojica (Conceptualization, Methodology, Software, Formal Analysis, Investigation, Data Curation, Writing – Original Draft, Visualization), Kathleen A. Petcu (Investigation), and Dietmar Kültz (Conceptualization, Methodology, Resources, Data Curation, Writing – Review & Editing, Funding Acquisition).
Supplementary data
Supplementary data is available at EnvEpig online.
Conflict of interest:
None declared.
Funding
This work was supported by the National Science Foundation (grant IOS-2209383) and BARD (grant IS-5358-21 to D.K.).
Data availability
All DDA and DIA raw data are available at Panorama Public (https://panoramaweb.org/eam03kl.url, doi: https://doi.org/10.6069/6pvc-5712) and ProteomeXchange (PXD042718). The DIA assay libraries including all relevant metadata and corresponding DIA data are available at Panorama Public (https://panoramaweb.org/eam03kl.url, doi: https://doi.org/10.6069/6pvc-5712).
References
- 1. Weishaupt H, Sigvardsson M, Attema JL. Epigenetic chromatin states uniquely define the developmental plasticity of murine hematopoietic stem cells. Blood 2010;115:247–56. doi: 10.1182/blood-2009-07-235176 [DOI] [PubMed] [Google Scholar]
- 2. Zhu J, Adli M, Zou JY et al. Genome-wide chromatin state transitions associated with developmental and environmental cues. Cell 2013;152:642–54. doi: 10.1016/j.cell.2012.12.033 [DOI] [PMC free article] [PubMed] [Google Scholar]
- 3. Norouzitallab P, Baruah K, Vanrompay D et al. Can epigenetics translate environmental cues into phenotypes? Sci Total Environ 2019;647:1281–93. doi: 10.1016/j.scitotenv.2018.08.063 [DOI] [PubMed] [Google Scholar]
- 4. Mojica EA, Kültz D. Physiological mechanisms of stress-induced evolution. J Exp Biol 2022;225:jeb243264. doi: 10.1242/jeb.243264 [DOI] [PubMed] [Google Scholar]
- 5. Weaver ICG, Cervoni N, Champagne FA et al. Epigenetic programming by maternal behavior. Nat Neurosci 2004;7:847–54. doi: 10.1038/nn1276 [DOI] [PubMed] [Google Scholar]
- 6. Xie L, Korkmaz KS, Braun K et al. Early life stress-induced histone acetylations correlate with activation of the synaptic plasticity genes Arc and Egr1 in the mouse hippocampus. J Neurochem 2013;125:457–64. doi: 10.1111/jnc.12210 [DOI] [PubMed] [Google Scholar]
- 7. Holt WV, Comizzoli P. Conservation biology and reproduction in a time of developmental plasticity. Biomolecules 2022;12:1297. doi: 10.3390/biom12091297 [DOI] [PMC free article] [PubMed] [Google Scholar]
- 8. Miller GM, Watson S-A, Donelson JM et al. Parental environment mediates impacts of increased carbon dioxide on a coral reef fish. Nat Clim Change 2012;2:858–61. doi: 10.1038/nclimate1599 [DOI] [Google Scholar]
- 9. Salinas S, Munch SB. Thermal legacies: transgenerational effects of temperature on growth in a vertebrate. Ecol Lett 2012;15:159–63. doi: 10.1111/j.1461-0248.2011.01721.x [DOI] [PubMed] [Google Scholar]
- 10. Nettle D, Bateson M. Adaptive developmental plasticity: what is it, how can we recognize it and when can it evolve? Proc R Soc B Biol Sci 2015;282:20151005. doi: 10.1098/rspb.2015.1005 [DOI] [PMC free article] [PubMed] [Google Scholar]
- 11. Whitfield AK, Blaber SJM. The distribution of the freshwater cichlid Sarotherodon mossambicus in estuarine systems. Environ Biol Fishes 1979;4:77–81. doi: 10.1007/BF00005931 [DOI] [Google Scholar]
- 12. Stickney RR. Tilapia tolerance of saline waters: a review. Prog Fish-Cult 1986;48:161–7. doi: [DOI] [Google Scholar]
- 13. Root L, Kültz D. Effects of pejus and pessimum zone salinity stress on gill proteome networks and energy homeostasis in Oreochromis mossambicus. Proteomics 2024;24:e2300121. doi: 10.1002/pmic.202300121 [DOI] [PubMed] [Google Scholar]
- 14. Hwang PP, Sun CM, Wu SM. Changes of plasma osmolality, chloride concentration and gill Na-K-ATPase activity in tilapia Oreochromis mossambicus during seawater acclimation. Mar Biol 1989;100:295–9. doi: 10.1007/BF00391142 [DOI] [Google Scholar]
- 15. Schreck CB, Tort L. The concept of stress in fish. Fish Physiol 2016;35:1–34. doi: 10.1016/B978-0-12-802728-8.00001-1 [DOI] [Google Scholar]
- 16. Mojica EA, Kültz D. A strategy to characterize the global landscape of histone post-translational modifications within tissues of nonmodel organisms. J Proteome Res 2023;23:2780–94. doi: 10.1021/acs.jproteome.3c00246 [DOI] [PMC free article] [PubMed] [Google Scholar]
- 17. Mojica EA, Fu Y, Kültz D. Salinity-responsive histone PTMs identified in the gills and gonads of Mozambique tilapia (Oreochromis mossambicus. BMC Genomics 2024;25:586. doi: 10.1186/s12864-024-10471-3 [DOI] [PMC free article] [PubMed] [Google Scholar]
- 18. Nakamura M, Takahashi H. Gonadal sex differentiation in Tilapia mossambica, with special regard to the time of estrogen treatment effective in inducing complete feminization of genetic males. Bull Fac Fish Hokkaido Univ 1973;24:13. [Google Scholar]
- 19. Hanson MA, Skinner MK. Developmental origins of epigenetic transgenerational inheritance. Environ Epigenetics 2016;2:dvw002. doi: 10.1093/eep/dvw002 [DOI] [PMC free article] [PubMed] [Google Scholar]
- 20. Anway MD, Cupp AS, Uzumcu M et al. Epigenetic transgenerational actions of endocrine disruptors and male fertility. Science 2005;308:1466–9. doi: 10.1126/science.1108190 [DOI] [PMC free article] [PubMed] [Google Scholar]
- 21. Febry R, Lutz P. Energy partitioning in fish: the activityrelated cost of osmoregulation in a euryhaline cichlid. J Exp Biol 1987;128:63–85. doi: 10.1242/jeb.128.1.63 [DOI] [Google Scholar]
- 22. Morgan JD, Sakamoto T, Grau EG et al. Physiological and respiratory responses of the Mozambique tilapia (Oreochromis mossambicus) to salinity acclimation. Comp Biochem Physiol A Physiol 1997;117:391–8. doi: 10.1016/S0300-9629(96)00261-7 [DOI] [Google Scholar]
- 23. Sardella BA, Brauner CJ. The effect of elevated salinity on ‘California’ Mozambique tilapia (Oreochromis mossambicus x O. urolepis hornorum) metabolism. Comp Biochem Physiol Part C Toxicol Pharmacol 2008;148:430–6. doi: 10.1016/j.cbpc.2008.05.006 [DOI] [PubMed] [Google Scholar]
- 24. Kültz D, Podrabsky JE, Stillman JH. Physiological mechanisms used by fish to cope with salinity stress. J Exp Biol 2015;218:1907–14. doi: 10.1242/jeb.118695 [DOI] [PubMed] [Google Scholar]
- 25. Jablonka E. Epigenetic epidemiology. Int J Epidemiol 2004;33:929–35. doi: 10.1093/ije/dyh231 [DOI] [PubMed] [Google Scholar]
- 26. Ho DH, Burggren WW. Epigenetics and transgenerational transfer: a physiological perspective. J Exp Biol 2010;213:3–16. doi: 10.1242/jeb.019752 [DOI] [PubMed] [Google Scholar]
- 27. Zhang W, Tan X, Lin S et al. CPLM 4.0: an updated database with rich annotations for protein lysine modifications. Nucleic Acids Res 2022;50:D451–D459. doi: 10.1093/nar/gkab849 [DOI] [PMC free article] [PubMed] [Google Scholar]
- 28. Meagher RB. Memory and molecular turnover,’ 30 years after inception. Epigenet Chromatin 2014;7:37. doi: 10.1186/1756-8935-7-37 [DOI] [PMC free article] [PubMed] [Google Scholar]
- 29. Schneider-Poetsch T, Yoshida M. Along the central dogma—controlling gene expression with small molecules. Annu Rev Biochem 2018;87:391–420. doi: 10.1146/annurev-biochem-060614-033923 [DOI] [PubMed] [Google Scholar]
- 30. Kültz D, Li J, Gardell A et al. Quantitative molecular phenotyping of gill remodeling in a cichlid fish responding to salinity stress *. Mol Cell Proteomics 2013;12:3962–75. doi: 10.1074/mcp.M113.029827 [DOI] [PMC free article] [PubMed] [Google Scholar]
- 31. Champagne FA. Epigenetics and developmental plasticity across species. Dev Psychobiol 2013;55:33–41. doi: 10.1002/dev.21036 [DOI] [PMC free article] [PubMed] [Google Scholar]
- 32. Burdge GC, Lillycrop KA. Nutrition, epigenetics, and developmental plasticity: implications for understanding human disease. Annu Rev Nutr 2010;30:315–39. doi: 10.1146/annurev.nutr.012809.104751 [DOI] [PubMed] [Google Scholar]
- 33. Moczek AP. Developmental plasticity and evolution—quo vadis? Heredity 2015;115:302–5. doi: 10.1038/hdy.2015.14 [DOI] [PMC free article] [PubMed] [Google Scholar]
- 34. Godfrey KM, Costello PM, Lillycrop KA. Development, epigenetics and metabolic programming. Prev Asp Early Nutr 2016;85:71–80. doi: 10.1159/000439488 [DOI] [PMC free article] [PubMed] [Google Scholar]
- 35. Gluckman PD, Hanson MA, Buklijas T et al. Epigenetic mechanisms that underpin metabolic and cardiovascular diseases. Nat Rev Endocrinol 2009;5:401–8. doi: 10.1038/nrendo.2009.102 [DOI] [PubMed] [Google Scholar]
- 36. Schaefer J, Ryan A. Developmental plasticity in the thermal tolerance of zebrafish Danio rerio. J Fish Biol 2006;69:722–34. doi: 10.1111/j.1095-8649.2006.01145.x [DOI] [Google Scholar]
- 37. Zee BM, Levin RS, DiMaggio PA et al. Global turnover of histone post-translational modifications and variants in human cells. Epigenet Chromatin 2010;3:22. doi: 10.1186/1756-8935-3-22 [DOI] [PMC free article] [PubMed] [Google Scholar]
- 38. Michieletto D, Chiang M, Colì D et al. Shaping epigenetic memory via genomic bookmarking. Nucleic Acids Res 2018;46:83–93. doi: 10.1093/nar/gkx1200 [DOI] [PMC free article] [PubMed] [Google Scholar]
- 39. Alabert C, Barth TK, Reverón-Gómez N et al. Two distinct modes for propagation of histone PTMs across the cell cycle. Genes Dev 2015;29:585–90. doi: 10.1101/gad.256354.114 [DOI] [PMC free article] [PubMed] [Google Scholar]
- 40. Norouzitallab P, Baruah K, Vandegehuchte M et al. Environmental heat stress induces epigenetic transgenerational inheritance of robustness in parthenogenetic Artemia model. FASEB J 2014;28:3552–63. doi: 10.1096/fj.14-252049 [DOI] [PubMed] [Google Scholar]
- 41. Sani E, Herzyk P, Perrella G et al. Hyperosmotic priming of Arabidopsis seedlings establishes a long-term somatic memory accompanied by specific changes of the epigenome. Genome Biol 2013;14:R59. doi: 10.1186/gb-2013-14-6-r59 [DOI] [PMC free article] [PubMed] [Google Scholar]
- 42. Zheng H-T, Zhuang Z-X, Chen C-J et al. Effects of acute heat stress on protein expression and histone modification in the adrenal gland of male layer-type country chickens. Sci Rep 2021;11:6499. doi: 10.1038/s41598-021-85868-1 [DOI] [PMC free article] [PubMed] [Google Scholar]
- 43. Kwon CS, Lee D, Choi G et al. Histone occupancy-dependent and -independent removal of H3K27 trimethylation at cold-responsive genes in Arabidopsis. Plant J 2009;60:112–21. doi: 10.1111/j.1365-313X.2009.03938.x [DOI] [PubMed] [Google Scholar]
- 44. Whittle CA, Otto SP, Johnston MO et al. Adaptive epigenetic memory of ancestral temperature regime in Arabidopsis thaliana. Botany 2009;87:650–7. doi: 10.1139/B09-030 [DOI] [Google Scholar]
- 45. Korthauer K, Kimes PK, Duvallet C et al. A practical guide to methods controlling false discoveries in computational biology. Genome Biol 2019;20:118. doi: 10.1186/s13059-019-1716-1 [DOI] [PMC free article] [PubMed] [Google Scholar]
- 46. Leek JT, Jager L, Boca SM et al. swfdr: Estimation of the Science-Wise False Discovery Rate and the False Discovery Rate Conditional on Covariates. 2022. https://github.com/leekgroup/swfdr (8 July 2022, date last accessed).
- 47. R Core Team . R: A Language and Environment for Statistical Computing. 2022. https://www.R-project.org/ (22 June 2022, date last accessed).
- 48. Wickham H. ggplot2: Elegant Graphics for Data Analysis. New York: Springer, 2016. https://ggplot2.tidyverse.org (22 June 2022, date last accessed). [Google Scholar]
- 49. Wickham H, Averick M, Bryan J et al. Welcome to the tidyverse. J Open Source Softw 2019;4:1686. doi: 10.21105/joss.01686 [DOI] [Google Scholar]
Associated Data
This section collects any data citations, data availability statements, or supplementary materials included in this article.
Supplementary Materials
Data Availability Statement
All DDA and DIA raw data are available at Panorama Public (https://panoramaweb.org/eam03kl.url, doi: https://doi.org/10.6069/6pvc-5712) and ProteomeXchange (PXD042718). The DIA assay libraries including all relevant metadata and corresponding DIA data are available at Panorama Public (https://panoramaweb.org/eam03kl.url, doi: https://doi.org/10.6069/6pvc-5712).