

Abstract
TRPV2 voltage-insensitive, calcium-permeable ion channels play important roles in cancer progression, immune response, and neuronal development. Despite TRPV2’s physiological impact, underlying endogenous proteins mediating TRPV2 responses and affected signaling pathways remain elusive. Using quantitative peroxidase-catalyzed (APEX2) proximity proteomics we uncover dynamic changes in the TRPV2-proximal proteome and identify calcium signaling and cell adhesion factors recruited to the molecular channel neighborhood in response to activation.
Quantitative TRPV2 proximity proteomics further revealed activation-induced enrichment of protein clusters with biological functions in neural and cellular projection. We demonstrate a functional connection between TRPV2 and the neural immunoglobulin cell adhesion molecules NCAM and L1CAM. NCAM and L1CAM stimulation robustly induces TRPV2 [Ca2+]I flux in neuronal PC12 cells and this TRPV2-specific [Ca2+]I flux requires activation of the protein kinase PKCα. TRPV2 expression directly impacts neurite lengths that are modulated by NCAM or L1CAM stimulation. Hence, TRPV2’s calcium signaling plays a previously undescribed, yet vital role in cell adhesion, and TRPV2 calcium flux and neurite development are intricately linked via NCAM and L1CAM cell adhesion proteins.
Keywords: APEX, proximity proteomics, TRPV2, neurite outgrowth, NCAM, L1CAM
Graphical Abstract
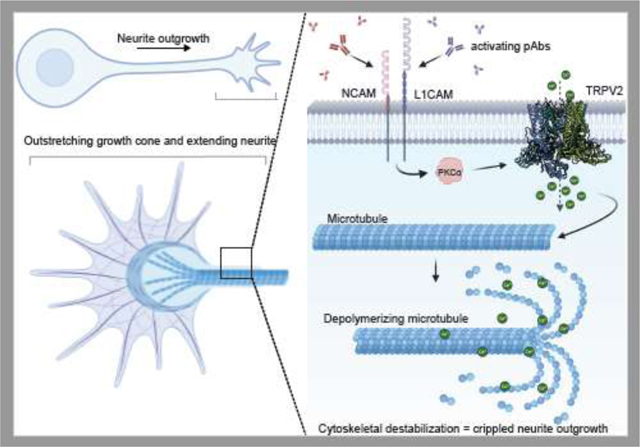
Summary figure displaying neurite outgrowth (top left) with emphasis on the outstretching neurite and growth cone (bottom left). A magnified view of the neurite and the underlying microtubule cytoskeleton shows where TRPV2 is interacting with NCAM and L1CAM following stimulation with their respective polyclonal antibody. This antibody induced stimulation then signals through a PKCα-dependent pathway to induce a TRPV2 intracellular calcium flux. This calcium flux then destabilizes the microtubular cytoskeleton to cripple neurite outgrowth.
1. Introduction
Transient Receptor Potential Vanilloid Type 2 (TRPV2) is a voltage-insensitive, nonspecific cation channel with calcium permeability that is ubiquitously expressed throughout the body and within the cellular endoplasmic reticulum and plasma membrane. Despite TRPV2’s role in cellular signaling and the involved pathways being incompletely understood, altered TRPV2 expression has been demonstrated to affect several physiological processes like neuronal development1,2, immune response3,4, and cancer progression5,6. To date, only few endogenous activating conditions of TRPV2 are known, among which are acidic conditions with a pH of less than 57, oxidative8, and elevated temperature (>52° C)9 conditions. This complicates identification of TRPV2 effector proteins and cellular pathways. TRPV2 is pharmacologically activated by 2-aminoethyldiphenyl borate (2-APB) and cannabidiol (CBD), which together have a synergistic effect on TRPV2 channel opening and calcium permeability10. TRPV2 activation with CBD alone elicits a smaller and longer calcium flux while 2-APB activation produces a larger flux, but a shorter effect on TRPV2’s calcium permeability10,11.
Calcium channels, like TRPV2, are the master regulators of calcium-mediated signaling, ensuring efficient and localized signaling. Calcium signaling controls several key physiological events such as insulin release in β-cells, muscle contraction, and cytoskeletal management12–14. Given that calcium is the most abundant mineral in the body, cells maintain low cytosolic calcium levels to propagate localized calcium signals15. To study subproteomic consequences of TRPV2 activation and ensuing changes in calcium flux with spatial and temporal resolution we leveraged peroxidase-catalyzed labeling of proteins in the molecular neighborhood of TRPV2. Expressing a fusion protein of TRPV2 with APEX2, an engineered ascorbic acid peroxidase, allows to label TRPV2-surrounding proteins at any given time after activation for a 1-minute labeling pulse with biotin-tyramide (biotin-phenol). The labeling radius is confined to about 20 nm16 and labeling is achieved in living cells, preserving the endogenous protein environment of TRPV2. Quantitative mass spectrometry (MS) using isobaric tandem mass tagging (TMT) allows the quantification of several hundreds of proteins and their relative changes in abundance in proximity of TRPV2.
By quantitative proximity proteomics we identify several calcium signaling molecules such as calmodulin and protein kinase C-α proximal to TRPV2 following its activation. Interestingly, cell adhesion molecules were repeatedly recruited after channel activation. Specifically, we identified a neural immunoglobulin superfamily of cell adhesion molecules (IgCAM) member, the neural cell adhesion molecule (NCAM/CD56) from two different cell types as well as another family member, the L1- cell adhesion molecule L1CAM (L1/CD171), in our PC12 APEX-MS data. IgCAMs are transmembrane adhesion molecules that facilitate adhesion, signaling, and recognition in cell adhesion as well as cell-cell adhesion17,18. NCAM and L1CAM are necessary for signaling related to neuronal adhesion, which is fundamental for achieving properly developed neurons, specifically with neurite outgrowth19,20. Activation of NCAM and L1CAM is known to signal through cellular calcium flux which is crucial for its role in neurite outgrowth21,22. Given the importance of TRPV2 in neurite outgrowth and the calcium dependency for NCAM/L1CAM neurite outgrowth, we investigated the connection between TRPV2 and the two IgCAMs and found that TRPV2 expression impacts NCAM or L1CAM induced changes in neurite outgrowth.
2. Materials and methods
2.1. Cell culture and differentiation
All cells were maintained in a humidified atmosphere containing 95% O2 and 5% CO2 at 37°C. The HEK 293T cells were purchased from American Type Cell Culture (CRL-3216™; ATCC, Rockville, MD, USA). The cells were cultured in Dulbecco’s modified Eagle’s medium (DMEM; Corning, Corning, NY, USA) supplemented with 10% fetal bovine serum (FBS; Millipore Sigma, Burlington, MA, USA), penicillin (100 U/mL), and streptomycin (100 μg/mL) (antibiotic-antimycotic 100x; Thermo Fisher, Waltham, MA, USA).
Pheochromocytoma 12 (PC12) cells were also purchased from ATCC (CRL-1721™). PC12 cells were maintained in Ham’s F-12K Kaighn’s (F12K) nutrient mix (Thermo Fisher) supplemented with 15% horse serum (Thermo Fisher), 5% FBS (Millipore Sigma), penicillin (100 U/mL), and streptomycin (100 μg/mL) (Thermo Fisher).
For neuronal differentiation of PC12 cells, the medium was changed from normal growth medium to differentiation medium which consisted of F12K nutrient mix with 1% horse serum, 0.5% FBS, and 100 ng/mL nerve growth factor (recombinant human NGF; Abcam, Waltham, MA, USA).
2.2. Transfection and stable cell line generation
Transfection of HEK 293T and PC12 cells with plasmid DNA was performed using Lipofectamine 3000 (Thermo Fisher) according to the manufacturer’s protocol. Cells engineered for stable protein production were cultured and selected over several weeks using 800 μg/mL G418 and clones were selected based on protein expression levels. After clones were selected, cells were maintained in the appropriate medium with the addition of 400 μg/mL G418 (HEK) or 200 μg/mL (PC12).
2.3. TRPV2-APEX2 construct design
The TRPV2-APEX2 fusion protein contains a flexible glycine-serine linker (GGSSGGSS) incorporated into the C-terminus of rat (rattus rattus) TRPV2 followed by APEX2. The C-terminus of APEX2 contains a 1D4 (TETSQVAPA) affinity tag for detection.
2.4. Plasmids
The sequences for rat TRPV2-APEX2, rat TRPV2-mGFP, rat DN-TRPV2 (E594K and E604K) were cloned into the mammalian expression vector pcDNA3.1 by Genscript (Piscataway, NJ, USA). The pcDNA3.1 vector containing TRPV2-GcaMP3 was constructed by standard molecular cloning.
2.5. Proximity labeling experiments
HEK 293T or PC12 cells were grown to optical confluency of ~85% in T25 flasks. For PC12 cells, flasks were coated by rat collagen 1 and given a 3-day NGF (100 ng/mL) treatment prior to the labeling experiment to allow for the PC12 cells to differentiate into neurons with outstretching neurites.
Proximity labeling experiments were performed as previously described16,23. Briefly, an hour before the start of the experiment, the cells were incubated with 500 μM biotin phenol (biotin tyramide; Millipore Sigma), placed back into the incubator, and allowed sufficient time for the cells to uptake the biotin phenol. At one hour after biotin phenol incubation, drugs were applied to their respective samples and incubated for 5 minutes in the incubator. At the end of the 5-minute drug incubation period, samples were given freshly prepared 1 mM hydrogen peroxide (H2O2 solution; Millipore Sigma) to catalyze the APEX labeling reaction. Sample conditions with no drug applied were given 1 mM hydrogen peroxide immediately following biotin phenol uptake. After a one-minute incubation with H2O2, the reaction was quenched by washing the cells with a freshly prepared, ice-cold quenching solution of 10 mM sodium ascorbate (Millipore Sigma), 5 mM Trolox ((±)-6-hydroxy-2,5,7,8-tetramethylchromane-2-carboxylic acid; Millipore Sigma), and 10 mM sodium azide (Millipore Sigma) in PBS. Cells were washed an additional two times with ice-cold quenching buffer before they were removed from the flask by PBS and collected into 1.5 mL Eppendorf tubes. The collected cells were then pelleted by centrifugation at 3k rpm at 4°C, supernatant was removed, and pellets were immediately flash frozen and stored at −80°C or directly lysed for streptavidin pulldowns.
2.6. Cysteine alkylation and streptavidin pulldown of biotinylated proteins
All buffers and solutions were freshly prepared. Cells were collected and pelleted as described in 2.5. The streptavidin pulldown of biotinylated proteins was performed as described23. Briefly, cells were lysed with 100 μL of urea lysis buffer (8M Urea supplemented with 100 mM sodium phosphate pH 8, 1% SDS (w/v), 100 mM NH4HCO3, and 10 mM TCEP) by pipetting vigorously. A TCA stock solution containing 55% ice-cold TCA was added at a 1:1 ratio and allowed to sit on ice for 15 minutes. The proteins were precipitated in a tabletop centrifuge at 13k rpm at 4°C for 10 minutes. The protein pellet was washed with ice cold acetone three times. The pellets were dried to remove remaining acetone and resuspended in urea lysis buffer by vortexing for an hour. The resuspended proteins were centrifuged at 13k rpm at 4°C for 10 minutes and the supernatant was transferred to a clean tube.
To alkylate free cysteines, iodoacetamide was added to the dissolved proteins at a final concentration of 20 mM and immediately vortexed and incubated in the dark for 25 minutes. The alkylation was quenched by the addition of 1 M DTT to a final concentration of 50 mM. Water was added to reach a final concentration of 4M urea and 0.5% SDS (w/v) in the protein solution. The supernatant was collected and 5% of the total material was retained as the input sample. The remaining supernatant was added to Pierce™ Streptavidin Magnetic Beads (Thermo Fisher) that have been washed with urea wash buffer (4 M urea, 0.5% SDS (w/V), 50 mM sodium phosphate pH 8) thrice. An additional 500 μL of urea wash buffer supplemented with 10 mM TCEP was added to the cellular supernatant to aid in the motility of the sample and sample binding. The sample was incubated on the beads overnight with rotation at 4°C.
After the overnight incubation, the tubes containing the sample and the beads are placed on a magnetic rack to separate the bound material from the remaining un-biotinylated proteins. The flowthrough was collected by obtaining 5% of the total material. The beads were washed as described23 to prepare the samples for enzymatic digestion and subsequent steps to load onto the mass spectrometer. Beads were washed with 4M buffered urea and 0.5% SDS three times and subsequently washed with 4M urea without SDS to remove residual SDS for mass spectrometry sample processing.
2.7. On-bead digestion
On-bead digestion was performed by adding 2μg LysC (Wako) in 50μL of digestion buffer (200mM EPPS pH 8.5 with 2% acetonitrile) for 3 hrs at 37°C with gentle shaking. After 3 hours 1μL of frozen trypsin (Promega) in 50μL digestion buffer was added to each sample for overnight digestion at 37°C with gentle shaking. A magnetic rack was used to separate the beads and the supernatants were transferred to new tubes.
2.8. TMT labeling
The tandem mass tag (TMT) labeling reaction was performed by first adding 30μL of acetonitrile to each sample followed by addition of the appropriate TMTpro reagent (Thermo Fisher). The labeling reaction proceeded for 1 hour at room temperature with intermittent vortexing. Labeling efficiency was measured by combining 2μL of each reaction and analyzing by LC-MS3. Once efficiency was >95%, the reactions were quenched with 7μL of 10% hydroxyl amine for 10 min at room temperature, acidified with neat formic acid, pooled, and dried by speed vac evaporation. Once dried the multiplex was fractionated using the Pierce High pH Reversed-Phase Peptide Fractionation Kit (Thermo Fisher Scientific) using a modified step gradient of increasing acetonitrile to collect a total of 12 fractions: 10%, 12.5%, 15%, 17.5%, 20%, 25%, 30%, 35%, 40%, 50%, 65%, and 80% acetonitrile. The 12 fractions were combined into 6 fractions as follows: 1+7, 2+8, 3+9, 4+10, 5+11, and 6+12. The fractions were dried and desalted by stage tip as described24.
2.9. Mass spectrometry acquisition
Data collection was performed on an Orbitrap Fusion Lumos connected to a Proxeon Easy-nLC1200 ultra high-performance liquid chromatography (LC) system (Thermo Fisher Scientific). Peptides were separated on a 100μm (inner diameter) capillary column packed to ~30cm with 2.6Å C18 resin in-house with a 4-hour gradient of 5–35% buffer B (Buffer A: 0.125% formic acid with water, Buffer B: 95% acetonitrile with 0.125% formic acid). All data was collected using a Multi Notch MS3 method using the following sequences: MS1 orbitrap scans (resolution 120K; mass range 400–2000Th); MS2 in the ion trap with collision-induced dissociation (CE=35%, isolation window 0.5); quantitative MS3 orbitrap scans (resolution 50K, HCD collision, maximum injection time 600ms).
The proteomics raw data were deposited in the PRIDE archive (https://www.ebi.ac.uk/pride/archive/) for the HEK (accession number: PXD048282) and PC12 (accession number: PXD048260) data sets.
2.10. Mass spectrometry analysis
Spectra were converted to mzXML and searched using SEQUEST (v. 28, rev.12)-based software using a 20ppm precursor mass tolerance and 0.9Da fragment ion tolerance. Searches were performed using the appropriate human or rat reference proteomes from Uniprot (both downloaded in 2021). Cysteine carboxyamidomethylation (+57.0214Da) and methionine oxidation (+15.9949Da) were set as static and variable modification, respectively. A maximum of 2 missed cleavage sites were allowed. A target decoy-based strategy was applied, and the false discovery rate (FDR) was set to 1% for peptide-spectrum matches after linear discriminant analysis (LDA) filtering. The final FDR for collapse proteins was set to 1%. A post-calibration search was also performed. For relative quantitation, peptides were filtered to have an MS2 isolation specificity of greater than or equal to 70% and a summed TMT signal to noise (sum s/n) ratio of greater than 200.
Volcano plots of the proteomics data were generated using the normalized identified relative protein abundance values in Prism. The cutoff values for proteins that were significant were a fold change ≥ 2 and a p-value ≤ 0.05 using an unpaired t-test. Hierarchical clustering (Ward, unstandardized) and principal component analyses graphs for the HEK 293 and the PC12 data sets were generated in JMP Pro. Cytoscape (v 3.10.1) was used for GO term analyses of the proteomics data sets where the cutoff for significance was a false discovery rate (FDR) p-value ≤ 0.05. Bubble plots of the identified GO terms were generated in Prism.
2.11. Immunofluorescence
HEK 293T or PC12 cells were grown to optical confluency of ~25–30% on poly-L-lysine- or rat collagen I-coated 12 mm glass coverslips, respectively. For PC12 cells, 3-day NGF (100 ng/mL) treatment occurred prior to fixation to allow for the PC12 cells to differentiate into neurons with outstretching neurites. Cells were fixed with warmed 4% PFA for 10 minutes and then washed with PBS 3x. Fixed cells were then permeabilized with cold 0.25% triton X-100 in PBS for 10 minutes on ice followed by three PBS washes. The permeabilized cells were then blocked with 1% BSA in PBS overnight at 4°C to prevent nonspecific binding. After overnight blocking, the cells were washed with PBS three times to prepare for primary antibody incubation. The cells were then incubated with the appropriate concentration of antibodies diluted in 1% BSA in PBS against our protein targets overnight at 4°C. The next morning, the cells are washed with PBS three times and then incubated with the corresponding secondary antibodies diluted in 1% BSA in PBS for an hour at room temperature in the dark. After secondary incubation, the cells are washed again with PBS three times and mounted on the glass cover slide with Fluorsave mounting reagent. Images were collected on a Zeiss 710 confocal microscope at the appropriate magnification for the samples.
2.12. Proximity ligation assay
The Duolink® In Situ Probemaker PLUS kit (Millipore Sigma) was used to conjugate the anti-TRPV2 17A11 clone antibody (Millipore SIgma) to a Duolink® In Situ PLUS probe. The protocol provided in the Duolink® In Situ Probemaker kit was followed. This 17A11-PLUS probe was prepared as needed and was stored at 4°C for a maximum of three months.
WT PC12 cells were grown, differentiated, fixed, permeabilized, and blocked as described in 2.11. For the proximity ligation assay, the protocol for the Duolink® proximity ligation assay provided on the Millipore Sigma website was adapted as follows. Briefly, the cells were incubated with the necessary antibody (mouse calmodulin (MA3–917), Thermo Fisher; mouse PKCα (MA1–157), Thermo Fisher; mouse L1CAM/CD171 (PA5-85876), Thermo Fisher; mouse NCAM1 (5B8), Developmental Hybridoma Storage Bank, Iowa City, IA) diluted in 1% BSA in PBS overnight at 4°C. The following morning, the coverslips were washed with PBS three times and incubated with phalloidin for F-actin staining to visualize the cell membrane, the conjugated 17A11-PLUS probe, and the Duolink® In Situ Mouse MINUS probe (Millipore Sigma) diluted in 1% BSA in PBS for one hour in a humidified chamber at 37°C. After the hour incubation, the coverslips were washed with PBS three times and incubated with ligase diluted to the proper concentration in the provided ligation buffer and incubated for 30 minutes in a humidified chamber at 37°C. After the incubation, the coverslips were washed with PBS 3x and incubated with polymerase diluted in the provided amplification buffer for 100 minutes in a humidified chamber at 37°C. After this incubation, the cells were washed with PBS three times and mounted onto a glass slide using Fluorsave. The glass sides were allowed to dry for several hours before they were sealed with nail polish and stored at −20°C until imaging (within 3 days from PLA completion for best images). Images were collected on a Zeiss 710 confocal microscope at the appropriate magnification for the samples.
2.13. Calcium imaging with GcaMP
Calcium imaging of PC12 cells expressing TRPV2-GcaMP in PC12 cells was acquired by confocal microscopy (ORCA-Quest qCMOS; Hamamatsu, Bridgewater, NJ, USA). PC12 cells expressing TRPV2-GcaMP treated with NGF for three days in a rat collagen I-coated optical bottom 96-well plate were used for imaging. A 488 nm laser was used for excitation and images were collected every 2 seconds for three minutes. Several regions of interest are selected within the PC12 cells expressing TRPV2-GcaMP and analyzed for changes in fluorescence over time. The changes in fluorescence intensity over time in identified ROIs were measured by the Time Series Analyzer 3 plugin for ImageJ. Antibodies or drugs were added to the PC12 cells at 10 seconds (frame 6) following the start of imaging. The 5 frames captured before the drugs or antibodies were included are used as the fluorescence baseline (F0). The fluorescence baseline was subtracted from recorded fluorescence (F) intensities over time to calculate the change in fluorescence, giving F-F0=ΔF. This ΔF was then divided by the fluorescence baseline (F0; ΔF/F0) to normalize the values that provide the index for Ca2+ dynamics. This normalized ΔF/F0 value was plotted over time to provide the calcium flux curves. Fmax was the maximum ΔF/F0 observed for an individual ROI identified within the cell.
2.14. Neurite outgrowth
The priming of PC12 cells to outgrow neurites at a faster rate was utilized for this experiment to reduce data collection time from several days to 24 hours was adapted from similar PC12 neuronal priming studies25. The priming of the PC12 cells occurred as follows. PC12 cells were plated at a density of ~25% on rat collagen I coated 24-well plate and treated with 100 ng/mL NGF in differentiation medium over three days to allow the PC12 cells to neuronally differentiate and develop neurites. On the third day, the media was aspirated, and the cells were washed with warmed PBS once to remove serum proteins. Cells were incubated with 0.25% trypsin-EDTA for 5 minutes at 37°C to detach adherent cells and remove neuronal projections from the PC12 cells. After the incubation period, the trypsin was diluted with PC12 growth media to decrease enzymatic action and the trypsinized cells were collect and pelleted. While the cells were pelleting, the 24-well plate was washed with PBS twice to remove all remaining cell debris. The PC12 cells were resuspended in differentiation media supplemented with 50 ng/mL NGF as primed PC12 cells are more responsive to NGF26. Replated cells were inspected with brightfield microscopy to ensure that all cellular projections were removed from the PC12 cells. Immediately after cells were replated, 200 ng/mL of L1CAM or NCAM polyclonal antibodies were incubated in the antibody-stimulated wells.
Brightfield images (EVOS, Thermo Fisher) of the replated PC12s were taken at 1 hour, 3 hours, 5 hours, 7 hours, and 24 hours post plating to track neurite regrowth over time. All images were imported to ImageJ and scaled according to the objective used to calibrate the pixel size for measuring neurite lengths. Neurite lengths were measured by tracing neurites with the straight-line tool and using the area measurement to obtain the lengths of the neurites. Neurite lengths were collected from three biological replicates of the 24-hour neurite regrowth experiments.
3. Results
3.1. APEX2 proximity-based mass spectrometry identifies TRPV2 proximal sub-proteome dynamics
To identify the sub-proteome of the molecular TRPV2 neighborhood, we expressed a fusion protein of rat TRPV2 with the engineered plant peroxidase APEX2 fused to TRPV2’s C-terminus with a short, flexible glycine- and serine-rich linker (Figure S1A). We confirmed that this TRPV2-APEX fusion protein retains typical TRPV2 channel activation in response to stimulation with 2-APB (Figure S1B, C). Stable expression of the TRPV2-APEX fusion protein was conditioned into human embryonic kidney (HEK) 293 cells as this is a common cell line used for a wide variety of biological studies and they have been successfully used for APEX-MS studies27,28.
APEX functionality was confirmed through biotin blot analysis comparing biotinylated proteins in samples with and without the APEX-activating agent, H2O2, showing a variety of sizes of biotinylated proteins in the H2O2-included samples unlike the H2O2-withheld samples that show few faint bands which represent the endogenously biotinylated proteins (Figure S1D). The proximal localization of biotinylated proteins to TRPV2-APEX after an APEX biotinylation experiment was confirmed through immunofluorescence labeling of TRPV2 and biotinylated proteins in the TRPV2-APEX HEK cells (Figure S1E). The presence of biotinylated proteins within the nucleus (Figure S1E), where TRPV2 is not known to be expressed, could likely be due to the uptake of excess biotin that was supplemented in the media during the APEX experiment which is known to bind histone proteins within the nucleus29,30.
Biotin-labeled proteins were affinity purified under denaturing conditions, digested, and tagged with TMTs for quantification (Figure S2A). Proteomics data were normalized to the relative quantity of TRPV2. Our proximity-based mass spectrometry approach quantified over four thousand proteins detectable on streptavidin beads under denaturing pulldown conditions (4M urea, 0.5% SDS), many of which are within proximity of TRPV2. Among those thousands of quantified proteins, only few changed in response to pharmacological TRPV2 activation, on which we focused our analysis on. Heat maps of quantified proteins show strongly correlated biological sample replicates as well as co-clustering of related protein groups, indicating data reproducibility. Identified proteins fall within related groups with overlapping biological functions (Figure S2B). Principal component analysis of the data shows clustering of replicates, further indicating overall reproducibility of results and similarity of sample replicates (Figure S2C).
A recent paper from our lab highlights how two different pharmacological activators of TRPV2, 2-APB and CBD, use different mechanisms for TRPV2 channel opening, but together have an increased effect on TRPV2’s calcium flux 31. Localized changes in calcium concentration spatiotemporally regulate calcium-mediated signaling events. Therefore, we sought to investigate the proximal proteomic profile of TRPV2 under different pharmacologically active states with different amplitudes of induced TRPV2-mediated calcium flux. Interestingly, we observe substantial differences between the 2-APB-activated and the CBD-activated states in the TRPV2 proximal sub-proteomic data. We identify unique proteins from each separate mode of TRPV2 activation and the combined drug state when both 2-APB and CBD were added.
3.2. CBD-activated TRPV2 proximity-based mass spectrometry identifies known calcium mediators
When we compare TRPV2-APEX MS data from the unstimulated (no drug) state with the CBD-activated state (30 μM CBD applied for 5 minutes), we identify 74 proteins that are significantly increased (fold change ≥ 2; p-value ≤ 0.05, unpaired t-test) in relative abundance within proximity of TRPV2 after activation by CBD; there were no significantly decreased proteins (Figure 1A). Protein class analysis through gene set enrichment analysis (GSEA) of the proteins with increased association to TRPV2 identified gene ontology (GO) term enrichment of the calcium-binding proteins (GO term: PC00060) which accounts for 15.2% of proteins with drug-increased recruitment to TRPV2.
Figure 1.

(A) Volcano plot representing all the proteins identified by CBD-activated or (C) 2-APB activated TRPV2-APEX2 proximity proteomics. Obtained P-values are represented on the Y-axis and the fold change between the no drug condition and pharmacologically stimulated condition is represented in Log2 on the X-axis. Proteins are considered statistically significant if they have a fold change ≥ 2 and a p-value ≤ 0.05. Specific proteins of interest are highlighted and categorized according to the corresponding graph legend. (B) Bubble plot representing the significantly enriched gene ontology terms identified from the proteins with increased association to TRPV2 following activation by CBD and (D) 2-APB. The x-axis represents the -Log10 of the p-value from the false discovery rate (FDR) for each term identified. The size of the bubble correlates to the number of proteins within that term and the color represents the ratio of the proteins identified to belong to a term in the data set over the total annotation count of the terms.
GSEA of the proteins increased in association with TRPV2 shows clustering within Ca2+-dependent molecular functions such as Ca2+-dependent protein binding, Ca2+-dependent phospholipid binding, and calcium ion binding (Figure 1B). The presence of proteins with Ca2+-dependent functions within the activated TRPV2 proximity proteome validated that our system is functional given that TRPV2’s basic molecular function is to shuttle calcium ions into the intracellular space.
In proximity to CBD-activated TRPV2, we identify PKCα, a canonical calcium-binding protein that is known to interact with other members of the TRPV subfamily32. PKCα is a calcium-activated serine-threonine kinase that plays a role in the activation of the Erk1/2 signaling pathway, which is important for TRPV2 phosphorylation2. Additionally, studies of TRPV2 in macrophage phagocytosis show the importance of the PKC family in TRPV2 translocation and clustering at sites of phagocytosis initiation6.
Additionally, one of the top hits identified is an isoform of one of the most widely studied calcium-binding proteins, calmodulin (calmodulin 2, CaM), which is identified as significantly elevated in the CBD-activated state of TRPV2 (Figure 1A). CaM is a calcium-binding protein widely known for its role in facilitating calcium-driven cellular stimulation by acting as a molecular sensor for local calcium spikes and relaying these signals on a protein level through events such as kinase activation33. Another CaM isoform, calmodulin 1, is known to directly bind to the intracellular domain of TRPV1, which shares 50% sequence homology with TRPV234. This isoform has also been suggested to bind to the C-terminal tail of TRPV2.35
In addition to an abundance of calcium-dependent proteins, GSEA identified several clusters of proteins that fall within the category of cell adhesion: cell adhesion mediator activity, cell-cell adhesion mediator activity, and cadherin binding involved cell-cell adhesion (Figure 1B). A recently published paper established a connection between TRPV2 and annexin A6, a member of a calcium-dependent family of adhesion molecules, in the context of cancer cell invasion and migration36. Annexin A1 and A4 are both found to be significantly increased in association with TRPV2 following its activation via CBD (Figure 1A).
The proximal clustering of proteins in adhesion-related molecular classes following TRPV2 activation could provide potential mechanistic insight into the role of TRPV2 given the channel’s role in adhesion-dependent physiologies and pathophysiologies, such as such as neuronal development and cancer metastasis, respectively.
3.3. 2-APB-activated TRPV2 proximity-based mass spectrometry identifies novel proteins dynamics in TRPV2’s molecular neighborhood
In contrast to the CBD-activated data, when we compare the unstimulated to the 2-APB activated (300 μM 2-APB applied for 5 minutes) proteomic profiles of TRPV2, we identify a nearly five times greater number of proteins (330; fold change ≥ 2; p-value ≤ 0.05, unpaired t-test) that have an elevated association with TRPV2 after activation by 2-APB compared to the CBD-activated state (Figure 1C). This difference could be attributed to the larger increase in TRPV2 calcium flux following activation with 2-APB compared to the calcium flux caused by TRPV2 activation by CBD10.
By focusing on the wealth of protein hits identified with increased association to CBD-activated TRPV2, the GSEA analysis found that 3.2% of identified proteins were calcium-binding proteins. Several clusters of proteins with calcium-mediated biological and molecular functions, such as regulation of cytosolic calcium levels, were also enriched in the proteomics data (Figure 1C).
In addition to calcium-binding proteins, we discover that about 9% of the proteins identified belong to the cell adhesion molecule class of proteins (Figure 1D). This is similar to the proteomics data from CBD-activated TRPV2. Proximal to activated TRPV2, we see the enrichment of several protein clusters with biological and molecular functions related to cellular adhesion, such as cell adhesion molecule binding and cell-cell adhesion (Figure 1D).
3.4. Proteomics from 2-APB and CBD dual activation of TRPV2 validates single activator findings
In addition to TRPV2 activation by CBD or 2-APB alone, we also stimulated TRPV2 with CBD and 2-APB together (30 μM CBD and 300 μM 2-APB applied for 5 minutes), which are known to have a synergistic effect on TRPV2’s calcium flux31. This condition identified 844 proteins with statistically significant increased association to TRPV2, which is nearly triple the number of proteins with increased association found in the 2-APB stimulated data (Figure S2D). Several of the proteins identified in the CBD alone data, such as PKCα, calmodulin 2, and annexin A1 and A4, were also identified as significantly increased in association with TRPV2 following activation with both drugs (Figure S2D). Similarly, protein hits from the 2-APB alone proteomics data, such as NCAM1, RCN2, and CNTN1, were also identified in the double drug data (Figure S2D). These findings from the double drug proteomics data validate the localization of TRPV2 with the proteins identified above following TRPV2 activation with each drug alone.
3.5. TRPV2 is preferentially proximal to calcium signaling proteins on cell periphery and neurites
Dually activated TRPV2’s proximity proteomics provided secondary confirmation of TRPV2’s association with the calcium signaling proteins PKCα and calmodulin. To determine if this observed association was due to direct interaction of TRPV2 to PKCα or CaM, TRPV2 was immunoprecipitated from TRPV2-GFP overexpressing PC12 cells and probed for PKCα or CaM. We could not detect PKCα nor CaM in the elution (data not shown) which indicates that this interaction between TRPV2 and these calcium signaling proteins is possibly transient or that the molecules are in close proximity.
The proximal association of TRPV2 and PKCα was validated by traditional immunofluorescence (IF) colocalization quantification (Pearson’s) where it was found that TRPV2 and PKCα colocalize (75%) throughout the cell in WT PC12 cells (Figure S3A, B). Further validation of TRPV2 and PKCα proximal association was confirmed by employing a proximity ligation assay (PLA) coupled with IF (IF-PLA) in WT PC12 cells (Figure 2A). This IF-PLA allows for visual reporting of locations within a fixed cell where TRPV2 and PKCα are within ~40 nm of each other (Figure S3C). Using a pair of probes that contain short, single-stranded complementary DNA fragments that are capable of binding and amplifying within ~40 nm of each other, we target TRPV2 with one probe and PKCα with the other.
Figure 2.

(A) PC12 cells stained with F-actin (green, left) and probed for locations where TRPV2 and PKCα or (D) calmodulin (CaM) are within a 40 nm proximity represented as bright puncta (magenta, middle). The images are then merged (right) to observe localization of the puncta with respect to the cytoskeleton of the cell membrane. (B) Bar graph comparing the PLA spots observed in the control samples and the test samples for PKCα or (E) CaM. (C) Bar graph representing the cellular distribution of the observed PLA puncta for PKCα or (F) CaM.
Visualization of several PLA spots per cell indicates that TRPV2 and PKCα are nearby and are dispersed throughout the cell (Figure 2A, B). The cellular localization of the PLA spots was identified and quantified by employing F-actin staining of the cell membrane and thresholding the images in ImageJ to identify the cell periphery, neurites, and cytosol (Figure S3C). The approximate cellular distribution of the locations where TRPV2 and PKCα are in proximity to each other is determined by dividing the number of spots identified in a defined cellular region by the total number of PLA spots in the cell. TRPV2 and PKCα preferability localized to the cell periphery (41.8%) and neurites (39.6%) as compared to the cytosol (19.6%) (Figure 2C). This preferable colocalization between TRPV2 and PKCα on the cell periphery and neurites could indicate common cellular locations where TRPV2 and PKCα function together.
Calmodulin’s proximal association to TRPV2 was also validated first by traditional immunofluorescence (Pearson’s) where colocalization of TRPV2 and calmodulin are colocalized (74.8%) and are dispersed throughout the cell but show clustering near the cell periphery and in PC12 cell’s neurites (Figure S2). Further validation by PLA in WT PC12 cells confirmed an abundance of TRPV2 and CaM colocalization compared with control samples (Figure 2G). TRPV2 and CaM colocalization throughout the cell is overrepresented at the cell periphery (54.4%) compared to neurites (30.2%) and cytosol (17.6%) (Figure 2H). TRPV2 and CaM proximal colocalization at the cell periphery indicates that the membrane may be a cellular region where TRPV2 and CaM act together.
The identification of the calcium-dependent proteins PKCα and CaM in the CBD-activated TRPV2 molecular environment by proximity proteomics combined with the colocalization analysis of TRPV2 with PKCα or CaM demonstrates robustness of the TRPV2’s proximity proteomic analysis and possibly indicates functional connections between neighboring proteins.
3.6. Neuronal and cellular projection proteins are enriched proximal to activated TRPV2
Despite the lack of neuronal cellular physiology of HEK 293 cells used to generate the APEX-MS proteomics data, several neuronal and cell projection-related protein clusters were identified in the 2-APB activated data (Figure 3A). TRPV2’s dynamic proximal proteomic network also shows co-clustering of proteins found in cellular components such as axon and cell projections (Figure 3A). TRPV2’s established functional role in enhancing the length of outgrowing neurites1,2,37 lead us to focus subsequent analysis on these protein classes. Interestingly, within neuronal-related protein clusters, several cell adhesion molecules with overlapping roles were enriched in the molecular environment of TRPV2 following channel activation.
Figure 3.

(A) Bubble plot representing the significantly enriched gene ontology terms associated with neural development and cellular projections observed in the 2-APB activated TRPV2-APEX2 HEK 293 cells. The x-axis represents the -Log10 of the p-value from the false discovery rate (FDR) for each term identified. The size of the bubble correlates to the number of proteins within that term and the color represents the ratio of the proteins identified to belong to a term in the data set over the total annotation count of the terms. (B) Volcano plot representing all the proteins identified by 2-APB activated TRPV2-APEX2 proximity proteomics in PC12 cells. Obtained P-values are represented on the Y-axis and the fold change between the no drug condition and pharmacologically stimulated condition is represented in Log2 on the X-axis. Proteins are considered statistically significant if they have a fold change ≥ 2 and a p-value ≤ 0.05. Specific proteins of interest are highlighted. (C) PC12 cells stained with F-actin (green, left) and probed for locations where TRPV2 and NCAM or (F) L1CAM are within a 40 nm proximity represented as bright puncta (magenta, middle). The images are then merged (right) to observe localization of the puncta with respect to the cytoskeleton of the cell membrane. (D) Bar graph comparing the PLA spots observed in the control samples and the test samples for NCAM or (G) L1CAM. (E) Bar graph representing the cellular distribution of the observed PLA puncta for NCAM or (H) L1CAM.
Among these cell adhesion molecules, NCAM1 stood out with the greatest increase following activation by 2-APB (Figure 1C). In three biological replicate experiments in HEK 293 cells, NCAM1 reproducibly displayed a significant recruitment to the molecular environment of 2-APB activated TRPV2. Two different isoforms of NCAM1 were identified. As an IgCAM family member, NCAM1 functions as a cell adhesion molecule in neuronal cell lines to modulate neuronal development and neurite outgrowth38,39. NCAM’s role in neurite outgrowth directly depends on calcium signaling pathways21,22.
3.7. 2-APB-activated proximity proteomics in neuronal cell model PC12 identifies IgCAM family members
Preferential colocalization of TRPV2 and PKCα or CaM near the cell periphery and on neurites illuminates the observed enrichment of proteins with neuronal and cell projection-related functions from the proteomics data collected from HEK cells (Figure 3A). These findings led us to narrow our approach and expand proximity proteomic analysis towards TRPV2-APEX in PC12 cells, which are commonly used to study neuronal pathways40–42. The same TRPV2-APEX2 expression construct from previous experiments was used in PC12 cells. The enrichment of neuronal-related proteins as identified by 2-APB stimulation lead us to choose 2-APB for TRPV2 stimulation in PC12 cells with subsequent dynamic proximity proteomics.
To ensure that the PC12 cells obtain neuronal qualities, both 2-APB-activated and unstimulated samples were treated with nerve growth factor (NGF) at 100 ng/mL for three days. Previous work by our lab showed that TRPV2 expression increases in PC12 cells for three days following NGF treatment before slowly tapering off, so this three-day treatment allows neurite outgrowth while still maintaining sufficient TRPV2 expression2.
Principal component analysis of the proteomics data collected in PC12 cells shows co-clustering of sample replicates (Figure S3A). Hierarchical cluster analysis of the obtained proteomics data also indicated reproducible enrichment or depletion of proteins in experimental replicates (Figure S3B). The dendrogram indicates correlation of co-clustering protein groups with possible functional relationships (Figure S3B).
By comparing 2-APB activated to unstimulated TRPV2-proximal proteins in PC12 cells, we identified 74 proteins with an increased association with TRPV2 (Figure 3B). Comparing data from HEK293 and PC12, we found a similar distribution of protein classes (Figure S3C). Specifically, we observed drug-induced enrichment of cell adhesion molecule class proteins in both cell lines.
Similar to 2-APB-activated proteomics data from HEKs, NCAM1 was again identified as a top protein with statistically significant enrichment (Figure 3B, S3D). L1CAM, an IgCAM family member closely related to NCAM1, also displayed increased association with TRPV2 following stimulation with 2-APB in PC12 cells (Figure 3B, S3D). In conjunction with this, GSEA from the 2-APB activated data from HEK 293 cells identified L1CAM interactions as a significant GSEA term (data not shown). Given the crucial role of TRPV2 in neuronal development and neurite outgrowth, both processes of which L1CAM and NCAM1 are important for as well, we aimed at probing for a functional link between TRPV2 and L1CAM/NCAM1.
3.8. TRPV2 colocalizes with L1CAM and NCAM1 in PC12 cells
To determine whether the association identified between TRPV2 and L1CAM and NCAM1 in the proteomics data is due to a physical interaction between TRPV2 and both IgCAMs, we performed immunoprecipitation of TRPV2 from live cells and probed for L1CAM or NCAM1, possibly indicating binding to TRPV2. We could not detect NCAM1 nor L1CAM in the immunoprecipitation of TRPV2 from PC12 cells (data not shown) indicating that a possible interaction between TRPV2 and NCAM1 or L1CAM could be transient.
To validate the proximal association of TRPV2 and IgCAMs, traditional immunofluorescence localization studies of TRPV2 and the two IgCAMs were performed in PC12 cells. In PC12 cells, endogenous TRPV2 is present in diffuse staining patterns in the cytoplasm but is enriched at the cell periphery and in neurites. Other studies report a similar distribution of TRPV2 within neuronal cell lines as well as specific enrichment of TRPV2 at the growth cones of outstretching neurites1,37. L1CAM and NCAM1 have similar staining patterns to TRPV2, with enrichment at the cell periphery and in outstretching neurites (Figure S4). Pearson’s correlation analysis of the colocalization of TRPV2 and NCAM1 indicates that on average slightly more than half (57.1%) of TRPV2 and NCAM1 are colocalized within PC12 cells (Figure S4). Similar values were obtained for the colocalization between TRPV2 and L1CAM in PC12 cells, with an average of about half (49.9%) of the observed TRPV2 and L1CAM being colocalized (Figure S4).
To further validate this association, IF-PLA were performed between TRPV2 and L1CAM or NCAM1. Using IF-PLA of TRPV2 and NCAM1, we observed several locations within the cell where TRPV2 and NCAM1 are proximally located within 40 nm of each other (Figure 3D, E). Using F-actin thresholding to identify the cell membrane, cytosol, and neurites of PC12 cells, the distribution of spots was quantified, and we found 43.5% of TRPV2-NCAM PLA spots localized to neurites, 44.7% localized to the cell periphery, and 11.8% localized to the cytosol (Figure 3F). From this distribution, we conclude that TRPV2 and NCAM1 are colocalized on the cell periphery as well as the in neurites. We also observed several TRPV2-NCAM1 PLA spots in the growth cone of neurites. Our results suggest that TRPV2 and NCAM are likely interacting with each other on the cellular periphery and in neurites.
IF-PLA of TRPV2 and L1CAM in PC12 cells also showed colocalization of TRPV2 and L1CAM (Figure 3F, G). The cellular distribution of TRPV2 and L1CAM PLA puncta is strongly pronounced in the cellular periphery (62.8%), followed by neurites (33.2%), and the cytosol (13%) (Figure 3H). Like NCAM and TRPV2, proximal L1CAM and TRPV2 were also observed in the growth cone of the PC12 cell neurites. Enhanced colocalization of TRPV2 and L1CAM on the cell periphery could indicate localized TRPV2 and L1CAM interaction.
3.9. NCAM1 and L1CAM stimulation with polyclonal antibody induces TRPV2-mediated calcium flux
Like many IgCAMs, NCAM1 and L1CAM initiate signaling following stimulation by specific peptides, antibodies, homophilic and heterophilic protein binding which can induce a variety of signaling pathways specific to the type of stimulation38,43. The binding of specific antibodies or peptides to NCAM1 and L1CAM mimics homophilic binding and induces intracellular calcium flux in neuronal cell lines, which was shown to be crucial for neuronal development signaling of NCAM or L1CAM22,44. In PC12 cells, the addition of polyclonal antibodies (pAbs) against NCAM1 and L1CAM both respectively induce [Ca2+]i flux that is known to be mediated by T- and L-type calcium channels45, as well as TRPC family members46. To determine if TRPV2 plays a role in this NCAM1- and L1CAM-mediated [Ca2+]i flux, a PC12 cell line with TRPV2-GCaMP expression was established, and time-lapse images were obtained following stimulation.
Indeed, addition of NCAM1 pAb at 200 ng/mL or L1CAM pAb at 200 ng/mL both induce TRPV2 activation and [Ca2+]i flux (Figure 4A, B). Compared to TRPV2 activation by 100 μM 2-APB, a direct activator of TRPV2, NCAM1- and L1CAM-mediated TRPV2 activation induced a less robust calcium flux (Figure 4C, E). Rabbit IgG antibodies were included as a control and did not induce TRPV2 activation (Figure 4D, E). The peak intensity time following TRPV2 activation through NCAM1- and L1CAM-stimulated [Ca2+]i flux was delayed when compared to 2-APB activated TRPV2 [Ca2+]i flux (Figure 4F). Together, when comparing to 2-APB activated TRPV2, the reduction in [Ca2+]i flux intensity and the delay in TRPV2’s peak [Ca2+]i flux indicate that NCAM1 and L1CAM pAbs do not directly bind TRPV2, but act through a signaling pathway.
Figure 4.

Calcium flux curves collected from TRPV2-GCaMP PC12 cells stimulated with (A) 200 ng/mL NCAM pAb, (B) 200 ng/mL L1CAM pAb, (C) 300 μM 2-APB, and (D) 100 ng/mL Rabbit IgG (control) were introduced to the TRPV2-GCaMP PC12 cells and the fluorescent signal at 488 was recorded over time. Curves are plotted as the change (Δ) in fluorescent reading at a time point divided by the background fluorescence (F/F0) over the three minutes that the fluorescent calcium signals were recorded. The addition of antibody or drug at 10 seconds is indicated by a red bar on the x-axis. Each line represents a singular region of interest within the TRPV2-GCaMP PC12 cells. Data from at least two biological replicates were included in each calcium flux curve. Calcium flux data was collected using TRPV2-GCaMP PC12 cells. (E) The peak values (Fmax) were obtained from each region of interest selected from the 200 ng/mL NCAM pAb, 200 ng/mL L1CAM pAb, 300 μM 2-APB, and 100 ng/mL Rabbit IgG (control) calcium movies and plotted. (F) The time in seconds of when the peak value (Fmax) for each region of interest was reached was plotted. (G) The peak values (Fmax) obtained for NCAM or L1CAM calcium flux are compared to the Fmax of the staruosporine or Ruthenium red treated samples.
NCAM1 and L1CAM pAb-induced [Ca2+]i flux is mediated by phosphoinositide signaling through PKCα21.Moreover, TRPV2 and PKCα in proximity to each other based on our results (Figure 1A, Figure 2A–C), suggesting a possible functional interaction. To determine if TRPV2’s calcium flux following NCAM1 and L1CAM stimulation is regulated by PKCα or other kinases, we utilized staurosporine (STSP), a broad spectrum kinase inhibitor. STSP was added to TRPV2-GCaMP expressing PC12 cells one hour before stimulation with NCAM1 or L1CAM pAbs. Cells incubated with 100 nM STSP showed a greatly reduced TRPV2 [Ca2+]i flux following stimulation by L1 or NCAM pAb compared to stimulation without kinase inhibition (Figure 4G). These data suggest that kinases, and possibly PKCα, are involved in crosstalk between the NCAM1 or L1CAM and TRPV2 mediated [Ca2+]i flux. Additionally, inhibition of TRPV2 with 50 μM Ruthenium red also displayed greatly reduced TRPV2-mediated calcium flux in response to antibody stimulation indicating that blocking TRPV2 inhibits the observed antibody-induced calcium signal (Figure 4G).
3.10. TRPV2 expression impacts L1CAM and NCAM antibody induced neurite length reduction
With the discovery of TRPV2’s direct involvement in L1CAM and NCAM-mediated intracellular calcium flux, we sought to investigate the role of TRPV2 in L1CAM and NCAM mediated neurite outgrowth. Previous work by our lab and others showed that TRPV2 expression directly affects the length of the outgrowing neurites in PC12 cells and DRG neurons1,2. Cells with overexpression of TRPV2 exhibit longer neurites compared to cells expressing endogenous levels of TRPV2. Conversely, cells with expression of a dominant negative TRPV2 (DN-TRPV2), with mutations to the selectivity filter (E594K and E604K) making it positively charged and preventing calcium cation flux, show greatly reduced neurite length2. This finding was recapitulated in our PC12 cell models with TRPV2 overexpressing PC12 cells having on average 12.4% longer neurites than those with endogenous TRPV2 expression and DN-TRPV2 expressing PC12 cells having on average a 20% reduction in neurite length compared to endogenous TRPV2 expression in WT PC12 cells (Figure 5A).
Figure 5.

(A) This bar graph represents the lengths of the neurite compared over time between WT PC12 cells, TRPV2OE PC12 cells, and DN-TRPV2 PC12 cells. The time scale represents the time in hours after neurites and axons were stripped from the PC12 cells. (B) The neurite lengths of WT PC12 cells, (C) TRPV2OE PC12 cells, or (D) DN-TRPV2 PC12 cells are compared between no stimulation, NCAM polyclonal antibody incubated, and L1CAM polyclonal antibody incubated represented as a bar graph. The time scale represents the time in hours after neurites and axons were stripped from the PC12 cells. Control cells were not given antibody and were only axotomized.
As previously reported, L1CAM and NCAM pAbs have been shown to modulate neuronal development through altering neuronal cell migration or neurite outgrowth, respectively39,47. Incubation with NCAM pAb in mouse muscle tissue that was partially deinnervated showed delayed reinnervation compared to control tissue48. To investigate the impact of the NCAM pAb in the neurite regrowth of WT PC12 cells, PC12 cells were primed with NGF for three days to allow the cells to develop neurites before the cells were stripped from the plate, modeling the axotomy of sympathetic neurons49, and allowed to regrow neurites in the presence or absence of NCAM pAb.
Images of the PC12 cells were collected over 24 hours as the primed neurites rapidly grew back and by comparing the lengths of the neurites between the NCAM pAb stimulated and control cells, we see that the WT PC12 cells that were stimulated with NCAM pAb have slightly shorter neurites (Figure 5B). This effect is more pronounced at earlier time points with an average of 15.3% reduction in neurite length at 3 hours post axotomy and NCAM pAb incubation and an average of 9% decrease at the end of the 24-hour time course (Figure 5B).
To determine if incubation with L1CAM pAb has a similar effect on neurite outgrowth in WT PC12 cells, the neuronal priming and neurite regrowth time course, as described above, was conducted with the L1CAM pAb. Indeed, incubating WT PC12 cells with the pAb for L1CAM reduced neurite length and produced a stronger effect near the beginning of neurite regrowth (Figure 5B). However, this reduction was greater compared to that caused by NCAM pAb. Three hours post axotomy and antibody incubation, the neurites were reduced by 22.9% of the unstimulated WT neurite length, and at 24 hours, the neurite length was reduced by 11.1% compared to unstimulated WT neurite lengths (Figure 5B).
To investigate the connection between TRPV2 and L1CAM or NCAM, neurite regrowth experiments were conducted with PC12 cells that either overexpress TRPV2 (TRPV2OE) or express DN-TRPV2. In PC12 cells with TRPV2OE, incubation with the NCAM pAb induces a greater reduction (20.1% compared to 15.3%) in neurite length compared to the NCAM pAb stimulated WT PC12 cells at 3 hours post pAb incubation (Figure 5C). At 24 hours post pAb incubation, the TRPV2OE PC12 cells displayed neurites that are reduced by 35% compared to TRPV2OE cells that were not stimulated with NCAM pAb (Figure 5C).
Incubation of the L1CAM pAb in TRPV2OE PC12 cells resulted in a 15.7% reduction in neurite length compared to unstimulated TRPV2OE cells at 3 hours post axotomy and antibody stimulation (Figure 5C). This reduction in neurite length was smaller (15.7% compared to 22.9%) compared to the reduction induced by L1CAM stimulation in WT PC12 cells. This difference is likely due to L1CAM and NCAM having similar, but not identical roles in neuronal development50–52. However, L1CAM-stimulated TRPV2OE cells have neurites that are reduced by a similar amount (32.4% compared to 35%) to those with NCAM stimulation at the end of the 24-hour time course, suggesting that L1CAM could influence later stages of neurite outgrowth.
Interestingly, in PC12 cells that express DN-TRPV2, incubation with NCAM pAb influenced neurites to grow longer than control DN-TRPV2 PC12 cells (Figure 5D). 3 hours post axotomy and antibody incubation, the neurite lengths were increased on average by a striking 45.2% compared to unstimulated DN-TRPV2 PC12 cells (Figure 5D). At the end of the 24-hour time course, the NCAM pAb stimulated DN-TRPV2 PC12 cells neurite lengths continued to remain elongated by an average of 36% compared to the unstimulated cells.
L1CAM pAb incubation with DN-TRPV2 PC12 cells also produced a similar increase in neurite length compared to NCAM-stimulated DN-TRPV2 PC12 cells with a 48.7% increase in neurite length at the 3-hour time point (Figure 5D). This effect on enhancing neurite outgrowth remained consistent throughout the 24-hour time course with the neurite length being increased on average by 24.5% compared to DN TRPV2 PC12 cells without antibody stimulation (Figure 5D).
The correlation between the NCAM- or L1CAM-induced TRPV2 [Ca2+]I flux with the levels of TRPV2 impacting the length of outgrowing neurites under NCAM or L1CAM stimulation indicates that TRPV2 could play a direct role in NCAM- and L1CAM-mediated neurite outgrowth.
4. Discussion
In this study, we leveraged APEX2-MS proximity labeling proteomics to identify and quantify the dynamics of proteins in the molecular neighborhood of a TRP channel. The wealth of proteins that were identified as statistically significant changers (fold change ≥ 2; p-value ≤ 0.05) in association with TRPV2 after activation provides a rich candidate set of proteins possibly involved in eliciting cellular responses downstream of TRPV2 activation. In this study we identified about 400 proteins displaying different behavior in activation-induced proximity of TRPV2, comparing 2-APB and CBD activation. Despite the lack of specificity for these TRPV2 pharmacological activators, we used drug concentrations near the EC50 of 2-APB (EC50 ≈ 100 μM, used 300 μM) and CBD (EC50 ≈ 3 μM, used 30 μM)10 to decrease the likelihood of off-target effects. Clusters of enriched proteins contain mediators of calcium signaling, validating the method. TRPV2, an ion channel known to produce a [Ca2+]i flux upon activation, and mediators of calcium signaling such as CaM and PKCα are all regulated by spatial protein dynamics 53,54.
Calmodulin is one of the most widely studied proteins in the context of calcium signaling and is known to regulate TRP channel family members through binding34. Although we did not observe a physical interaction between CaM and TRPV2 by co-IP experiments, this does not exclude possible transient physical interactions, especially given the described binding of TRPV2’s sensitizing C-terminal tail binding to CaM35. The high degree of colocalization observed between TRPV2 and CaM by traditional IF experiments shows that CaM is typically localized near calcium ion channels, like TRPV2, so that it can efficiently initiate signaling induced by spatially and temporally concentrated calcium ions. In addition, the identification of the CaM-stimulated kinase CAMKIIδ by proximity proteomics also indicates that key players like CaM and others could be regulated as a consequence of TRPV2’s [Ca2+]i flux upon channel activation. Calcium flux and CaM activation possibly regulate other kinases like PKCα which was also seen to recruited to activated TRPV2 and in dependence of activation.
PKCα is a classical PKC isoform that acts as a serine-threonine protein kinase to phosphorylate a wide array of proteins to regulate their functions55. Several signaling cascades such as NF-κB and ERK are activated following PKCα stimulation and given that TRPV2 is known to be phosphorylated by Erk1/22, we observed a direct connection between PKCα proximity and TRPV2 channel calcium signaling. PKCα is known to phosphorylate other members of the TRP channel subfamily including the thermoTRP family member TRPV132. Given the importance of kinase function in our calcium signaling data, where under broad kinase activity suppression, the IgCAM polyclonal antibody-driven TRPV2 [Ca2+]i flux is greatly reduced, a direct phosphorylation of TRPV2 by PKCα is a hypothesis that can be directly tested in future studies.
Proteins involved in cell adhesion were repeatedly enrichment in proximal of TRPV2. TRPV2’s connection to cell adhesion molecules, specifically annexin A6, a calcium-dependent cell adhesion molecule, was recently established in the context of cancer cell migration36. In the dually activated proximity proteomics data, annexin A6 is identified in proximity to activated TRPV2, further supporting a connection of both proteins. In the CBD-activated proximity proteomic dataset, other annexin family members, annexin A1 and A4, were identified as statistically significant in their increased association with TRPV2. Our proximity proteomics data suggests that TRPV2 could associate with other annexin family members in addition to annexin A6.
Cellular adhesion and TRPV2 are both relevant to several physiological events such as cancer migration56, phagocytosis57, and neuronal development18. NCAM1 displayed a statistically significant increase in proximity to TRPV2 following activation by 2-APB in three biological replicates in HEK 293 cells (data not shown). The robust enrichment of proteins involved in neuronal development and cell projection organization led us to further investigate these findings in model cell line for neuronal development. PC12 have been extensively used to study neuronal development and involved pathways 41,42 as well as the role of TRPV2 in PC12 neurite outgrowth2,37. Repeated and statistically significant identification of NCAM1 in 2-APB activated TRPV2-APEX2 proximity proteomics of PC12 cells substantiated NCAM1 as relevant target protein further.
Neural cell adhesion molecule 1, also known as CD56, is a cell adhesion molecule that plays a role in several cellular processes including cancer migration, neurite outgrowth, and natural killer cell activation58–60. NCAM1’s role in neurite outgrowth is known to specifically depend on calcium signaling as well as activated calmodulin binding39,61. This calcium dependency for neurite outgrowth was also required for a close IgCAM family member of NCAM1, L1CAM, that was recruited to 2-APB activated TRPV2 in PC12 cells22. Both identified members of the IgCAM family are known to induce an [Ca2+]i flux when stimulated with respective polyclonal antibodies21,22. Previous studies identified the role of L- and T-type calcium channels45, as well as the more recent finding of TRPC channels involved in NCAM-induced calcium signaling46.
The observation of TRPV2’s involvement in NCAM or L1CAM pAb-induced calcium flux through the generation of PC12 cells with TRPV2-GCaMP indicated a direct molecular signaling pathway between TRPV2 and NCAM or L1CAM (Figure 4A). The TRPV2 [Ca2+]i flux observed was decreased compared to 2-APB stimulation and our results suggest that this is due to the polyclonal antibodies causing an indirect activation of TRPV2, while 2-APB is a direct activator of TRPV2 and produces a strong [Ca2+]i flux. The lag in peak time (Figure 4B) observed when comparing 2-APB activation and the polyclonal antibody-stimulated TRPV2 activation can possibly be attributed to secondary signaling pathways that are triggered for the NCAM or L1CAM pAb to induce calcium flux. We found that broad kinase inhibition severely limits the calcium flux produced by TRPV2 following the stimulation of NCAM and L1CAM with their respective pAbs (Figure 4C). The additional time it takes for the kinase-activated and downstream pathways to induce TRPV2 [Ca2+]i flux may explain the observed lag in peak calcium flux times. One limitation to this study is the pan-kinase inhibition induced by the commonly used staurosporine for inhibition of phosphorylation-dependent signaling.
Previous studies displaying the impact of TRPV2 expression and activity in neurite development and extension were recapitulated by comparing neurite lengths of PC12 cells expressing varying amounts of functional TRPV2 where it was found that higher expression of TRPV2 increases neurite length and the DN mutant decreases neurite length in PC12 cells (Figure 5A). It was observed that NCAM pAbs induce a delay in reinnervating neurites following injury from ex vivo mouse DRG neurons48. We sought to determine if this effect is recapitulated in WT PC12 cells which express an endogenous level of the TRPV2 ion channel. To model this, we removed the axons and neurites from the PC12 cells that were treated for three days with NGF to induce neuronal injury. Indeed, we observed a reduction in neurite length following NCAM polyclonal antibody incubation in the WT PC12 cells (Figure 5B). To determine the L1CAM antibody’s effect on neurite outgrowth, we repeated the axotomy experiment but incubated with an anti-L1CAM antibody and observed an even greater reduction in neurite lengths in the WT PC12 cells than with the NCAM antibody (Figure 5B). Hence our results suggest that these polyclonal antibodies for the IgCAMs modulate similar pathways through which they function. The neurite reduction effect had a greater impact at earlier time points in WT PC12 cells, suggesting that the cells recovered from the pAb stimulation and induced calcium flux.
To determine if TRPV2 was playing a role in the impacted neurite lengths, we created two stable PC12 cell lines, one with increased TRPV2 expression and the other with expression of the dominant negative mutant of the channel with severely reduced calcium flux. We found that in PC12s with TRPV2OE, the impact of the NCAM pAb caused neurites to outgrow even shorter than in the WT cells. In TRPV2OE PC12 cells, the greatest effect in shortening of the neurite was seen at the latest time point (35% at 24h) which indicates that the impact of this antibody is not short-lived in cells with increased TRPV2 expression (Figure 5C). The L1CAM pAb also induced shortening of the neurite in TRPV2OE PC12 cells, but to a similar extent seen in the WT at earlier time points (Figure 5C). At later time points, the neurite lengths were reduced to a similar amount compared to those stimulated with the NCAM pAb in TRPV2OE cells. Our results suggest the difference in impact and the timing of increasing impact is due to similar but diverging roles of NCAM and L1CAM in neurite outgrowth50,51.
Interestingly, in PC12 cells that express DN-TRPV2, incubation with L1CAM or NCAM pAb influences neurites to grow to increased lengths compared to control DN-TRPV2 PC12 cells (Figure 5D). Given that DN-TRPV2 expressing PC12 cells form neurites that are lacking in length without any stimulation, the increase in neurite length with L1CAM or NCAM stimulation was striking. At the end of the 24-hour time course, NCAM-stimulated DN-TRPV2 PC12 cells have neurite lengths that are nearly the same size as the TRPV2OE PC12 cell line control cells (Figure 5D). Our results suggest that this increase in neurite outgrowth may be due to the activation of other calcium channels, possibly L- and T-type as well as TRPC channels, which compensate for the lack of functional TRPV2 expressed.
Fluctuations in local calcium concentrations and cellular calcium gradients are key for regulating several vital physiological functions, in particular cell adhesion and neurite outgrowth62. It has been shown that depending on the concentration of local calcium, underlying signaling pathways differ. For cell motility high calcium concentrations are associated with the retracting cell end and lower calcium concentrations are associated with the leading edge of migrating cells63. These fluctuations in calcium concentration are directly linked to cytoskeletal stability of the immediate cellular region with low calcium required for F-actin bundling and high calcium required for disassembly of F-actin bundles64,65. Similarly, the collapse of rigid cytoskeletal microtubules occurs at high concentrations of intracellular calcium66,67.
Neurite growth depends on the regulation and organization of cytoskeletal components like F-actin and microtubules where local fluctuations in calcium are known to regulate the cytoskeleton and growth cone motility66. In cells that are attached to an extracellular matrix, like HEK and PC12 cells, the cytoskeleton is directly bound to focal adhesion sites which are classified as areas with high cell adhesion molecule localization. Our studies suggest that the immediate and localized changes in calcium flux caused by NCAM- or L1CAM-induced TRPV2 calcium flux directly impact cytoskeletal stability of the outgrowing neurite and that this underlies the greater effect on neurite length seen in the PC12 cells that overexpress TRPV2.
Investigating the connection between TRPV2 and NCAM in other cell types such as CD56+ NK cells, where TRPV2 is highly expressed compared to other cell types68, would be informative given TRPV2’s role in immune responses and initiation of phagocytosis 5,6. The calcium-dependent ectodomain cleavage of L1CAM and NCAM have been directly linked to cancer malignancy and cancer cell motility69–72 where TRPV2 could also be playing a role through modulating matrix metalloproteases like ADAM10 and ADAM17, both of which were identified in the 2-APB activated TRPV2-APEX2 data 73–75.
The abundance of relevant protein hits quantified dynamically in this TRPV2-APEX2 proximity proteomic study and the newly observed connection between TRPV2 and cell adhesion, specifically with the identified IgCAMs and the linked connection to neurite outgrowth set the foundation for further studies on the intricate connection of TRPV2 calcium signaling and cellular projections via modulated functions of cellular adhesion factors.
5. Conclusion
Overall, our investigation into the dynamic proximal proteome of TRPV2 has provided valuable insights into the intricate interplay between TRPV2, calcium signaling proteins, and cell adhesion molecules. The functional connections we established between TRPV2 and key players in calcium signaling, CaM and PKCα (Figure 1A), and cell adhesion, NCAM and L1CAM (Figure 1C), underscore the significance of TRPV2 in orchestrating cellular response. The enrichment of the calcium signaling proteins CaM and PKCα proximal to activated TRPV2 demonstrated the rapid localization of effectors known to influence TRPV2-mediated [Ca2+]I flux2,35. Our findings, supported by preferential colocalization patterns of TRPV2 with the calcium signaling molecules near the peripheral cell membrane and neurites in PC12 cells (Figure 2A-F) suggests specific cellular regions where TRPV2 is activated, leading to a cascade of [Ca2+]I flux that mediates pathway activation. Furthermore, the observed preferential colocalization of TRPV2 with the cell adhesion molecules NCAM and L1CAM near the cell periphery and neurites in PC12 cells (Figure 3C–H) implies interaction between TRPV2 and these cell adhesion molecules to impact physiology at the cell periphery and neurites. Notably, our studies found that the activation of NCAM or L1CAM induces a kinase-dependent TRPV2 [Ca2+]I flux (Figure 4A–C) establishing a functional link between these cell adhesion molecules and TRPV2 activation. We demonstrated a direct connection between TRPV2’s [Ca2+]I flux and NCAM or L1CAM stimulated neurite outgrowth modulation (Figure 5B–D). This provided further evidence of the regulatory role played by TRPV2, particularly in the context of neuronal development and neurite outgrowth. Our study not only unveils the dynamic proximal proteome of TRPV2 but also elucidates the functional consequences of its interaction with calcium signaling and cell adhesion molecules. Taken together, these findings contribute to a deeper understanding of the molecular mechanisms underlying TRPV2-mediated cellular responses and open the door for future research in the field of ion channel regulation and cell adhesion-driven physiology.
Supplementary Material
Highlights.
Calcium signaling proteins CaM and PKCα are enriched near activated TRPV2
GSEA reveals proximal enrichment in cell adhesion and cell projection proteins
IgCAM family members NCAM1 and L1CAM enriched near activated TRPV2
NCAM or L1CAM activation induces PKCα-dependent TRPV2 [Ca2+]I flux
TRPV2 regulates NCAM or L1CAM modulated neurite outgrowth
Acknowledgements
We thank members of the Moissenkova-Bell lab for prosperous discussions.
Funding
This study was supported by grants from the National Institute of Health: Maximizing Investigator’s Research Award (MIRA) grant (R35GM144120 to V.M.B.). This work was conducted with support from the Cancer Prevention and Research Institute of Texas, grant RR220032, to M. K. who is a CPRIT Scholar in Cancer Research.
Abbreviations
- [Ca2+]i
intracellular calcium
- 2-APB
2-aminoethyldiphenyl borate
- APEX2
ascorbic acid peroxidase 2
- CBD
cannabidiol
- GO
gene ontology
- GSEA
gene set enrichment analysis
- HEK
human embryonic kidney
- IF
immunofluorescence
- IgCAM
immunoglobulin superfamily of cell adhesion molecules
- L1CAM
L1 cell adhesion molecule
- MS
mass spectrometry
- NCAM
neural cell adhesion molecule
- PC12
pheochromocytoma-12
- PKCα
protein kinase C-α
- PLA
proximity ligation assay
- STSP
staurosporine
- TMT
tandem mass tag
- TRPV2
transient receptor potential vanilloid type 2
Footnotes
Declaration of competing interests
The authors have no competing interests to declare.
Declarations of interest: none.
Publisher's Disclaimer: This is a PDF file of an unedited manuscript that has been accepted for publication. As a service to our customers we are providing this early version of the manuscript. The manuscript will undergo copyediting, typesetting, and review of the resulting proof before it is published in its final form. Please note that during the production process errors may be discovered which could affect the content, and all legal disclaimers that apply to the journal pertain.
References
- 1.Shibasaki K, Murayama N, Ono K, Ishizaki Y. & Tominaga M. TRPV2 Enhances Axon Outgrowth through Its Activation by Membrane Stretch in Developing Sensory and Motor Neurons. Journal of Neuroscience 30, 4601–4612 (2010). [DOI] [PMC free article] [PubMed] [Google Scholar]
- 2.Cohen MR et al. Nerve Growth Factor Regulates Transient Receptor Potential Vanilloid 2 via Extracellular Signal-Regulated Kinase Signaling To Enhance Neurite Outgrowth in Developing Neurons. Mol Cell Biol 35, 4238–4252 (2015). [DOI] [PMC free article] [PubMed] [Google Scholar]
- 3.Kato S. et al. TRPV2 Promotes Cell Migration and Invasion in Gastric Cancer via the Transforming Growth Factor-β Signaling Pathway. Ann Surg Oncol 1–13 (2021) doi: 10.1245/S10434-021-11132-5/TABLES/2. [DOI] [PubMed] [Google Scholar]
- 4.Oulidi A. et al. TRPV2 Mediates Adrenomedullin Stimulation of Prostate and Urothelial Cancer Cell Adhesion, Migration and Invasion. PLoS One 8, e64885 (2013). [DOI] [PMC free article] [PubMed] [Google Scholar]
- 5.Lévêque M. et al. Phagocytosis depends on TRPV2-mediated calcium influx and requires TRPV2 in lipids rafts: Alteration in macrophages from patients with cystic fibrosis. Sci Rep 8, (2018). [DOI] [PMC free article] [PubMed] [Google Scholar]
- 6.Link TM et al. TRPV2 has a pivotal role in macrophage particle binding and phagocytosis. Nat Immunol 11, 232–239 (2010). [DOI] [PMC free article] [PubMed] [Google Scholar]
- 7.Iwata Y, Katayama Y, Okuno Y. & Wakabayashi S. Novel inhibitor candidates of TRPV2 prevent damage of dystrophic myocytes and ameliorate against dilated cardiomyopathy in a hamster model. Oncotarget 9, 14042–14057 (2018). [DOI] [PMC free article] [PubMed] [Google Scholar]
- 8.Fricke TC et al. Oxidation of methionine residues activates the high-threshold heat-sensitive ion channel TRPV2. Proc Natl Acad Sci U S A 116, 24359–24365 (2019). [DOI] [PMC free article] [PubMed] [Google Scholar]
- 9.Mo X. et al. Tyrosine phosphorylation tunes chemical and thermal sensitivity of TRPV2 ion channel. Elife 11, (2022). [DOI] [PMC free article] [PubMed] [Google Scholar]
- 10.Pumroy RA et al. Structural insights into TRPV2 activation by small molecules. Nature Communications 2022 13:1 13, 1–12 (2022). [DOI] [PMC free article] [PubMed] [Google Scholar]
- 11.Pumroy RA et al. Molecular mechanism of TRPV2 channel modulation by cannabidiol. (2019) doi: 10.7554/eLife.48792.001. [DOI] [PMC free article] [PubMed] [Google Scholar]
- 12.Hisanaga E. et al. Regulation of Calcium-Permeable TRPV2 Channel by Insulin in Pancreatic β-Cells. Diabetes 58, 174 (2009). [DOI] [PMC free article] [PubMed] [Google Scholar]
- 13.Martinsen A, Dessy C. & Morel N. Regulation of calcium channels in smooth muscle: New insights into the role of myosin light chain kinase. 10.4161/19336950.2014.950537 8, 402–413 (2014). [DOI] [PMC free article] [PubMed] [Google Scholar]
- 14.Lehne F. & Bogdan S. Getting cells into shape by calcium-dependent actin cross-linking proteins. Frontiers in Cell and Developmental Biology vol. 11 Preprint at 10.3389/fcell.2023.1171930 (2023). [DOI] [PMC free article] [PubMed] [Google Scholar]
- 15.Clapham DE Calcium Signaling. Cell 131, 1047–1058 (2007). [DOI] [PubMed] [Google Scholar]
- 16.Hung V. et al. Spatially resolved proteomic mapping in living cells with the engineered peroxidase APEX2. Nat Protoc 11, 456–475 (2016). [DOI] [PMC free article] [PubMed] [Google Scholar]
- 17.Zinn K. & Özkan E. Neural immunoglobulin superfamily interaction networks. Current Opinion in Neurobiology vol. 45 99–105 Preprint at 10.1016/j.conb.2017.05.010 (2017). [DOI] [PMC free article] [PubMed] [Google Scholar]
- 18.Moreland T. & Poulain FE To Stick or Not to Stick: The Multiple Roles of Cell Adhesion Molecules in Neural Circuit Assembly. Frontiers in Neuroscience vol. 16 Preprint at 10.3389/fnins.2022.889155 (2022). [DOI] [PMC free article] [PubMed] [Google Scholar]
- 19.Ditlevsen DK, Povlsen GK, Berezin V. & Bock E. NCAM-induced intracellular signaling revisited. J Neurosci Res 86, 727–743 (2008). [DOI] [PubMed] [Google Scholar]
- 20.Tagliavacca L, Colombo F, Racchetti G. & Meldolesi J. L1CAM and its cell-surface mutants: New mechanisms and effects relevant to the physiology and pathology of neural cells. J Neurochem 124, 397–409 (2013). [DOI] [PMC free article] [PubMed] [Google Scholar]
- 21.Schuch U, Martin, Lohse J. & Schachner M. Neural Cell Adhesion Molecules Influence Second Messenger Systems. Neuron vol. 3 (1989). [DOI] [PubMed] [Google Scholar]
- 22.von Bohlen und Halbach F, Taylor J. & Schachner M. Cell Type-specific Effects of the Neural Adhesion Molecules L1 and N-CAM on Diverse Second Messenger Systems. European Journal of Neuroscience 4, 896–909 (1992). [DOI] [PubMed] [Google Scholar]
- 23.Kalocsay M. APEX peroxidase-catalyzed proximity labeling and multiplexed quantitative proteomics. in Methods in Molecular Biology vol. 2008 41–55 (Humana Press Inc., 2019). [DOI] [PubMed] [Google Scholar]
- 24.Rappsilber J, Mann M. & Ishihama Y. Protocol for micro-purification, enrichment, pre-fractionation and storage of peptides for proteomics using StageTips. Nat Protoc 2, 1896–1906 (2007). [DOI] [PubMed] [Google Scholar]
- 25.Schmidt G. & Wittinghofer A. Priming of PC12 cells for semiquantitative microinjection studies involving Ras. FEBS Lett 184–188 (2000). [DOI] [PubMed] [Google Scholar]
- 26.Benowitz LI & Greene LA Nerve Growth Factor in the Goldfish Brain: Biological Assay Studies Using Pheochromocytoma Cells. Brain Research vol. 162 (1979). [DOI] [PubMed] [Google Scholar]
- 27.Lam SS et al. Directed evolution of APEX2 for electron microscopy and proximity labeling. Nat Methods 12, 51–54 (2014). [DOI] [PMC free article] [PubMed] [Google Scholar]
- 28.Fazal FM et al. Atlas of Subcellular RNA Localization Revealed by APEX-Seq. Cell 178, 473–490.e26 (2019). [DOI] [PMC free article] [PubMed] [Google Scholar]
- 29.Kothapalli N. et al. Biological Functions of Biotinylated Histones ⋆. [DOI] [PMC free article] [PubMed] [Google Scholar]
- 30.Filenko NA et al. The role of histone H4 biotinylation in the structure of nucleosomes. PLoS One 6, (2011). [DOI] [PMC free article] [PubMed] [Google Scholar]
- 31.Protopopova AD et al. TRPV2 interaction with small molecules and lipids revealed by cryo-EM. doi: 10.1101/2020.08.10.242008. [DOI] [Google Scholar]
- 32.Mandadi S, Armati PJ & Roufogalis BD Protein kinase C modulation of thermo-sensitive transient receptor potential channels: Implications for pain signaling. Journal of Natural Science, Biology and Medicine vol. 2 13–25 Preprint at 10.4103/0976-9668.82311 (2011). [DOI] [PMC free article] [PubMed] [Google Scholar]
- 33.Aletta JM, Selbert MA, Nairn AC & Edelman AM Activation of a Calcium-Calmodulin-dependent Protein Kinase I Cascade in PC12 Cells. Journal of Biological Chemistry 271, 20930–20934 (1996). [DOI] [PubMed] [Google Scholar]
- 34.Numazaki M. et al. Structural determinant of TRPV1 desensitization interacts with calmodulin. Proc Natl Acad Sci U S A 100, 8002 (2003). [DOI] [PMC free article] [PubMed] [Google Scholar]
- 35.Holakovska B, Grycova L, Bily J. & Teisinger J. Characterization of calmodulin binding domains in TRPV2 and TRPV5 C-tails. Amino Acids 40, 741–748 (2011). [DOI] [PubMed] [Google Scholar]
- 36.Wang M. et al. ANXA6/TRPV2 axis promotes lymphatic metastasis in head and neck squamous cell carcinoma by inducing autophagy. Exp Hematol Oncol 12, 43 (2023). [DOI] [PMC free article] [PubMed] [Google Scholar]
- 37.Sugio S, Nagasawa M, Kojima I, Ishizaki Y. & Shibasaki K. Transient receptor potential vanilloid 2 activation by focal mechanical stimulation requires interaction with the actin cytoskeleton and enhances growth cone motility. FASEB Journal 31, 1368–1381 (2017). [DOI] [PubMed] [Google Scholar]
- 38.Soroka V. et al. Induction of Neuronal Differentiation by a Peptide Corresponding to the Homophilic Binding Site of the Second Ig Module of the Neural Cell Adhesion Molecule. Journal of Biological Chemistry 277, 24676–24683 (2002). [DOI] [PubMed] [Google Scholar]
- 39.Kleene R. et al. NCAM-Induced Neurite Outgrowth Depends on Binding of Calmodulin to NCAM and on Nuclear Import of NCAM and fak Fragments. Journal of Neuroscience 30, 10784–10798 (2010). [DOI] [PMC free article] [PubMed] [Google Scholar]
- 40.Wu CL et al. Interplay between cell migration and neurite outgrowth determines SH2B1β-enhanced neurite regeneration of differentiated PC12 cells. PLoS One 7, (2012). [DOI] [PMC free article] [PubMed] [Google Scholar]
- 41.Zhang Z. et al. Release mode of large and small dense-core vesicles specified by different synaptotagmin isoforms in PC12 cells. Mol Biol Cell 22, 2324–2336 (2011). [DOI] [PMC free article] [PubMed] [Google Scholar]
- 42.Hu R. et al. A novel method of neural differentiation of PC12 cells by using Opti-MEM as a basic induction medium. Int J Mol Med 41, 195–201 (2018). [DOI] [PMC free article] [PubMed] [Google Scholar]
- 43.Chu C, Gao Y, Lan X, Thomas A. & Li S. NCAM Mimetic Peptides: Potential Therapeutic Target for Neurological Disorders. Neurochem Res 43, 1714–1722 (2018). [DOI] [PubMed] [Google Scholar]
- 44.Schuch U, Martin, Lohse J. & Schachner M. Neural Cell Adhesion Molecules Influence Second Messenger Systems. Neuron vol. 3 (1989). [DOI] [PubMed] [Google Scholar]
- 45.Kiryushko D, Korshunova I, Berezin V, Bock E. & Bronner-Fraser M. Neural Cell Adhesion Molecule Induces Intracellular Signaling via Multiple Mechanisms of Ca 2 Homeostasis. Mol Biol Cell 17, 2278–2286 (2006). [DOI] [PMC free article] [PubMed] [Google Scholar]
- 46.Amores-Bonet L, Kleene R, Theis T. & Schachner M. Interactions between the Polysialylated Neural Cell Adhesion Molecule and the Transient Receptor Potential Canonical Channels 1, 4, and 5 Induce Entry of Ca2+ into Neurons. Int J Mol Sci 23, (2022). [DOI] [PMC free article] [PubMed] [Google Scholar]
- 47.Rathjen FG & Schachner M. Immunocytological and biochemical characterization of a new neuronal cell surface component (L1 antigen) which is involved in cell adhesion. EMBO J 3, 1–10 (1984). [DOI] [PMC free article] [PubMed] [Google Scholar]
- 48.Langenfeld-Oster B, Faissner A, Irintchev A. & Wernig A. Polyclonal Antibodies against NCAM and Tenascin Delay Endplate Reinnervation. Journal of Neurocytology vol. 23 (1994). [DOI] [PubMed] [Google Scholar]
- 49.Schreiber RC, Boeshore KL, Laube G, Veh RW & Zigmond RE Polyamines increase in sympathetic neurons and non-neuronal cells after axotomy and enhance neurite outgrowth in nerve growth factor-primed PC12 cells. Neuroscience 128, 741–749 (2004). [DOI] [PubMed] [Google Scholar]
- 50.Takei K. et al. The Neural Cell Adhesion Molecules L1 and NCAM-180 Act in Different Steps of Neurite Outgrowth. (1999). [DOI] [PMC free article] [PubMed] [Google Scholar]
- 51.Schmid RS & Maness PF L1 and NCAM adhesion molecules as signaling coreceptors in neuronal migration and process outgrowth. Current Opinion in Neurobiology vol. 18 245–250 Preprint at 10.1016/j.conb.2008.07.015 (2008). [DOI] [PMC free article] [PubMed] [Google Scholar]
- 52.Duncan BW, Murphy KE & Maness PF Molecular Mechanisms of L1 and NCAM Adhesion Molecules in Synaptic Pruning, Plasticity, and Stabilization. Frontiers in Cell and Developmental Biology vol. 9 Preprint at 10.3389/fcell.2021.625340 (2021). [DOI] [PMC free article] [PubMed] [Google Scholar]
- 53.Mehta S. et al. Calmodulin-controlled spatial decoding of oscillatory Ca2+ signals by calcineurin. Elife 3, 1–22 (2014). [DOI] [PMC free article] [PubMed] [Google Scholar]
- 54.Lipp P. & Reither G. Protein kinase C: The ‘Masters’ of calcium and lipid. Cold Spring Harb Perspect Biol 3, 1–17 (2011). [DOI] [PMC free article] [PubMed] [Google Scholar]
- 55.Singh RK et al. Protein kinase C-α and the regulation of diverse cell responses. Biomolecular Concepts vol. 8 143–153 Preprint at 10.1515/bmc-2017-0005 (2017). [DOI] [PubMed] [Google Scholar]
- 56.Zhou J, Yi Q. & Tang L. The roles of nuclear focal adhesion kinase (FAK) on Cancer: A focused review. Journal of Experimental and Clinical Cancer Research 38, 1–11 (2019). [DOI] [PMC free article] [PubMed] [Google Scholar]
- 57.Sun H, Zhi K, Hu L. & Fan Z. The Activation and Regulation of β2 Integrins in Phagocytes and Phagocytosis. Frontiers in Immunology vol. 12 Preprint at 10.3389/fimmu.2021.633639 (2021). [DOI] [PMC free article] [PubMed] [Google Scholar]
- 58.Cottini F. et al. Redefining CD56 as a Biomarker and Therapeutic Target in Multiple Myeloma. Molecular Cancer Research 20, 1083–1095 (2022). [DOI] [PubMed] [Google Scholar]
- 59.Beggs HE, No PS & Maness PE NCAM-Dependent Neurite Outgrowth Is Inhibited in Neurons from Fyn-Minus Mice. [DOI] [PMC free article] [PubMed] [Google Scholar]
- 60.Van Acker HH, Capsomidis A, Smits EL & Van Tendeloo VF CD56 in the immune system: More than a marker for cytotoxicity? Front Immunol 8, 892 (2017). [DOI] [PMC free article] [PubMed] [Google Scholar]
- 61.Ronn LCB, Dissing S, Holm A, Berezin V. & Bock E. Increased intracellular calcium is required for neurite outgrowth induced by a synthetic peptide ligand of NCAM. FEBS Lett 518, 60–66 (2002). [DOI] [PubMed] [Google Scholar]
- 62.Sheng L, Leshchyns’Ka I. & Sytnyk V. Cell adhesion and intracellular calcium signaling in neurons. Cell Communication and Signaling vol. 11 94 Preprint at 10.1186/1478-811X-11-94 (2013). [DOI] [PMC free article] [PubMed] [Google Scholar]
- 63.Hammad AS & Machaca K. Store Operated Calcium Entry in Cell Migration and Cancer Metastasis. Cells 10, (2021). [DOI] [PMC free article] [PubMed] [Google Scholar]
- 64.Hepler PK The cytoskeleton and its regulation by calcium and protons. Plant Physiology vol. 170 3–22 Preprint at 10.1104/pp.15.01506 (2016). [DOI] [PMC free article] [PubMed] [Google Scholar]
- 65.Schwebach CL, Agrawal R, Lindert S, Kudryashova E. & Kudryashov DS The Roles of Actin-Binding Domains 1 and 2 in the Calcium-Dependent Regulation of Actin Filament Bundling by Human Plastins. J Mol Biol 429, 2490–2508 (2017). [DOI] [PubMed] [Google Scholar]
- 66.Gasperini RJ et al. How does calcium interact with the cytoskeleton to regulate growth cone motility during axon pathfinding? Molecular and Cellular Neuroscience vol. 84 29–35 Preprint at 10.1016/j.mcn.2017.07.006 (2017). [DOI] [PubMed] [Google Scholar]
- 67.O’Brien ET, Salmon ED & Erickson HP How calcium causes microtubule depolymerization. Cell Motil Cytoskeleton 36, 125–135 (1997). [DOI] [PubMed] [Google Scholar]
- 68.Su AI et al. A Gene Atlas of the Mouse and Human Protein-Encoding Transcriptomes. www.ncbi.nih.govPubmed (2004). [DOI] [PMC free article] [PubMed] [Google Scholar]
- 69.Gutwein P. et al. Cleavage of L1 in Exosomes and Apoptotic Membrane Vesicles Released from Ovarian Carcinoma Cells. http://aacrjournals.org/clincancerres/article-pdf/11/7/2492/1962377/2492-2501.pdf. [DOI] [PubMed] [Google Scholar]
- 70.Doberstein K. et al. L1CAM is required for early dissemination of fallopian tube carcinoma precursors to the ovary. Commun Biol 5, 1362 (2022). [DOI] [PMC free article] [PubMed] [Google Scholar]
- 71.Diestel S, Hinkle CL, Schmitz B. & Maness PF NCAM140 stimulates integrin-dependent cell migration by ectodomain shedding. J Neurochem 95, 1777–1784 (2005). [DOI] [PubMed] [Google Scholar]
- 72.Borght A. Vander et al. The 180 splice variant of NCAM—containing exon 18—is specifically expressed in small cell lung cancer cells. Transl Lung Cancer Res 7, 376 (2018). [DOI] [PMC free article] [PubMed] [Google Scholar]
- 73.Gutwein P. et al. ADAM10-mediated cleavage of L1 adhesion molecule at the cell surface and in released membrane vesicles. The FASEB journal : official publication of the Federation of American Societies for Experimental Biology 17, 292–294 (2003). [DOI] [PubMed] [Google Scholar]
- 74.Kalus I, Bormann U, Mzoughi M, Schachner M. & Kleene R. Proteolytic cleavage of the neural cell adhesion molecule by ADAM17/TACE is involved in neurite outgrowth. J Neurochem 98, 78–88 (2006). [DOI] [PubMed] [Google Scholar]
- 75.Brennaman LH, Moss ML & Maness PF EphrinA/EphA-induced ectodomain shedding of neural cell adhesion molecule regulates growth cone repulsion through ADAM10 metalloprotease. J Neurochem 128, 267–279 (2014). [DOI] [PMC free article] [PubMed] [Google Scholar]
Associated Data
This section collects any data citations, data availability statements, or supplementary materials included in this article.