

Abstract
Background
Flavonoids are polyphenolic compounds that are distributed widely in the plant kingdom; they are especially abundant in fruits and vegetables. More than 5,000 individual flavonoids have been identified and classified into more than 10 subgroups according to their chemical structure. Flavonoids have many possible biological effects that may play a role in cancer prevention. Prior studies have suggested that a high intake of flavonoids may help prevent cancer.
Objectives
To assess the effect of dietary flavonoids on the incidence of colorectal adenoma and CRC.
Search methods
Eligible studies were searched up until July 2011 in the Cochrane Library, PubMed, EMBASE and other CINAHL databases and reference lists of previous reviews.
Selection criteria
All prospective, controlled interventional studies and observational studies that either assessed the association between flavonoids and risk of CRC incidence or colorectal adenoma recurrence were included.
Data collection and analysis
At least two investigators independently reviewed the material and extracted the data according to the inclusion criteria; in addition, the methodological quality of the studies was assessed.
Main results
Eight studies with 390,769 participants were included. Five studies used a prospective cohort design, two were case‐control studies and one a randomised controlled trial (RCT). The methodological quality was measured using the Newcastle‐Ottawa scale (NOS). The three prospective cohort studies were of high methodological quality, and two were of medium quality. The two case‐control studies were of medium methodological quality.
The results form the studies assessing associations between flavonoids, colorectal cancer and adenomas were contradictory. There was no evidence that total flavonoid intake reduced the risk of colorectal neoplasms. The evidence for Isoflavones, Flavonols, Flavones and Flavanones was conflicting. For Flavan‐3‐ols, the results from two studies suggested that increased intake of Flavan‐3‐ols reduced the risk of both CRC and colorectal adenomas. A statistically significant reduced risk of CRC was found with high intake of epicatechin. There was medium quality evidence to support that increased intake of procyanidin and phytoestrogen could reduced the incidence of CRC. There was no evidence that suggested that high anthocyanin intake had an inverse association with colorectal adenomas.
Authors' conclusions
There is insufficient and conflicting evidence regarding flavonoid intake and the prevention of colorectal neoplasms. It is difficult to determine flavonoid intake. Therefore, more evidence is needed to clarify the association between flavonoids and colorectal neoplasms.
Keywords: Humans, Adenoma, Adenoma/prevention & control, Case‐Control Studies, Colorectal Neoplasms, Colorectal Neoplasms/prevention & control, Flavanones, Flavanones/therapeutic use, Flavones, Flavones/therapeutic use, Flavonoids, Flavonoids/therapeutic use, Flavonols, Flavonols/therapeutic use, Prospective Studies, Randomized Controlled Trials as Topic
Plain language summary
Dietary flavonoid for preventing colorectal neoplasms
Eight studies with 390,769 participants, mainly observational, were included in this systematic review. The aim of the studies reviewed was to determine an association of the intake of total flavonoids, and eight main flavonoid subclasses, with colorectal neoplasms including CRC and adenomas. The majority of the studies were of medium to high methodological quality. The evidence that intake of dietary flavonoids reduces the risk of colorectal neoplasms was conflicting, and could partly be explained due to difficulties in quantifying the intake of flavonoids. Therefore, the association of dietary flavonoids and prevention of colorectal neoplasms remains unproven.
Background
Description of the condition
Colorectal cancer is a major cause of morbidity and mortality throughout the world (WHO 2002). It accounts for more than nine percent of the incidence all cancers (WCRFAICR 2007; Boyle 2000). It is the third most common cancer worldwide, and the fourth most common cause of death (WCRFAICR 2007). Colorectal cancer is considered as a "life‐style" related neoplasm. High calorie intake, lack of physical activity, obesity, diabetes, and smoking all have been independently associated with the risk for colorectal cancer (LoÏk 1997; Almendingen 2002; Sanjoaquin 2004). While increasing the consumption of fruits, vegetables and grains has been linked to a reduced risk for colorectal cancer. The World Cancer Research Fund report of 1997 (WCRF 1997) concluded that there is enough evidence to support an inverse association between dietary fruit and vegetable intake and several cancers, including colorectal cancer. A multiethnic cohort study and prospective investigation suggest that a high consumption of fruits and vegetables is associated with a reduced risk of colorectal cancer, especially colon cancer (Abraham 2008; Fränzel 2009) .
It is hypothesized that fruits and vegetables, rich in potentially anticarcinogenic constituents such as: vitamin C, carotenoids, folate, dietary fibre, flavonoids, plant sterols, phenolic acids, and other phytochemicals, are associated with a reduced risk of colorectal cancer (Steinmetz 1991). Animal and human studies support the protective effect of fruits and vegetables on the development of cancer (Dragsted 1993; Dragsted 2006), they have been suggested to provide plausible biological mechanisms including reduction of oxidative damage to lipids and DNA, induction of phase I and II enzymes, and stimulation of DNA repair and apoptosis. Recently, there has been focused efforts to develop novel dietary substances to prevent cancer and/or treat cancer more effectively.
Description of the intervention
Flavonoids are polyphenolic compounds that are distributed widely in the plant kingdom; they are especially abundant in fruits, vegetables, seeds, spices, herbs, tea, cocoa, and wine (Graf 2005). More than 5,000 individual flavonoids have been identified (Aherne 2002), which are classified into more than 10 subgroups according to their chemical structure (Heim 2002). The six major subgroups of flavonoids commonly found in the human diet are: flavonols, flavones, anthocyanidins, catechins, flavanones, and isoflavones. The main dietary sources of flavonoids vary substantially among the subgroups. Flavonols (e.g., quercetin, kaempferol and myricetin) are the most abundant flavonoids in plant foods and are mainly found in leafy vegetables, apples, onions, broccoli, and berries. Flavones (e.g., apigenin and luteolin) and anthocyanidins are present in relatively small quantities in grains, leafy vegetables and herbs. Catechins (e.g., catechin and epicatechin) are abundant in tea, apples, grapes, chocolate, and red wine. Flavanones (e.g., naringenin and hesperetin) are predominantly found in citrus fruit and their juices. Isoflavones (e.g., daidzein and genistein) are mainly found in soybeans and soy‐based products. Flavonoids are well‐characterized antioxidants and metal chelates. Some flavonoids have been observed to exhibit estrogenic and antiproliferative effects, primarily by three mechanisms: prevention of carcinogenic metabolite formation, prevention of tumour cell proliferation and induction of tumour cell apoptosis (Miksicek 1993; Messina 2006). Meta‐analysis has shown that a high or increased intake of flavonoids is associated with a reduced risk of lung cancer (Na‐Ping 2009); most subgroups, except for hesperidin, have shown an inverse effect. Other studies have shown that intake of flavonoids may also reduce the risk of breast cancer, renal cell cancer, non‐Hodgkin’s lymphoma and colorectal cancer (Brian 2007; Robin 2009; Cara 2008; Gerd 2008; Evropi 2007).
How the intervention might work
Flavonoids have many possible biological effects that may play a role in cancer prevention; these include: free radical scavenging, anti‐mutagenic and anti‐proliferative properties, regulation of cell signalling and the cell cycle, and inhibition of angiogenesis (Steinmetz 1996; Aherne 2002). These properties may underlie, in part, the well‐established association between high consumption of fruits and vegetables and reduced cancer risk. Prior in vitro and in vivo investigations have revealed some of the possible mechanisms. Experiments with athymic nude mice showed that fisetin, a subclass of flavonoids, can inhibit the androgen receptor signalling axis and induce apoptosis of human prostate cancer (LNCaP) cells (Naghma 2008a). In addition, in vitro investigation of cells showed that fisetin could cause LNCaP cell cycle arrest (Naghma 2008b). With regard to colorectal cancer, Yewseok suggested that fisetin could induce apoptosis of colon cancer cells by inhibition of COX2 and Wnt/EGFR/NF‐kB‐signaling pathways (Yewseok 2009). In an animal study, using APC mice, apigenin reduced the number of polyps by increasing P53 activity by phosphorylation (Zhong 2010). Another animal trial showed that flavone increased the expression of a number of Krebs cycle enzymes (Isabel 2007), Such findings suggest how dietary flavonoids may protect against colorectal cancer. Moreover, cohort studies have suggested that increasing the intake of some subgroups of flavonoids can reduce the risk of colorectal cancer as well as the recurrence of advanced adenomas.
Why it is important to do this review
Although in vivo and in vitro studies have shown the association of dietary flavonoids with reduced risk of colorectal cancer, the findings of epidemiological investigations have been inconsistent with regard to the relationship between dietary flavonoids and colorectal cancer. In addition, there has been no prior systematic review of this issue.
Objectives
Therefore, the goal of this study was to assess the effect of dietary flavonoids on the incidence of colorectal adenomas and the incidence of CRC.
Methods
Criteria for considering studies for this review
Types of studies
Studies were carried out by using one of the following designs, and were considered for inclusion:
1. Interventional studies: RCTs;
2. Observational studies ‐ Prospective cohort studies and retrospective case‐control studies.
Case‐series, case reports and other studies without a comparator,editorials, reviews, animal studies and in‐vitro studies were excluded from the review.
Types of participants
Adults with or without colorectal cancer and colorectal adenomas. No restriction on age or setting were applied.
Types of interventions
High intake of any subclass of dietary flavonoids compared to low intake.
Types of outcome measures
Primary outcomes
Incidence of colorectal cancer or adenomas and their association with dietary flavonoids.
Secondary outcomes
Incidence of colorectal cancer and adenomas in different subgroups of dietary flavonoids, at different doses and durations.
Search methods for identification of studies
The Cochrane Library, PubMed, EMBASE and other CINAHL databases were searched. Language and date of publications did not pose any limitations. Studies not published in English were identified with the help of language experts from Nanjing University. Bibliographies of all retrieved and relevant publications identified, by these strategies, were searched for further study.
For comprehensive search strategies, see Appendix 1 (Cochrane Library); Appendix 2 (PubMed).
Electronic searches
The Cochrane Library, PubMed, EMBASE and other CINAHL databases as above were searched.
Searching other resources
In addition, trials were identified by scanning the reference lists in relevant papers and from conference proceedings, and by correspondence with experts and pharmaceutical companies. The customized search strategy, for systematic reviews, were used to identify relevant articles.
Data collection and analysis
Data from selected studies were extracted using a paper data extraction form. Data was entered into Cochrane Review Manager software (RevMan 5) and analysed using Cochrane MetaView.
Selection of studies
The authors (Heiying Jin, Qiang Leng, Chunbo Li) independently assessed titles and abstracts of the references identified by the search strategy according to the selection criteria. Full text copies of articles and studies that fulfilled the criteria were obtained. When unclear from the title or abstract whether the paper fulfilled the criteria, or when there is disparity among authors, a full text copy were obtained. Two authors individually assessed the information (Heiying Jin, Qiang Leng), and inclusion or exclusion of a study were determined in consensus among the authors. All disagreements were resolved by requesting a third independent author (Chunbo Li).
Studies were assessed for quality, with respect to methods of randomizations, allocation concealment, blinding of outcomes, and dropout rate.
Data extraction and management
The authors used a piloted data extraction sheet to summarize the details of studies. Data extraction was undertaken independently by two authors, and then compared; a third independent author resolved any disagreement.
The following data were extracted from each study:
· Study methods Definition and diagnostic criteria
· Participants Number, source, age, gender, inclusion and exclusion criteria, duration of investigation, loss to follow‐up
· Interventions Dietary flavonoids, subclass (es) of dietary flavonoids, doses of the dietary flavonoids and duration.
· Outcomes Incidence of colorectal cancer and colorectal adenomas
Unit of analysis issues – Morbidity rates of colorectal cancer and colorectal adenomas are counting variables.
Assessment of risk of bias in included studies
The authors independently evaluated the quality of the trials included. Assessment included the four types of bias: selection bias, performance bias, attrition bias, and detection bias. Quality assessment criteria included:
(1) Selection bias:
Allocation concealment:
A. Adequate: Use of randomizations methods that did not allow the investigator and participants to know about or influence the allocation of treatment before eligible participants entered the studies.
B. Unclear: Randomization was stated but there was no information about the methods used.
C. Inadequate: Use of alternate medical record numbers or unsealed envelopes as a randomizations method, and/or information indicating that investigators and/or participants could have influenced the allocation of treatment.
(2) Performance bias:
Blinding of health care providers: Yes/No/Unclear
Blinding of participants: Yes/No/Unclear
Health care providers and participants will be considered not to be blinded if the intervention group can be identified in >20% of participants because of side effects associated with treatment.
(3) Detection bias: Blinding of those that assessed outcomes: Yes/No/Unclear
(4) Attrition bias:
Intention‐to‐treat analysis:
A: Yes: All participants are analysed in the treatment group to which they were allocated; regardless of whether they received the allocated intervention.
B: No: Some participants (<5%, 5‐10%, 10‐20 %, > 20%) are not analysed in the treatment group to which they were randomised because they did not receive the study intervention due to withdrawal from the study and/or protocol violation.
C: Unclear: Inability to determine if patients were analysed according to the intention‐to‐treat principle after contract with the authors.
Completeness of follow‐up: Complete follow‐up will be defined as 85% of the study sample completing the study.
Clarification from the author will be sought if the published data provide inadequate information for the review. Discrepancies will be resolved by consensus. The potential risk of bias will be summarized from the quality assessment of the trials into three categories as described in the Cochrane handbook:
Risk of bias ‐ interpretation of the relationship to individual criteria
A: Low risk of bias: plausible bias is unlikely because all criteria are met and do not seriously alter the results.
B: Moderate risk of bias: plausible bias is present with regard to meeting one or more criteria and raise doubt about the results.
C: High risk of bias: plausible bias is present, two or more criteria are not met; this weakens confidence about the results.
Measures of treatment effect
Calculating the relative risks or risk ratios (RR) with 95% confidence intervals were used to determine the outcomes of dichotomous variables. A RR of less than 1.0 will favour the intervention group, indicating that dietary flavonoids are associated with reduced incidence of colorectal cancer and colorectal adenomas.
Unit of analysis issues
The primary outcome, incidence of colorectal cancer and colorectal adenomas, is a dichotomous outcome. Calculation of the relative risk or risk ratios (RR) with 95% confidence intervals were used for analysis of the dichotomous data. The secondary outcomes, association of subclasses, doses and duration of dietary flavonoids with colorectal cancer and colorectal adenomas, also provided dichotomous data; these data were analysed as noted above.
Dealing with missing data
The principal authors of the included studies were contacted to supply missing data. Missing data and drop‐outs/attrition were assessed for each study included, and the extent to which the result/conclusion of the review is altered by the missing data were assessed and discussed. Upon significant gaps in data and the missing data couldn't be identified, we excluded the nstudy from further review.
Assessment of heterogeneity
As trials are conducted by different groups of investigators at different periods of time, they may be heterogeneous. Heterogeneity were explored among trial results using a multi‐step process including: (1) Forest plots examined for the presence or absence of overlap in the confidence intervals noted. Lack of overlap of the confidence intervals will indicate heterogeneity; (2) the I2 statistic was used for the assessment of the amount of variability in the results that is due to heterogeneity (Higgins 2008); (3) the Chi‐Square test for heterogeneity was performed and data considered heterogeneous if P<0.1; (4) if significant heterogeneity was detected, possible reasons were discussed.
Assessment of reporting biases
Where possible, funnel plots were used to assess the chance of reporting bias and a table were used to present such findings.
Data synthesis
The analyses were performed with RevMan version 5. The results were shown using the approach recommended in the Cochrane Handbook (Higgins 2008). Dichotomous data were presented as relative risks (RR) with 95% confidence intervals. All randomised patients included were analysed using the intention‐to‐treat principle. Heterogeneity was assessed among trials using I2. Where the interventions are comparable, the results were combined in the meta‐analysis if no significant clinical heterogeneity was detected. In the absence of heterogeneity, the data were analysed using a fixed‐effects model. Random‐effects models were used if there was an unexplained heterogeneity. Subgroup analysis were performed to assess the impact of the possible sources of heterogeneity, when appropriate. The principal authors of included studies were contacted to supply missing data. Funnel plots performed if sufficient studies were identified.
Subgroup analysis and investigation of heterogeneity
If the data permit, subgroup analyses will be performed for studies with different sized caps and endpoints, if there are many different endpoints used in the studies. As trials are conducted by different groups of investigators at different periods of time, they may be heterogeneous. Heterogeneity among trial results were evaluated using a multi‐step process including: (1) the examination of Forest‐plots and the presence or absence of overlap of the confidence intervals were noted. Lack of overlap of the confidence intervals indicates heterogeneity; (2) the I2 statistic was used to describe the proportion of the variability in the results that is due to heterogeneity (Higgins 2008); (3) the Chi‐Square test for heterogeneity were performed and data considered heterogeneous if P<0.1; (4) If significant heterogeneity was detected, possible explanations were suggested and discussed.
Sensitivity analysis
If a sufficient number of randomised trials were identified, a sensitivity analysis were performed to explore the impact of study quality. Studies with clearly inadequate allocation of concealment were excluded. A second sensitivity analysis was carried out and based on excluding outlying results.
Results
Description of studies
Results of the search
See: Characteristics of included studies; Characteristics of excluded studies
A total of 68 hits were found from the literature searches. Fifty‐three clearly did not match the inclusion criteria and were excluded after review of the title and abstract. The main reasons for exclusion were: the paper did not investigate dietary flavonoids or did not include colorectal neoplasms. For the remaining 15 papers, the full articles were retrieved, and another four papers were identified after screening the reference lists in the reports. After assessing the full articles, according to the inclusion criteria, provided in the protocol, 11 of them did not fulfil the inclusion criteria. The main reasons for exclusion were: no investigation of the incidence of flavonoids and colorectal neoplasms, no available data or double publications. Reasons for exclusion of studies are described in Characteristics of excluded studies.
Eight studies were included in this review: one RCT, five prospective cohort studies and two retrospective case‐control studies.
Included studies
The eight studies included a total of 390,769 participants (384,432 in cohort studies, 4,432 in case‐control studies, and 1,905 in one RCT) from four countries. Two studies were carried out in Japan, one in Scotland, one in the Netherlands, and four in the USA. The studies were published between 2006 and 2009.
Interventions
Some researchers investigated the association between total flavonoids and colorectal neoplasms, while others reported the effects of some flavonoid subclasses. Data on different types of flavonoids were provided:
Total flavonoids: three prospective cohort studies (Cutler 2008; Lin 2006; Wang 2009), one RCT (Bobe 2008)
-
Isoflavones: one prospective cohort study (Akhter 2008), one RCT (Bobe 2008), one case‐control study (Akhter 2009)
-
Flavonols: one prospective cohort study (Simons 2009), one RCT (Bobe 2008), one case‐control study (Theodoratou 2007)
Flavones: one prospective cohort study (Simons 2009), one RCT (Bobe 2008), one case‐control study (Theodoratou 2007)
-
Flavan‐3‐ols: one RCT (Bobe 2008), one case‐control study (Theodoratou 2007)
Catechin: one prospective cohort study (Simons 2009), one case‐control study (Theodoratou 2007)
Epicatechin: one case‐control study (Theodoratou 2007)
Procyanidins: one case‐control study (Theodoratou 2007)
-
Flavanones: one RCT (Bobe 2008), one case‐control study (Theodoratou 2007)
Naringenin: one RCT (Bobe 2008), one case‐control study (Theodoratou 2007)
Hesperetin: one RCT (Bobe 2008), one case‐control study (Theodoratou 2007)
Phytoestrogens: one case‐control study (Theodoratou 2007)
Anthocyanins: one RCT (Bobe 2008)
Outcomes
All of the five cohort studies and one case‐control study investigated flavonoid intake associated with CRC risk, one case‐control study and the only included RCT assessed the association between dietary flavonoid intake and colorectal adenoma recurrence.
Exposure
All studies either used a self‐administered questionnaire or a food frequency questionnaire in which participants had to report the frequency and amount of certain food and beverage intake.
The amount of flavonoid intake was estimated from flavonoid databases such as the 2006 U.S. Department of Agriculture (USDA) flavonoid database and the 2002 USDA isoflavonoid database.
Sponsorship
Three of the eight studies declared sponsorship for their studies. In Japan, the studies were supported by the Japan Public Health Center and National Cancer Center, and in the USA, the National Institutes of Health and National Colorectal Cancer Research Alliance provided support. Five of the studies did not declare sponsorship in their publication.
Risk of bias in included studies
Interventional studies
Bobe 2008 had a low to medium risk of selection bias, a low to medium risk of assessment bias and a low risk of other bias.
Observational studies
The risk of bias assessment of included observational studies was carried out using the Newcastle Ottawa Scale (NOS) for cohort (Appendix 3) and case‐control studies (Appendix 4).
Cohort studies
The median score was 13 (out of 16) for the five cohort studies with a range of 12 to 14 points (see Table 1).
1. Table 1 Methodological quality of cohort studies.
| Study | Cohort study | Case study | Total (out of 16) | |||
| Selection | Comparability | Outcome | Selection | Exposure | ||
| Akhter 2008 | 4 | 2 | 2 | 3 | 2 | 13 |
| Cutler 2008 | 4 | 2 | 2 | 4 | 2 | 14 |
| Lin 2006 | 4 | 2 | 2 | 3 | 2 | 13 |
| Simons 2009 | 3 | 2 | 2 | 3 | 2 | 12 |
| Wang 2009 | 3 | 2 | 2 | 3 | 2 | 12 |
Three studies were of high methodological quality and reached 13 or more points (Akhter 2008; Cutler 2008; Lin 2006). The remaining two studies were of medium methodological quality with 12 points (Simons 2009; Wang 2009).
Case‐control studies
The two case‐control studies were of medium methodological quality with six and seven points (out of 9), respectively (Akhter 2009; Theodoratou 2007) (see Table 2).
2. Table 2 Methodological quality of case‐control studies.
| Study | Selection | Comparability | Exposure | Total ( out of 9 ) |
| Akhter 2009 | 3 | 1 | 2 | 6 |
| Theodoratou 2007 | 3 | 2 | 2 | 7 |
Effects of interventions
The findings are summarized in Table 3.
3. meta‐analysis of risk estimates of flavonoids intake (highest versus lowest) and colorectal neoplasms.
| Study | No. of study |
RR | 95% CI |
| Total flavonoids | 4 | 1.03 | 0.88, 1.20 |
| Subclassess of flavonoids |
|||
| Isoflavonoes | 3 | 0.98 | 0.80, 1.19 |
| Biochanin A | 1 | 0.94 | 0.79, 1.11 |
| Daidzein | 1 | 1.04 | 0.89, 1.23 |
| Formononetin | 1 | 0.95 | 0.81, 1.11 |
| Genistein | 1 | 0.96 | 0.81, 1.13 |
| Flavonols | 3 | 0.91 | 0.84, 0.98 |
| Quercetin | 3 | 0.96 | 0.80 1.16 |
| Kaempferol | 2 | 1.01 | 0.89, 1.15 |
| Myricetin | 2 | 1.01 | 0.89, 1.15 |
| Isorhamnetin | 1 | 1.01 | 0.86, 1.19 |
| Flavones | 3 | 1.03 | 0.96, 1.11 |
| Flavan‐3‐ols | 2 | 0.93 | 0.85, 1.02 |
| Catechin | 2 | 0.90 | 0.74, 1.09 |
| Epicatechin | 1 | 0.85 | 0.77, 0.95 |
| Procyanidins | 1 | 0.88 | 0.79, 0.98 |
| Flavanones | 2 | 1.07 | 0.73, 1.57 |
| Naringenin | 2 | 1.10 | 0.83, 1.45 |
| Hesperetin | 2 | 1.04 | 0.95, 1.14 |
| Phytoestrogens | 1 | 0.96 | 0.86, 1.07 |
| Anthocyanins | 1 | 1.01 | 0.86, 1.19 |
Total flavonoids
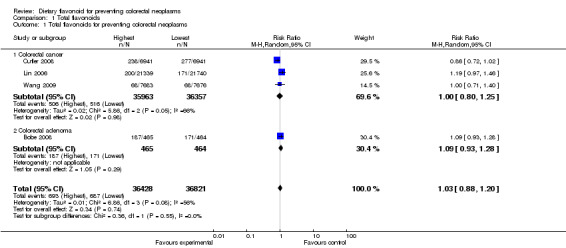
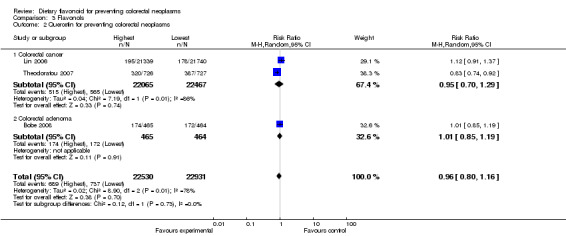
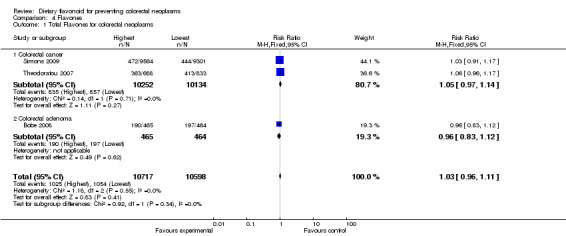
Four studies ( Bobe 2008; Cutler 2008; Lin 2006; Wang 2009 ) concluded that there was an effect of total flavonoids on preventing colorectal neoplasms. Three of the studies (Cutler 2008; Lin 2006; Wang 2009) investigated the association of total flavonoids with colorectal cancer incidence, and one study (Bobe 2008) investigated the effect of total flavonoids on inhibiting the recurrence of colorectal adenoma polyps.
The combined results of total flavonoids associated with prevention of colorectal neoplasms indicated no statically significant difference between the highest flavonoid intake and the lowest (RR =1.03, 95% CI 0.88 to 1.20). In the subgroup analysis, the results of three cohort studies did not show an inverse association between total flavonoid intake and CRC risk (RR = 1.00, 95% CI 0.80 to 1.25). In addition, the results of the only RCT included, showed no association of the total flavonoid intake with any risk of adenoma recurrence (RR = 1.09, 95% CI 0.93 to 1.28).
Subclasses of flavonoids
Isoflavonoes:
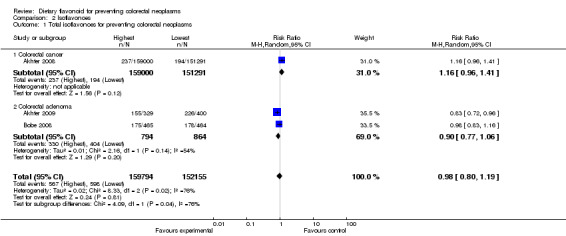
One study (Akhter 2008) investigated the association of total Isoflavone intake with CRC risk, and two studies (Akhter 2009; Bobe 2008) investigated the association between Isoflavones and adenoma recurrence. The overall results of the studies showed a decreased risk of colorectal neoplasms with Isoflavone intake (RR = 0.98, 95% CI 0.80 to 1.19). However, for the comparisons between CRC and adenomas, the association with Isoflavone intake was inconsistent. The data from Akhter 2008 and Bobe 2008 showed an inverse association between adenoma recurrence and high Isoflavone intake (RR = 0.90, 95% CI 0.77 to1.06). However, the findings from Akhter 2008 suggested an increased risk of CRC with Isoflavone intake (RR = 1.16, 95% CI 0.96 to 1.41).
Individual flavonoids of Isoflavonoes:
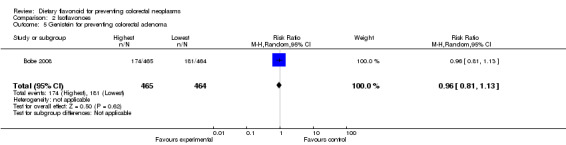
Bobe 2008 investigated the association of four individual flavonoids of isoflavones including Biochanin A, Daidzein, Formononetin and Genistein with colorectal adenoma recurrence risk. For the highest isoflavone intake quartile compared to the lowest, there was a slight decrease in the risk of adenoma recurrence for Biochanin A, Formononetin and Genistein. For advanced adenoma recurrence, there was a larger extent of the deceased risk observed for Biochanin A and Daidzein, and a statistically significant decreased risk was found for Formononetin and Genistein.
Flavonols:
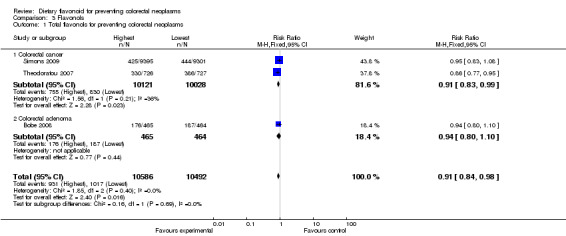
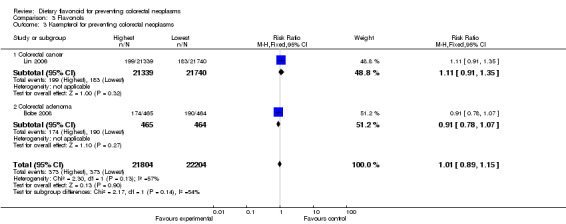
Three studies (Bobe 2008; Simons 2009; Theodoratou 2007) investigated the association between flavonol intake and colorectal neoplasms. The data from the three studies showed an inverse association between increased intake of flavonols and colorectal neoplasms (RR = 0.91, 95% CI 0.84 to 0.98). Of the three studies, two (Simons 2009; Theodoratou 2007) investigated the association of flavonol intake with CRC risk. A statistically significant decreased risk of CRC was observed for the highest intake of flavonols compared to the lowest (RR = 0.91, 95% CI 0.83 to 0.99). Bobe 2008 investigated the association of flavonol intake with adenoma recurrence, and no inverse association was observed.
Individual flavonoids of Flavonols:
Three studies (Bobe 2008; Lin 2006; Theodoratou 2007) investigated the effect of quercetin on preventing colorectal neoplasms. Two studies (Lin 2006; Theodoratou 2007) investigated the effect of quercetin in preventing CRC, and one (Bobe 2008) assessed adenoma prevention. A slight decease in the risk for total colorectal neoplasms and CRC was observed with quercetin intake. However, an association of quercetin with adenoma recurrence was not observed.
Two studies (Bobe 2008;Lin 2006) investigated the association of kaempferol and myricetin intake with colorectal neoplasms, and no inverse association of either kaempferol or myricetin was observed with colorectal neoplasms. In addition, the findings reported by Lin 2006 showed no association of kaempferol or myricetin with CRC. A slight decreased risk in the recurrence of adenomas was found with kaempferol and myricetin in the results reported by Bobe 2008.
One study (Bobe 2008) investigated the association of isorhamnetin intake with adenoma recurrence; there was no association of isorhamnetin intake with adenoma recurrence found.
Flavones:
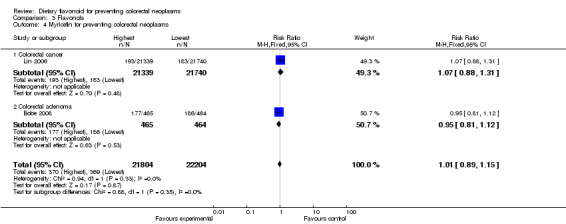
Three studies (Bobe 2008; Simons 2009; Theodoratou 2007) investigated the association of flavone intake with colorectal neoplasm risk. Flavone intake showed no association with the prevention of colorectal neoplasms or CRC. The findings of Bobe 2008 showed a slightly decreased risk of adenoma recurrence associated with the highest flavone intake compared to the lowest.
Flavan‐3‐ols:
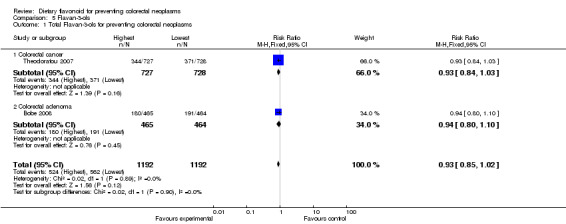
One case‐control study (Theodoratou 2007) and one RCT (Bobe 2008) investigated the potential effect of flavan‐3‐ols for preventing CRC and colorectal adenomas, respectively. A decreased risk of both CRC and adenoma recurrence was observed.
Individual flavonoids of Flavan‐3‐ols:
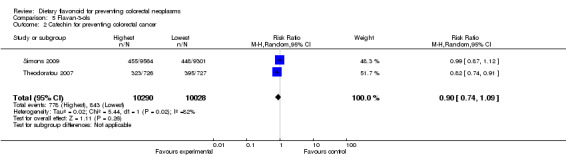
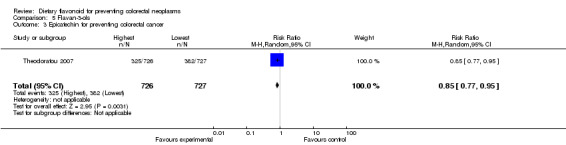
Two studies (Simons 2009; Theodoratou 2007) investigated the association of catechin with CRC risk, and one study (Theodoratou 2007) investigated the association of epicatechin with CRC risk. A decreased risk of CRC was observed with an increased intake of catechin, and a statistically significant decreased risk of CRC was associated with a high intake of epicatechin (RR = 0.85, 95% CI 0.77 to 0.95).
Procyanidins:
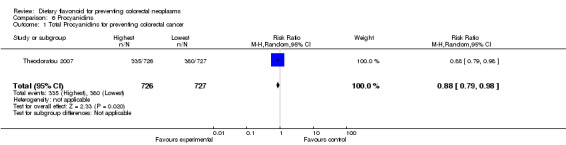
One case‐control study (Theodoratou 2007) investigated the association of procyanidins with CRC risk; the results showed a statistically significant decreased risk of CRC with a high intake of procyanidins (RR = 0.88, 95% CI 0.79 to 0.98).
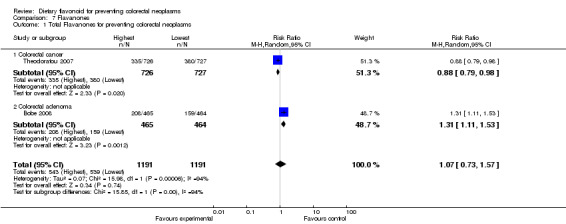
Flavanones:
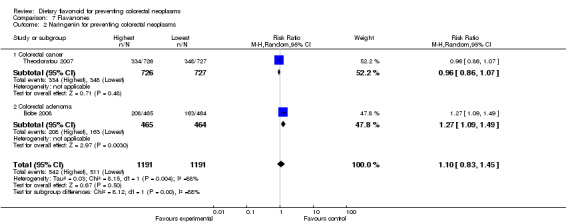
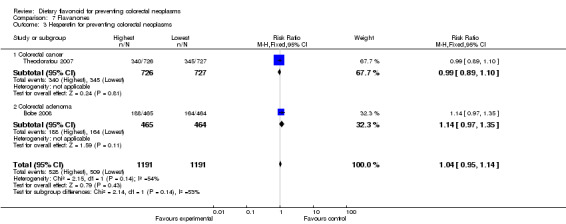
One case‐control study (Theodoratou 2007) and one RCT (Bobe 2008) investigated the association of flavanones and two individual flavonones (hesperetin and naringenin) with colorectal neoplasms. There was no prevention associated with total flavanones or the two individual flavonones, with regard to colorectal adenoma recurrence. There was a statistically significant decreased risk of CRC associated with the total flavonone intake (RR = 0.88, 95% CI 0.79 to 0.98), and a slight decreased risk of CRC was found with both hesperidin and naringenin intake.
Phytoestrogens:
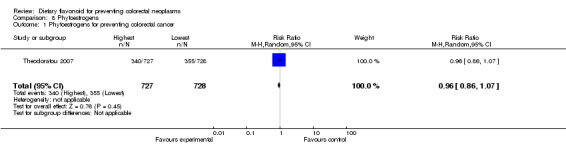
Theodoratou 2007 investigated the association of phytoestrogen intake with CRC risk. The findings showed a slightly decreased risk of CRC associated with a high phytoestrogen intake.
Anthocyanins:
Bobe 2008 investigated the association of anthocyanin with adenoma recurrence, and no association of anthocyanin intake and adenoma recurrence was found.
Discussion
Although flavonoids are considered as possible inhibitors of cancer, the effects and mechanisms of flavonoids on colorectal neoplasms still needs to be resolved. Seven observational studies and one interventional study of dietary flavonoids were evaluated for evidence of prevention of the development of colorectal neoplasms. The results of this review suggest that some flavonoid subclasses and individual flavonoids could have a potential effect on the prevention of the development of colorectal cancer and adenomas. However, due to the generally poor methodological quality of the included studies, no firm conclusions can be made. There are several substantial limitations of this review.
First, most results included in this review come from observational studies including five cohort studies and two case‐control studies. Although the methodological quality of these observational studies was medium to high, evidence from cohort and case‐control studies used to confirm an association between flavonoid intake and a decreased risk of colorectal neoplasms are not reliable.
Second, flavonoids are abundant in dietary food; there are more than 5,000 kinds. The included studies estimated the flavonoid intake of participants using either a food frequency questionnaire or a self‐administered questionnaire. Each questionnaire included more than 100 food items. The participants were asked to describe the amount and frequency of each food item on the list that they had eaten during a given period of time (such as one year before diagnosis). However, not all of the food that the participants regularly ate was listed on the questionnaire, and only four of the included studies, Cutler 2008; Lin 2006; Simons 2009; Theodoratou 2007, described an additional strategy to avoid this design deficiency. Therefore, there was inevitable bias when evaluating the quantity of flavonoid intake.
Third, the doses of flavonoid intake were calculated according to flavonoid databases and were approximated using this approach. The quantities of flavonoid intake, within subgroups, varied widely. In Wang 2009, the quantity of the lowest total flavonoid intake varied from 0 to 11.55 mg/d, and the quantity of the highest intake varied from 34.55 to 236.38 mg/d. However, in Bobe 2008, the quantity of the lowest total flavonoid intake was less than 50.87 mg/d. The absence of consistent intake makes it difficult to compare the results of the included studies and decreases the reliability of the evidence.
Fourth, the follow‐up of the included studies ranged from 3 to 13.3 years. As the development of colorectal neoplasms results from the mutation of multiple genes, intake of flavonoids might influence these mutations; however, the timing of the effects remains unclear. The variation in follow‐up intervals make it difficult to compare the studies included.
Finally, there were racial differences among the included studies. Of the eight included studies, four were carried out in the USA, two in Japan, one in the Netherlands and one in Scotland. In addition, the demographics of participants varied; for example, Cutler 2008 and Wang 2009 included only postmenopausal women in their studies. This added additional heterogeneity to the study groups and reduced the validity of the comparisons.
Authors' conclusions
Implications for practice.
Based on this systematic review, no clear evidence was found to support that high intake of total flavonoids was associated with colorectal cancer prevention. The findings of reduced risk of CRC or adenoma recurrence, for some flavonoid subclasses and individual flavonoids, were not reliable because of methodological weaknesses. The dose of flavonoids and range of follow up varied significantly, so that the effective dose and treatment prior to flavonoid ingestion was unclear. Due to the generally poor methodological quality of the included studies and the difficulty in determining flavonoid intake, no reliable implications for practice could be determined.
Implications for research.
Interventional studies with high methodological quality are needed. The intervention should be designed to study pure compounds and compare outcomes with a placebo group. Studies should include standard doses for the intervention with a defined follow up interval. Furthermore, criteria should be included to minimize the variation of characteristics among participants.
Acknowledgements
We would like to thank all members of the Cochrane Colorectal Cancer Review Group for their valuable support.
Appendices
Appendix 1. Cochrane Library search strategy
Qiang Leng Cochrane Library on 26. 07. 11
#1 randomised controlled study.pt.
#2 controlled clinical trial.pt
#3 randomized.tx.
#4 randomly.tx.
#5 placeno.tx.
#6 drug therapy.tx.
#7 trial.tx.
#8 groups.tx.
#9 #1 or #2 or #3 or #4 or #5 or #6 or #7 or #8 or #9
#10 dietary flavonoid*.tx.
#11 flavonoid*.tx.
#12 (flavonol or quercetin or kaempferol or myricetin or flavone or apigenin or luteolin or anthocyanidin or catechin or epicatechin or flavanone or naringenin or hesperetin or isoflavone or daidzein or genistein).tx.
#13 #10 or #11 or #12
#14 MeSH descriptor colorectal neoplasms explode all trees
#15 colorectal neoplasms.tx.
#16 CRC.tx.
#17 (tumor or tumour or cancer or carcinoma or adenoma or adenocarcinoma or polyp).tx.
#18 (colorectal or colonic or rectal or colon or rectum or anal or anus or large bowel).tx.
#19 #17 and #18
#20 #14 or #15 or #16 or #19
#21 #9 and #13 and #20
from 21 keep 1‐26
Appendix 2. PubMed search strategy
Qiang Leng PubMed on 26.07.11
1. randomised controlled trial.pt
2. controlled clinical trial.pt
3. (randomised or randomly or placebo or trial or group pr single blind procedure or double blind procedure).ti,ab.
4. 1 or 2 or 3
5. (dietary flavonoid* or flavonoid*).ti,ab.
6. (flavonol or quercetin or kaempferol or myricetin or flavone or apigenin or luteolin or anthocyanidin or catechin or epicatechin or flavanone or naringenin or hesperetin or isoflavone or daidzein or genistein).ti,ab.
7. 5 or 6
8. (colorectal neoplasm* or colorectal cancer or colorectal tumo*r).ti,ab.
9. (colorectal or colonic or rectal or colon or rectum or anal or anus or large bowel).ti,ab.
10 (tumo*r or cancer or carcinoma or adenoma or adenocarcinoma or polyp),ti,ab.
11 9 and 10
12 8 or 11
13 4 and 7 and 12
14 limit 13 to humans
from 14 keep 1‐20.
Appendix 3. Newcastle‐Ottawa Quality Assessment Scale ‐ Cohort Studies
NEWCASTLE ‐ OTTAWA QUALITY ASSESSMENT SCALE ‐ COHORT STUDIES Note: A study can be awarded a maximum of one star for each numbered item within the Selection and Outcome categories. A maximum of two stars can be given for Comparability.
Selection 1) Representativeness of the exposed cohort a) truly representative of the average _______________ (describe) in the community (*) b) somewhat representative of the average ______________ in the community (*) c) selected group of users e.g. nurses, volunteers d) no description of the derivation of the cohort 2) Selection of the non exposed cohort a) drawn from the same community as the exposed cohort (*) b) drawn from a different source c) no description of the derivation of the non exposed cohort 3) Ascertainment of exposure a) secure record (e.g. surgical records) (*) b) structured interview (*) c) written self report d) no description 4) Demonstration that outcome of interest was not present at start of study a) yes (*) b) no Comparability 1) Comparability of cohorts on the basis of the design or analysis a) study controls for _____________ (select the most important factor) (*) b) study controls for any additional factor (*) (This criteria could be modified to indicate specific control for a second important factor) Outcome 1) Assessment of outcome a) independent blind assessment (*) b) record linkage (*) c) self report d) no description 2) Was follow‐up long enough for outcomes to occur a) yes (select an adequate follow up period for outcome of interest) (*) b) no 3) Adequacy of follow up of cohorts a) complete follow up ‐ all subjects accounted for (*) b) subjects lost to follow up unlikely to introduce bias ‐ small number lost ‐ > ____ % (select an adequate %) follow up, or description provided of those lost) (*) c) follow up rate < ____% (select an adequate %) and no description of those lost d) no statement
Appendix 4. Newcastle‐Ottawa Quality Assessment Scale ‐ Case Control Studies
NEWCASTLE ‐ OTTAWA QUALITY ASSESSMENT SCALE ‐ CASE CONTROL STUDIES Note: A study can be awarded a maximum of one star for each numbered item within the Selection and Exposure categories. A maximum of two stars can be given for Comparability. Selection 1) Is the case definition adequate? a) yes, with independent validation (*) b) yes, e.g. record linkage or based on self reports c) no description 2) Representativeness of the cases a) consecutive or obviously representative series of cases (*) b) potential for selection biases or not stated 3) Selection of Controls a) community controls (*) b) hospital controls c) no description 4) Definition of Controls a) no history of disease (endpoint) (*) b) no description of source Comparability 1) Comparability of cases and controls on the basis of the design or analysis a) study controls for _______________ (Select the most important factor.) (*) b) study controls for any additional factor (*) (This criteria could be modified to indicate specific control for a second important factor.) Exposure 1) Ascertainment of exposure a) secure record (e.g. surgical records) (*) b) structured interview where blind to case/control status (*) c) interview not blinded to case/control status d) written self report or medical record only e) no description 2) Same method of ascertainment for cases and controls a) yes (*) b) no 3) Non‐Response rate a) same rate for both groups (*) b) non respondents described c) rate different and no designation
Data and analyses
Comparison 1. Total flavonoids.
| Outcome or subgroup title | No. of studies | No. of participants | Statistical method | Effect size |
|---|---|---|---|---|
| 1 Total flavonoids for preventing colorectal neoplasms | 4 | 73249 | Risk Ratio (M‐H, Random, 95% CI) | 1.03 [0.88, 1.20] |
| 1.1 Colorectal cancer | 3 | 72320 | Risk Ratio (M‐H, Random, 95% CI) | 1.00 [0.80, 1.25] |
| 1.2 Colorectal adenoma | 1 | 929 | Risk Ratio (M‐H, Random, 95% CI) | 1.09 [0.93, 1.28] |
1.1. Analysis.
Comparison 1 Total flavonoids, Outcome 1 Total flavonoids for preventing colorectal neoplasms.
Comparison 2. Isoflavonoes.
| Outcome or subgroup title | No. of studies | No. of participants | Statistical method | Effect size |
|---|---|---|---|---|
| 1 Total isoflavonoes for preventing colorectal neoplasms | 3 | 311949 | Risk Ratio (M‐H, Random, 95% CI) | 0.98 [0.80, 1.19] |
| 1.1 Colorectal cancer | 1 | 310291 | Risk Ratio (M‐H, Random, 95% CI) | 1.16 [0.96, 1.41] |
| 1.2 Colorectal adenoma | 2 | 1658 | Risk Ratio (M‐H, Random, 95% CI) | 0.90 [0.77, 1.06] |
| 2 Biochanin A for preventing colorectal adenoma | 1 | 929 | Risk Ratio (M‐H, Random, 95% CI) | 0.94 [0.79, 1.11] |
| 3 Daidzein for preventing colorectal adenoma | 1 | 929 | Risk Ratio (M‐H, Random, 95% CI) | 1.04 [0.89, 1.23] |
| 4 Formononetin for preventing colorectal adenoma | 1 | 929 | Risk Ratio (M‐H, Random, 95% CI) | 0.95 [0.81, 1.11] |
| 5 Genistein for preventing colorectal adenoma | 1 | 929 | Risk Ratio (M‐H, Random, 95% CI) | 0.96 [0.81, 1.13] |
2.1. Analysis.
Comparison 2 Isoflavonoes, Outcome 1 Total isoflavonoes for preventing colorectal neoplasms.
2.2. Analysis.

Comparison 2 Isoflavonoes, Outcome 2 Biochanin A for preventing colorectal adenoma.
2.3. Analysis.

Comparison 2 Isoflavonoes, Outcome 3 Daidzein for preventing colorectal adenoma.
2.4. Analysis.

Comparison 2 Isoflavonoes, Outcome 4 Formononetin for preventing colorectal adenoma.
2.5. Analysis.
Comparison 2 Isoflavonoes, Outcome 5 Genistein for preventing colorectal adenoma.
Comparison 3. Flavonols.
| Outcome or subgroup title | No. of studies | No. of participants | Statistical method | Effect size |
|---|---|---|---|---|
| 1 Total flavonols for preventing colorectal neoplasms | 3 | 21078 | Risk Ratio (M‐H, Fixed, 95% CI) | 0.91 [0.84, 0.98] |
| 1.1 Colorectal cancer | 2 | 20149 | Risk Ratio (M‐H, Fixed, 95% CI) | 0.91 [0.83, 0.99] |
| 1.2 Colorectal adenoma | 1 | 929 | Risk Ratio (M‐H, Fixed, 95% CI) | 0.94 [0.80, 1.10] |
| 2 Quercetin for preventing colorectal neoplasms | 3 | 45461 | Risk Ratio (M‐H, Random, 95% CI) | 0.96 [0.80, 1.16] |
| 2.1 Colorectal cancer | 2 | 44532 | Risk Ratio (M‐H, Random, 95% CI) | 0.95 [0.70, 1.29] |
| 2.2 Colorectal adenoma | 1 | 929 | Risk Ratio (M‐H, Random, 95% CI) | 1.01 [0.85, 1.19] |
| 3 Kaempferol for preventing colorectal neoplasms | 2 | 44008 | Risk Ratio (M‐H, Fixed, 95% CI) | 1.01 [0.89, 1.15] |
| 3.1 Colorectal cancer | 1 | 43079 | Risk Ratio (M‐H, Fixed, 95% CI) | 1.11 [0.91, 1.35] |
| 3.2 Colorectal adenoma | 1 | 929 | Risk Ratio (M‐H, Fixed, 95% CI) | 0.91 [0.78, 1.07] |
| 4 Myricetin for preventing colorectal neoplasms | 2 | 44008 | Risk Ratio (M‐H, Fixed, 95% CI) | 1.01 [0.89, 1.15] |
| 4.1 Colorectal cancer | 1 | 43079 | Risk Ratio (M‐H, Fixed, 95% CI) | 1.07 [0.88, 1.31] |
| 4.2 Colorectal adenoma | 1 | 929 | Risk Ratio (M‐H, Fixed, 95% CI) | 0.95 [0.81, 1.12] |
| 5 Isorhamnetin for preventing colorectal adenoma | 1 | 929 | Risk Ratio (M‐H, Random, 95% CI) | 1.01 [0.86, 1.19] |
3.1. Analysis.
Comparison 3 Flavonols, Outcome 1 Total flavonols for preventing colorectal neoplasms.
3.2. Analysis.
Comparison 3 Flavonols, Outcome 2 Quercetin for preventing colorectal neoplasms.
3.3. Analysis.
Comparison 3 Flavonols, Outcome 3 Kaempferol for preventing colorectal neoplasms.
3.4. Analysis.
Comparison 3 Flavonols, Outcome 4 Myricetin for preventing colorectal neoplasms.
3.5. Analysis.

Comparison 3 Flavonols, Outcome 5 Isorhamnetin for preventing colorectal adenoma.
Comparison 4. Flavones.
| Outcome or subgroup title | No. of studies | No. of participants | Statistical method | Effect size |
|---|---|---|---|---|
| 1 Total Flavones for colorectal neoplasms | 3 | 21315 | Risk Ratio (M‐H, Fixed, 95% CI) | 1.03 [0.96, 1.11] |
| 1.1 Colorectal cancer | 2 | 20386 | Risk Ratio (M‐H, Fixed, 95% CI) | 1.05 [0.97, 1.14] |
| 1.2 Colorectal adenoma | 1 | 929 | Risk Ratio (M‐H, Fixed, 95% CI) | 0.96 [0.83, 1.12] |
4.1. Analysis.
Comparison 4 Flavones, Outcome 1 Total Flavones for colorectal neoplasms.
Comparison 5. Flavan‐3‐ols.
| Outcome or subgroup title | No. of studies | No. of participants | Statistical method | Effect size |
|---|---|---|---|---|
| 1 Total Flavan‐3‐ols for preventing colorectal neoplasms | 2 | 2384 | Risk Ratio (M‐H, Fixed, 95% CI) | 0.93 [0.85, 1.02] |
| 1.1 Colorectal cancer | 1 | 1455 | Risk Ratio (M‐H, Fixed, 95% CI) | 0.93 [0.84, 1.03] |
| 1.2 Colorectal adenoma | 1 | 929 | Risk Ratio (M‐H, Fixed, 95% CI) | 0.94 [0.80, 1.10] |
| 2 Catechin for preventing colorectal cancer | 2 | 20318 | Risk Ratio (M‐H, Random, 95% CI) | 0.90 [0.74, 1.09] |
| 3 Epicatechin for preventing colorectal cancer | 1 | 1453 | Risk Ratio (M‐H, Random, 95% CI) | 0.85 [0.77, 0.95] |
5.1. Analysis.
Comparison 5 Flavan‐3‐ols, Outcome 1 Total Flavan‐3‐ols for preventing colorectal neoplasms.
5.2. Analysis.
Comparison 5 Flavan‐3‐ols, Outcome 2 Catechin for preventing colorectal cancer.
5.3. Analysis.
Comparison 5 Flavan‐3‐ols, Outcome 3 Epicatechin for preventing colorectal cancer.
Comparison 6. Procyanidins.
| Outcome or subgroup title | No. of studies | No. of participants | Statistical method | Effect size |
|---|---|---|---|---|
| 1 Total Procyanidins for preventing colorectal cancer | 1 | 1453 | Risk Ratio (M‐H, Random, 95% CI) | 0.88 [0.79, 0.98] |
6.1. Analysis.
Comparison 6 Procyanidins, Outcome 1 Total Procyanidins for preventing colorectal cancer.
Comparison 7. Flavanones.
| Outcome or subgroup title | No. of studies | No. of participants | Statistical method | Effect size |
|---|---|---|---|---|
| 1 Total Flavanones for preventing colorectal neoplasms | 2 | 2382 | Risk Ratio (M‐H, Random, 95% CI) | 1.07 [0.73, 1.57] |
| 1.1 Colorectal cancer | 1 | 1453 | Risk Ratio (M‐H, Random, 95% CI) | 0.88 [0.79, 0.98] |
| 1.2 Colorectal adenoma | 1 | 929 | Risk Ratio (M‐H, Random, 95% CI) | 1.31 [1.11, 1.53] |
| 2 Naringenin for preventing colorectal neoplasms | 2 | 2382 | Risk Ratio (M‐H, Random, 95% CI) | 1.10 [0.83, 1.45] |
| 2.1 Colorectal cancer | 1 | 1453 | Risk Ratio (M‐H, Random, 95% CI) | 0.96 [0.86, 1.07] |
| 2.2 Colorectal adenoma | 1 | 929 | Risk Ratio (M‐H, Random, 95% CI) | 1.27 [1.09, 1.49] |
| 3 Hesperetin for preventing colorectal neoplasms | 2 | 2382 | Risk Ratio (M‐H, Fixed, 95% CI) | 1.04 [0.95, 1.14] |
| 3.1 Colorectal cancer | 1 | 1453 | Risk Ratio (M‐H, Fixed, 95% CI) | 0.99 [0.89, 1.10] |
| 3.2 Colorectal adenoma | 1 | 929 | Risk Ratio (M‐H, Fixed, 95% CI) | 1.14 [0.97, 1.35] |
7.1. Analysis.
Comparison 7 Flavanones, Outcome 1 Total Flavanones for preventing colorectal neoplasms.
7.2. Analysis.
Comparison 7 Flavanones, Outcome 2 Naringenin for preventing colorectal neoplasms.
7.3. Analysis.
Comparison 7 Flavanones, Outcome 3 Hesperetin for preventing colorectal neoplasms.
Comparison 8. Phytoestrogens.
| Outcome or subgroup title | No. of studies | No. of participants | Statistical method | Effect size |
|---|---|---|---|---|
| 1 Phytoestrogens for preventing colorectal cancer | 1 | 1455 | Risk Ratio (M‐H, Random, 95% CI) | 0.96 [0.86, 1.07] |
8.1. Analysis.
Comparison 8 Phytoestrogens, Outcome 1 Phytoestrogens for preventing colorectal cancer.
Comparison 9. Anthocyanins.
| Outcome or subgroup title | No. of studies | No. of participants | Statistical method | Effect size |
|---|---|---|---|---|
| 1 Anthocyanins for preventing colorectal adenoma | 1 | 929 | Risk Ratio (M‐H, Random, 95% CI) | 1.01 [0.86, 1.19] |
9.1. Analysis.

Comparison 9 Anthocyanins, Outcome 1 Anthocyanins for preventing colorectal adenoma.
Characteristics of studies
Characteristics of included studies [ordered by study ID]
Akhter 2008.
| Methods | Prospective cohort study in Japan | |
| Participants | 83,063 cohort participants 886 cases, sub‐cohort control |
|
| Interventions | N/A | |
| Outcomes | Association of isoflavone intake with CRC risk Adjusted for age, public health centre area, history of diabetes mellitus, BMI, leisure time physical activity , smoking, alcohol, intake of vitamin D, dairy products, meat, vegetable, fruit, and fish, also adjusted for menopausal status and current use of female hormones in women |
|
| Notes | Men: Lowest HR = 1.00 2nd HR = 1.06 (95% CI, 0.82 to 1.36) 3rd HR = 0.98 (95% CI, 0.75 to 1.28) Highest HR = 0.89 (95% CI, 0.67 to 1.17) P = 0.25 Women: Lowest HR = 1.00 2nd HR = 0.88 (95% CI, 0.64 to 1.21) 3rd HR = 1.02 (95% CI, 0.74 to 1.40) Highest HR = 1.07 (95% CI, 0.78 to 1.47) P = 0.44 |
|
Akhter 2009.
| Methods | Case‐control study, population based in Japan | |
| Participants | 721 cases, 697 controls | |
| Interventions | N/A | |
| Outcomes | Association of isoflavone intake with colorectal adenoma risk Adjusted for age, sex, screening period, family history of CRC, smoking, alcohol, BMI, physical activity, supplement use and NSAID use |
|
| Notes | Total: < 24.77 mg/d OR = 1.00 24.77 to < 39.73 mg/d OR = 0.77 (95% CI, 0.57 to 1.04) 39.73 to < 62.41 mg/d OR = 0.76 (95% CI, 0.56 to 1.02) ≥ 62.41 mg/d OR = 0.70 (95% CI, 0.51 to 0.96) P = 0.03 Men: < 24.77 mg/d OR = 1.00 24.77 to < 39.73 mg/d OR = 0.80 (95% CI, 0.56 to 1.14) 39.73 to < 62.41 mg/d OR = 0.89 (95% CI, 0.62 to 1.28) ≥ 62.41 mg/d OR = 0.74 (95% CI, 0.50 to 1.09) P = 0.18 Women: < 24.77 mg/d OR = 1.00 24.77 to < 39.73 mg/d OR = 0.53 (95% CI, 0.28 to 0.98) 39.73 to < 62.41 mg/d OR = 0.44 (95% CI, 0.24 to 0.80) ≥ 62.41 mg/d OR = 0.49 (95% CI, 0.27 to 0.90) P = 0.03 |
|
Bobe 2008.
| Methods | Randomized, multicenter, nutritional intervention trial in USA | |
| Participants | 1905 participants with colorectal adenoma identified in six months before study entry (I = 958, C = 947) | |
| Interventions | Decrease fat intake by 30%, increase fibre intake by 75%, and increase 0.12 servings/MJ of fruit and vegetable intake | |
| Outcomes | Association of total flavonoids and six main flavonoid subgroups intake with adenoma recurrence Adjusted for age, sex, BMI, dietary fibre consumption, and regular NSAID use. |
|
| Notes | Total flavonoids: < 50.87 mg/d OR = 1.00 50.87 to 76.12 mg/d OR = 1.27 (95% CI, 0.96 to 1.68) 76.21 to 106.0 mg/d OR = 1.14 (95% CI, 0.85 to 1.53) > 106.0 mg/d OR = 1.25 (95% CI, 0.93 to 1.67) P = 0.27 Anthocyanins: < 5.70 mg/d OR = 1.00 5.70 to 10.06 mg/d OR = 1.27 (95% CI, 0.96 to 1.69) 10.07 to 15.58 mg/d OR = 1.17 (95% CI, 0.86 to 1.59) > 15.58 mg/d OR = 1.13 (95% CI, 0.80 to 1.60) P = 0.65 Flavan‐3‐ols: < 10.22 mg/d OR = 1.00 10.23 to 17.22 mg/d OR = 1.03 (95% CI, 0.78 to 1.36) 17.30 to 38.57 mg/d OR = 0.89 (95% CI, 0.67 to 1.18) > 38.57 mg/d OR = 0.94 (95% CI, 0.71 to 1.23) P = 0.44 Flavanones: < 10.57 mg/d OR = 1.00 10.79 to 21.97 mg/d OR = 1.21 (95% CI, 0.92 to 1.59) 22.00 to 36.86 mg/d OR = 1.21 (95% CI, 0.92 to 1.60) > 36.87 mg/d OR = 1.48 (95% CI, 1.11 to 1.96) P = 0.01 Hesperetin < 6.13 mg/d OR = 1.00 6.14 to 13.98 mg/d OR = 1.14 (95% CI, 0.86 to 1.49) 13.99 to 25.35 mg/d OR = 1.40 (95% CI, 1.07 to 1.84) > 25.35 mg/d OR = 1.16 (95% CI, 0.88 to 1.53) P = 0.14 Naringenin: < 2.93 mg/d OR = 1.00 2.93 to 5.72 mg/d OR = 1.18 (95% CI, 0.90 to 1.55) 5.73 to 10.47 mg/d OR = 1.17 (95% CI, 0.88 to 1.54) > 10.47 mg/d OR = 1.46 (95% CI, 1.09 to 1.95) P = 0.02 Flavones: < 0.46 mg/d OR = 1.00 0.46 to 0.73 mg/d OR = 0.97 (95% CI, 0.73 to 1.28) > 0.73 to 1.10 mg/d OR = 1.05 (95% CI, 0.77 to 1.42) > 1.10 mg/d OR = 1.18 (95% CI, 0.84 to 1.66) P = 0.31 Flavonols: < 8.12 mg/d OR = 1.00 8.12 to 12.01 mg/d OR = 1.19 (95% CI, 0.91 to 1.57) 12.03 to 17.30 mg/d OR = 0.89 (95% CI, 0.66 to 1.20) > 17.30 mg/d OR = 0.96 (95% CI, 0.68 to 1.36) P = 0.47 Isorhamnetin: < 0.15 mg/d OR = 1.00 0.15 to 0.28 mg/d OR = 1.26 (95% CI, 0.96 to 1.65) > 0.28 to 0.46 mg/d OR = 1.16 (95% CI, 0.88 to 1.55) > 0.46 mg/d OR = 1.11 (95% CI, 0.81 to 1.53) P = 0.60 Kaempferol: < 2.69 mg/d OR = 1.00 2.69 to 4.73 mg/d OR = 0.90 (95% CI, 0.68 to 1.17) 4.75 to 8.63 mg/d OR = 1.00 (95% CI, 0.75 to 1.33) > 8.64 mg/d OR = 0.91 (95% CI, 0.66 to 1.25) P = 0.73 Myricetin: < 0.35 mg/d OR = 1.00 0.35 to 0.54 mg/d OR = 1.06 (95% CI, 0.81 to 1.38) > 0.54 to 0.89 mg/d OR = 1.05 (95% CI, 0.80 to 1.38) > 0.89 mg/d OR = 1.01 (95% CI, 0.77 to 1.32) P = 0.98 Quercetin: < 4.12 mg/d OR = 1.00 4.12 to 5.88 mg/d OR = 1.60 (95% CI, 1.21 to 2.12) 5.89 to 7.92 mg/d OR = 1.11 (95% CI, 0.82 to 1.51) > 7.92 mg/d OR = 1.23 (95% CI, 0.88 to 1.73) P = 0.71 Isoflavonoids: < 0.045 mg/d OR = 1.00 0.045 to 0.079 mg/d OR = 1.17 (95% CI, 0.90 to 1.54) > 0.079 to 0.133 mg/d OR = 0.96 (95% CI, 0.72 to 1.29) > 0.133 mg/d OR = 1.02 (95% CI, 0.74 to 1.42) P = 0.81 Biochanin A: < 0.027 mg/d OR = 1.00 0.027 to 0.050 mg/d OR = 1.08 (95% CI, 0.82 to 1.42) > 0.050 to 0.084 mg/d OR = 1.03 (95% CI, 0.77 to 1.38) > 0.084 mg/d OR = 0.95 (95% CI, 0.69 to 1.33) P = 0.75 Daidzein: < 0.0012 mg/d OR = 1.00 0.0012 to 0.0019 mg/d OR = 1.20 (95% CI, 0.91 to 1.57) 0.0020 to 0.0030 mg/d OR = 1.05 (95% CI, 0.79 to 1.39) > 0.0030 mg/d OR = 1.13 (95% CI, 0.83 to 1.53) P = 0.64 Formononetin: < 0.0004 mg/d OR = 1.00 0.0004 to 0.0007 mg/d OR = 0.90 (95% CI, 0.68 to 1.18) 0.0007 to 0.0011 mg/d OR = 0.92 (95% CI, 0.70 to 1.23) > 0.0011 mg/d OR = 0.94 (95% CI, 0.69 to 1.29) P = 0.76 Genistein: < 0.016 mg/d OR = 1.00 0.016 to 0.028 mg/d OR = 1.04 (95% CI, 0.79 to 1.36) > 0.028 to 0.046 mg/d OR = 1.04 (95% CI, 0.78 to 1.38) > 0.046 mg/d OR = 0.98 (95% CI, 0.71 to 1.35) P = 0.93 |
|
| Risk of bias | ||
| Bias | Authors' judgement | Support for judgement |
| Random sequence generation (selection bias) | Unclear risk | The method of random sequence generation was not stated |
| Allocation concealment (selection bias) | High risk | Probably not done |
| Blinding of participants and personnel (performance bias) All outcomes | Unclear risk | No explicit statement on blinded outcome assessment |
| Blinding of outcome assessment (detection bias) All outcomes | Unclear risk | Trained nutritionists and two independent pathologists assessed the data of the study, whether they known the participants' allocation was not stated |
| Incomplete outcome data (attrition bias) All outcomes | High risk | The number of participants reported in result was less than enrolled |
| Selective reporting (reporting bias) | High risk | Probably done |
| Other bias | Low risk | Total number of adenoma recurrence at the end of study; quantitated of flavonoids intake; |
Cutler 2008.
| Methods | Prospective cohort study in USA | |
| Participants | 34,708 cohort participants 7,534 cases, sub‐cohort control |
|
| Interventions | N/A | |
| Outcomes | Association of total flavonoids and seven flavonoid subclasses with lung, colorectal, breast, pancreatic and upper aerodigestive cancer risk among postmenopausal women Adjusted for age, energy intake , education level, race, BMI, multivitamin use, activity, smoking history and pack years |
|
| Notes | HRs of colorectal cancer was not stated | |
Lin 2006.
| Methods | Cohort study through a pooled analysis of two prospective cohort study, USA | |
| Participants | 71,976 women from the Nurses' Health Study and 35,425 men from the Health Professionals Follow‐up Study 878 cases, sub‐cohort control |
|
| Interventions | N/A | |
| Outcomes | Association of total flavonoids and three flavonoid subclasses intake with CRC risk Adjusted for age, BMI, family history of CRC, history of colorectal polyps, prior sigmoidoscopy screening, physical activity, smoking, red meat intake, alcohol , total energy, calcium, folate and fibre intake, aspirin and multivitamin use, and postmenopausal hormone replacement therapy in women |
|
| Notes | Total flavonoids: Q1 RR = 1.00 Q2 RR = 0.99 (95%CI, 0.78 to 1.23) Q3 RR = 1.00 (95%CI, 0.79 to 1.26 ) Q4 RR = 1.01 (95%CI, 0.80 to 1.28 ) Q5 RR = 1.19 (95%CI, 0.94 to 1.49 ) P = 0.15 Quercetin: Q1 RR = 1.00 Q2 RR = 0.93 (95%CI, 0.55 to 1.57) Q3 RR = 1.00 (95%CI, 0.74 to 1.18 ) Q4 RR = 1.01 (95%CI, 0.63 to 1.60 ) Q5 RR = 1.06 (95%CI, 0.84 to 1.34 ) P = 0.23 Kaempferol: Q1 RR = 1.00 Q2 RR = 0.94 (95%CI, 0.70 to 1.26) Q3 RR = 0.93 (95%CI, 0.74 to 1.16 ) Q4 RR = 0.88 (95%CI, 0.68 to 1.14 ) Q5 RR = 1.12 (95%CI, 0.90 to 1.39 ) P = 0.25 Myricetin: Q1 RR = 1.00 Q2 RR = 0.89 (95%CI, 0.60 to 1.31) Q3 RR = 0.91 (95%CI, 0.53 to 1.58 ) Q4 RR = 0.94 (95%CI, 0.72 to 1.23 ) Q5 RR = 1.07 (95%CI, 0.67 to 1.59 ) P = 0.70 |
|
Simons 2009.
| Methods | Case cohort study in Netherlands | |
| Participants | 120,852 cohort participants aged 55 to 69 years 2485 cases, sub‐cohort control |
|
| Interventions | N/A | |
| Outcomes | Association of flavonol, flavone and catechin intake with CRC risk Adjusted for age, family history ofCRC, smoking, alcohol, occupational physical activity at longest held job, BMI and processed meat intake |
|
| Notes | Men: Favonol and flavone: 1.4 to 16.0 mg/d HR = 1.00 16.0 to 22.5 mg/d HR = 0.95 (95%CI, 0.75 to 1.21) 22.4 to 28.3 mg/d HR = 0.81 (95%CI, 0.63 to 1.04) 28.2 to 36.1 mg/d HR = 0.89 (95%CI, 0.70 to 1.14) 36.0 to 105.0 mg/d HR = 0.97 (95%CI, 0.76 to 1.23) P = 0.83 Catechin: < 24.2 mg/d HR = 1.00 24.1 to 44.4 mg/d HR = 1.01 (95%CI, 0.79 to 1.28) 44.3 to 62.8 mg/d HR = 0.85 (95%CI, 0.67 to 1.09) 62.8 to 84.4 mg/d HR = 0.85 (95%CI, 0.67 to 1.08) 84.3 to 290.1 mg/d HR = 0.99 (95%CI, 0.77 to 1.25) P = 0.65 Women: Favonol and flavone: 0.6 to 18.4 mg/d HR = 1.00 18.3 to 25.0 mg/d HR = 0.85 (95%CI, 0.66 to 1.10) 24.9 to 31.1 mg/d HR = 0.98 (95%CI, 0.76 to 1.25) 31.0 to 38.4 mg/d HR = 0.80 (95%CI, 0.62 to 1.03) 38.3 to 93.6 mg/d HR = 0.90 (95%CI, 0.70 to 1.16) P = 0.40 Catechin: < 36.2 mg/d HR = 1.00 36.2 to 51.6 mg/d HR = 0.90 (95%CI, 0.70 to 1.16) 51.6 to 75.4 mg/d HR = 0.79 (95%CI, 0.61 to 1.02) 75.3 to 95.9 mg/d HR = 1.02 (95%CI, 0.79 to 1.30) 95.9 to 287.3 mg/d HR = 0.79 (95%CI, 0.61 to 1.02) P = 0.20 |
|
Theodoratou 2007.
| Methods | Case‐control study in Scotland | |
| Participants | 1456 cases, 1456 controls | |
| Interventions | N/A | |
| Outcomes | Association of six main flavonoid subclasses intake with CRC risk Adjusted for family history of CRC, total energy intake, total fibre intake, alcohol intake, NSAID intake, smoking, BMI, physical activity.and mutually between flavonoid categories |
|
| Notes | Flavonols: 0 to 16.00 mg/d OR = 1.00 16.00 to 27.40 mg/d OR = 1.00 27.40 to 36.75 mg/d OR = 0.41 (95%CI, 0.27 to 0.63) > 36.75 mg/d OR = 0.23 (95%CI, 0.13 to 0.40) P < 0.0005 Quercetin: 0 to 11.67 mg/d OR = 1.00 11.67 to 17.71 mg/d OR = 0.75 (95%CI, 0.57 to 0.99) 17.71 to 22.86 mg/d OR = 0.55 (95%CI, 0.37 to 0.81) > 22.86 mg/d OR = 0.38 (95%CI, 0.22 to 0.63) P < 0.0005 Flavones: 0 to 0.5 mg/d OR = 1.00 0.5 to 1.1 mg/d OR = 1.05 (95%CI, 0.85 to 1.31) 1.1 to 1.9 mg/d OR = 1.01 (95%CI, 0.81 to 1.26) > 1.9 mg/d OR = 1.30 (95%CI, 1.01 to 1.68) P = 0.641 Flavan‐3‐ols: 0 to 42.6 mg/d OR = 1.00 42.6 to 115.25 mg/d OR = 1.10 (95%CI, 0.81 to 1.49) 115.25 to 162.1 mg/d OR = 1.56 (95%CI, 0.98 to 2.50) > 162.1 mg/d OR = 1.37 (95%CI, 0.73 to 2.57) P = 0.301 Catechin: 0 to 4.85 mg/d OR = 1.00 4.85 to 7.23 mg/d OR = 0.75 (95%CI, 0.58 to 0.97) 7.23 to 9.40 mg/d OR = 0.56 (95%CI, 0.41 to 0.76) > 9.40 mg/d OR = 0.46 (95%CI, 0.32 to 0.65) P < 0.0005 Epicatechin: 0 to 13.29 mg/d OR = 1.00 13.29 to 24.24 mg/d OR = 0.64 (95%CI, 0.47 to 0.86) 24.24 to 32.61 mg/d OR = 0.52 (95%CI, 0.33 to 0.82) > 32.61 mg/d OR = 0.28 (95%CI, 0.15 to 0.50) P < 0.0005 Procyanidins: 0 to 16.67 mg/d OR = 1.00 16.67 to 32.65 mg/d OR = 0.77 (95%CI, 0.57 to 1.04) 32.65 to 45.16 mg/d OR = 0.64 (95%CI, 0.42 to 0.99) > 45.16 mg/d OR = 0.46 (95%CI, 0.27 to 0.81) P = 0.005 Flavanones: 0 to 16.67 mg/d OR = 1.00 16.67 to 32.65 mg/d OR = 1.43 (95%CI, 1.15 to 1.80) 32.65 to 45.16 mg/d OR = 1.35 (95%CI, 1.08 to 1.70) > 45.16 mg/d OR = 1.18 (95%CI, 0.93 to 1.50) P = 0.219 Naringenin: 0 to 3.81 mg/d OR = 1.00 3.81 to 9.98 mg/d OR = 1.41 (95%CI, 1.12 to 1.77) 9.98 to 19.73 mg/d OR = 1.46 (95%CI, 1.13 to 1.89) > 19.73 mg/d OR = 1.19 (95%CI, 0.81 to 1.76) P = 0.049 Hesperetin: 0 to 3.95 mg/d OR = 1.00 3.95 to 10.66 mg/d OR = 1.43 (95%CI, 1.13 to 1.80) 10.66 to 21.13 mg/d OR = 1.36 (95%CI, 1.06 to 1.75) > 21.13 mg/d OR = 1.21 (95%CI, 0.83 to 1.77) P = 0.092 Phytoestrogens: 0 to 402.68 mg/d OR = 1.00 402.68 to 583.54 mg/d OR = 1.21 (95%CI, 0.97 to 1.51) 583.54 to 857.55 mg/d OR = 1.11 (95%CI, 0.89 to 1.38) > 857.55 mg/d OR = 0.90 (95%CI, 0.72 to 1.13) P = 0.264 |
|
Wang 2009.
| Methods | Prospective cohort study in USA | |
| Participants | 38,408 women aged ≥ 45 years 3234 cases, sub‐cohort control |
|
| Interventions | N/A | |
| Outcomes | Association of flavonoids intake with breast, colorectal, lung, endometrial and ovarian cancer risk Adjusted for smoking , alcohol, physical activity, postmenopausal status, hormone replacement therapy use, multivitamin use, BMI, family history of CRC, ovary cancer, and breast cancer, intake of fruit and vegetables, fibre, folate and saturated fat, and history of benign colorectal polyps |
|
| Notes | Total flavonoids (CRC): 0 to 11.55 mg/d RR = 1.00 11.56 to 16.30 mg/d RR = 0.89 (95%CI, 0.61 to 1.29) 16.31 to 22.53 mg/d RR = 0.68 (95%CI, 0.46 to 1.02) 22.54 to 34.54 mg/d RR = 0.88 (95%CI, 0.60 to 1.29) 34.55 to 236.38 mg/d RR = 1.01 (95%CI, 0.68 to 1.49) P = 0.47 |
|
Characteristics of excluded studies [ordered by study ID]
| Study | Reason for exclusion |
|---|---|
| Adams 2005 | Without available data |
| Aklilu 2003 | Phase II clinical study |
| Arts 2002 | Double published |
| Cruz–Correa 2006 | Clinical study of FAP |
| Goldbohm 1996 | No flavonoids |
| Knekt 1997 | Without available data |
| Knekt 2002 | Without available data |
| Kyle 2010 | Without available data |
| Rohrmann 2009 | No flavonoids |
| Rossi 2006 | Without available data |
| Tabernero 2007 | No flavonoids |
Contributions of authors
| Draft the protocol | Heiying Jin, Qiang Leng, Chunbo Li |
| Develop a search strategy | Heiying Jin, Chunbo Li |
| Search for trials | Heiying Jin, Qiang Leng |
| Select which trials to include | Heiying Jin, Qiang Leng, Chunbo Li |
| Extract data from trials | Heiying Jin, Qiang Leng |
| Enter data into RevMan | Heiying Jin, Qiang Leng |
| Carry out the analysis | Heiying Jin, Qiang Leng, Chunbo Li |
| Interpret the analysis | Heiying Jin, Qiang Leng, Chunbo Li |
| Draft the final review | Heiying Jin, Qiang Leng, Chunbo Li |
Declarations of interest
None.
New
References
References to studies included in this review
Akhter 2008 {published data only}
- Akhter M, Inoue M, Kurahashi N, Iwasaki M, Sasazuki S, Tsugane S. Dietary Soy and Isoflavone Intake and Risk of Colorectal Cancer in the Japan Public Health Center–Based Prospective Study. Cancer Epidemiology Biomarkers & Prevention 2008;17(8):2128‐35. [DOI] [PubMed] [Google Scholar]
Akhter 2009 {published data only}
- Akhter M, Iwasaki M, Yamaji T, Sasazuki S, Tsugane S. Dietary isoflavone and the risk of colorectal adenoma: a case–control study in Japan. British journal of cancer 2009;100(11):1812‐16. [DOI] [PMC free article] [PubMed] [Google Scholar]
Bobe 2008 {published data only}
- Bobe G, Sansbury LB, Albert PS, Cross AJ, Kahle L, Ashby J, et al. Dietary flavonoids and colorectal adenoma recurrence in the Polyp Prevention Trial. Cancer Epidemiology Biomarkers & Prevention 2008;17(6):1344‐53. [DOI] [PMC free article] [PubMed] [Google Scholar]
Cutler 2008 {published data only}
- Cutler GJ, Nettleton JA, Ross JA, Harnack LJ, Jacobs Jr DR, Scrafford CG, et al. Dietary flavonoid intake and risk of cancer in postmenopausal women: the Iowa Women's Health Study. International Journal of Cancer 2008;123(3):664‐71. [DOI] [PMC free article] [PubMed] [Google Scholar]
Lin 2006 {published data only}
- Lin J, Zhang SM, Wu K, Willett WC, Fuchs CS, Giovannucci E. Flavonoid intake and colorectal cancer risk in men and women. American journal of epidemiology 2006;164(7):644‐51. [DOI] [PubMed] [Google Scholar]
Simons 2009 {published data only}
- Simons CCJM, Hughes LAE, Arts ICW, Goldbohm RA, Brandt PA, Weijenberg MP. Dietary flavonol, flavone and catechin intake and risk of colorectal cancer in the Netherlands Cohort Study. International Journal of Cancer 2009;125(12):2945‐52. [DOI] [PubMed] [Google Scholar]
Theodoratou 2007 {published data only}
- Theodoratou E, Kyle J, Cetnarskyj R, Farrington SM, Tenesa A, Barnetson R, et al. Dietary flavonoids and the risk of colorectal cancer. Cancer Epidemiology Biomarkers & Prevention 2007;16(4):684‐93. [DOI] [PubMed] [Google Scholar]
Wang 2009 {published data only}
- Wang L, Lee I, Zhang SM, Blumberg JB, Buring JE, Sesso HD. Dietary intake of selected flavonols, flavones, and flavonoid‐rich foods and risk of cancer in middle‐aged and older women. The American journal of clinical nutrition 2009;89(3):905‐12. [DOI] [PMC free article] [PubMed] [Google Scholar]
References to studies excluded from this review
Adams 2005 {published data only}
- Adams KF, Lampe PD, Newton KM, Ylvisaker JT, Feld A, Myerson D, et al. Soy protein containing isoflavones does not decrease colorectal epithelial cell proliferation in a randomized controlled trial. The American journal of clinical nutrition 2005;82(3):620‐26. [DOI] [PubMed] [Google Scholar]
Aklilu 2003 {published data only}
- Aklilu M, Kindler H, Donehower R, Mani S, Vokes E. Phase II study of flavopiridol in patients with advanced colorectal cancer. Annals of oncology 2003;14(8):1270‐73. [DOI] [PubMed] [Google Scholar]
Arts 2002 {published data only}
- Arts ICW, Jacobs DR, Gross M, Harnack LJ, Folsom AR. Dietary catechins and cancer incidence among postmenopausal women: the Iowa Women's Health Study (United States). Cancer Causes and Control 2002;13(4):373‐82. [DOI] [PubMed] [Google Scholar]
Cruz–Correa 2006 {published data only}
- Cruz–Correa M, Shoskes DA, Sanchez P, Zhao R, Hylind LM, Wexner SD, et al. Combination treatment with curcumin and quercetin of adenomas in familial adenomatous polyposis. Clinical Gastroenterology and Hepatology 2006;4(8):1035‐38. [DOI] [PubMed] [Google Scholar]
Goldbohm 1996 {published data only}
- Goldbohm RA, Hertog MGL, Brants HAM, Poppel G, Brandt PA. Consumption of black tea and cancer risk: a prospective cohort study. Journal of the National Cancer Institute 1996;88(2):93‐100. [DOI] [PubMed] [Google Scholar]
Knekt 1997 {published data only}
- Knekt P, Järvinen R, Seppänen R, Heliövaara M, Teppo L, Pukkala E, et al. Dietary flavonoids and the risk of lung cancer and other malignant neoplasms. American Journal of Epidemiology 1997;146(3):223‐30. [DOI] [PubMed] [Google Scholar]
Knekt 2002 {published data only}
- Knekt P, Kumpulainen J, Järvinen R, Rissanen H, Heliövaara M, Reunanen A, et al. Flavonoid intake and risk of chronic diseases. The American journal of clinical nutrition 2002;76(3):560‐68. [DOI] [PubMed] [Google Scholar]
Kyle 2010 {published data only}
- Kyle J, Sharp L, Little J, Duthie GG, McNeill G. Dietary flavonoid intake and colorectal cancer: a case‐control study. Br J Nutr 2010;103(3):429‐36. [DOI] [PubMed] [Google Scholar]
Rohrmann 2009 {published data only}
- Rohrmann S, Hermann S, Linseisen J. Heterocyclic aromatic amine intake increases colorectal adenoma risk: findings from a prospective European cohort study. The American journal of clinical nutrition 2009;89(5):1418‐24. [DOI] [PubMed] [Google Scholar]
Rossi 2006 {published data only}
- Rossi M, Negri E, Talamini R, Bosetti C, Parpinel M, Gnagnarella P, et al. Flavonoids and colorectal cancer in Italy. Cancer Epidemiology Biomarkers & Prevention 2006;15(8):1555‐58. [DOI] [PubMed] [Google Scholar]
Tabernero 2007 {published data only}
- Tabernero M, Serrano J, Saura‐Calixto F. Dietary fiber intake in two European diets with high (Copenhagen, Denmark) and low (Murcia, Spain) colorectal cancer incidence. Journal of agricultural and food chemistry 2007;55(23):9443‐49. [DOI] [PubMed] [Google Scholar]
Additional references
Abraham 2008
- Nomura AM, Wilkens LR, Murphy SP, Hankin JH, Henderson BE, Pike MC, et al. Association of vegetable, fruit, and grain intakes with colorectal cancer: the Multiethnic Cohort Study. American Joural of Clinical Nutrition 2008;88:730‐7. [DOI] [PMC free article] [PubMed] [Google Scholar]
Aherne 2002
- Aherne SA, ?Brien NM. Dietary flavonols: chemistry, food content, and metabolism. Nutrition 2002;18:75‐81. [DOI] [PubMed] [Google Scholar]
Almendingen 2002
- Almendingen K, Hofstad B, Vatn MH. Lifestyle‐related factors and colorectal polyps: preliminary results from a Nowegian follow‐up and intervention study. European Journal of Cancer Prevention 2002;11:153‐8. [DOI] [PubMed] [Google Scholar]
Boyle 2000
- Boyle P, Langman JS. ABC of colorectal cancer: Epidemiology. British Medical Joural 2000;321(7264):805‐8. [DOI] [PMC free article] [PubMed] [Google Scholar]
Brian 2007
- Brian NF, Susan ES, Mary SW, Julie AB, Geoffrey CK, Jane CS, et al. Dietary Flavonoid Intake and Breast Cancer Risk among Women on Long Island. American Joural of Epidemiology 2007;165:514‐23. [DOI] [PubMed] [Google Scholar]
Cara 2008
- Cara LF, James RC, Wendy C, Scott D, Maryjean S, Lindsay MM, et al. Dietary flavonoid intake and non‐Hodgkin lymphoma risk. American Joural of Clinical Nutrition 2008;87:1439‐45. [DOI] [PMC free article] [PubMed] [Google Scholar]
Dragsted 1993
- Dragsted LO, Strube M, Larsen JC. Cancer‐protective factors in fruits and vegetables: biochemical and biological background. Pharmacology and Toxicology 1993;72:116‐35. 1993;72:116‐35. [DOI] [PubMed] [Google Scholar]
Dragsted 2006
- Dragsted, LO, Krath B, Ravn HG, Vogel UB, Vinggaard AM, et al. Biological effects of fruit and vegetables. Proceedings of Nutrition Society 2006;65:61‐7. [DOI] [PubMed] [Google Scholar]
Evropi 2007
- Evropi T, Janet K, Roseanne C, Susan MF, Albert T, Rebecca B, et al. Dietary Flavonoids and the Risk of Colorectal Cancer. Cancer. Epidemiology, Biomarkers and Prevention 2007;16:684‐93. [DOI] [PubMed] [Google Scholar]
Fränzel 2009
- Fränzel JD, H Bas BDM, Pietro F, Mazda J, Hendriek CB, Martine MR, et al. Fruit, vegetables, and colorectal cancer risk: the European Prospective Investigation into Cancer and Nutrition. American Joural of Clinical Nutrition 2009;89:1441‐52. [DOI] [PubMed] [Google Scholar]
Gerd 2008
- Gerd B, Leah BS, Paul SA, Amanda JC, Lisa K, Jason A, et al. Dietary Flavonoids and Colorectal Adenoma Recurrence in the Polyp Prevention Trial. Cancer Epidemiology, Biomarkers and Prevention 2008;17:1344‐53. [DOI] [PMC free article] [PubMed] [Google Scholar]
Graf 2005
- Graf BA, Milbury PE, Blumberg JB. Flavonols, flavones, flavanones, and human health: epidemiological evidence. Joural of Medicinal Food 2005;8:281‐90. [DOI] [PubMed] [Google Scholar]
Heim 2002
- Heim KE, Tagliaferro AR, Bobilya DJ. Flavonoid antioxidants: chemistry, metabolism and structure‐activity relationships. Joural of Nutritional Biochemistry 2002;13:572‐84. [DOI] [PubMed] [Google Scholar]
Higgins 2008
- Cochrane Handbook for Systematic Reviews of Interventions Version 5.0.0. 5.0.0 edition. The Cochrane Collaboration 2008, updated February 2008;Cochrane Handbook for Systematic Reviews of Interventions Version 5.0.1. The Cochrane Collaboration 2008.
Isabel 2007
- Isabel W, Daniela D, Doris O, Hannelore D, Uwe W. The suppression of aberrant crypt multiplicity in colonic tissue of 1,2‐dimethylhydrazine‐treated C57BL/6J mice by dietary flavone is associated with an increased expression of Krebs cycle enzymes. Carcinogenesis 2007;28(7):1446‐54. [DOI] [PubMed] [Google Scholar]
LoÏk 1997
- LoÏk LM, Lynne RW, Laurence NKl, Jean HH, Li CL. Assocoation of Sedentary Lifestyle, Obesity, Smoking, Alcohol use, and Diabetes with the Risk of Colorectal Cancer. Cancer Research 1997;57:4787‐94. [PubMed] [Google Scholar]
Messina 2006
- Messina M, Kucuk O, Lampe J. An overview of the health effects of isoflavones with an emphasis on prostate cancer risk and prostate specific antigen levels. Joural of AOAC International 2006;89:1121‐34. [PubMed] [Google Scholar]
Miksicek 1993
- Miksicek RJ. Commonly occurring plant flavonoids have estrogenic activity. Molecular Pharmacology 1993;44:37‐43. [PubMed] [Google Scholar]
Na‐Ping 2009
- Na‐Ping T, Bo Z, Bin W, Rong‐Bin Y, Jing M. Flavonoids Intake and Risk of Lung Cancer: A Meta‐analysis. Japanese Joural of Clinical Oncology 2009;39(6):352‐9. [DOI] [PubMed] [Google Scholar]
Naghma 2008a
- Naghma K, Mohammad A, Farrukh A, Mohammad AZ, Hasan M. A Novel Dietary Flavonoid Fisetin Inhibits Androgen ReceptorSignaling and Tumor Growth in Athymic Nude Mice. Cancer Research 2008;68:8555‐63. [DOI] [PMC free article] [PubMed] [Google Scholar]
Naghma 2008b
- Naghma K, Farrukh A, Deeba NS, Hasan M. Fisetin, a novel dietary flavonoid, causes apoptosis and cell cycle arrest in human prostate cancer LNCaP cells. Carcinogenesis 2008;29(5):1049‐56. [DOI] [PMC free article] [PubMed] [Google Scholar]
Robin 2009
- Robin TW, Jiangyue W, Vernon C, John PR, Jarmo V, Lee EM, et al. Fish, Vitamin D, and Flavonoids in Relation to Renal Cell Cancer Among Smokers. American Joural of Epidemiology 2009;170:717‐29. [DOI] [PMC free article] [PubMed] [Google Scholar]
Sanjoaquin 2004
- Sanjoaquin MA, Appleby PN, Thorogood M, Mann JI, Key TJ. Nutrition, lifestyle and colorectal cancer incidence: a prospective investigation of 10998 vegetarians and non‐vegetarians in the United Kingdom. British Journal of Cancer 2004;90:118‐21. [DOI] [PMC free article] [PubMed] [Google Scholar]
Steinmetz 1991
- Steinmetz KA, Potter JD. Vegetables, fruit, and cancer. II.Mechanisms. Cancer Causes and Control 1991;2:427‐42. [DOI] [PubMed] [Google Scholar]
Steinmetz 1996
- Steinmetz KA, Potter JD. Vegetables, fruit, and cancer prevention: a review. Joural of American Dietetic Association 1996;96:1027‐39. [DOI] [PubMed] [Google Scholar]
WCRF 1997
- World Cancer Research Fund, American Institute for Cancer Research Expert Panel. Washington, DC: American Institute for Cancer Research.
WCRFAICR 2007
- World Cancer Research Fund and American Institute for Cancer Research. Food, Nutrition, Phycical Activity, and the Prevention of Cancer: A Global Perspective. Washington, DC: American Institution for Cancer Research 2007.
WHO 2002
- World Health Organization. Cancer Icidence In Five Continents. Lyon. The World Health Organization and The International Agency for Research on Cancer. 2002.
Yewseok 2009
- Yewseok S, Farrukh A, Jeremy JJ, Hasan M. A plant flavonoid fisetin induces apoptosis in colon cancer cells by inhibition of COX2and Wnt/EGFR/NF‐kB‐signaling pathways. Carcinogenesis 2009;30(2):300‐7. [DOI] [PMC free article] [PubMed] [Google Scholar]
Zhong 2010
- Zhong Y, Krisanapun C, Lee SH, Nualsanit T, Sams C, Peungvicha P, et al. Molecular targets of apigenin in colorectal cancer cells: involvement of p21, NAG‐1 and p53. European Joural of Cancer 2010;46(18):3365‐74. [DOI] [PMC free article] [PubMed] [Google Scholar]