

Abstract
Purpose
The aim of this study was to compare the effect of a pressure-controlled strategy allowing non-synchronised unassisted spontaneous ventilation (PC-SV) to a conventional volume assist-control strategy (ACV) on the outcome of patients with acute respiratory distress syndrome (ARDS).
Methods
Open-label randomised clinical trial in 22 intensive care units (ICU) in France. Seven hundred adults with moderate or severe ARDS (PaO2/FiO2 < 200 mmHg) were enrolled from February 2013 to October 2018. Patients were randomly assigned to PC-SV (n = 348) or ACV (n = 352) with similar objectives of tidal volume (6 mL/kg predicted body weight) and positive end-expiratory pressure (PEEP). Paralysis was stopped after 24 h and sedation adapted to favour patients’ spontaneous ventilation. The primary endpoint was in-hospital death from any cause at day 60.
Results
Hospital mortality [34.6% vs 33.5%, p = 0.77, risk ratio (RR) = 1.03 (95% confidence interval [CI] 0.84–1.27)], 28-day mortality, as well as the number of ventilator-free days and organ failure-free days at day 28 did not differ between PC-SV and ACV groups. Patients in the PC-SV group received significantly less sedation and neuro-muscular blocking agents than in the ACV group. A lower proportion of patients required adjunctive therapy of hypoxemia (including prone positioning) in the PC-SV group than in the ACV group [33.1% vs 41.3%, p = 0.03, RR = 0.80 (95% CI 0.66–0.98)]. The incidences of pneumothorax and refractory hypoxemia did not differ between the groups.
Conclusions
A strategy based on PC-SV mode that favours spontaneous ventilation reduced the need for sedation and adjunctive therapies of hypoxemia but did not significantly reduce mortality compared to ACV with similar tidal volume and PEEP levels.
Supplementary Information
The online version contains supplementary material available at 10.1007/s00134-024-07612-3.
Keywords: Acute respiratory distress syndrome, Mechanical ventilation, Spontaneous ventilation, Pressure-controlled ventilation, Sedation, Neuro-muscular blocking agents
Take-home message
| In patients with acute respiratory distress syndrome, the use of a pressure-controlled mode allowing spontaneous ventilation may facilitate reducing sedation and adjunctive therapies for hypoxemia and is as efficient as conventional ventilation. |
Introduction
Lung protective ventilation refers to an approach to mechanical ventilation considered as the mainstay of symptomatic treatment of patients suffering from an acute respiratory distress syndrome (ARDS). It significantly improves the prognosis of these patients mostly by limiting inspiratory alveolar distention (mediated by tidal volume reduction and plateau pressure limitation) and preventing lung volume reduction (mediated by sufficient positive end-expiratory pressure, PEEP).
The high ventilatory drive often exhibited by these patients frequently necessitates the use of deep sedation and even paralysis to properly manage ventilation at the early phase of ARDS. The transition to spontaneous breathing is often challenging [1]. Indeed, when high ventilatory demand is present, high tidal volume and major asynchronies may ensue with a risk of so-called “patient self-inflicted lung injury” which can be considered as a vicious spiral preventing the recovery of lung damage. Conversely, too much sedation and excessive use of paralysis may significantly affect diaphragmatic force and function, which are essential as soon as the weaning process starts. Ventilator-induced diaphragmatic dysfunction has been incriminated in undue significant prolongation of the time under mechanical ventilation [2]. More recently, the concept of lung- and diaphragm-protective approach that combine lung protective approach and spontaneous diaphragmatic activity while avoiding excessive distension to prevent diaphragm atrophy has emerged as being potentially associated with improved outcomes [3]. Paradoxically, we showed that pressure controlled with spontaneous unassisted breaths mode of ventilation is an alternative to conventional volume assist-control mode that may permit by its specific working principle to better cope with this physiologically based objective of ventilation [4, 5]. Only low evidence is currently available to support this lung- and diaphragm-protective approach in patients with ARDS [6–8].
The purpose of the present randomised clinical trial was to evaluate the impact on outcome of patients with ARDS of a pressure-controlled strategy allowing non-synchronized unassisted spontaneous ventilation (PC-SV) and thus minimising the risk of high volumes resulting from synchronised mechanical breaths and inspiratory efforts [4], compared to volume assist-control mode (ACV).
Methods
Study design
This was a multicentre open-labelled randomised clinical trial. The trial enrolled participants from February 2013 to October 2018 at 22 French university (16) and non-university hospitals (6) intensive care units (ICUs) of the REVA (Réseau Européen de recherche en Ventilation Artificielle) Network. In agreement with French regulation, the study protocol was approved for all centres by the ethics committee of the Angers University Hospital (Comité de Protection des Personnes, CHU d’Angers, ID RCB #2012-A00551-42). Informed consent was provided by study participants or their surrogates in written form before study inclusion. The study was registered on ClinicalTrials.gov (identifier: NCT01862016).
The trial protocol and statistical analysis plan are provided in the electronic supplementary material (ESM).
Patients
Patients with moderate to severe ARDS (partial pressure of arterial oxygen tension/fraction of inspired oxygen (PaO2/FiO2) ratio ≤ 200 mmHg with PEEP ≥ 5 cmH2O) were eligible for enrolment if the four criteria of the Berlin definition were met for no more than 48 h [9].
Main exclusion criteria were suspected or confirmed increased intracranial pressure, sickle cell disease, severe chronic respiratory disease requiring long-term oxygen therapy or home mechanical ventilation, actual body weight exceeding 1 kg/cm of height, severe burns, severe chronic liver disease (Child–Pugh class C), bone marrow transplant or chemotherapy-induced neutropenia, pneumothorax, expected duration of mechanical ventilation shorter than 48 h, decision to withhold life-sustaining treatment, ventilator recommended for the study not available. Additional exclusion criteria are detailed in ESM, page 2.
Randomisation
Patients were randomly assigned in permuted blocks stratified by centre. Blinding treating clinicians to group assignment was not feasible, but analyses were conducted blindly.
Procedures
We compared conventional ACV to PC-SV which is a time-triggered, pressure-limited, time-cycled mode of ventilation embedding a specific working principle allowing superimposed spontaneous ventilation without synchronisation with mandatory breaths. PC-SV was provided by using the airway pressure release ventilation (APRV) mode on the Evita 4, XL or V500 Draeger ventilators (Lubeck, Germany). We designed a specific strategy to set PC-SV and ACV with a similar respiratory pattern (tidal volume, I/E ratio and PEEP) (ESM 1, Figure S1). A predefined protocol targeting spontaneous ventilation amounting to 10–50% of minute ventilation with a predefined sedation score target was implemented in the PC-SV group to favour spontaneous ventilation as soon as paralysis was stopped. Reduction of sedation was encouraged according to a similar sedation score objective in the ACV group.
Ventilation before application of the randomised strategy (during the first three hours after enrolment)
All patients were initially ventilated in ACV (tidal volume of 6 mL/kg predicted body weight (PBW) with a constant inspiratory flow) under deep sedation and paralysis irrespective of their randomisation arm. External PEEP was increased stepwise to reach an inspiratory plateau pressure of 28 cmH2O, as described in a previous trial [10] (see ESM 1 for more details).
PC-SV strategy
PEEP also called low airway pressure in PC-SV was set as previously defined in ACV during the first 3 h after enrolment. The high airway pressure (PHigh) duration time was set at 1 s and the level of PHigh was adjusted to obtain a tidal volume of 6 mL/kg PBW with a plateau pressure lower or equal to 28 cmH2O. The low airway pressure duration time was initially set to obtain the same respiratory rate as in ACV (to obtain a pH between 7.30 and 7.40).
Twenty-four hours after enrolment, neuro-muscular blocking agents (NMBA) were stopped and sedation was adapted daily to maintain a Richmond Agitation-Sedation Scale (RASS) score between −2 and −3 and low airway pressure time was lengthened to 2 s (corresponding to a respiratory rate set at 20 cycles/min) to favour spontaneous ventilation. The objective was to obtain a spontaneous ventilation representing 10–50% of the total minute ventilation with a spontaneous tidal volume lower or equal to 6 mL/kg PBW. The contribution of spontaneous ventilation to total minute ventilation was assessed by the visual appreciation of the ventilator’s minute ventilation trend curve on the ventilator screen at least three times a day (ESM 1, Figure S2). Sedation and/or ventilator settings were then adjusted according to a simple algorithm to maintain the objective of spontaneous ventilation, modifying either minute ventilation or sedation (ESM 1, Figure S3).
ACV strategy
The initial ACV ventilator settings as defined during the first 3 h after enrolment before application of the randomised strategy (ACV with a tidal volume of 6 mL/kg PBW and PEEP to reach an inspiratory plateau pressure of 28 cmH2O, as in the PC-SV group) were maintained during the first 24 h after enrolment. After 24 h, it was recommended to stop NMBA and sedation was adapted daily to maintain a RASS score between −2 and −3, as in the PC-SV group. Daily assessment of patient-ventilator asynchronies based on simple definitions was recommended to further adapt sedation and/or ventilator settings (ESM 1, Table S1).
Ventilation settings recommendations common to both treatment groups
PEEP adaptation and weaning
After the first 24 h following enrolment, PEEP could be increased only in case of refractory hypoxemia. Conversely, PEEP reduction was considered when plateau pressure was higher than 28 cmH2O in the ACV group or if the tidal volume dropped lower than 6 mL/kg PBW despite a plateau pressure of 28 cmH2O in the PC-SV group.
Recommendations for PEEP weaning after day 3 are detailed in the electronic supplementary material (ESM 1).
Paralysis
The possibility to resume NMBA after the initial stop 24 h after enrolment was considered only if criteria of acceptable patient-ventilator adaptation were not reached despite the optimisation of sedation (ESM 1, table S1).
Adjunctive therapies
Prone position was recommended in patients with profound hypoxemia defined by a PaO2/FiO2 ratio lower or equal to 100 mmHg. Paralysis was not mandatory for prone positioning. See ESM1 for details regarding inhaled nitric oxide (NO), intravenous almitrine and extracorporeal ventilatory support (extracorporeal membrane oxygenation, ECMO).
Weaning from ventilation recommendations were common on both groups (see ESM1).
Outcome
The primary endpoint was in-hospital death from any cause at day 60 after randomisation. Secondary endpoints included mortality at day 28, numbers of ventilator-free days, organ failure-free days, and vasoactive drugs-free days at day 28, total amounts of vasoactive drugs and fluids received during the first 7 days after inclusion, incidence of refractory hypoxemia during the first 7 days of treatment, proportion of patients requiring adjunctive treatment of hypoxemia during the first 7 days, number of days alive without sedation at day 28, total amounts of sedative drugs and NMBA during the first seven days after inclusion, mean sedation level from day 1 to day 7 (assessed using the RASS score), sedation assessed using the RASS score presented as an ordinal variable at day one, three and 7, duration of ventilation and ICU stay. Refractory hypoxemia was defined as a PaO2 lower than 55 mmHg or a SaO2 lower than 88% for more than 30 min despite a FiO2 of 80% or higher.
Pre-planned subgroup analyses included analyses according to PaO2/FiO2 (≤ or > 100 mmHg), respiratory system compliance (< or ≥ 35 mL/cmH2O) and radiological score (≤ or > 7) at admission.
A radiological score quantifying lung opacities in the four quadrants on chest radiography at inclusion (ranging from 0 corresponding to no opacity to 12 corresponding to confluent alveolar opacities in the four quadrants) was collected [11] (see ESM 1 for more details).
Statistical analysis
A sample size calculations showed that assuming a 35% mortality rate in the control group, 350 patients per group would provide 80% power at a 2-sided level of 0.05 to detect a 10% absolute reduction of mortality in the PC-SV group, based on the potential combination of the effects of lung protective ventilation, minimising risks of major transpulmonary pressure swings and decreased sedation [3, 12–14].
Data are presented as number (%), medians [interquartile range, IQR] or means ± standard deviation according to data distribution. 95% confidence intervals (95% CIs) were calculated for mean differences, median differences, and risk ratios (RR). No imputation technique was used for missing data.
All analyses were carried out as predefined in the protocol. Differences between groups were assessed using t test or Mann–Whitney test for continuous variables and Chi2 test or Fisher exact test for categorical variables. Probabilities of mortality were constructed and differences between the groups were compared using the log-rank test.
All statistical analyses were performed using Stata v13.1 (StataCorp, College Station, TX, USA).
Results
Study population
A total of 2371 patients with inclusion criteria were screened for participation (Fig. 1). Seven hundred patients were included of whom 348 were randomised to the PC-SV strategy and 352 to ACV strategy between February 2013 and October 2018 in 22 French ICUs. One patient assigned to the PC-SV group withdrew his consent prior to protocol initiation. The median number of enrolled patients across the 22 participating sites was 27 [IQR 6–50]. Six hundred and ninety-nine patients completed 60-day follow-up and were included in analyses of all clinical endpoints.
Fig. 1.

Flow of patients in the trial. ACV denotes volume assist-control ventilation strategy and PC-SV pressure-controlled strategy allowing non-synchronized unassisted spontaneous ventilation
Baseline characteristics are presented in Table 1.
Table 1.
Baseline characteristics of the patients in the volume assist-control ventilation strategy and pressure-controlled strategy allowing non-synchronized unassisted spontaneous ventilation
| Characteristic | PC-SV group (N = 347) | ACV group (N = 352) |
|---|---|---|
| Age (years) | 62 ± 14 | 62 ± 15 |
| Female sex | 117 (34) | 101 (29) |
| SAPS II scorea | 50 ± 16 | 48 ± 15 |
| SOFA scoreb | 9.7 ± 3.4 | 9.4 ± 3.5 |
| Time since onset of ARDS (h) | 17.8 ± 15.2 | 17.6 ± 17.1 |
| Tidal volume (mL/kg predicted body weight) | 6.4 ± 0.8 | 6.4 ± 1 |
| Minute ventilation (L/min) | 11.0 ± 2.4 | 11.2 ± 2.5 |
| Respiratory rate (breaths/min) | 27.5 ± 5.3 | 27.3 ± 5 |
| PEEP (cmH2O) | 10.5 ± 4.1 | 10.5 ± 3.9 |
| Plateau pressure (cmH2O) | 23.3 ± 4.6 | 24.0 ± 4.8 |
| Driving pressure (cmH2O)c | 12.8 ± 3.6 | 13.5 ± 4.2 |
| Respiratory-system compliance (mL/cmH2O)d | 34.1 ± 10.8 | 33.3 ± 11.9 |
| PaO2/FiO2 (mmHg) | 136 ± 39 | 132 ± 43 |
| Cause of lung injury (%) | ||
| Pneumonia | 228 (66) | 248 (71) |
| Aspiration | 54 (16) | 49 (14) |
| Intraabdominal sepsis | 10 (3) | 9 (3) |
| Other sepsis | 9 (3) | 10 (3) |
| Acute pancreatitis | 18 (5) | 9 (3) |
| Other | 28 (8) | 26 (7) |
Data are presented as means ± standard deviation or numbers (%)
ACV assist-control ventilation strategy, ARDS acute respiratory distress syndrome, FiO2 fraction of inspired oxygen, PaO2 partial pressure of arterial oxygen tension, PC-SV pressure-controlled strategy allowing non-synchronized unassisted spontaneous ventilation, PEEP positive end-expiratory pressure, SAPS II Simplified Acute Physiologic Score, SOFA Sequential Organ Failure Assessment
aThe SAPS II is used to assess severity of illness and can range from 0 to 163, with higher scores indicating a higher probability of death
bThe SOFA score describes the number and severity of organ dysfunction
cDriving pressure was calculated as plateau pressure minus set PEEP
dRespiratory system compliance was calculated as the tidal volume divided by the driving pressure
Respiratory variables
Respiratory variables at day 1, 3 and 7 are reported in Table 2. Tidal volumes at day 1, 3 and 7 were slightly but significantly higher in PC-SV group than in ACV group. Respiratory rate at day 3 was lower in PC-SV group than in ACV group. PEEP at day 7 was higher in the PC-SV group than in the ACV group. Oxygenation assessed using PaO2/FiO2 ratio was higher at day 1 in PC-SV group than in ACV group but was not different between the two groups at day 3 and 7.
Table 2.
Respiratory variables during the first seven days of treatment in the volume assist-control ventilation strategy and pressure-controlled strategy allowing non-synchronized unassisted spontaneous ventilation
| Variable | Day 1 | Day 3 | Day 7 | |||||||||
|---|---|---|---|---|---|---|---|---|---|---|---|---|
| PC-SV group | ACV group | Absolute difference, (95% CI) | p value | PC-SV group | ACV group | Absolute difference, (95% CI) | p value | PC-SV group | ACV group | Absolute difference, (95% CI) | p value | |
| Measured tidal volume (mL/kg of PBW) | 6.3 ± 0.9 | 6.1 ± 0.6 | 0.1 (0 to 0.2) | 0.04 | 6.8 ± 1.5 | 6.6 ± 1.3 | 0.2 (0 to 0.4) | 0.04 | 7.1 ± 1.8 | 6.7 ± 1.4 | 0.4 (0.1–0.7) | 0.02 |
| Plateau pressure (cmH2O) | 26.5 ± 3.4 | 26.2 ± 3.1 | 0.3 (− 0.3 to 0.8) | 0.33 | 24.6 ± 4.7 | 24.0 ± 4.8 | 0.6 (−0.3 to 1.5) | 0.17 | 23.4 ± 5.6 | 23.4 ± 6.2 | 0.1 (−1.5 to 1.7) | 0.94 |
| Measured respiratory rate (breaths/min) | 28.8 ± 5.3 | 29.4 ± 4.7 | − 0.6 (−1.3 to 0.2) | 0.13 | 26.4 ± 6 | 28.5 ± 5.4 | −2.2 (−3.1 to −1.2) | < 0.01 | 26.3 ± 5.9 | 26.7 ± 6 | −0.4 (−1.8 to 1) | 0.57 |
| Minute ventilation (L/min) | 11.2 ± 2.7 | 11.3 ± 2.7 | − 0.1 (−0.6 to 0.3) | 0.48 | 11.5 ± 3 | 11.6 ± 2.7 | −0.1 (−0.6 to 0.3) | 0.61 | 12.1 ± 3 | 11.7 ± 3.1 | 0.5 (−0.1 to 1) | 0.11 |
| Spontaneous ventilation (L/min) | 0.4 ± 1.8 | – | – | – | 2.1 ± 2.7 | – | – | – | 2.9 ± 3.6 | – | – | – |
| FiO2 | 51 ± 17 | 53 ± 17 | −1 (−4 to 1) | 0.26 | 46 ± 17 | 46 ± 15 | −1 (−3 to 2) | 0.67 | 46 ± 14 | 46 ± 16 | 0 (−3 to 3) | 0.99 |
| Set PEEP (cmH2O) | 13.4 ± 3.3 | 13.9 ± 3.2 | −0.4 (−0.9 to 0.1) | 0.09 | 11.7 ± 4.3 | 11 ± 4.5 | 0.7 (0 to 1.4) | 0.05 | 10.2 ± 4.3 | 8.7 ± 4.3 | 1.5 (0.6 to 2.4) | < .01 |
| PaO2/FiO2 | 215 ± 95 | 200 ± 78 | 15 (0 to 29) | 0.05 | 217 ± 93 | 206 ± 78 | 11 (−4 to 26) | 0.15 | 195 ± 71 | 202 ± 86 | −7 (−24 to 9) | 0.38 |
| PaO2 (mmHg) | 101 ± 37 | 98 ± 32 | 3 (−3 to 9) | 0.29 | 90 ± 28 | 90 ± 32 | 0 (−5 to 6) | 0.85 | 83 ± 21 | 86 ± 33 | −4 (−9 to 2) | 0.18 |
| PaCO2 (mmHg) | 44 ± 10 | 45 ± 10 | −1 (−3 to 1) | 0.19 | 44 ± 13 | 43 ± 12 | 1 (−1 to 3) | 0.42 | 42 ± 10 | 44 ± 12 | −2 (−4 to 0) | 0.07 |
| Arterial pH | 7.33 ± 0.1 | 7.32 ± 0.1 | 0.01 (0 to 0.03) | 0.17 | 7.4 ± 0.09 | 7.4 ± 0.08 | 0 (− 0.01 to 0.01) | 0.85 | 7.44 ± 0.08 | 7.43 ± 0.07 | 0 (−0.01 to 0.02) | 0.61 |
Data are presented as means ± standard deviation of values recorded from 6 a.m. to 12 a.m. on days 1, 3, and 7 after enrollment in patients who were receiving the ventilatory strategy assigned by randomization
ACV assist-control ventilation strategy, FiO2 fraction of inspired oxygen, PaCO2 partial pressure of arterial carbon dioxide, PBW predicted body weight, PaO2 partial pressure of arterial oxygen, PC-SV pressure-controlled strategy allowing non-synchronized unassisted spontaneous ventilation, PEEP positive end-expiratory pressure
The percentage of patients in the PC-SV group who were in the optimal target of spontaneous ventilation (10–50% of total minute ventilation) was around 4% at day 1, 43% at day 3 and 39% at day 7 (ESM 1, Figure S4).
Primary endpoint
The hospital mortality defined as in-hospital death from any cause at 60 days was 34.6% in the patients treated with PC-SV vs 33.5% in those treated with ACV (p = 0.77; RR = 1.03 (95% CI 0.84–1.27), log-rank p = 0.65, Table 3 and Fig. 2).
Table 3.
Main outcome variables in the volume assist-control ventilation strategy and pressure-controlled strategy allowing non-synchronized unassisted spontaneous ventilation
| Outcome | PC-SV group (n = 347) |
ACV group (n = 352) |
Absolute difference (95% CI) |
Relative risk (95% CI) |
p value |
|---|---|---|---|---|---|
| In-hospital death (before day 60) | 120 (34.6) | 118 (33.5) | – | 1.03 (0.84–1.27) | 0.77 |
| Death in the first 28 days | 87 (25.1) | 79 (22.4) | – | 1.12 (0.86–1.46) | 0.41 |
| Number of ventilator-free days at day 28 (days)a | 13 [0–21] | 13 [0–20] | 0 (−4 to 4) | – | 0.75 |
| Number of organ failure-free days at day 28 (days)b | 16 [0–22] | 16 [0–23] | 0 (−3 to 3) | – | 0.63 |
| Number of vasoactive drugs-free days at day 28 (days)c | 24 [0–26] | 24 [12–26] | 0 (−1 to 1) | – | 0.78 |
| Duration of mechanical ventilation (days) | 11.8 ± 8.2 | 12.2 ± 8.3 | −0.4 (−1.6 to 0.9) | – | 0.55 |
| Duration of ICU stay (days) | 17.4 ± 14.7 | 17.7 ± 13.8 | −0.3 (−2.4 to 1.9) | – | 0.82 |
| Total amount of vasoactive drugs received during the first 7 days after inclusion (mg) | 49 [12–148] | 52 [7–149] | 3 (−14 to 20) | – | 0.75 |
| Total amount of fluids received during the first 7 days after inclusion (mL) | 1000 [500–2300] | 1000 [250–2500] | 0 (−300 to 300) | – | 0.72 |
| Refractory hypoxemia during the first 7 daysd | 22 (6.3) | 32 (9.1) | – | 0.7 (0.41–1.18) | 0.17 |
| Use of adjunctive therapy | 114 (33.1) | 144 (41.3) | – | 0.8 (0.66–0.98) | 0.03 |
| Prone position | 99 (28.8) | 132 (37.8) | – | 0.76 (0.61–0.94) | 0.01 |
| Recruitment maneuver | 11 (3.2) | 12 (3.4) | – | 0.93 (0.42–2.08) | 0.86 |
| Inhaled NO | 33 (9.6) | 35 (10) | – | 0.96 (0.61–1.5) | 0.85 |
| ECMO | 7 (2) | 8 (2.3) | – | 0.89 (0.33–2.42) | 0.82 |
| Almitrine bismesylate | 1 (0.3) | 1 (0.3) | – | 1.01 (0.06–16.16) | 1 |
| Pneumothorax between day 1 and day 28 | 16 (4.6) | 16 (4.6) | – | 1.01 (0.52–2) | 0.97 |
Data are presented as number (%), medians [first-third quartile] or means ± standard deviation
ACV assist-control ventilation strategy, ECMO extra-corporeal membrane oxygenation, ICU intensive care unit, NO nitric oxide, PC-SV pressure-controlled strategy allowing non-synchronized unassisted spontaneous ventilation
aThe number of ventilator-free days at day 28 is the number of days between day 1 and day 28 on which patients breathed without assistance
bThe number of organ failure-free days at day 28 is the number of days between day 1 and day 28 on which patients were free of respiratory, cardiovascular, renal, neurological, hepatic, and hematological failure as defined by the SOFA score [24]
cThe number of vasoactive drugs-free days at day 28 is the number of days between day 1 and day 28 on which patients did not receive vasoactive drugs. For ventilator, organ and vasoactive-free days, a value of 0 free day was assigned for patients who died before day 28
dRefractory hypoxemia was defined as a PaO2 lower than 55 mmHg or a SaO2 lower than 88% for more than 30 min despite a FiO2 of 80% or higher
Fig. 2.
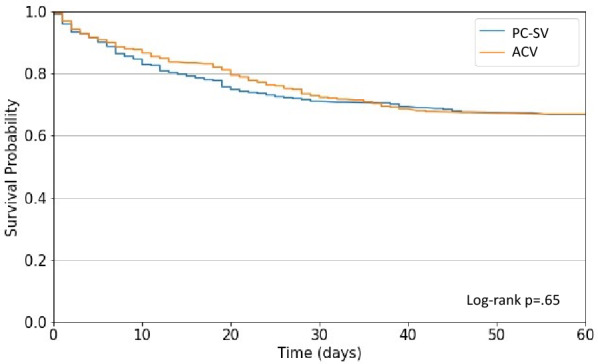
Probabilities of in-hospital death from the day of randomization (day 0) to day 60 in the volume assist-control ventilation strategy (ACV) and pressure-controlled strategy allowing non-synchronized unassisted spontaneous ventilation (PC-SV)
Secondary endpoints
There was no difference between PC-SV and ACV groups in terms of mortality at day 28, numbers of ventilator-free days, organ failure-free days and vasoactive drugs-free days at day 28, and durations of ventilation and ICU stay. The total amounts of vasoactive drugs and fluids received during the first 7 days after inclusion did not differ between the two groups (Table 3).
The incidences of profound and refractory hypoxemia during the first 7 days of treatment were not significantly different between PC-SV and ACV groups (Table 3, and ESM 1, Table S3). The proportion of patients requiring adjuvant treatment for hypoxemia during the first 7 days of treatment was lower in the PC-SV group than in the ACV group. Prone position was less frequently used during the first seven days in the PC-SV group than in the ACV group. Other adjunctive therapies for hypoxemia were used in similar numbers of patients in the two groups (Table 3).
The incidence of pneumothorax did not differ between PC-SV and ACV groups (Table 3).
The total amounts of sedative drugs and NMBA received during the first 7 days after inclusion were lower in the PC-SV group than in the ACV group (ESM 1, Table S4). In line with these results, mean sedation level was lower in the PC-SV group than in the ACV group (ESM 1, Table S5). RASS score expressed as ordinal variable at day one, three and seven are illustrated in ESM 1 Figure S5. The number of days alive without sedation at day 28 did not differ between PC-SV and ACV groups.
Pre-planned subgroup analyses
The hospital mortality rate at day 60 did not differ between PC-SV and ACV groups whatever the different predefined subgroups of patients (i.e., PaO2/FiO2 ≤ or > 100 mmHg; respiratory system compliance < or ≥ 35 mL/cmH2O and radiological score ≤ or > 7) (ESM 1, Table S6).
Discussion
The present randomised clinical trial enrolling a large number of ARDS patients showed that the systematic use of a specific pressure-controlled mode of ventilation (namely PC-SV) which tends to favour spontaneous ventilation while minimising its risks, did not impact mortality and the number of ventilator and organ failure-free days, but reduced the need for sedation compared to the conventional ACV strategy.
During the first week of treatment, incidence of refractory hypoxemia did not differ, but a lower proportion of patients required adjunctive treatments of hypoxemia in the PC-SV group than in the ACV group. In particular, prone position was less frequently used in the PC-SV than in the ACV group. The incidence of pneumothorax during the first 28 days was similar in both groups.
PC-SV strategy
Pressure controlled ventilation is an alternative to ACV, whose physiological effects have been well described [6]. PC-SV mode used in the study has some similarities with the mode usually referred as APRV, which permits to deliver two positive-pressure levels, allowing unrestricted and unsupported spontaneous breathing during any phase of the respiratory cycle (i.e. at the two pressure levels) [7, 15]. PC-SV uses the same working principles as APRV (two pressure levels, no synchronisation) but is adjusted with conventional insufflation time and respiratory rate (contrary to classical APRV set with very short expiratory time) [16]. The difference with classical pressure-assist control is that patients’ efforts cannot trigger assisted breaths. We hypothesised that PC-SV could help to maintain a lung protective ventilation and benefit from the expected effects of non-synchronised non-assisted spontaneous breathing [3–5]. Synchronisation may indeed favour large volumes and distending pressures by adding patient’ effort on top of mandatory insufflation or generate breath-stacking that may be injurious for the lungs [5, 17].
The combination of the PC-SV settings with a dedicated protocol to obtain a SV amounting 10–50% of total minute ventilation, was defined based on a bench and clinical study suggesting its feasibility and safety [4].
The objectives of spontaneous ventilation were defined based on this study showing a maintenance of tidal volume around 6 mL/kg PBW even when spontaneous ventilation reached around 50% of total minute ventilation [4]. In this context, the present study is the first one to assess in a large series of ARDS patients the potential benefit on patients’ outcomes of spontaneous ventilation favoured by a specific mode of ventilation, all other settings being equal.
Discussion
The mortality observed in the present study is consistent with recent randomised clinical trials in ARDS and slightly lower than the largest recent observational LUNG SAFE study [18, 19]. We could not demonstrate that the use of a pressure regulated mode of ventilation at the early phase of ARDS improves outcomes and the significant reduction in deep sedation and NMBA doses along the first week associated with spontaneous ventilation was the only consistent favourable signal in favour of this strategy. The number of ventilator free days was not increased. In addition, the unblinded nature of this pragmatic study could not differentiate between modes of ventilation and the physicians’ behaviour, regarding the reduction of deep sedation observed the first week.
To prevent excessive inspiratory efforts that may lead to high transpulmonary pressure swings, the maximal target for spontaneous ventilation in the PC-SV group was established at 50%. One cannot exclude that more spontaneous ventilation might have revealed more benefits.
Patients enrolled in the experimental group were significantly less turned in the prone position based on the recommendation of using prone position for severe hypoxemia. Although prone position favourably impacts the outcome of patients with severe ARDS, spontaneous ventilation associated with lower sedation score may have dissuaded caregivers to consider it [20]. Alternatively, one cannot exclude that the predefined hypoxemia target to recommend prone position was less frequently reached in patients of the PC-SV group revealing a benefit of this approach on gas exchange. Indeed, well designed physiological studies already suggested that spontaneous ventilation can favour lung recruitment, improve oxygenation, and thus prevent severe hypoxemia.
Limitations
The widespread use of NMBA during the first hours of mechanical ventilation has been driven by the results of the ACURASYS study showing a beneficial impact of paralysis on outcome in the most severe forms of ARDS [21]. These results were not confirmed by the ROSE trial [22] and the systematic use of NMBA at the early phase of severe ARDS is no more systematically recommended [23]. The reduction of NMBA and sedatives treatments observed in the present study could be, at least in part, the consequence of the incitation of the protocol rather than the effects of the mode of ventilation per se. Nevertheless, these findings definitively demonstrate that pressure regulated mode of ventilation may be efficient and safe in these settings. The present study is also limited by its unblinded nature coupled with the use of adjunctive interventions left to the discretion of the attending physician in case of severe hypoxemia. Interestingly, the similar occurrence of profound hypoxemia suggested that the lower incidence of prone position in the PC-SV group likely resulted from the reluctance of healthcare providers to turn patients prone in the experimental group. The PC-SV strategy reduced significantly prone position requirements without impacting mortality, but we can only speculate whether the results could differ with a similar use of prone positioning. Last, the possible lack of experience with PC-SV in France compared to ACV, which was preferentially used in these centres before the study, may also have interfered with the behaviour of caregivers despite the protocolisation of both experimental and control strategies.
Conclusions
In conclusion, a strategy based on a specific pressure-controlled mode of ventilation set to encourage spontaneous ventilation at minimal risks did not significantly reduce mortality compared to conventional ACV with similar tidal volume and PEEP levels but reduced the need for sedation and adjunctive therapies of hypoxemia.
Supplementary Information
Below is the link to the electronic supplementary material.
Acknowledgements
Authors are very grateful to the teams from the different ICU’s who contributed to this study.
Author contributions
JCR, FB, LB and AM in collaboration with all the authors and the REVA Research Network, designed the study and wrote the manuscript. BV wrote the statistical analysis plan. All authors contributed to drafting of the manuscript, revising it critically for important intellectual content, and approved the final version for publication.
Funding
Open access funding provided by Université d'Angers. The study was funded by the “Programme Hospitalier de Recherche Clinique National” from the French Ministry of Health (49RC-09-04-01).
Data sharing statement
No further data are available.
Declaration
Conflict of interest
The authors declare having no potential conflict of interest relevant to the present manuscript.
Footnotes
Publisher's Note
Springer Nature remains neutral with regard to jurisdictional claims in published maps and institutional affiliations.
References
- 1.Dianti J, Fard S, Wong J et al (2022) Strategies for lung- and diaphragm-protective ventilation in acute hypoxemic respiratory failure: a physiological trial. Crit Care Lond Engl 26:259. 10.1186/s13054-022-04123-9 [DOI] [PMC free article] [PubMed] [Google Scholar]
- 2.Dres M, Dubé B-P, Mayaux J et al (2017) Coexistence and impact of limb muscle and diaphragm weakness at time of liberation from mechanical ventilation in medical intensive care unit patients. Am J Respir Crit Care Med 195:57–66. 10.1164/rccm.201602-0367OC [DOI] [PubMed] [Google Scholar]
- 3.Goligher EC, Dres M, Patel BK et al (2020) Lung- and diaphragm-protective ventilation. Am J Respir Crit Care Med 202:950–961. 10.1164/rccm.202003-0655CP [DOI] [PMC free article] [PubMed] [Google Scholar]
- 4.Richard JCM, Lyazidi A, Akoumianaki E et al (2013) Potentially harmful effects of inspiratory synchronization during pressure preset ventilation. Intensive Care Med 39:2003–2010. 10.1007/s00134-013-3032-7 [DOI] [PubMed] [Google Scholar]
- 5.Rittayamai N, Beloncle F, Goligher EC et al (2017) Effect of inspiratory synchronization during pressure-controlled ventilation on lung distension and inspiratory effort. Ann Intensive Care 7:100. 10.1186/s13613-017-0324-z [DOI] [PMC free article] [PubMed] [Google Scholar]
- 6.Rittayamai N, Katsios CM, Beloncle F et al (2015) Pressure-controlled vs volume-controlled ventilation in acute respiratory failure: a physiology-based narrative and systematic review. Chest 148:340–355. 10.1378/chest.14-3169 [DOI] [PubMed] [Google Scholar]
- 7.Putensen C, Zech S, Wrigge H et al (2001) Long-term effects of spontaneous breathing during ventilatory support in patients with acute lung injury. Am J Respir Crit Care Med 164:43–49. 10.1164/ajrccm.164.1.2001078 [DOI] [PubMed] [Google Scholar]
- 8.Chacko B, Peter JV, Tharyan P et al (2015) Pressure-controlled versus volume-controlled ventilation for acute respiratory failure due to acute lung injury (ALI) or acute respiratory distress syndrome (ARDS). Cochrane Database Syst Rev 1:CD008807. 10.1002/14651858.CD008807.pub2 [DOI] [PMC free article] [PubMed] [Google Scholar]
- 9.The ARDS Definition Task Force* (2012) Acute respiratory distress syndrome: the Berlin definition. JAMA 307:2526–2533. 10.1001/jama.2012.5669 [DOI] [PubMed] [Google Scholar]
- 10.Mercat A, Richard J-CM, Vielle B et al (2008) Positive end-expiratory pressure setting in adults with acute lung injury and acute respiratory distress syndrome: a randomized controlled trial. JAMA 299:646–655. 10.1001/jama.299.6.646 [DOI] [PubMed] [Google Scholar]
- 11.Weinberg PF, Matthay MA, Webster RO et al (1984) Biologically active products of complement and acute lung injury in patients with the sepsis syndrome. Am Rev Respir Dis 130:791–796. 10.1164/arrd.1984.130.5.791 [DOI] [PubMed] [Google Scholar]
- 12.Shehabi Y, Bellomo R, Kadiman S et al (2018) Sedation intensity in the first 48 hours of mechanical ventilation and 180-day mortality: a multinational prospective longitudinal cohort study. Crit Care Med 46:850–859. 10.1097/CCM.0000000000003071 [DOI] [PubMed] [Google Scholar]
- 13.Goligher EC, Dres M, Fan E et al (2018) Mechanical ventilation-induced diaphragm atrophy strongly impacts clinical outcomes. Am J Respir Crit Care Med 197:204–213. 10.1164/rccm.201703-0536OC [DOI] [PubMed] [Google Scholar]
- 14.Yoshida T, Torsani V, Gomes S et al (2013) Spontaneous effort causes occult pendelluft during mechanical ventilation. Am J Respir Crit Care Med 188:1420–1427. 10.1164/rccm.201303-0539OC [DOI] [PubMed] [Google Scholar]
- 15.Wrigge H, Zinserling J, Neumann P et al (2005) Spontaneous breathing with airway pressure release ventilation favors ventilation in dependent lung regions and counters cyclic alveolar collapse in oleic-acid-induced lung injury: a randomized controlled computed tomography trial. Crit Care Lond Engl 9:R780-789. 10.1186/cc3908 [DOI] [PMC free article] [PubMed] [Google Scholar]
- 16.Camporota L, Rose L, Andrews PL et al (2024) Airway pressure release ventilation for lung protection in acute respiratory distress syndrome: an alternative way to recruit the lungs. Curr Opin Crit Care 30:76–84. 10.1097/MCC.0000000000001123 [DOI] [PubMed] [Google Scholar]
- 17.Beitler JR, Sands SA, Loring SH et al (2016) Quantifying unintended exposure to high tidal volumes from breath stacking dyssynchrony in ARDS: the BREATHE criteria. Intensive Care Med 42:1427–1436. 10.1007/s00134-016-4423-3 [DOI] [PMC free article] [PubMed] [Google Scholar]
- 18.Bellani G, Laffey JG, Pham T et al (2016) Epidemiology, patterns of care, and mortality for patients with acute respiratory distress syndrome in intensive care units in 50 countries. JAMA 315:788–800. 10.1001/jama.2016.0291 [DOI] [PubMed] [Google Scholar]
- 19.Briel M, Meade M, Mercat A et al (2010) Higher vs lower positive end-expiratory pressure in patients with acute lung injury and acute respiratory distress syndrome: systematic review and meta-analysis. JAMA 303:865–873. 10.1001/jama.2010.218 [DOI] [PubMed] [Google Scholar]
- 20.Guérin C, Reignier J, Richard J-C et al (2013) Prone positioning in severe acute respiratory distress syndrome. N Engl J Med 368:2159–2168. 10.1056/NEJMoa1214103 [DOI] [PubMed] [Google Scholar]
- 21.Papazian L, Forel J-M, Gacouin A et al (2010) Neuromuscular blockers in early acute respiratory distress syndrome. N Engl J Med 363:1107–1116. 10.1056/NEJMoa1005372 [DOI] [PubMed] [Google Scholar]
- 22.Moss M, Ulysse CA, Angus DC, National Heart, Lung, and Blood Institute PETAL Clinical Trials Network (2019) Early neuromuscular blockade in the acute respiratory distress syndrome. Reply N Engl J Med 381:787–788. 10.1056/NEJMc1908874 [DOI] [PubMed] [Google Scholar]
- 23.Grasselli G, Calfee CS, Camporota L et al (2023) ESICM guidelines on acute respiratory distress syndrome: definition, phenotyping and respiratory support strategies. Intensive Care Med 49:727–759. 10.1007/s00134-023-07050-7 [DOI] [PMC free article] [PubMed] [Google Scholar]
- 24.Vincent JL, Moreno R, Takala J et al (1996) The SOFA (Sepsis-related Organ Failure Assessment) score to describe organ dysfunction/failure. On behalf of the working group on sepsis-related problems of the European Society of Intensive Care Medicine. Intensive Care Med 22:707–710 [DOI] [PubMed] [Google Scholar]
Associated Data
This section collects any data citations, data availability statements, or supplementary materials included in this article.
Supplementary Materials
Data Availability Statement
No further data are available.